Figure 1.
Example of potato canopy cover images taken at Wuwei, China on 2 June 2015 before and after processing for obtaining fractional canopy coverage.
Figure 1.
Example of potato canopy cover images taken at Wuwei, China on 2 June 2015 before and after processing for obtaining fractional canopy coverage.
Figure 2.
Schematic diagram of energy transport in a potato field with plastic film mulch (Rnc, Rnm, and Rns are the net radiations absorbed by the plant canopy, the plastic film mulch, and the soil surface, respectively; Hca is the sensible heat flux from the plant canopy to the atmosphere; Hmc is the sensible heat flux from the plastic film mulch to the plant canopy; Csm is the conduction from the soil surface to the plastic film mulch; G is the soil heat flux at the soil surface; λT is the latent heat flux of the plant canopy; λET is the latent heat flux of complete canopy; is the bulk stomatal resistance of the plant canopy; is the bulk boundary layer resistance of the vegetative elements in the plant canopy; is the aerodynamic resistance between the plant canopy and the reference height; is the aerodynamic resistance between the plastic film mulch and the plant canopy; rc is the thermal contact resistance between the plastic mulch and soil).
Figure 3.
Schematic diagram of shortwave radiation transfer in the potato canopy, plastic film mulch, and soil surface (Rs is the global radiation; αsc and αsm are the shortwave absorptances of the plant canopy and plastic film mulch, respectively; ρsm and ρss are the shortwave reflectances of the plastic film mulch and soil, respectively; and τsc and τsm are the shortwave transmittances of the plant canopy and plastic film mulch, respectively).
Figure 4.
Schematic diagram of emitted longwave radiation transfer between the potato canopy, plastic film mulch, and soil surface from: (a) the atmosphere, (b) the potato canopy, (c) the plastic film mulch, and (d) the soil surface (σ is the Stefan-Boltzmann constant; Tsky, Tc, Tm, and Ts are the temperatures of the sky, plant canopy, plastic film mulch, and soil surface, respectively; εsky, εc, εm, and εs are the emissivities (or infrared absorptances) of the sky, plant canopy, plastic film mulch, and soil surface, respectively; ρlm and ρlc are the longwave reflectances of the plastic film mulch and plant canopy, respectively; and τlc and τlm are the longwave transmittances of the plant canopy and plastic film mulch, respectively).
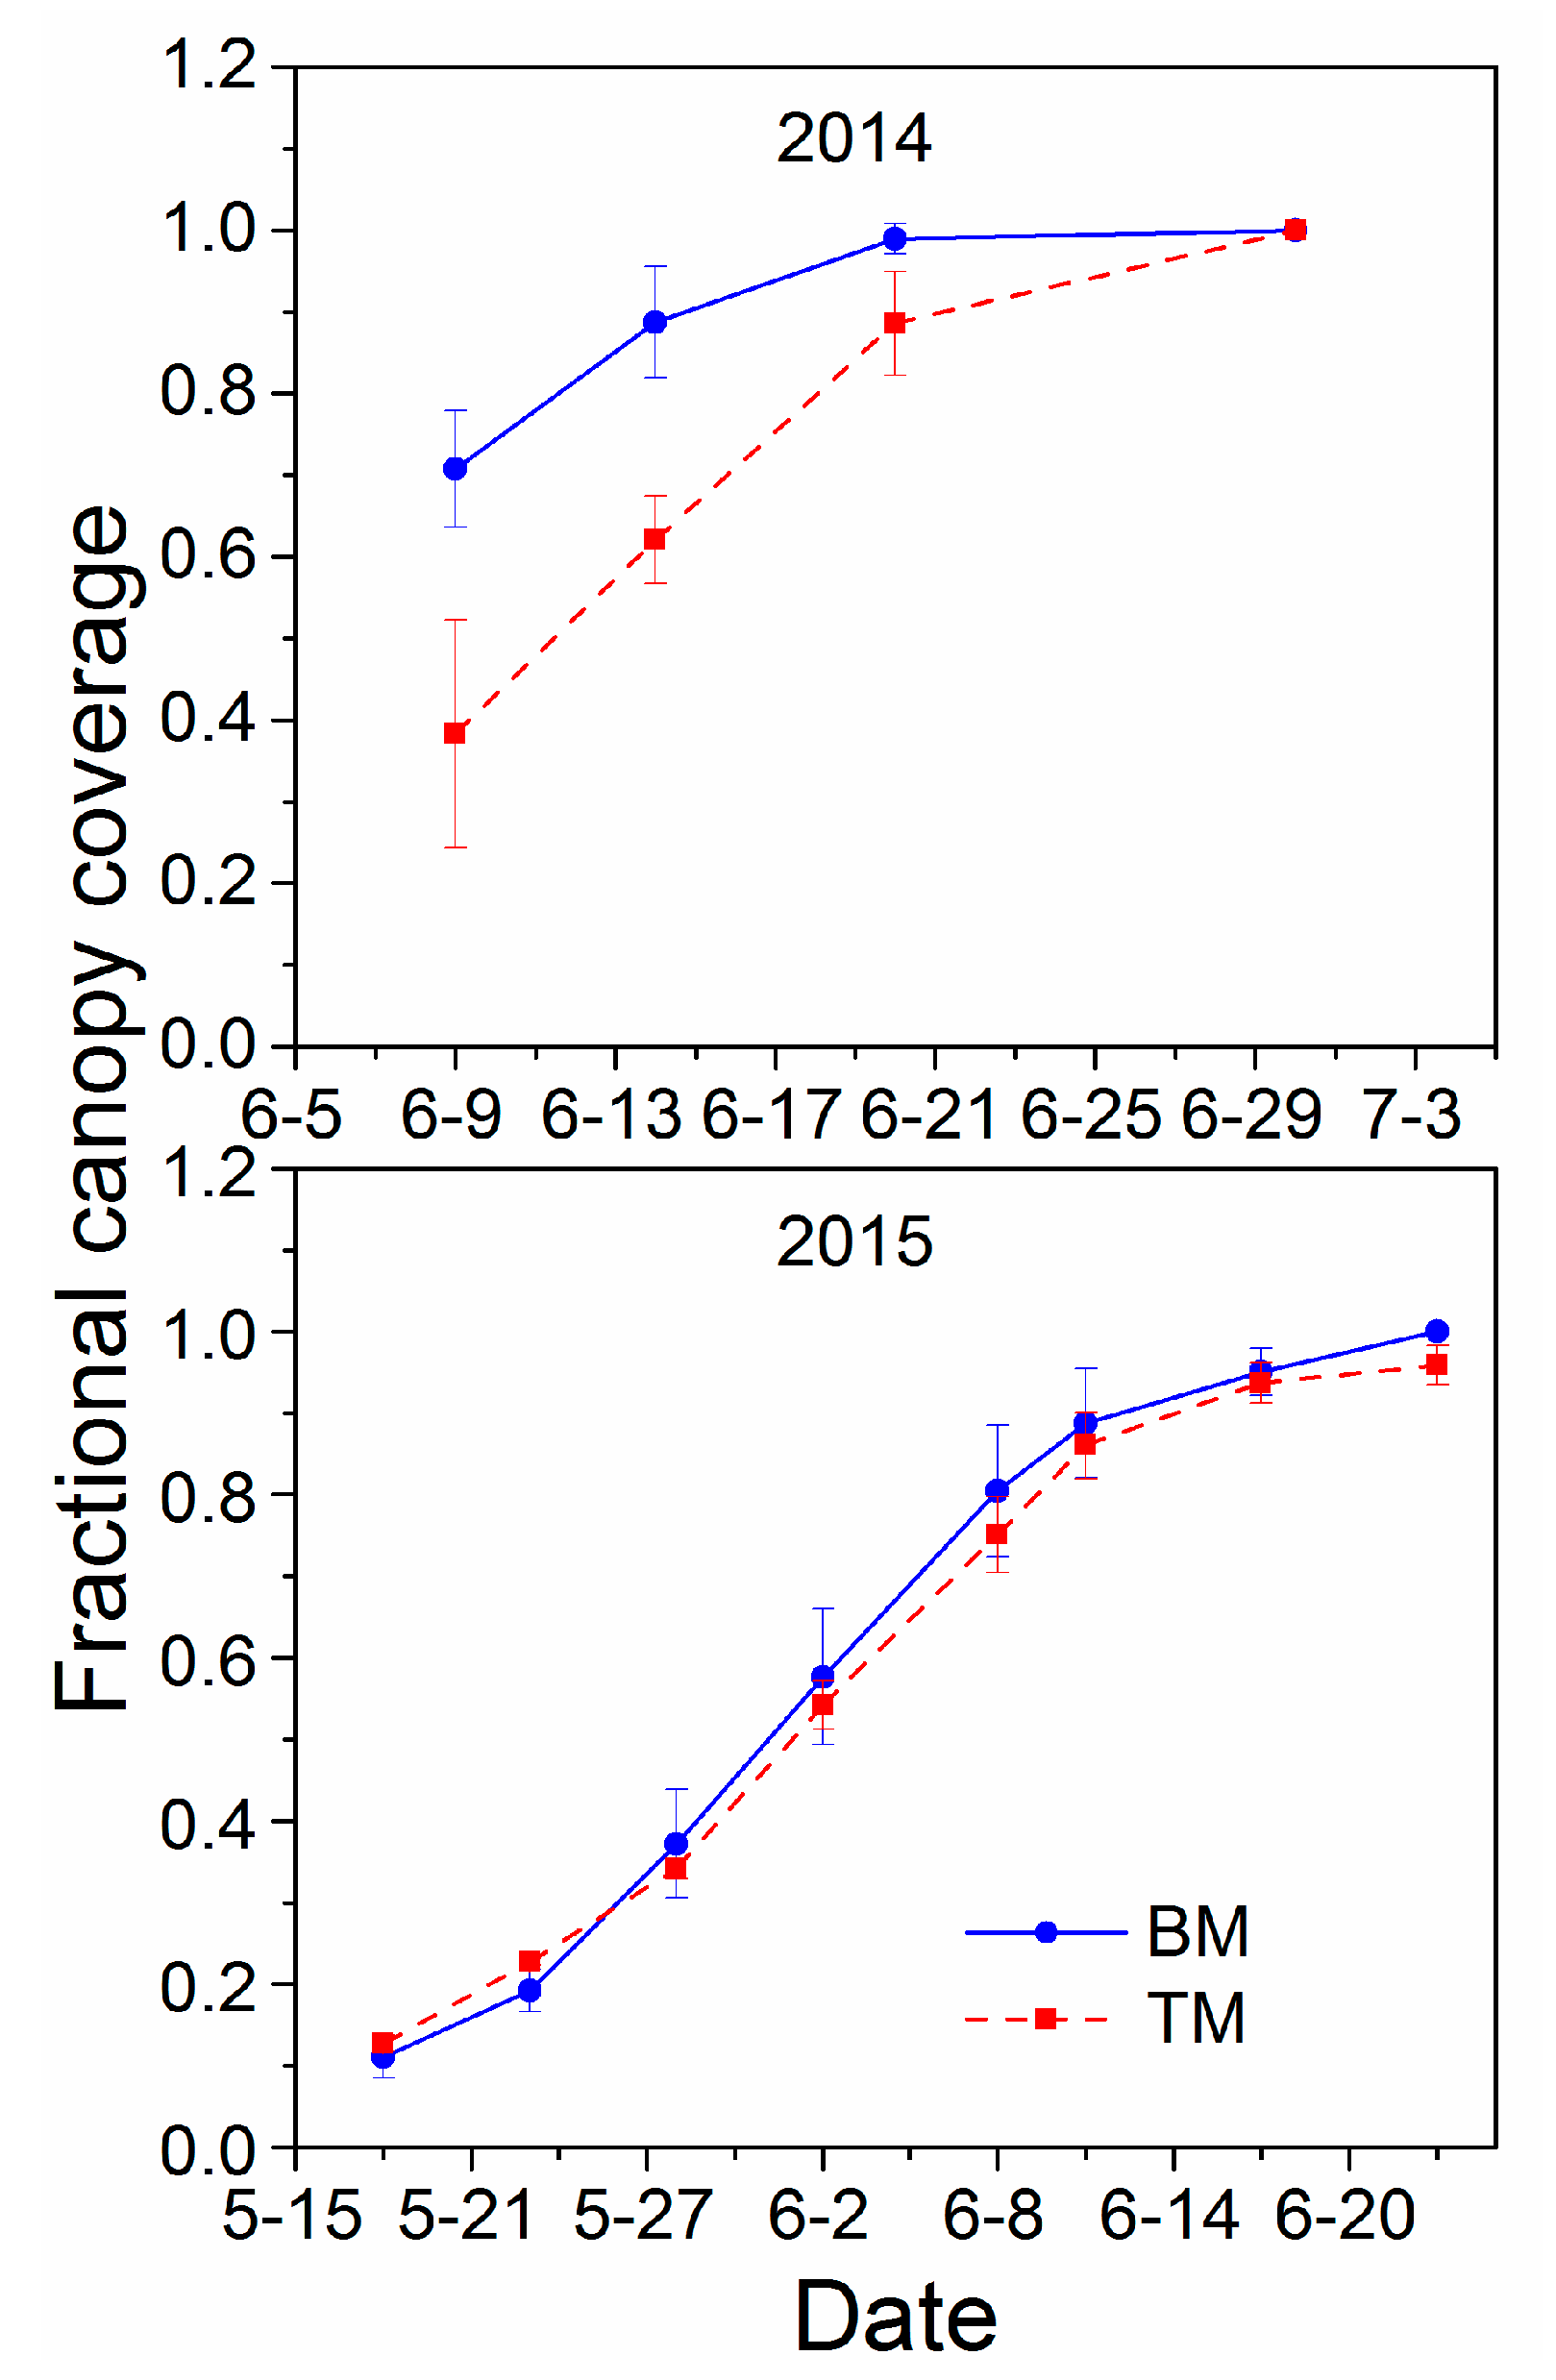
Figure 5.
Fractional canopy coverage by potato grown with transparent plastic film (TM) and black plastic film (BM) treatments at Wuwei, China, in 2014 and 2015.
Figure 5.
Fractional canopy coverage by potato grown with transparent plastic film (TM) and black plastic film (BM) treatments at Wuwei, China, in 2014 and 2015.
Figure 6.
Photosynthetically active radiation transmittance of the transparent plastic film mulch (TM) treatment and black plastic film mulch (BM) treatment for potato production at Wuwei, China, in 2014 and 2015.
Figure 6.
Photosynthetically active radiation transmittance of the transparent plastic film mulch (TM) treatment and black plastic film mulch (BM) treatment for potato production at Wuwei, China, in 2014 and 2015.
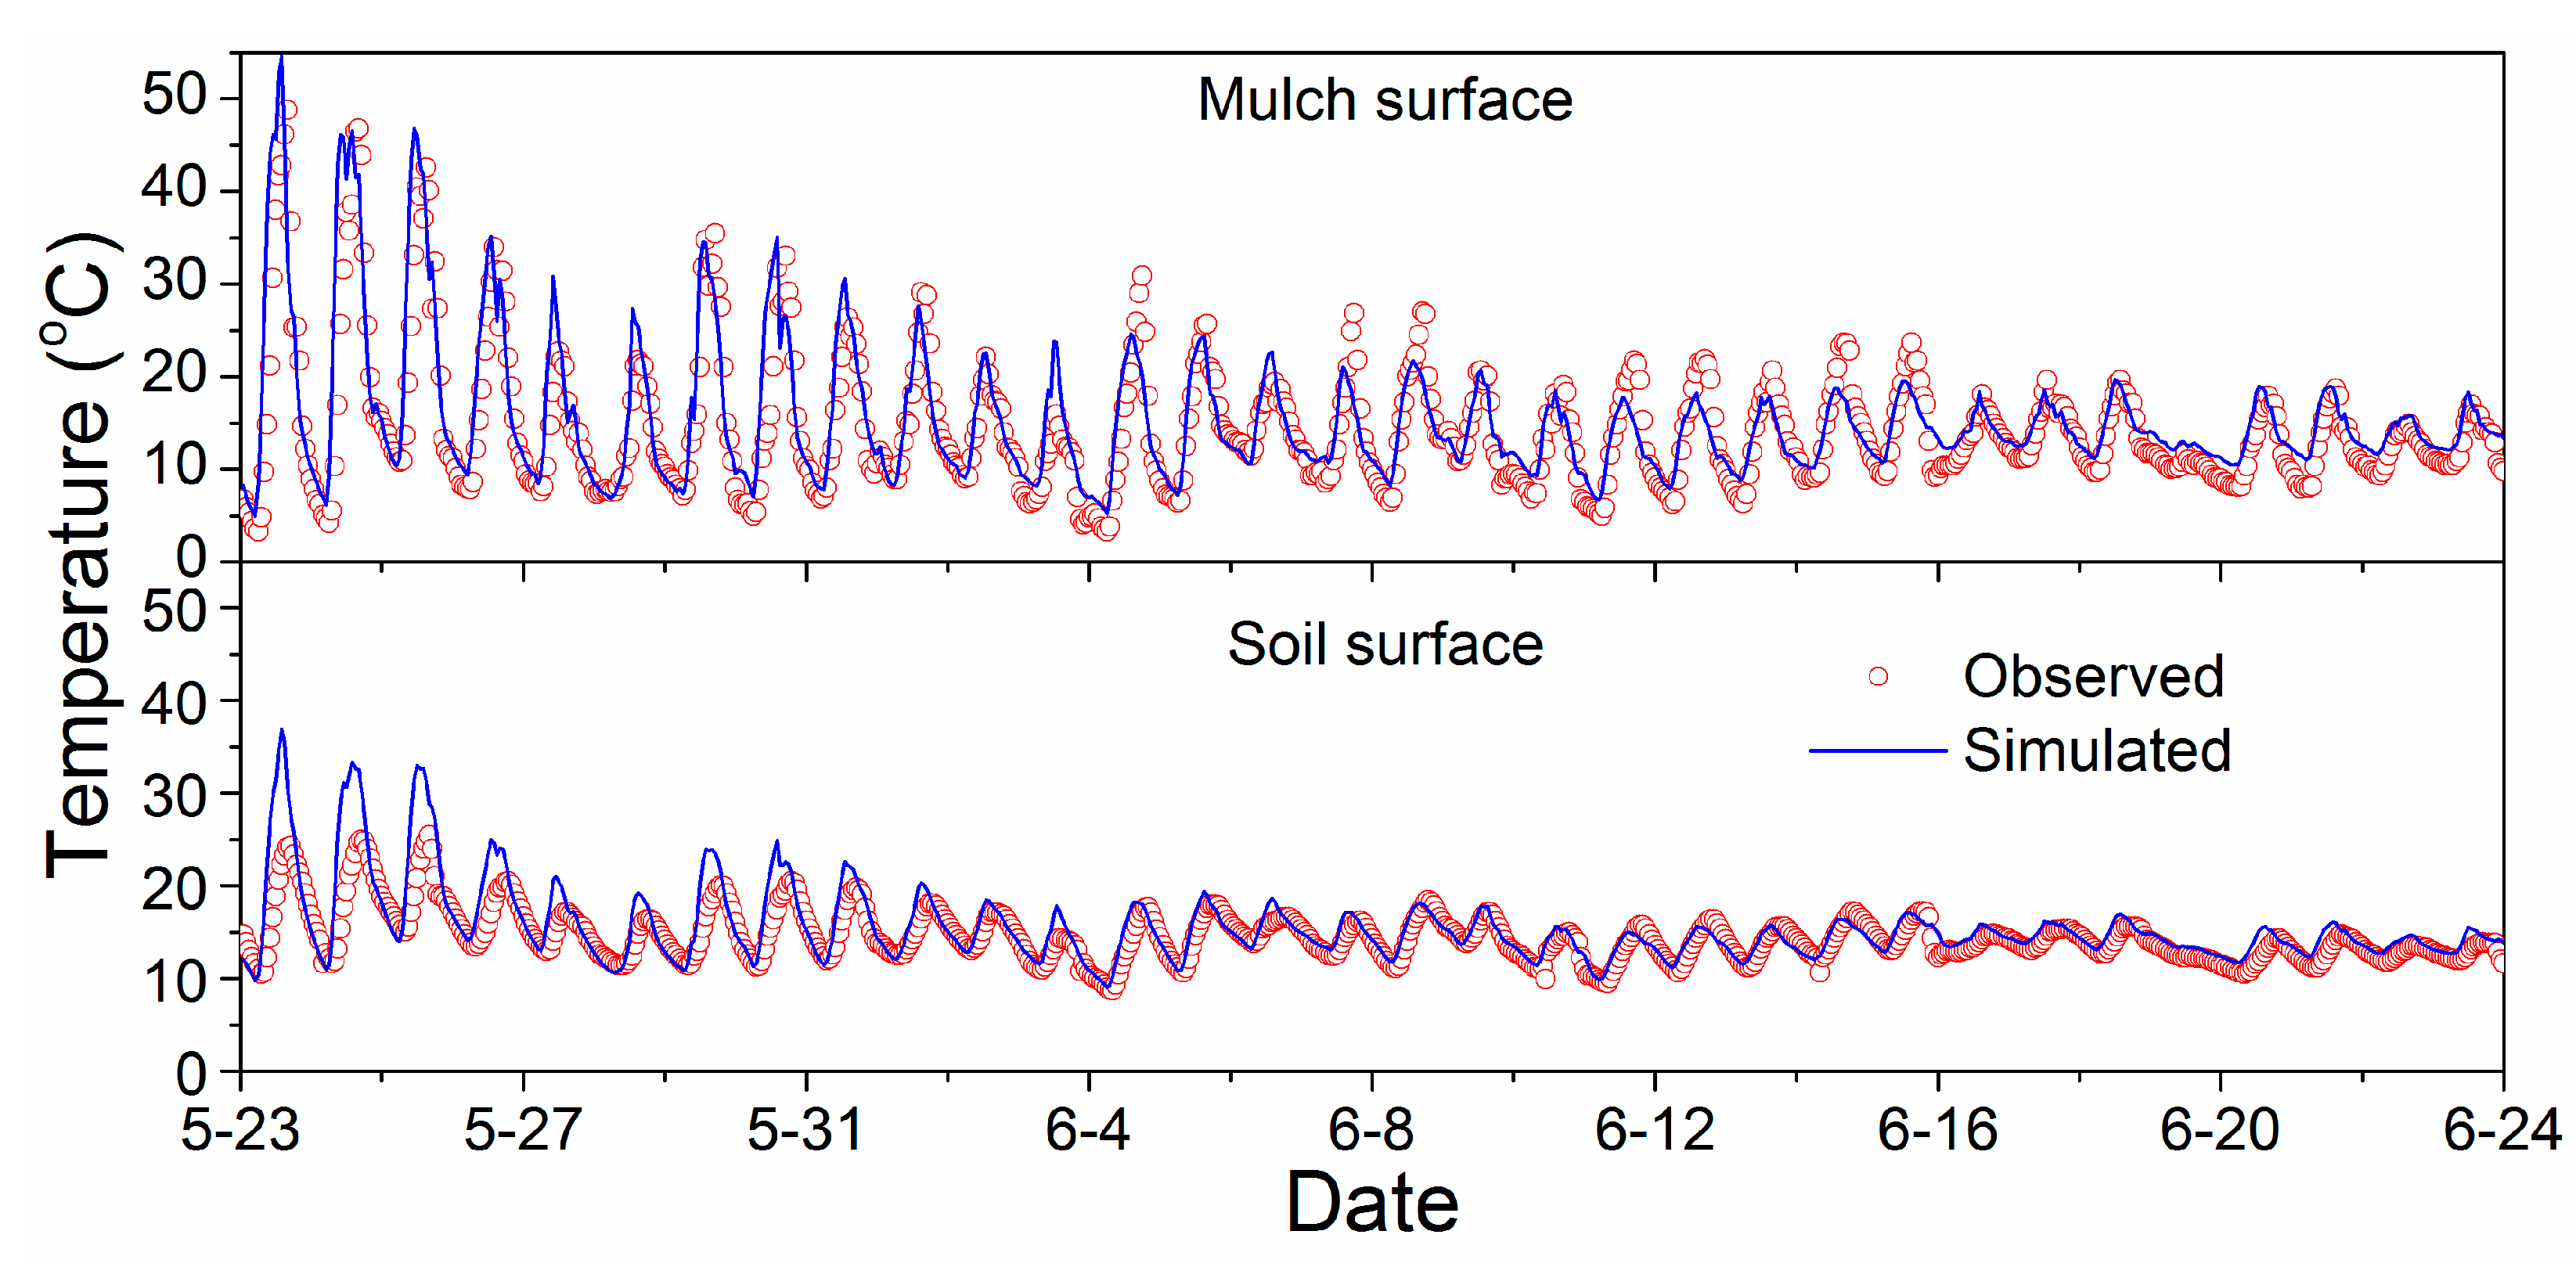
Figure 7.
Comparison of the observed and simulated hourly temperatures on the transparent plastic film mulch (TM) surface and soil surface at Wuwei, China, in 2015.
Figure 7.
Comparison of the observed and simulated hourly temperatures on the transparent plastic film mulch (TM) surface and soil surface at Wuwei, China, in 2015.
Figure 8.
Comparison of the observed and simulated hourly temperature on the black plastic film mulch (BM) surface and soil surface at Wuwei, China, in 2015.
Figure 8.
Comparison of the observed and simulated hourly temperature on the black plastic film mulch (BM) surface and soil surface at Wuwei, China, in 2015.
Figure 9.
Comparison of the observed and simulated hourly net radiation of the transparent plastic film mulch (TM) treatment and black plastic film mulch (BM) treatment at Wuwei, China, in 2015.
Figure 9.
Comparison of the observed and simulated hourly net radiation of the transparent plastic film mulch (TM) treatment and black plastic film mulch (BM) treatment at Wuwei, China, in 2015.
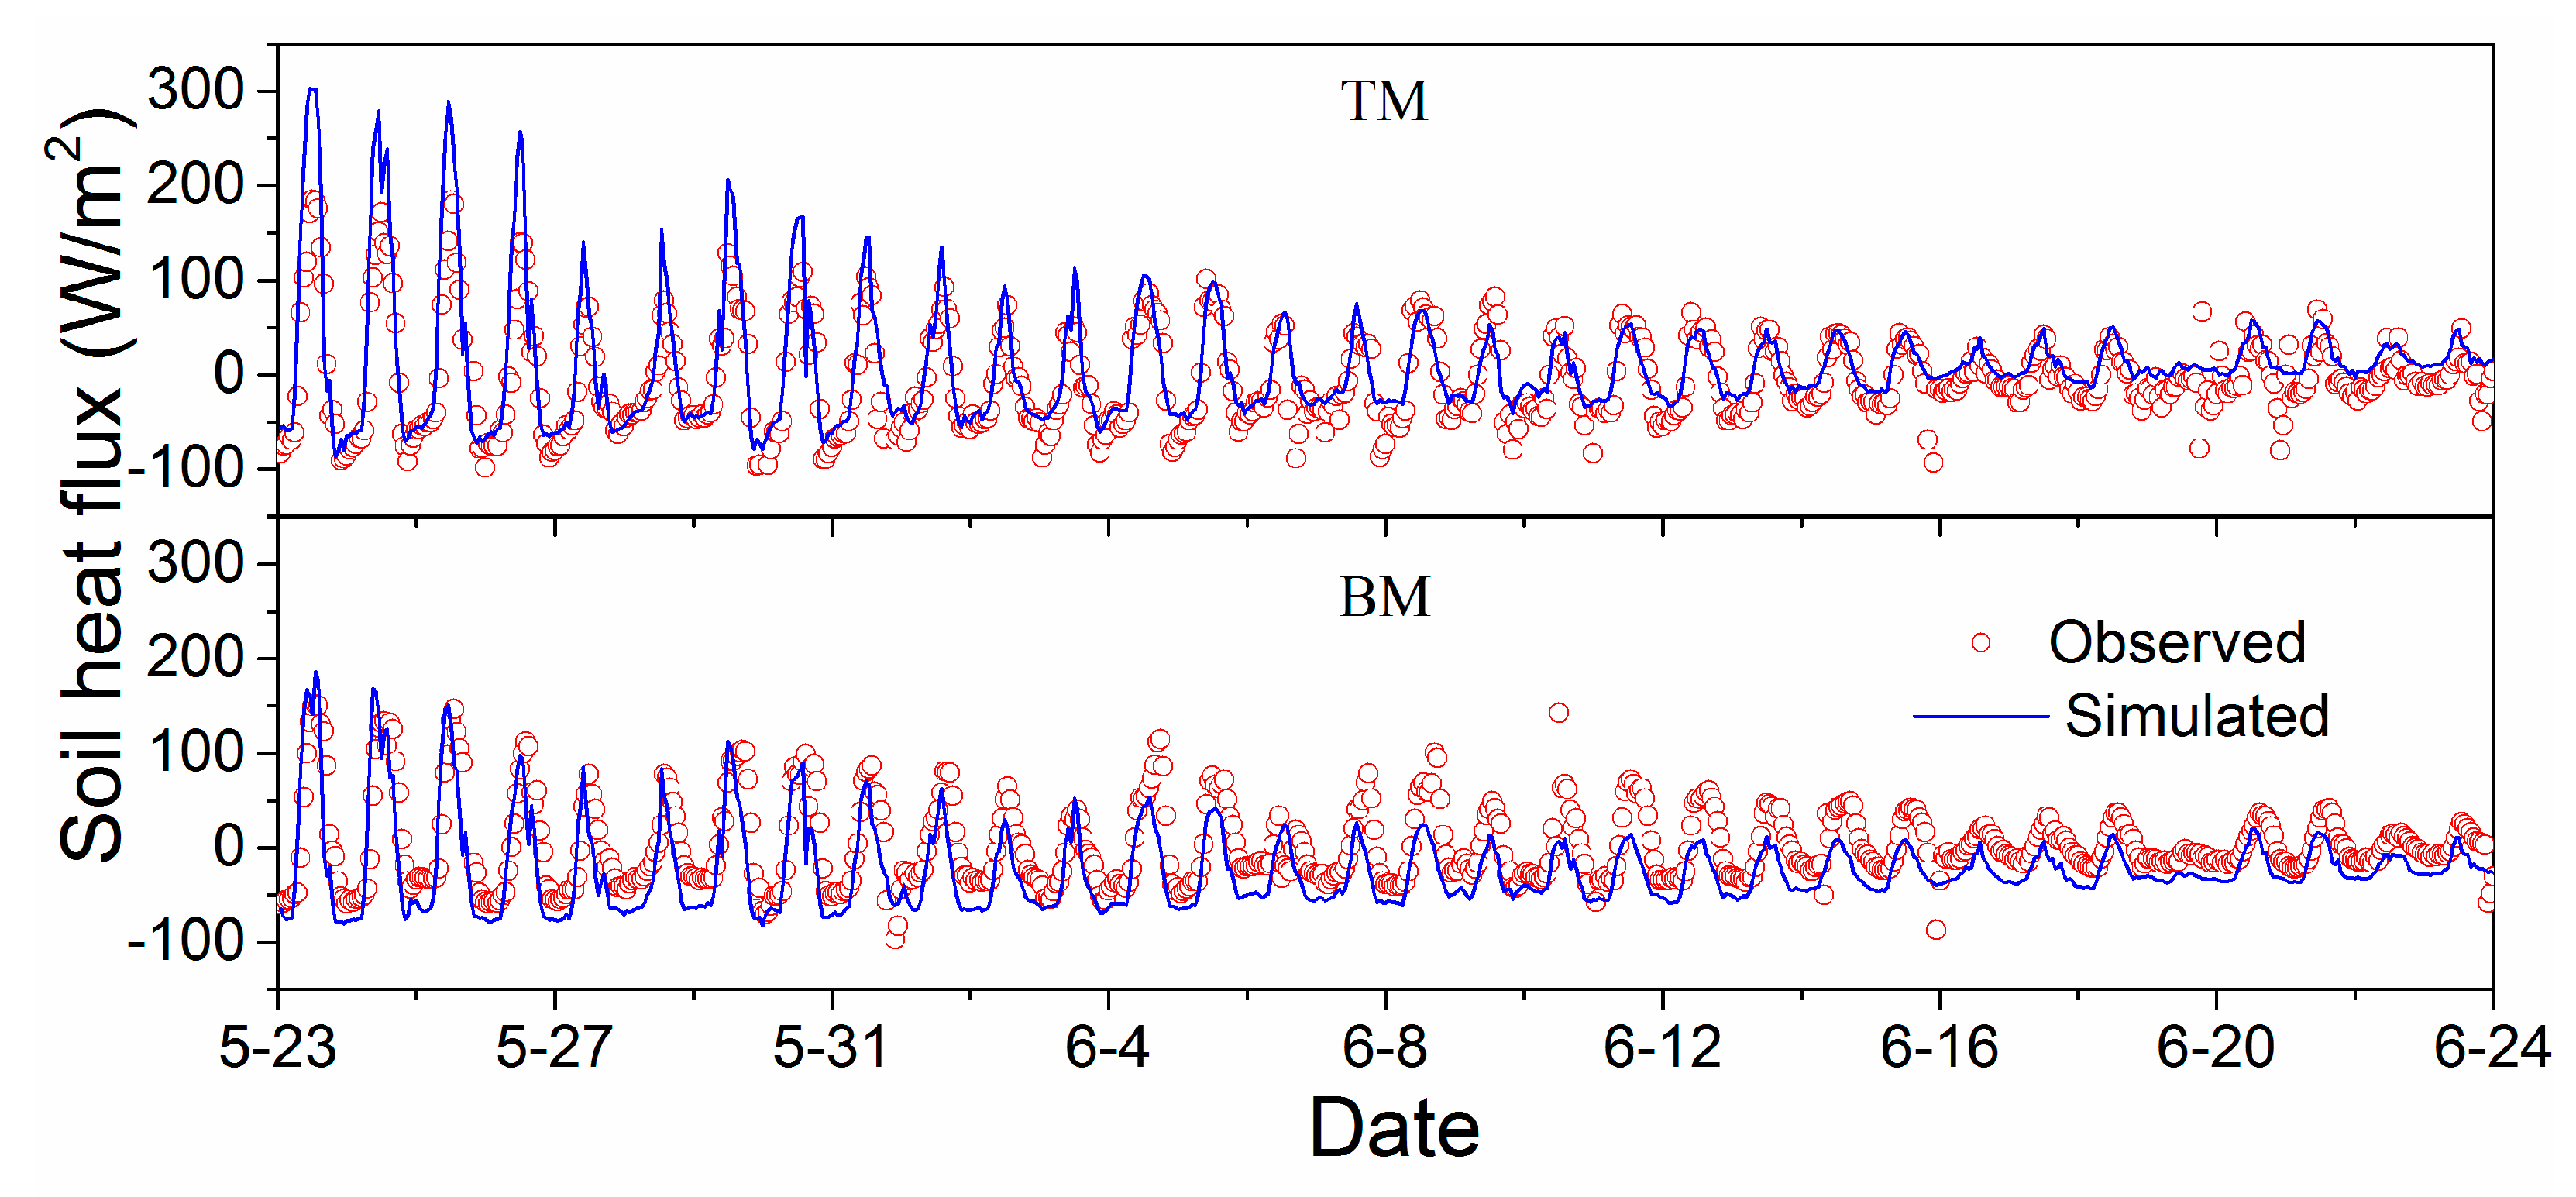
Figure 10.
Comparison of the observed and simulated hourly soil heat flux of the transparent plastic film mulch (TM) treatment and black plastic film mulch (BM) treatment at Wuwei, China, in 2015.
Figure 10.
Comparison of the observed and simulated hourly soil heat flux of the transparent plastic film mulch (TM) treatment and black plastic film mulch (BM) treatment at Wuwei, China, in 2015.
Figure 11.
Simulated hourly canopy temperature of potato plants grown with transparent plastic film mulch (TM) and black plastic film mulch (BM) at Wuwei, China, in 2015.
Figure 11.
Simulated hourly canopy temperature of potato plants grown with transparent plastic film mulch (TM) and black plastic film mulch (BM) at Wuwei, China, in 2015.
Table 1.
Input parameters for the net radiation calculation using in modeling the interaction of plastic film mulch and potato canopy growth on soil heat transport.
Table 1.
Input parameters for the net radiation calculation using in modeling the interaction of plastic film mulch and potato canopy growth on soil heat transport.
| Symbol | Description | Value | Source |
|---|
| Canopy | | | |
| Pcc | Canopy coverage | Measured in the field | Digital camera |
| Rs | Global radiation | Measured in the field | Meteorological station |
| αsc | Shortwave absorptance of plant canopy | Calculated | |
| εc | Emissivity (or infrared absorptance) of plant canopy | Calculated | |
| ρlc | Longwave reflectance of plant canopy | 0.01 | Tarara [27] |
| ρsc | Shortwave reflectance of plant canopy | Calculated | |
| τlc | Longwave transmittance of plant canopy | Calculated | |
| τsc | Shortwave transmittance of plant canopy | Measured in the field | Sunscan |
| Plastic film mulch | | |
| αsm | Shortwave absorptance of transparent plastic film mulch | 0.01~0.1 * | Tarara [27] |
| | Shortwave absorptance of black plastic film mulch | 0.8~0.98 * | Tarara [27] |
| εm | Emissivity (or infrared absorptance) of transparent plastic film mulch | 0.05~0.97 * | Tarara [27] |
| | Emissivity (or infrared absorptance) of black plastic film mulch | 0.8~0.98 * | Tarara [27] |
| ρlm | Longwave reflectance of transparent plastic film mulch | 0.13 | Tarara [27] |
| | Longwave reflectance of black plastic film mulch | 0.01 | Tarara [27] |
| ρsm | Shortwave reflectance of transparent plastic film mulch | Calculated | Tarara [27] |
| | Shortwave reflectance of black plastic film mulch | Calculated | Tarara [27] |
| τlm | Longwave transmittance of transparent plastic film mulch | 0.7~0.9 * | Tarara [27] |
| | Longwave transmittance of black plastic film mulch | 0.1~0.67 * | Tarara [27] |
| τsm | Shortwave transmittance of transparent plastic film mulch | 0.8~0.98 * | Tarara [27] |
| | Shortwave transmittance of black plastic film mulch | 0.01~0.1 * | Tarara [27] |
| Soil | | | |
| εs | Emissivity (or infrared absorptance) of soil surface | 0.78~0.98 * | Tarara [27] |
| ρss | Shortwave reflectance of soil | 0.15~0.3 * | Tarara [27] |
Table 2.
Input parameters for the latent heat flux, sensible heat flux, soil heat flux, and heat conduction calculations using in modeling the interaction of plastic film mulch and potato canopy growth on soil heat transport.
Table 2.
Input parameters for the latent heat flux, sensible heat flux, soil heat flux, and heat conduction calculations using in modeling the interaction of plastic film mulch and potato canopy growth on soil heat transport.
| Symbol | Description | Value | Units | Source |
|---|
| Latent heat flux | | | |
| P | Actual atmospheric pressure | Measured in the field | kPa | Meteorological station |
| RHmax | Maximum relative humidity | Measured in the field | % | Meteorological station |
| RHmin | Minimum relative humidity | Measured in the field | % | Meteorological station |
| Ta | Air temperature | Measured in the field | °C | Meteorological station |
| Tmax | Maximum air temperature | Measured in the field | °C | Meteorological station |
| Tmin | Minimum air temperature | Measured in the field | °C | Meteorological station |
| Tpar | Photosynthetically active radiation transmittance | Measured in the field | - | Sunscan |
| rb | Mean boundary layer resistance | 10~50 * | s/m | Shuttleworth and Wallace [43] |
| rST | Mean stomatal resistance | 60~240 * | s/m | Shuttleworth and Wallace [43] |
| ρ0 | Air density at 0 oC and 0.1013 Mpa | 1.29 | kg/m3 | Allen et al. [50] |
| Sensible heat flux | | | |
| hp | Plant height | Measured in the field | m | Steel tape |
| hr | Reference height | 2 | m | Shuttleworth and Wallace [43] |
| k | Von Kármán’s constant | 0.41 | - | Shuttleworth and Wallace [43] |
| n | Eddy diffusivity decay constant | 2.5 | - | Shuttleworth and Wallace [43] |
| u | Wind speed at the reference height | Measured in the field | m/s | Meteorological station |
| z0′ | Roughness height | 0.01 | m | Shuttleworth and Wallace [43] |
| Soil heat flux | | | |
| b1 | Empirical parameter | 0.243 | W/(m °C) | Chung and Horton [46] |
| b2 | Empirical parameter | 0.393 | W/(m °C) | Chung and Horton [46] |
| b3 | Empirical parameter | 1.534 | W/(m °C) | Chung and Horton [46] |
| Tl | Soil temperature at Δz depth | Measured in the field | °C | Sensors |
| Δt | Time step increment | 3600 | s | Set in field experiments |
| Δz | Distance between the soil surface and the first vertical node | 0.1 | m | Set in field experiments |
| θ | Volumetric soil water content at Δz depth | Measured in the field | m3/m3 | Sensors |
| θn | Solid phase content at Δz depth | 0.66 | - | Set in field experiments |
| θo | Organic matter content at Δz depth | 0 | - | Set in field experiments |
| Heat conduction | | | |
| ka | Air thermal conductivity | 0.025 | W/(m °C) | Campbell and Norman ([48] |
| Nud | Nusselt number reflecting regime of conduction | 1 | - | Ham and Kluitenberg [6] |
| zg | Distance between the plastic film mulch and soil | 0.001~0.01 * | m | Ham and Kluitenberg [6] |
Table 3.
The model parameters (shortwave transmittance τsm, shortwave absorptance αsm, emissivity εm, and longwave transmittance τlm of the plastic film mulch; emissivity εs and shortwave reflectance ρss of soil; mean stomatal resistance rST, mean boundary layer resistance rb; and distance between the plastic film mulch and soil zg) calibrated with hourly temperature, net radiation, and soil heat flux measured for the transparent plastic film mulch (TM) and black plastic film mulch (BM) in the potato field at Wuwei, China in 2014.
| Treatment | τsm | αsm | εm | τlm | εs | ρss | rST (s/m) | rb (s/m) | zg (m) |
|---|
| TM | 0.93 | 0.05 | 0.38 | 0.72 | 0.86 | 0.17 | 90 | 35 | 0.004 |
| BM | 0.03 | 0.93 | 0.82 | 0.11 | 0.86 | 0.17 | 90 | 35 | 0.004 |
Table 4.
The root mean square errors (RMSE), coefficient of determination (R2), and mean errors (ME) in simulated and observed hourly temperatures on the mulch surface and soil surface for transparent plastic film mulch and black plastic film mulch treatments at Wuwei, China.
Table 4.
The root mean square errors (RMSE), coefficient of determination (R2), and mean errors (ME) in simulated and observed hourly temperatures on the mulch surface and soil surface for transparent plastic film mulch and black plastic film mulch treatments at Wuwei, China.
| Season | Parameters | Transparent Plastic Film Mulch | Black Plastic Film Mulch |
|---|
| Mulch Surface | Soil Surface | Mulch Surface | Soil Surface |
|---|
| 2014 | RMSE (°C) | 3.5 | 2.5 | 4.4 | 3.8 |
| R2 | 0.80 | 0.79 | 0.84 | 0.82 |
| ME (°C) | 2.2 | −0.9 | 4.0 | 3.6 |
| 2015 | RMSE (°C) | 3.8 | 3.5 | 4.1 | 2.7 |
| R2 | 0.82 | 0.79 | 0.73 | 0.65 |
| ME (°C) | 2.2 | −2.2 | −1.1 | −1.1 |
Table 5.
The root mean square errors (RMSE) and coefficient of determination (R2) in simulated and observed daily temperatures (on mulch surface and soil surface) for the transparent plastic film mulch and black plastic film mulch treatments at Wuwei, China.
Table 5.
The root mean square errors (RMSE) and coefficient of determination (R2) in simulated and observed daily temperatures (on mulch surface and soil surface) for the transparent plastic film mulch and black plastic film mulch treatments at Wuwei, China.
| Season | Parameters | Transparent Plastic Film Mulch | Black Plastic Film Mulch |
|---|
| Mulch Surface | Soil Surface | Mulch Surface | Soil Surface |
|---|
| 2014 | RMSE (°C) | 2.4 | 1.4 | 4.2 | 3.7 |
| R2 | 0.83 | 0.84 | 0.76 | 0.86 |
| 2015 | RMSE (°C) | 2.6 | 2.8 | 1.7 | 1.5 |
| R2 | 0.78 | 0.83 | 0.87 | 0.91 |
Table 6.
The root mean square errors (RMSE), coefficient of determination (R2), and mean errors (ME) in simulated and observed hourly net radiation and soil heat flux for the transparent plastic film mulch and black plastic film mulch treatments at Wuwei, China.
Table 6.
The root mean square errors (RMSE), coefficient of determination (R2), and mean errors (ME) in simulated and observed hourly net radiation and soil heat flux for the transparent plastic film mulch and black plastic film mulch treatments at Wuwei, China.
| Season | Parameters | Transparent Plastic Film Mulch | Black Plastic Film Mulch |
|---|
| Net Radiation | Soil Heat Flux | Net Radiation | Soil Heat Flux |
|---|
| 2014 | RMSE (W/m2) | 66.47 | 28.73 | 64.93 | 23.47 |
| R2 | 0.98 | 0.89 | 0.97 | 0.67 |
| ME (W/m2) | 20.84 | −11.30 | 36.14 | 20.22 |
| 2015 | RMSE (W/m2) | 71.84 | 42.83 | 83.83 | 39.67 |
| R2 | 0.92 | 0.63 | 0.92 | 0.56 |
| ME (W/m2) | 12.96 | −18.43 | 20.12 | 23.35 |
Table 7.
The root mean square errors (RMSE) and coefficient of determination (R2) in simulated and observed daily net radiation and soil heat flux for the transparent plastic film mulch and black plastic film mulch treatments at Wuwei, China.
Table 7.
The root mean square errors (RMSE) and coefficient of determination (R2) in simulated and observed daily net radiation and soil heat flux for the transparent plastic film mulch and black plastic film mulch treatments at Wuwei, China.
| Season | Parameters | Transparent Plastic Film Mulch | Black Plastic Film Mulch |
|---|
| Net Radiation | Soil Heat Flux | Net Radiation | Soil Heat Flux |
|---|
| 2014 | RMSE (W/m2) | 26.57 | 17.03 | 41.13 | 20.63 |
| R2 | 0.92 | 0.52 | 0.96 | 0.62 |
| | | | | | |
| 2015 | RMSE (W/m2) | 20.30 | 23.42 | 32.79 | 25.27 |
| R2 | 0.89 | 0.23 | 0.93 | 0.36 |


