Article

Ca2+/Na+ Ratio as a Critical Marker for Field Evaluation of Saline-Alkaline Tolerance in Alfalfa (Medicago sativa L.)

1
Northeast Institute of Geography and Agroecology, Chinese Academy of Sciences, Changchun 130102, China
2
University of Chinese Academy of Sciences, Beijing 100049, China
3
Da’an Sodic Land Experiment Station, Da’an 131317, China
4
Institute of Agrobiological Sciences, NARO, Kannondai 2–1–2, Tsukuba 305-8642, Japan
5
Key Laboratory of Mollisols Agroecology, Chinese Academy of Sciences, Changchun 130102, China
*
Authors to whom correspondence should be addressed.
Agronomy 2020, 10(2), 191; https://doi.org/10.3390/agronomy10020191
Submission received: 9 January 2020 / Revised: 24 January 2020 / Accepted: 28 January 2020 / Published: 31 January 2020

Abstract

:
Current indices of saline-alkaline (SA) tolerance are mainly based on the traditional growth and physiological indices for salinity tolerance and likely affect the accuracy of alfalfa tolerance predictions. We determined whether the inclusion of soil alkalinity-affected indices, particularly Ca2+, Mg2+, and their ratios to Na+ in plants, based on the traditional method could improve the prediction accuracy of SA tolerance in alfalfa, determine important indices for SA tolerance, and identify suitable alfalfa cultivars in alkaline salt-affected soils. Fifty alfalfa cultivars were evaluated for their SA tolerance under SA and non-SA field conditions. The SA-tolerance coefficient (SATC) for each investigated index of the alfalfa shoot was calculated as the ratio of SA to non-SA field conditions, and the contribution of SATC under different growth and physiological indices to SA tolerance was quantified based on the inclusion/exclusion of special alkalinity-affected indices. The traditional method, excluding the special alkalinity-affected indices, explained nearly all of the variation in alfalfa SA tolerance, and the most important predictor was the SATC of stem length. The new method, which included these special alkalinity-affected indices, had similar explanatory power but instead identified the SATC of shoot Ca2+/Na+ ratio, followed by that of stem length, as key markers for the field evaluation of SA tolerance. Ca2+, Mg2+, and their ratios to Na+ hold promise for enhancing the robustness of SA-tolerance predictions in alfalfa. These results encourage further investigation into the involvement of Ca2+ in such predictions in other plant species and soil types under more alkaline salt-affected conditions.

1. Introduction

Globally, it is estimated that ca. 955 × 106 ha of land suffers from salinity and sodicity (alkalinity) [1,2] with 60% of salt-affected soils primarily categorized as sodic/saline soils [3]. As one of China’s five largest salt-affected soil regions, the Songnen Plain encompasses 3.42 × 10⁶ ha of salt-affected soils characterized mainly by NaHCO3 and Na2CO3 salts [4,5]. Such alkaline salt-affected soils often exhibit unique structural problems as a result of certain physical processes (slaking, swelling, and dispersion of clay) and specific conditions (i.e., surface crusting and hardsetting) due to the occurrence of excess sodium (Na+) levels [3,6,7]. Further, osmotic and ion-specific effects, as well as imbalances in cation nutrition, usually occur, which may range from deficiencies in several nutrients to high Na+ levels [3,6,8]. Recent research suggests that various interventions can alleviate saline–alkaline (SA) stress, including phytoremediation, hydraulic engineering, and ameliorant application [2,9,10,11,12,13].
Given the growing demand for food, animal feed, and fiber to accommodate an expanding human population with limited new productive land, it will become necessary to utilize salt-affected lands [14,15]. As one of the most vital perennial legume forages cultivated worldwide, alfalfa (Medicago sativa L.) is a prominent feature of salt-affected lands, such as saline soil [16], mainly because of its good nutritional forage quality for livestock husbandry and its ability to fix nitrogen; however, it is considered moderately sensitive to salinity stress and alkalinity stress [17] Different from saline soils, where the focus is on ionic osmotic stress due to high salinity [18,19,20,21,22], alfalfa grown in such SA conditions often experiences alkaline stress, which inhibits plant growth and reduces yield [23,24]. Alfalfa is commonly at risk of ion toxicity, osmotic stress, and even high pH stress [25,26]. Therefore, it is essential to identify suitable alfalfa cultivars to effectively use salt-affected lands.
To accomplish this objective, a crucial prerequisite is distinguishing the most informative indices for the salt tolerance of alfalfa [27,28]. Traditionally, the methods for identifying these important indices for plant SA tolerance are often derived from salinity tolerance [29,30] (Table S1) [17,19,20,23,24,25,28,31,32,33,34,35,36,37,38,39,40,41,42,43,44,45,46,47,48,49,50,51,52,53,54]. This is especially true for NaCl tolerance, in which the underlying mechanism for the maintenance of adequate K+ in plant tissues under salt stress seems to depend upon selective K+ uptake and selective cellular K+ and Na+ compartmentation and distribution in the shoots [21,27,55]. Consequently, the conventional indices for SA tolerance in alfalfa, including its main growth indices such as dry biomass [17], root parameters [17,31,32], and relative growth rate [23] at the temporal scale of both days and weeks under controlled solutions and soil conditions as well as its major physiological indices, such as photosynthesis components [23], antioxidant enzyme activity and malondialdehyde (MDA) [31], proline [17,31], soluble sugar [31], soluble protein [31], and cation content [23,24,31,32,33], are often relied upon to express SA tolerance under controlled laboratory conditions. Recent reports have illustrated that important indices for conveying saline tolerance or SA tolerance can be identified by quantifying the relationships between plant physiological indices and biomass [28,30,56], or between some physiological indices and comprehensive D-values based on statistical tools, such as linear regression analysis [57]. Notably, the relative values of the investigated parameters under stressed conditions and nonstressed conditions have been emphasized due to their ability to better reflect the salt tolerance of plants by eliminating the inherent differences among cultivars [29,57].
Interestingly, increased Na+, Ca2+, and Mg2+ accumulation in plant roots and an altered Ca2+ and Mg2+ balance in entire alfalfa plants were observed under controlled alkaline solution conditions, indicating the critical roles of plant Na+, Ca2+, and Mg2+ in conveying SA tolerance in alfalfa under alkaline salt-affected conditions [24]. Additionally, a high soil pH environment can cause soil Ca2+ and Mg2+ to precipitate (CaCO3 and MgCO3), leaving fewer ions available for plant uptake [7,58]. Similarly, a high pH environment outside the roots can lead to greater absorption of Na+, thus competing with the uptake of other nutrient cations, including Ca2+ and Mg2+ [58]. Wang et al. [24] suggested that the contributions of Ca2+ and Mg2+ to the maintenance of plant ion balance and the response to SA stress should not be ignored under SA conditions. Thus, it is reasonable to infer that the roles of plant Ca2+ and Mg2+ in explaining the SA tolerance of alfalfa may be considerable under soil conditions vis-à-vis their traditional roles in terms of salinity tolerance and SA solution conditions (Table S1) [17,19,20,23,24,25,28,31,32,33,34,35,36,37,38,39,40,41,42,43,44,45,46,47,48,49,50,51,52,53,54]. Considering that most research to date on SA tolerance in alfalfa has been conducted under SA solution conditions rather than SA soil conditions (Table S1) [17,19,20,23,24,25,28,31,32,33,34,35,36,37,38,39,40,41,42,43,44,45,46,47,48,49,50,51,52,53,54], the respective contributions of Ca2+ and Mg2+ to the SA tolerance of alfalfa should be recognized and investigated thoroughly. Crucially, soil-mediated SA stress is a continuous stress that acts upon plants throughout their entire vegetative growth period, rather than a suddenly imposed stress that occurs under controlled solution conditions [17,30,59]. Moreover, simulating such stresses in soil conditions is especially complex and difficult under field conditions when compared with the use of solutions [30,59]. To the best of our knowledge, few studies have quantified the contributions of plant nutrient cations, especially Ca2+ and Mg2+, to SA tolerance in alfalfa under field SA soil conditions. Therefore, this study was conducted with two objectives: firstly, to test the hypothesis that the inclusion of soil alkalinity-affected indices, especially Ca2+, Mg2+, and their ratios to Na+ in the plant, based on the traditional method could improve the prediction accuracy of SA tolerance in alfalfa. To obtain predictions using this new method and the traditional method, we quantified the relationships between SA tolerance in alfalfa and investigated the growth and physiological indices of the alfalfa shoot from field SA and field non-SA conditions. The second objective was to identify important indices for SA tolerance in alfalfa and suitable alfalfa cultivars in alkaline salt-affected soils. Taken together, the results of this study will help provide theoretical and practical guidance for the precise evaluation of SA tolerance in alfalfa crops and serve as a valuable genetic resource for developing SA-tolerant alfalfa cultivars in alkaline salt-affected soils.

2. Materials and Methods

2.1. Plant Growth and Experimental Setup

The field experiment was conducted at the Da’an Sodic Land Experimental Station (45°36’ N, 123°53’ E, and 132.1 m) in the Songnen Plain, northeast China (Figure S1). The climate is semiarid and semihumid, averaging 413.7 mm of precipitation annually [13]. The soil characteristics can be found in Table 1. The soil samples were collected from the 0–10 cm soil layer before planting. Electrical conductivity (EC) and pH were determined under a 1:5 soil-to-water-extract ratio. Organic matter was determined with the potassium dichromate method. Available N, P, and K were determined by the industry standards LY/T1228-2015, LY/T1232-2015, and LY/T1236-1999, respectively.
The field experiment consisted of two soil types: a crop field, which served as the control ("NSA" = non-SA), and the SA-field, which served as the treatment. A split-plot design with three replicates was used with SA stress treatments as the main plots and cultivars as the subplots. The main plots consisted of the SA stress treatment and control (NSA). The subplots of 3 m2 per plot consisted of 50 cultivars and were randomly placed in each main plot.
The seeds of each cultivar were sown at a density of 10 g per 3 m2 on 1 June 2018. The cultivars used and their sources are given in Table S2. The alfalfa seeds were sown about 2 cm deep and covered with mixtures of aeolian soil and the local SA soil according to the local practice to prevent the formation of a soil crust and promote plant emergence even after irrigation [3,7]. After sowing, the plots were then irrigated using irrigation water with an EC of 1.05 mS cm−1 and pH of 7.52 obtained from an 80 m deep well, followed by weeding practices carried out as needed by hand.

2.2. Experimental Sampling and Measurements

Plant samples were measured and analyzed during the seedling stage of the cultivar at approximately five weeks after the seeds were sown in 2018. In 2019, plant samples were measured and analyzed during the seedling stage of the cultivar after regreening. This seedling stage was selected because it is the critical period for the early screening of alfalfa for SA tolerance [17,25,26,60]. Each cultivar contained three biological replicates. In each plot, two or more plants per cultivar were randomly harvested by digging up the entire plant, removing the plant at the shoot base, and then averaging the aboveground weight of one alfalfa plant. The stem length (SL) of alfalfa was measured as the length of the longest stem on the plant [61]. Shoot dry mass (SDM) was obtained by oven-drying the fresh samples at 105 °C for 30 min (for the first recording) and then again at 75 °C to a constant weight. The soluble sugar (SS) content of each sample was measured following the modified method described by Liu et al. [62]. A ca. 50 mg dry-powder sample of the shoot was extracted in 15 mL of double-distilled H2O and boiled for 20 min. Next, 5 mL of anthrone reagent was added to the 1 mL extract and incubated at 95 °C for 20 min and then cooled to room temperature. The absorbance of the solution was measured at 620 nm with a spectrophotometer (T6, Puxi General Instrument Co., ltd. Beijing China). The proline (PRO) content was determined according to the modified method by Bates et al. [63]. Specifically, ca. 50 mg of a dry-powder sample from the shoot was homogenized in 5 mL of 3% (w/v) sulfosalicylic acid, following which the mixture was placed in a boiling water bath for 10 min. The 18 mL plastic tubes were cooled and then centrifuged at 3000 × g for 20 min. Approximately 2 mL of the supernatant was mixed with 2 mL of glacial acetic acid and 2 mL of acidic ninhydrin reagent, and then boiled for 30 min. The plastic tubes were cooled, 4 mL luene was added to each tube, and the absorbance at 520 nm was determined with a spectrophotometer (T6, Puxi General Instrument Co., ltd. Beijing China).
Finally, ca. 0.1 g dry powder from each sample was digested with a mixture of HNO3 and HClO4 (v/v = 2:1) and diluted to 100 mL. Using this mixture, the total cation contents of Na+, K+, Ca2+, and Mg2+ were determined by inductively coupled plasma mass spectrometry (ICPS-7500, Shimadzu Corporation, Japan). The K+/Na+ ratio, Ca2+/Na+ ratio, and Mg2+/Na+ ratio indices in the alfalfa shoots were calculated using the corresponding values. In 2019, 21 cultivars survived, and only the aboveground stem length (SL) and shoot dry mass (SDM) as supporting evidences were measured during the seedling stage to verify the results in 2018.

2.3. Comprehensive Evaluation Formula of The Saline-Alkaline-Tolerance Coefficient of Each Index

The saline-alkaline-tolerance coefficient (SATC) for every plant trait was calculated using the following formula [29,57]:
SATC = value   of   the   trait   under   the   SA   condition / value   of   trait   under   the   NSA   condition
The eigenvector of each index in Table S3 was calculated based on eigen values and factor loadings values of different indices through a principal components analysis (PCA) using the following formula:
Eigenvector = Factor   loadings   values   /   Eigen   values
For a given alfalfa cultivar, a comprehensive index (CI) was calculated based on the eigen values and factor scores of different alfalfa cultivars through a principal components analysis (PCA) (Table S4) [57].
CI = Factor   scores   values × Eigen   values
For a given alfalfa cultivar, a comprehensive index (CI1–CI5) was calculated based on the SATC values of 11 indices through a principal component analysis (PCA) [57]. Based on the CI1–CI5 indices, subordinate function values μ(Xj) for the different alfalfa cultivars were calculated using the following formula (Table S4):
μ X j = ( X j X m i n ) /   ( X m a x X m i n ) ,   j = 1 , 2 , 3 , ,   n .
where Xj is the j comprehensive index, Xmin is the minimum value of the j comprehensive index, and Xmax denotes the maximum value of the j comprehensive index.
The weight (Wj) of the comprehensive indexes (CIs) for the different alfalfa cultivars was calculated as follows (Table S4):
W j = P j   / j = 1 n P j ,   j = 1 ,   2 ,   3 ,   ,   n .
where Wj indicates the importance of the jth comprehensive index among five comprehensive indices and Pj is the contribution rate of the jth comprehensive index of each alfalfa cultivar (obtained from the PCA).
The comprehensive value (D-value) of the SA tolerance for each alfalfa cultivar was then calculated as follows (Table S4):
D = j = 1 n μ X j × W j , j = 1 , 2 , 3 , , n .  

2.4. Statistical Analysis

PCA is a method that can transform numerous indexes into a small number of comprehensive indexes under the premise of less information loss, and effectively concentrate data and simplify the index, so as to make up for the deficiency of SA-tolerance evaluation of individual indexes. The main operational steps of PCA are summarized as follows. Firstly, the data were normalized to analyze descriptive statistical variables. Secondly, the eigen values, or variances of each principal component (PC), were extracted using dimension-reduction factor analysis. Based on standardized data, the correlation matrix was used to analyze and extract the eigen values. Thirdly, the eigenvector of each index was calculated based on the component matrix using Equation (2) and the comprehensive index (CI) was calculated based on the eigen values and factor scores using Equation (3). PCA was performed by SPSS v20.0 software (SPSS, Chicago, IL, USA). The differences in the investigated parameters of the 50 alfalfa cultivars between the NSA and SA treatments were compared using a paired t-test (also performed in SPSS v20.0). The “complete” cluster method is used for distance measuring the dataset of D values using the R statistical platform v3.5.1 (R Development Core Team, Vienna, Austria).
Stepwise forward regression was used to quantify the explanatory power of the different investigated plant growth and physiological variables for predicting the SA tolerance of alfalfa and to identify the key variables predicting SA tolerance. The SA tolerance of the 50 alfalfa cultivars was the dependent variable, with the SATCs of the plant growth and physiological variables set as the independent variables.
In this study, a PCA of SATCs was firstly conducted and then combined with subordinate function analysis to obtain the comprehensive D-value, following which the SA tolerance of the cultivars was classified according to the D-value by cluster analysis. Additionally, the stepwise regression relationship between the D-value and each growth and physiological index was established to determine the most suitable index.
To convey the SA tolerance of alfalfa, the traditional method was adopted based on the inclusion of SATCs of SL, SDM, SS, PRO, Na+, K+, and K+/Na+ ratio, considering that most studies of alfalfa have frequently selected these variables as being characteristic for salinity tolerance, including SL, SDM, SS, PRO, Na+, K+, and K+/Na+ ratio (literature reviewed in Table S1). For the new method proposed here, frequently neglected variables, especially Ca2+, Mg2+, Ca2+/Na+ ratio, and Mg2+/Na+ ratio in terms of the SATCs, were further included, based on the inclusion of the SATCs of SL, SDM, SS, PRO, Na+, K+, and K+/Na+ ratio, which were adopted by the traditional method.

3. Results

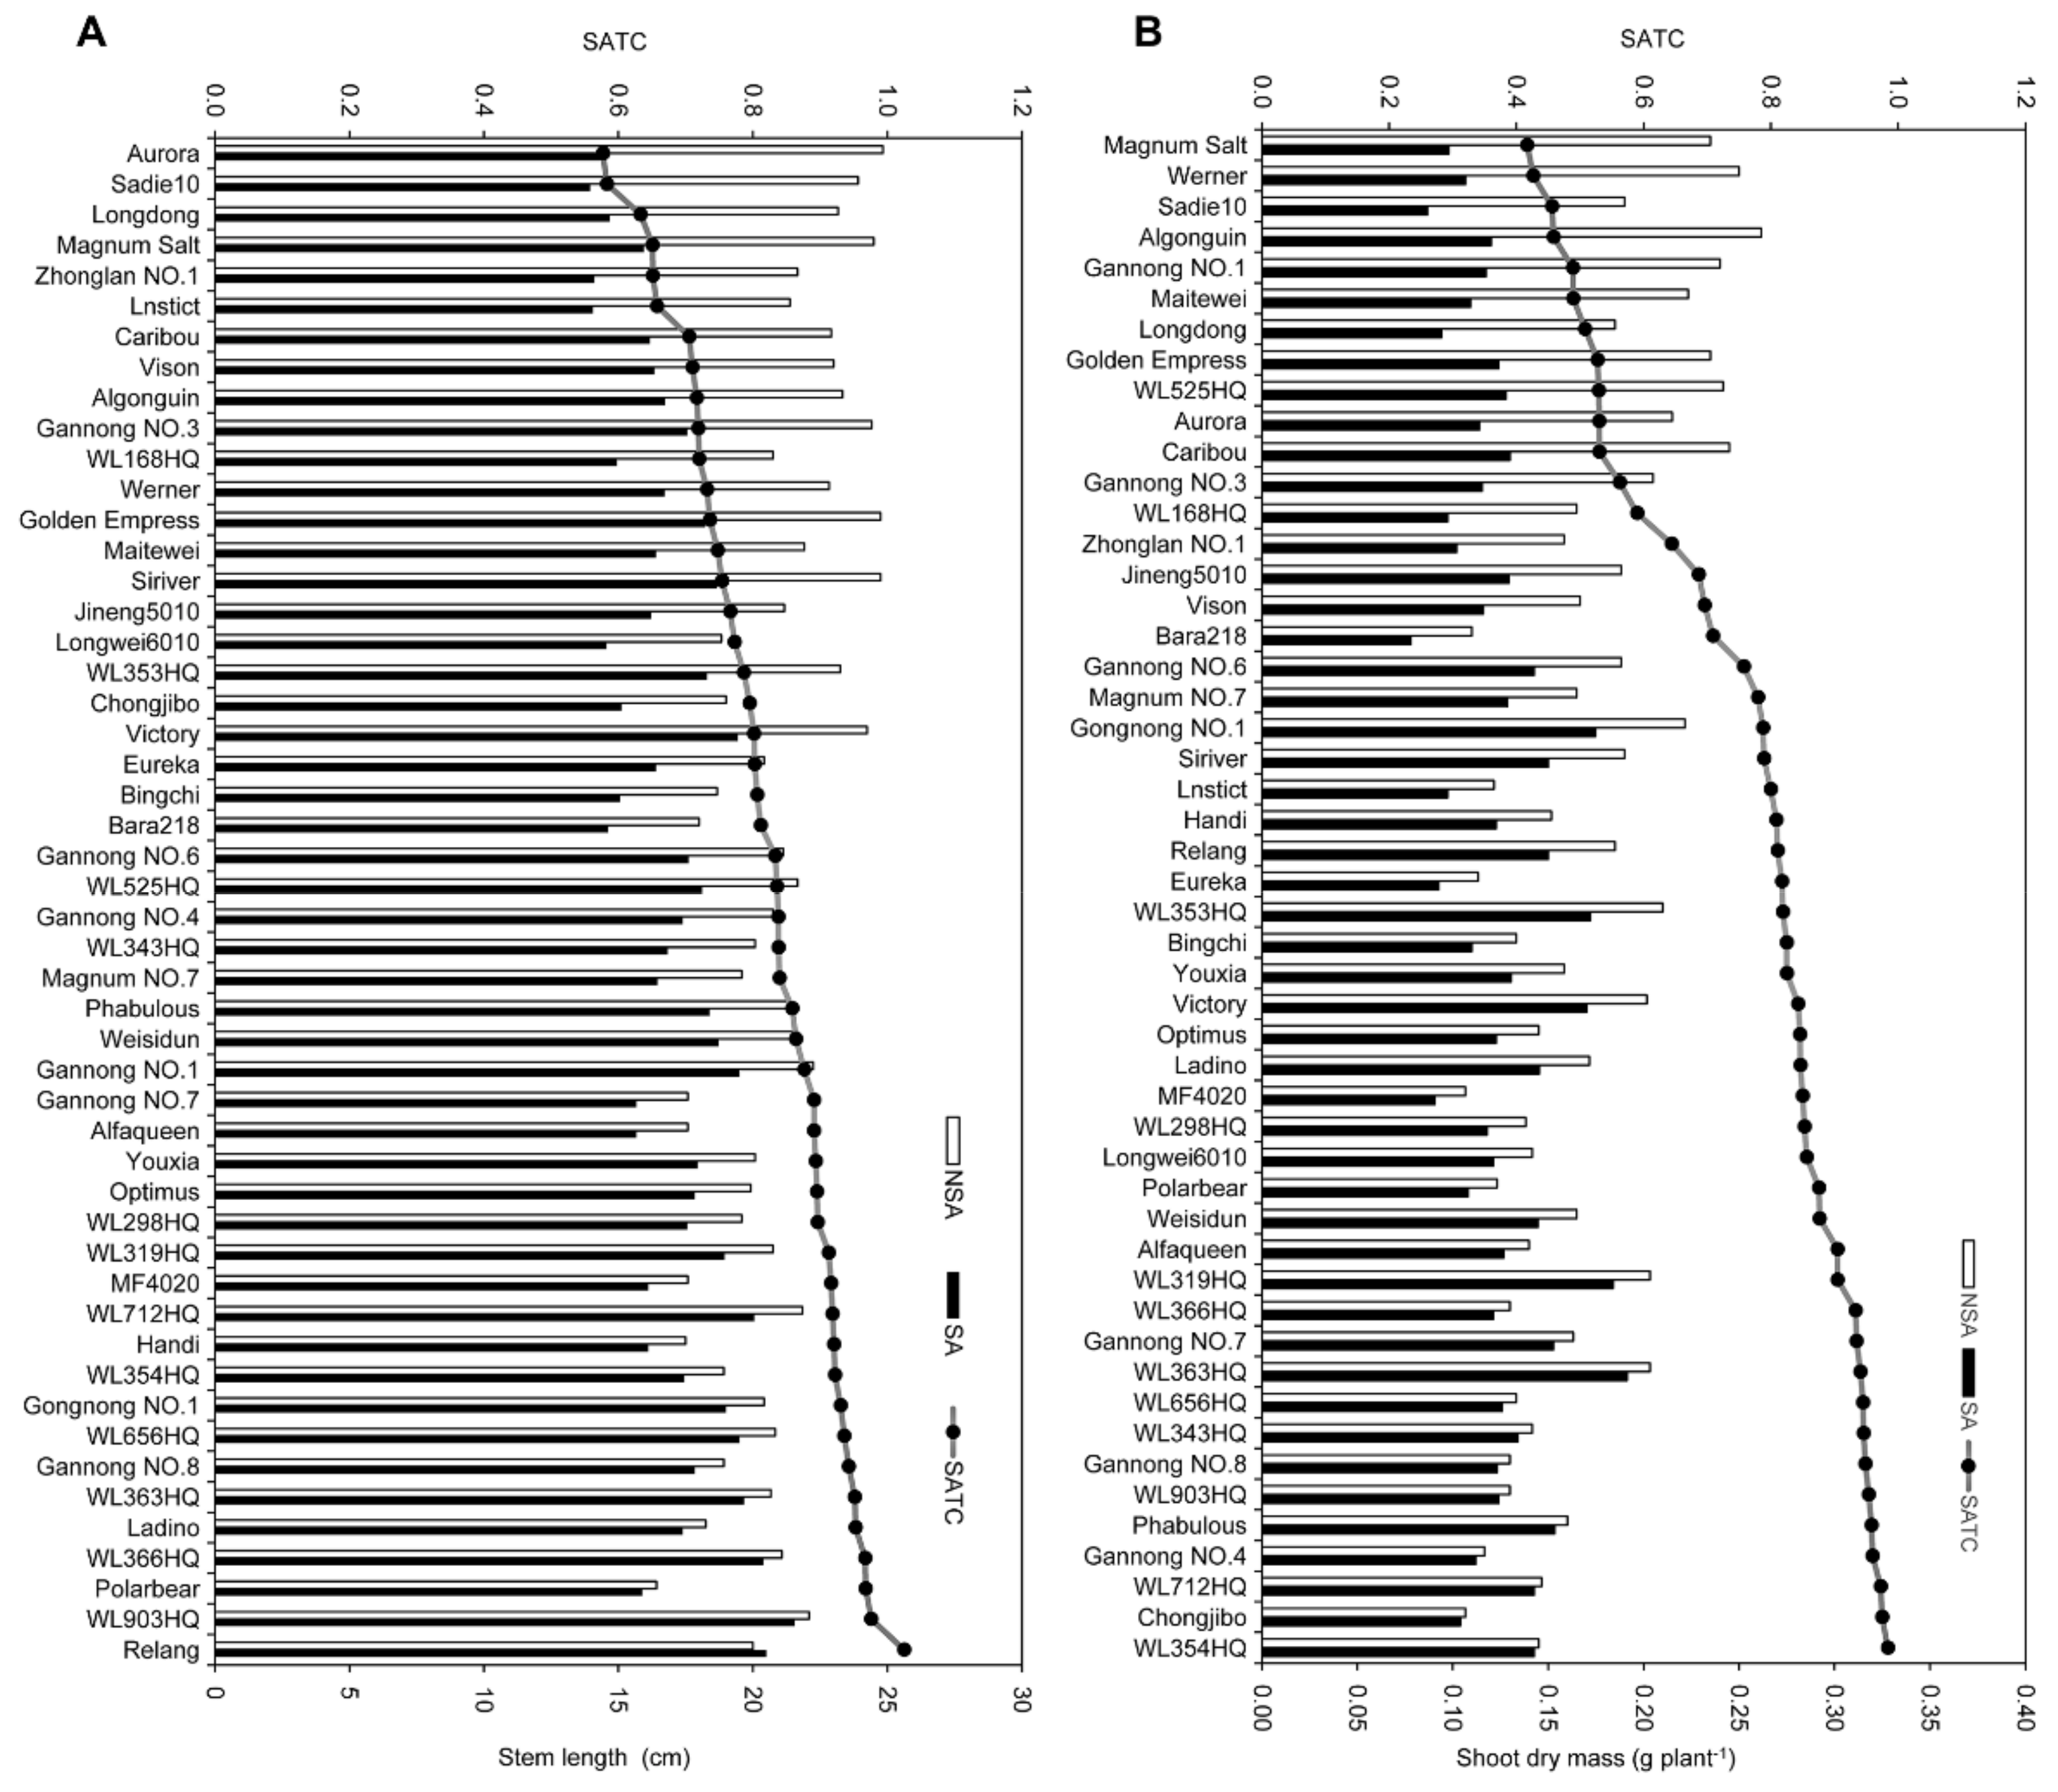
3.1. Genetic Variation in Plant Growth and Physiological Indices under SA Treatment vs. NSA Treatment

SA had a significant effect on both SL and SDM (P < 0.05; Table 2). The SATCs for SL and SDM (Figure 1) varied remarkably among the different cultivars. The SATC of SL ranged from 0.58 in the cultivar Aurora to 1.03 in the cultivar Relang. The SATC of SDM ranged from 0.42 in the cultivar Magnum Salt to 0.98 in the cultivar WL354HQ.
SA stress had a significant effect on SS (P < 0.05) and PRO (P < 0.05; Table 2). Both SS and PRO increased in all cultivars under SA conditions, but the tolerance of the cultivars differed as did their respective accumulation amounts (Figure 2). For SS, the cultivar WL343HQ had the highest SATC value of 4.39, whereas Algonguin had the lowest SATC value of 1.11 (Figure 2A). PRO was highest in cultivar WL319HQ with a SATC value of 9.73 and lowest in Gannong NO.4, which had a SATC value of 0.81 (Figure 2B).
SA stress also significantly affected the contents of Na+, K+, Ca2+, Mg2+, and the ratios of Ca2+/Na+ and Mg2+/Na+ (P < 0.05, Table 2). The SATC of K+ ranged from 0.68 in cultivar WL354HQ to 2.46 in cultivar Bingchi (Figure 3A). For Na+ content, the cultivar Vison had the highest SATC value of 8.55. By contrast, WL319 had the lowest SATC value of Na+ under SA conditions, with a value of 0.86 (Figure 3B). For Ca2+ content, the cultivar WL903HQ had the highest SATC value of 0.82, whereas this was lowest in Eureka at 0.37 (Figure 3C). The SATC value of Mg2+ was lowest in cultivar WL366HQ at 0.56 and highest at 1.03 in Eureka (Figure 3D). The SATC of the K+/Na+ ratio ranged from 0.29 in WL354HQ to 3.97 in Bingchi (Figure 3E). For the Ca2+/Na+ ratio, the cultivar WL319HQ had the highest SATC value (0.81), whereas this was lowest in the cultivar Vison (Figure 3F). Finally, for the Mg2+/Na+ ratio, the SATC values were highest in cultivar WL319 at 0.97 and lowest in the cultivar Vison (Figure 3G).

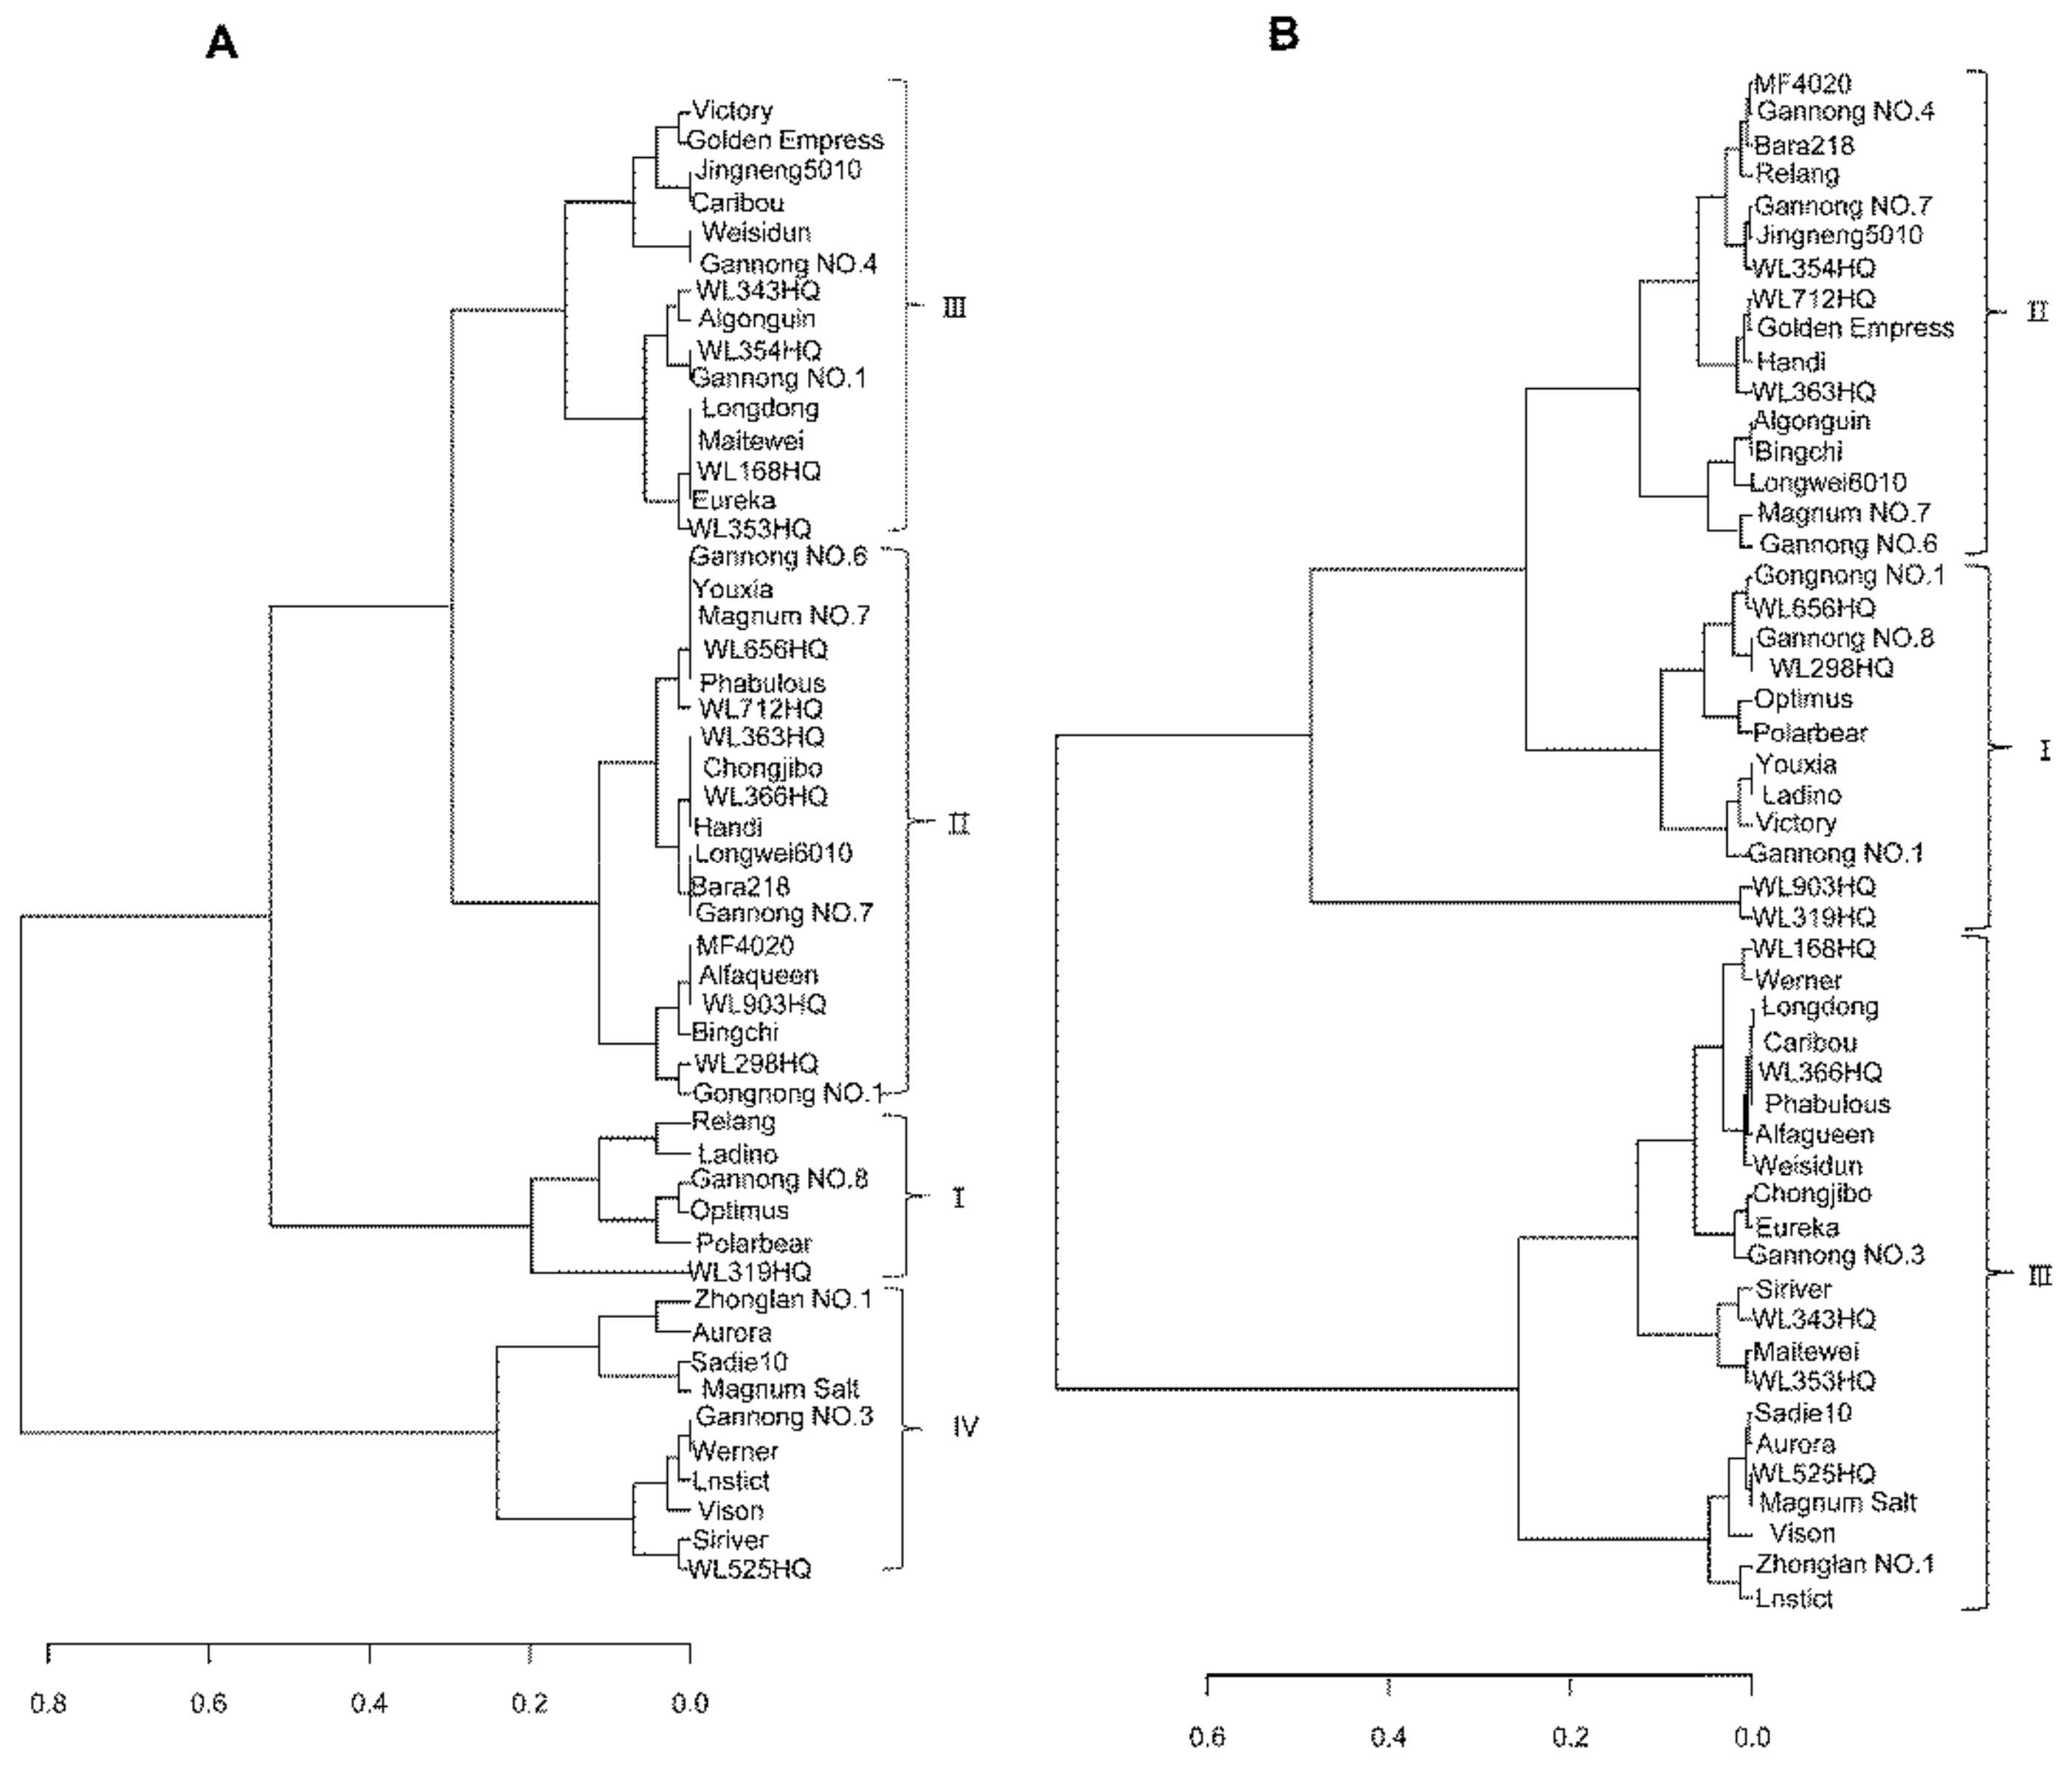
3.2. Classification of the SA-Tolerance of Alfalfa Based on the Different Methods

Following cluster analysis of the comprehensive D-value, the 50 cultivars were divided into four categories using the traditional method (Figure 4). Category I corresponded to strong SA-tolerant cultivars (WL319HQ, Polarbear, Optimus, etc.) with D-values of 0.61–0.75, accounting for 12% of the 50 cultivars. Category II represented moderate SA-tolerant cultivars (WL903HQ, Alfaqueen, MF4020, etc.) with D-values of 0.51–0.59 and accounting for 38% of the 50 cultivars. Category III contained weak SA-tolerant cultivars (Gannong NO.4, Weisidun, Victory, etc.) with D-values of 0.38–0.49, which characterized 30% of the 50 cultivars. Category IV contained sensitive SA-tolerant cultivars (Sadie10, Magnum Salt, Aurora, etc.) with D-values of 0.16–0.33, accounting for 20% of the 50 cultivars.
Unlike the traditional method, the new method classified the 50 cultivars into three categories (Figure 4). Category I consisted of strong SA-tolerant cultivars (WL319HQ, WL903HQ, Polarbear, etc.) with D-values of 0.54–0.78, corresponding to 24% of the 50 cultivars. Category II comprised moderate SA-tolerant cultivars (Gannong NO.6, Magnum NO.7, Bingchi, etc.) with D-values of 0.43–0.52, accounting for 32% of the 50 cultivars. Category III represented weak SA-tolerant cultivars (Zhonglan NO.1, Lnstict, WL525HQ, etc.) with D-values of 0.24–0.42; these accounted for almost half (44%) of the 50 cultivars.
In 2019, the surviving 21 cultivars were observed along with their autumn dormancy grades ≤ 3.2 (Table S2). Under the traditional method, the average SATC of SL in the sensitive SA-tolerant category was significantly lower than that in the other categories, but there was no significant difference in the SATC of SDM among the different categories (Figure 5A,B). Under the new method, the average SATCs of SL and SDM demonstrated the same trend: strong SA-tolerant cultivars were significantly higher than weak SA-tolerant cultivars (Figure 5C,D).

3.3. Identifying the Most Important Indices for Evaluating SA Tolerance in Alfalfa Based on Different Methods.

The relationship between each index and D in the two methods was determined by stepwise regression analysis, and the index with the highest R2 value was added first to the regression model (Table 3). Under the traditional method, the SATC of SL explained the most variation (67.90%) in the D response, and the SATC of PRO was the second-most important index with an explanatory power of 13.60% for D, followed by the SATCs of K+/Na+ ratio, SDM, SS, K+, and Na+ (Table 3). However, under the new method, it was the SATC of the Ca2+/Na+ ratio that was the best predictor, explaining 62.50% of the variation in D. The SATC of SL was the second variable to be included, followed by the SATCs of Mg2+, Ca2+, SDM, PRO, Na+, SS, and K+ (Table 3).

4. Discussion

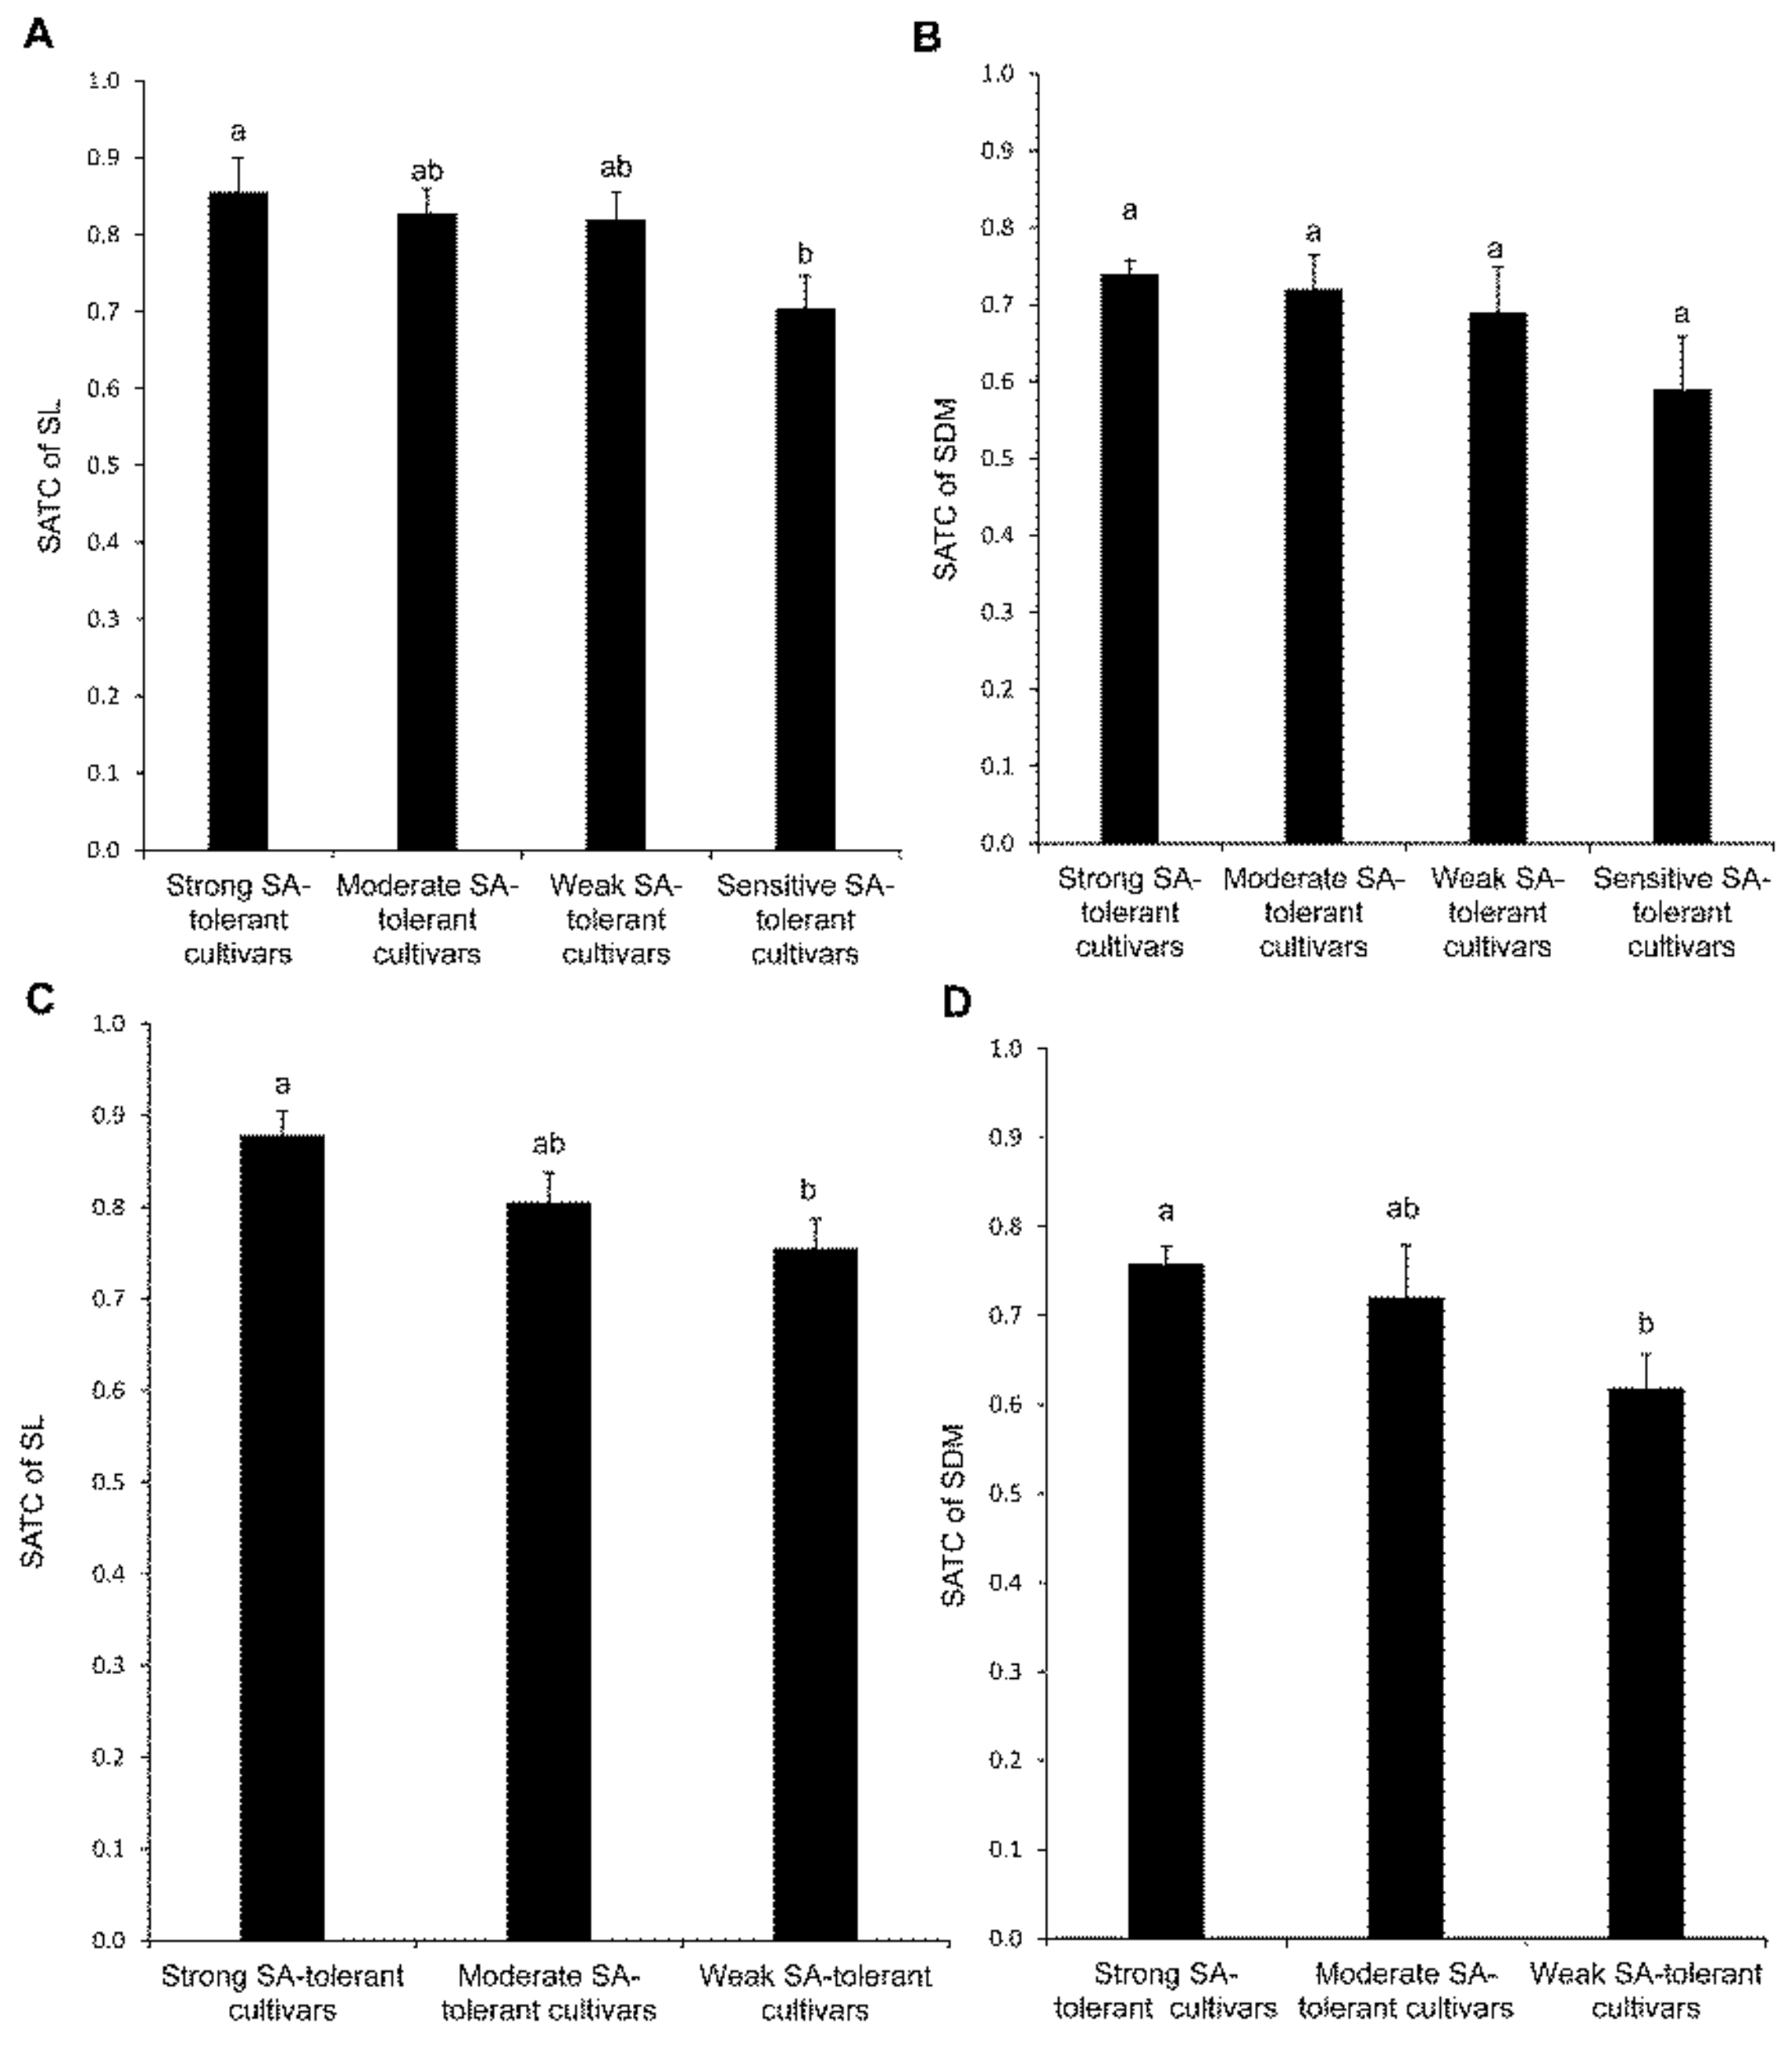
4.1. Assessing the Appropriateness of SA-Tolerance Prediction and the Identification of Suitable Cultivars for saline–alkaline (SA)-Tolerance

The traditional method explained 99.9% of the variation in alfalfa SA tolerance (Table 3), as did the newly proposed method, in which shoot Ca2+, Mg2+, and their ratios to Na+ were included. The high explanatory power of both methods may be ascribed to the increased accuracy in quantifying the stress tolerance of the plant by simultaneously analyzing multiple parameters based on PCA (Table S3). Likewise, the relative values of the various plant growth and physiological parameters under SA and control conditions used in this study may reflect the tolerance of this plant more precisely when compared with their absolute values [29,30,57]. It thus seems feasible to use the plant growth and physiological variables based on the traditional salinity-characterized method as well as the new method. In fact, the D-value, as a comprehensive value of SA tolerance, changed when different parameters were included since they were generated from the reintegration of the included parameters and their assigned weights (Table S4). Specifically, the D-value of the same alfalfa cultivar for a certain plant trait obtained via the traditional method differed from that using the new method. In this respect, the most important variables identified by the PCA and linear regression analysis could only reflect the SA tolerance based on the included parameters. Further, the traditional method identified the SATC of SL as being the strongest index for SA tolerance (Table 3), while for the new method, which included shoot Ca2+, Mg2+, and their ratios to Na+, the strongest index was the SATC of shoot Ca2+/Na+ ratio. It appears that the new method might have an improved ability to identify the most important index for predicting the SA tolerance of alfalfa.
By further analyzing the categories of the alfalfa cultivars based on the two methods (Figure 4), some known alfalfa cultivars, especially WL903HQ, WL298HQ, Victory, Gannong NO.1, and Alfaqueen, classified by the new method into the different SA-tolerance categories were observed to be more consistent with the reported categories when compared with those obtained by the traditional method (Figure 4). According to previous studies that screened the saline or saline–alkaline tolerance of alfalfa, WL903HQ [64,65], WL298HQ [66], Victory [67], and Gannong NO.1 [68] were also considered as being relatively highly tolerant to saline or saline–alkaline stress conditions, which is more consistent with the classification results of the new method. Moreover, in recent studies, Alfaqueen was identified as being weak SA-tolerant through laboratory-controlled experiments [64,67]. These results are also more consistent with the classification results of the new method, considering that the cultivar was grouped into the category of a moderately SA-tolerant cultivar using the traditional method. We suggest that the new method is an improvement over the traditional method when aiming to classify all alfalfa cultivars.
Since the autumn dormancy grade is an important factor in cultivar selection [69], the surviving alfalfa cultivars in 2019 were used to partly verify the SA-tolerance classification using the two methods (Figure 5). As expected in the SATC of SL, there were significant differences in the SATC of SL, with higher values in the strongly SA-tolerant category in both methods (Figure 5A,C). However, it is noteworthy that the average SATC of SDM in the strongly SA-tolerant category was higher than that in the other categories under the new method, but there was no significant difference in the different categories of alfalfa under the traditional method (Figure 5B,D). Many studies have demonstrated that SDM is a crucial index for expressing the SA tolerance of plants, as the more tolerant alfalfa cultivars have higher SDM under SA conditions when compared with their less tolerant counterparts [56,70]. Thus, it might be concluded that the classification of alfalfa SA tolerance based on the new method is more appropriate for discriminating cultivar properties, such as the SATC of SDM, compared to the traditional method.
Taken together, the new method holds potential for enhancing the SA-tolerance evaluation of alfalfa compared with the traditional method. However, further investigation of the suitability of the new method based on the inclusion of alfalfa shoot Ca2+, Mg2+, and their ratios to Na+ will require testing under a gradient of alkaline salt-affected soil and climatic conditions.

4.2. Identification of the Best Markers for Predicting the saline–alkaline (SA)-Tolerance of Alfalfa

It is well known that the success of indirect selection for stress tolerance by using plant attributes as markers depends on the strength of the relationship of such markers with plant phenotypic responses to stress factors [27,30]. Here, we identified that the most important variable conveying SA tolerance was not the same when differing plant growth and physiological variables were included. The traditional method identified the SATC of SL as having the greatest single explanatory power at 67.90% (Table 3). Likewise, the new method also identified the SATC of SL as a strong index for saline–alkaline (SA)-tolerance (Table 3). Hence, SL likely plays an important role in governing and predicting SA-tolerance. It is worth noting that SL is the length of the longest stem on the alfalfa plant rather than the natural height. Actually, SL was once considered important in evaluating alfalfa yield [71,72], and in recent years it was reconsidered as a vital index in evaluating alfalfa yield and salinity tolerance [33,61]. From a practical and economic perspective, stem length should be considered as a chief screening criterion under SA field conditions, since its measurement is easy and fast.
When the shoot Ca2+, Mg2+, and their ratios to Na+ were included in the new method, the SATC of Ca2+/Na+ ratio was identified as the strongest index, having a single maximal explanatory power of 62.50% (Table 3). This suggests that Ca2+/Na+ ratio could play a major role in predicting the SA-tolerance of alfalfa growing under realistic SA field conditions as compared with SL when both are simultaneously evaluated. Calcium is crucial for maintaining the structural and functional integrity of plant membranes, in addition to its function in the regulation of ion transport, selectivity, ion homeostasis maintenance, signal transduction, and activation of cell wall enzymes and antioxidant enzyme activities [19,20,34,73]. According to Suarez and Grieve (1988) [74], the Ca status of the plant shoot is strongly influenced by the ionic composition of the external medium; hence, the Ca2+/Na+ ratio may be predicted from the solution composition of the root media and shoot ion concentrations under salinity-stressed conditions. Meanwhile, some studies have shown that the maintenance of Ca acquisition and transport under salt stress conditions is a prominent determinant of salinity tolerance in plants [75]. Even under saline conditions, the Ca2+/Na+ ratio was once proposed as a promising index for gauging plant salt tolerance [33,35]. However, the physiochemical properties of SA soils, especially the ionic composition and pH, frequently differ from those of saline soils [3,7,11], which probably leads to disparate Ca status and Ca2+/Na+ ratios between them. In such cases, it is necessary to determine whether the shoot Ca2+/Na+ ratio is still relevant as an index for the SA tolerance of plants, including alfalfa. Unfortunately, under alkaline salt-affected conditions, the contributions of Ca2+ towards the maintenance of ion balance and response to SA stress are frequently ignored [36]. To the best of our knowledge, this study is the first to have quantified the contributions of shoot Ca2+/Na+ ratio and Ca2+, as well as conventional plant and physiological indices in terms of relative values, to identify their roles in the SA tolerance of alfalfa in the field under alkaline salt-affected conditions. Our results highlight the importance of Ca2+/Na+ ratio in the SA tolerance of alfalfa under alkaline salt-affected conditions.
There are practical reasons for using the shoot Ca2+/Na+ ratio of alfalfa in terms of the relative values under SA and NSA conditions to predict SA tolerance. First, these data are easily available since the measurement of Ca2+ and Na+ in plants is relatively simple to conduct in the laboratory. Second, including the Ca2+/Na+ ratio could improve SA-tolerance evaluations of alfalfa. We speculate that the Ca2+/Na+ ratio could be significant for distinguishing the SA tolerance of more plant genotypes or species in similar alkaline salt-affected conditions. The utility of Ca2+/Na+ ratio for predicting the SA tolerance of alfalfa may be further enhanced if its appropriateness in future studies is extensively evaluated by quantifying the relative contributions of Ca2+ and Ca2+/Na+ ratio to SA tolerance, which could be achieved by testing multiple plant species across soil types in alkaline salt-affected conditions.
It is well known that Mg2+ is essential for protein synthesis and chlorophyll structure, being an activator for many photosynthetic and respiratory enzymes [37]. More importantly, the accumulation of cations, including Mg2+, as important nutrients, might also be an important mechanism in the plant response to SA stress by maintaining ion homeostasis [38,76] and contributing to signaling and enzyme activity [34]. Consistently, we found that the SATC of shoot Mg2+/Na+ was significantly and positively related to the D-value (r = 0.74, P < 0.01) (Table S5). These results provide supporting evidence for the use of the SATC of shoot Mg2+/Na+ as a robust predictor influencing the SA tolerance of alfalfa. However, the relationship between the SATC of the shoot Mg2+ and the SA tolerance (D) was relatively weak (Table S5), likely due to the lower soil Mg2+ content in contrast to soil Ca2+ and Na+ (Table 1). Additionally, the inhibition of Mg2+ uptake by Na+ and Ca2+ occurs under SA conditions [37,39]. Furthermore, the SATC of the shoot Mg2+/Na+ ratio was significantly positively correlated with that of shoot Ca2+/Na+ ratio (r = 0.93, P < 0.01), indicating the importance of the SATC of the shoot Mg2+/Na+ ratio in predicting the SA tolerance of alfalfa. This result corroborates the earlier findings of Bernstein et al. [77], who argued that the Mg2+/Na+ ratio was a critical index of the saline tolerance of sorghum. However, because it was wholly or partly displaced by the SATC of Ca2+/Na+ ratio and Ca2+ in the linear regression analysis (Table 3), this variable did not emerge as an important predictor in the present study. Meanwhile, although the vital role of Mg2+ in conveying the SA tolerance of plants is often ignored [36], we still speculate that Mg2+ and Mg2+/Na+ ratio have non-negligible roles in determining the SA tolerance of alfalfa in SA field conditions.
Agronomic characters represent the combined genetic and environmental effects upon plant growth and yield, as they include the physiological mechanisms conferring salinity and alkalinity tolerance [27,34,40,78]. When using the two methods, the SATC of SDM was separately identified as an important predictor and was significantly related to the SL (Table S5). These results indicate that SDM may contribute to SA tolerance, which supports previous findings [56,70]. Interestingly, except for SL, the SATC of SDM was not significantly related to any other investigated independent variable, which is similar to the results reported by Vadez et al. [79]. In our study, the soil EC before the trial was 347.22 uS cm−1, which was equal to the EC of saturated paste extract with a value of 3.78 mS cm−1 according to Chi and Wang [4]; this is higher than the salinity threshold of alfalfa [80]. Despite the synergistic interaction between pH and salinity on the growth and physiological properties of alfalfa [32,81], stresses, including soil salinity and the pH (9.09) under the SA field conditions, are likely insufficient to satisfy the SA intensity and stress duration [30,32,82,83]. In such cases, the significant relationships between SDM and the investigated variables in the present SA conditions likely did not exist, in contrast to the stronger intensity previously reported for SA solutions-based laboratories [30,32].
Additionally, the SATCs of shoot proline and SS were both identified as predictors of SA-tolerance using both methods, suggesting their involvement in SA-tolerance, though their contributions were relatively low compared with the other variables (Table 3). Debate persists on proline and SS as indicators of plant stress, such as salinity or alkalinity. Some studies deemed PRO as an important index [41], whereas others have argued against this interpretation [66,68]. Soluble sugar, as an osmotic regulator under stress, depends not only on plant species, but also on the cultivar, salt level, duration of the exposure to stress, developmental stage, and experimental conditions. It may increase [84], decrease, or even stay constant [28,85]. Thus, the functional relevance of proline and sugar contents for predicting the SA tolerance of alfalfa merits further testing and verification.
Other factors that were highly ranked included the SATCs of shoot Na+ and K+ as predictors of the SA tolerance of alfalfa (Table 3). This result is consistent with those obtained using the traditional method, as indicated by an adaptive mechanism wherein the absorption of Na+ increases with the competing uptake of nutrient cations such as K+ under SA conditions [32,36]. Interestingly, using the new method, the respective predictive ability of SA tolerance was lower than that of Ca2+ (Table 3). This finding suggests a minor role of shoot Na+ or K+ in SA tolerance under SA field conditions at our site, probably because the soil available K under SA field conditions is relatively high and adequate for uptake by alfalfa roots (Table 1) [86]. Consequently, the SATC of shoot K+/Na+ might not serve as a reliable marker for plant tolerance to SA under field conditions. Despite this, the K+/Na+ ratio is still widely employed as a robust marker for salinity tolerance [22,87,88,89,90] and SA tolerance (Table S1). Practically, the initial soil cation nutrients, including K, under SA field conditions were obviously different from the initial solution nutrients in the Hoagland’s solution (Table S6.1) [23,30,32,37,39], as indicated by the cation contents in the alfalfa plants under nonstressed treatments between controlled solution conditions and the present field soil conditions in Tables S6.1 and 6.2. In such cases, alfalfa plants were supplied with initial contrasting contents of important cation nutrients, especially K and Ca under SA field conditions compared with solution conditions (Tables S6.1–6.3). This could possibly account for the different ratios of important cations, such as K+/Na+ ratio, Ca2+/Na+ ratio, or Mg2+/Na+ ratio, in the alfalfa when subjected to salinity and alkalinity stresses [21,22,24,31,32,74,77]. In this sense, our present study helps enhance our mechanistic understanding of plant-soil interactions by quantifying the relationship between alfalfa tolerance and plant growth, and physiological traits based on the soil systems in a more realistic and practical manner compared with the solution system. Future study is needed to quantify the roles of initial soil cation nutrients under SA field conditions in determining the most important factors for assessing the SA tolerance of alfalfa from the perspective of initial soil cation nutrients under SA field conditions.
Taken together, we infer that the SATCs of shoot Ca2+/Na+ ratio, stem length, and Mg2+ are the best indices for predicting the SA tolerance of alfalfa, as they were entered first into the regression analysis and SATCs of other investigated variables and were significantly related to the identified variables under SA conditions (Table 3). Furthermore, significant differences in SDM, SL, shoot Ca2+, and shoot Ca2+/Na+ ratio were detected using both methods (Table S6.3) when further analyzing the differences in the investigated variables among different categories of alfalfa under SA field conditions. This result is consistent with Wang et al. [24], who found that a salt-tolerant alfalfa cultivar had a higher SDM, shoot Ca2+, and Ca2+/Na+ ratio compared with a low salt-tolerant cultivar. Coupled with the significant relationship identified between SL and SDM (Table S5), these results provide supporting evidence for the selection of the SATC of shoot Ca2+/Na+ ratio and SATC of SL as important markers for predicting the SA tolerance of alfalfa crops.
Salt reduces plant growth via several distinct processes [22]. In the first osmotic phase there is an independent effect of shoot salt accumulation, in which the growth of shoots significantly slows due to the salt outside the roots, for which there is surprisingly little genotypic variation [21,22]. Next, in the ionic phase of salt toxicity, which requires time to progress and results from internal injury, either species or genotypes can utilize two strategies of ion efflux and tissue tolerance to resist ionic stress [19,21,22], likely explaining their divergent ability for tolerating SA soil conditions. Hence, the tolerance mechanisms and the temporal scale on which they operate may be critical for controlling growth at different time periods under exposure to saline–alkaline stress conditions; thus, these mechanisms should be considered. In our study, plant samples were collected only at the seedling stage. Several studies have shown that using this stage to evaluate the responses of alfalfa to salinity and alkalinity is important for elucidating its tolerance mechanisms and identifying important makers and suitable cultivars with different abilities to tolerate saline or SA conditions [17,20,25,26,60]. However, the differences in the levels of salt tolerance at the seedling stage did not completely reflect their salinity tolerance as adults [19,27,91]. Thus, the suitability of markers for SA tolerance, especially the Ca2+/Na+ ratio, in distinguishing suitable alfalfa cultivars may be enhanced if the tolerance of alfalfa to other SA conditions is further studied at the whole-plant level through its ontogeny [27,91].

5. Conclusions

The results revealed that the inclusion of shoot Ca2+, Mg2+, and their ratios to Na+ holds potential for enhancing SA-tolerance evaluations of alfalfa plants. The SATCs of shoot Ca2+/Na+ ratio and stem length are key markers for predicting the SA tolerance of alfalfa based on the SA field conditions in this study. We speculate that Ca2+ and the Ca2+/Na+ ratio could play important roles in reflecting the SA tolerance of alfalfa growing in alkaline salt-affected soil conditions. The 50 alfalfa cultivars were classified into strong SA-tolerant cultivars with maximum shoot Ca2+/Na+ ratios, stem lengths, SDM and Ca2+, as well as moderate SA-tolerant and weak SA-tolerant cultivars with minimum corresponding values under SA field conditions. These findings encourage investigations of how Ca2+ participates in saline–alkaline tolerance and its predictions across multiple plant species, climates, and soil types in alkaline salt-affected conditions.

Supplementary Materials

The following are available online at https://www.mdpi.com/2073-4395/10/2/191/s1, Table S1: Recent literature on the growth and physiological responses of alfalfa (Medicago sativa L.) and other plant species to saline or saline-alkaline stress. (Table S2): Experimental alfalfa materials and their sources. Table S3: Principal component analysis of the saline–alkaline-tolerance coefficients (SATCs) of 50 alfalfa (Medicago sativa L) cultivars under saline–alkaline (SA) stress using two methods. Table S4: The value of each comprehensive index (CI), index weight (Wj), subordinate function value (μ(Xj)), and comprehensive evaluation value (D) using the two methods. Table S5: Correlations of the saline–alkaline-tolerance coefficient (SATCs) of 50 alfalfa cultivars under SA stress using the new method. Table S6.1: Cation content in alfalfa plant under control treatments (Hoagland’s nutrient solution). Table S6. 2: Cation content of alfalfa plant based on the two methods under control treatments (nonalkaline salt-affected crop field). Table S6.3: Growth and physiological indices of different tolerant alfalfa cultivars under SA stress based on two methods. Figure S1: Location of the experimental site, Da’an City, Jilin, China.

Author Contributions

Z.-W.L. and M.-M.W. conceived and designed the experiments; T.-J.W., Y.-Y.J., G.-H.Z. participated in the experiments; T.-J.W. analyzed the data and wrote the preliminary manuscript; M.-M.W. and C.-J.J. revised the manuscript. All authors have read and approved the final manuscript.

Funding

This study was supported by the National Key Basic Research Program (973) of China (No. 2015CB150800), National Key Research and Development Program of China (2016YFC0501200), Major Science and Technology Innovation Project of Shandong Province (No.2019JZZY010726), and Science and Technology Service Network Initiative of Chinese Academy of Sciences (KFJ-STS-ZDTP-029).

Conflicts of Interest

The authors declare that the research was conducted in the absence of any commercial or financial relationships that could be construed as a potential conflict of interest.

References

  1. Pandey, V.C.; Singh, K.; Singh, B.; Singh, R.P. New approaches to enhance eco restoration efficiency of degraded sodic lands: critical research needs and future prospects. Ecol. Restor. 2011, 29, 322–325. [Google Scholar] [CrossRef]
  2. Wong, V.; Greene, R.; Dalal, R.; Murphy, B.W. Soil carbon dynamics in saline and sodic soils: A review. Soil Use Manage. 2009, 26, 2–11. [Google Scholar] [CrossRef]
  3. Qadir, M.; Oster, J.D.; Schubert, S.; Noble, A.D.; Sahrawat, K.L. Phytoremediation of sodic and saline-sodic soils. Adv. Agron. 2007, 96, 197–247. [Google Scholar]
  4. Chi, C.M.; Wang, Z.C. Characterizing salt-affected soils of songnen plain using saturated paste and 1:5 soil-to-water extraction methods. Arid Land Res. Manag. 2010, 24, 1–11. [Google Scholar] [CrossRef]
  5. Wang, Z.C.; Li, Q.S.; Li, X.J.; Song, C.C.; Zhang, G.X. Sustainable agriculture development in saline-alkali soil area of Songnen Plain, Northeast China. Chinese Geogr. Sci. 2003, 13, 171–174. [Google Scholar] [CrossRef]
  6. Qadir, M.; Schubert, S. Degradation processes and nutrient constraints in sodic soils. Land Degrad Dev. 2002, 13, 275–294. [Google Scholar] [CrossRef]
  7. Rengasamy, P. Soil processes affecting crop production in salt-affected soils. Funct. Plant Biol. 2010, 37, 37,613–620. [Google Scholar] [CrossRef]
  8. Naidu, R.; Rengasamy, P. Ion interactions and constraints to plant nutrition in Australian sodic soils. Aust. J. Soil Res. 1993, 31, 801–819. [Google Scholar] [CrossRef]
  9. Chi, C.M.; Zhao, C.W.; Sun, X.J.; Wang, Z.C. Reclamation of saline-sodic soil properties and improvement of rice (Oriza sativa L.) growth and yield using desulfurized gypsum in the west of Songnen Plain, northeast China. Geoderma 2012, 187, 24–30. [Google Scholar] [CrossRef]
  10. Luo, S.S.; Wang, S.J.; Tian, L.; Shi, S.H.; Xu, S.Q.; Yang, F.; Li, X.J.; Wang, Z.C.; Tian, C.J. Aggregate-related changes in soil microbial communities under different ameliorant applications in saline-sodic soils. Geoderma 2018, 329, 108–117. [Google Scholar] [CrossRef]
  11. Qadir, M.; Schubert, S.; Badia, D.; Sharma, B.R.; Qureshi, A.S.; Murtaza, G. Amelioration and nutrient management strategies for sodic and alkali soils. CAB Rev. Perspect. Agric. Vet. Sci. Nutr. Natural Resour. 2007, 21, 1–13. [Google Scholar] [CrossRef]
  12. Wang, M.M.; Yang, F.; Ma, H.Y.; Wei, L.X.; Huang, L.H.; Liu, M.; Yang, H.Y.; Li, J.P.; Li, X.W.; Liu, X.L.; et al. Cooperative effects of sand application and flushing during the sensitive stages of rice on its yield in a hard saline-sodic soil. Plant Prod. Sci. 2016, 19, 468–478. [Google Scholar] [CrossRef] [Green Version]
  13. Wang, M.M.; Rengasamy, P.; Wang, Z.C.; Yang, F.; Ma, H.Y.; Huang, L.H.; Liu, M.; Yang, H.Y.; Li, J.P.; An, F.H.; et al. Identification of the most limiting factor for rice yield using soil data collected before planting and during the reproductive stage. Land Degrad Dev. 2018, 29, 2310–2320. [Google Scholar] [CrossRef]
  14. Huang, Z.; Liu, Y.; Cui, Z.; Fang, Y.; He, H.H.; Liu, R.B.; Wu, G.L. Soil water storage deficit of alfalfa (Medicago sativa) grasslands along ages in arid area (China). Field Crops Res. 2018, 221, 1–6. [Google Scholar] [CrossRef]
  15. Qadir, M.; Quillérou, E.; Nangia, V.; Murtaza, G.; Singh, M.; Thomas, R.J.; Drechsel, P.; Noble, A.D. Economics of salt-induced land degradation and restoration. Nat. Resour. Forum. 2014, 38, 282–295. [Google Scholar] [CrossRef]
  16. Abiala, M.A.; Abdelrahman, M.; Burritt, D.J.; Tran, L.-S.P. Salt stress tolerance mechanisms and potential applications of legumes for sustainable reclamation of salt-degraded soils. Land Degrad Dev. 2018, 29, 3812–3822. [Google Scholar] [CrossRef]
  17. Peng, Y.L.; Gao, Z.W.; Gao, Y.; Liu, G.F.; Sheng, L.X.; Wang, D.L. Eco-physiological characteristics of alfalfa seedlings in response to various mixed salt-alkaline stresses. J. Integr. Plant Biol. 2008, 50, 29–39. [Google Scholar] [CrossRef]
  18. Adem, G.D.; Roy, S.J.; Zhou, M.X.; Bowman, J.P.; Shabala, S. Evaluating contribution of ionic, osmotic and oxidative stress components towards salinity tolerance in barley. BMC Plant Biol. 2014, 14, 113. [Google Scholar] [CrossRef] [Green Version]
  19. Lei, Y.T.; Xu, Y.X.; Hettenhausen, C.; Lu, C.K.; Shen, G.J.; Zhang, C.P.; Li, J.; Song, J.; Lin, H.H.; Wu, J.Q. Comparative analysis of alfalfa (Medicago sativa L.) leaf transcriptomes reveals genotype-specific salt tolerance mechanisms. BMC Plant Biol. 2018, 18, 35. [Google Scholar]
  20. Luo, D.; Zhou, Q.; Wu, Y.G.; Chai, X.T.; Liu, W.X.; Wang, Y.R.; Yang, Q.C.; Wang, Z.Y.; Liu, Z.P. Full-length transcript sequencing and comparative transcriptomic analysis to evaluate the contribution of osmotic and ionic stress components towards salinity tolerance in the roots of cultivated alfalfa (Medicago sativa L.). BMC Plant Biol. 2019, 19, 32. [Google Scholar] [CrossRef] [Green Version]
  21. Munns, R. Comparative physiology of salt and water stress. Plant Cell and Environ. 2002, 25, 239–250. [Google Scholar] [CrossRef] [PubMed]
  22. Munns, R.; Tester, M. Mechanisms of salinity tolerance. Annu. Rev. Plant Biol. 2008, 59, 651–681. [Google Scholar] [CrossRef] [PubMed] [Green Version]
  23. Li, R.L.; Shi, F.C.; Fukuda, K.J.; Yang, Y.L. Effects of salt and alkali stresses on germination, growth, photosynthesis and ion accumulation in alfalfa (Medicago sativa L.). Soil Sci. Plant Nutr. 2010, 56, 725–733. [Google Scholar] [CrossRef]
  24. Wang, X.S.; Ren, H.L.; Wei, Z.W.; Wang, Y.W.; Ren, W.B. Effects of neutral salt and alkali on ion distributions in the roots, shoots, and leaves of two alfalfa cultivars with differing degrees of salt tolerance. J. Integr. Agr. 2017, 16, 1800–1807. [Google Scholar] [CrossRef]
  25. An, Y.M.; Song, L.L.; Liu, Y.R.; Shu, Y.J.; Guo, C.H. Denovo transcriptional analysis of alfalfa in response to saline-alkaline stress. Front. Plant Sci. 2016, 7, 931. [Google Scholar] [CrossRef] [PubMed] [Green Version]
  26. Long, R.C.; Sun, H.; Cao, C.Y.; Zhang, T.J.; Kang, J.M.; Wang, Z.; Li, M.N.; Gao, Y.L.; Li, X.; Yang, Q.C. Identification of alkali-responsive proteins from early seedling stage of two contrasting Medicago species by iTRAQ-based quantitative proteomic analysis. Environ. Exp. Bot. 2019, 157, 26–34. [Google Scholar] [CrossRef]
  27. Ashraf, M. Some important physiological selection criteria for salt tolerance in plants. Flora 2004, 199, 361–376. [Google Scholar] [CrossRef]
  28. Ashrafi, E.; Razmjoo, J.; Zahedi, M.; Pessarakli, M. Selecting alfalfa cultivars for salt tolerance based on some physiochemical traits. Agron. J. 2014, 106, 1758–1764. [Google Scholar] [CrossRef]
  29. Hu, G.F.; Liu, Y.M.; Zhang, X.Z.; Yao, F.J.; Huang, Y.; Ervin, E.H.; Zhao, B.Y. Physiological evaluation of alkali-salt tolerance of thirty switchgrass (Panicum virgatum) lines. PLoS ONE 2015, 10, e0125305. [Google Scholar] [CrossRef] [Green Version]
  30. Tavakkoli, E.; Fatehi, F.; Rengasamy, P.; McDonald, G.K. A comparison of hydroponic and soil-based screening methods to identify salt tolerance in the field in barley. J. Exp. Bot. 2012, 63, 3853–3867. [Google Scholar] [CrossRef] [Green Version]
  31. Liu, D.; Liu, M.; Liu, X.L.; Cheng, X.G.; Liang, Z.W. Silicon priming created an enhanced tolerance in alfalfa (Medicago sativa L.) seedlings in response to high alkaline stress. Front. Plant Sci. 2018, 9, 716. [Google Scholar] [CrossRef] [PubMed] [Green Version]
  32. Wang, X.P.; Chen, W.C.; Zhou, Y.; Han, J.Y.; Zhao, J.; Shi, D.; Yang, C. Comparison of adaptive strategies of alfalfa (Medicago sativa L.) to salt and alkali stresses. Aust. J. Crop Sci. 2012, 6, 309–315. [Google Scholar]
  33. Anower, M.R.; Mott, I.W.; Peel, M.D.; Wu, Y.J. Characterization of physiological responses of two alfalfa half-sib families with improved salt tolerance. Plant Physiol. Biochem. 2013, 71, 103–111. [Google Scholar] [CrossRef] [PubMed]
  34. Yin, Z.P.; Zhang, H.; Zhao, Q.; Yoo, M.J.; Zhu, N.; Yu, J.L.; Yu, J.J.; Guo, S.Y.; Miao, Y.C.; Chen, S.X.; et al. Physiological and comparative proteomic analyses of saline-alkali NaHCO3—responses in leaves of halophyte Puccinellia tenuiflora. Plant Soil. 2019, 437, 137–158. [Google Scholar] [CrossRef]
  35. Genc, Y.; Tester, M.; McDonald, G.K. Calcium requirement of wheat in saline and non-saline conditions. Plant Soil. 2010, 327, 331–345. [Google Scholar] [CrossRef]
  36. Wang, X.P.; Geng, S.J.; Ma, Y.Q.; Shi, D.C.; Yang, C.W.; Wang, H. Growth, photosynthesis, solute accumulation, and ion balance of tomato plant under sodium-or potassium-salt stress and alkali stress. Agron. J. 2015, 107, 651–661. [Google Scholar] [CrossRef]
  37. Ashrafi, E.; Razmjoo, J.; Zahedi, M. Effect of salt stress on growth and ion accumulation of alfalfa (Medicago sativa L.) cultivars. J. Plant Nutr. 2018, 41, 818–831. [Google Scholar] [CrossRef]
  38. Yang, C.W.; Chong, J.N.; Li, C.Y.; Kim, C.M.; Shi, D.C.; Wang, D.L. Osmotic adjustment and ion balance traits of an alkali resistant halophyte Kochia sieversiana during adaptation to salt and alkali conditions. Plant Soil. 2007, 294, 263–276. [Google Scholar] [CrossRef]
  39. Khorshidi, M.B.; Yarnia, M.; Hassanpanah, D. Salinity effect on nutrients accumulation in alfalfa shoots in hydroponic condition. J. Food Agric. Environ. 2009, 7, 787–790. Available online: https://www.researchgate.net/publication/255613590_Salinity_effect_on_nutrients_accumulation_in_alfalfa_shoots_in_hydroponic_condition (accessed on 2 January 2020).
  40. Liu, X.L.; Zhang, H.; Jin, Y.Y.; Wang, M.M.; Yang, H.Y.; Ma, H.Y.; Jiang, C.J.; Liang, Z.W. Abscisic acid primes rice seedlings for enhanced tolerance to alkaline stress by upregulating antioxidant defense and stress tolerance-related genes. Plant Soil. 2019, 438, 39–55. [Google Scholar] [CrossRef]
  41. Anower, M.R.; Peel, M.D.; Mott, I.W.; Wu, Y. Physiological processes associated with salinity tolerance in an alfalfa half-sib family. J. Agron. Crop. Sci. 2017, 203, 506–518. [Google Scholar] [CrossRef]
  42. Tavakoli, M.; Poustini, K.; Besharati, H.; Ali, S. Variable salinity responses of 25 alfalfa genotypes and comparative salt-response ion distribution. Russ. J. Plant Physiol. 2019, 66, 231–239. [Google Scholar] [CrossRef]
  43. Bao, A.K.; Guo, Z.G.; Zhang, H.F.; Wang, S.M. A procedure for assessing the salt tolerance of lucerne (Medicago sativa L.) cultivar seedlings by combining agronomic and physiological indicators. N. Z. J. Agr. Res. 2009, 52, 435–442. [Google Scholar]
  44. Majid, M.; Ali, A.; Essia, B. Effect of salinity on sodium and chloride uptake, proline and soluble carbohydrate contents in three alfalfa varieties. Iosr-Javs. 2012, 1, 01–06. [Google Scholar] [CrossRef]
  45. Monirifar, H.; Barghi, M. Identification and selection for salt tolerance in alfalfa (Medicago sativa L.) ecotypes via physiological traits. Not. Sci. Biol. 2009, 1, 63–66. [Google Scholar] [CrossRef] [Green Version]
  46. Wu, G.Q.; Wang, S.M. Calcium regulates K+/Na+ homeostasis in rice (Oryza sativa L.) under saline conditions. Plant Soil Environ. 2012, 58, 121–127. [Google Scholar] [CrossRef] [Green Version]
  47. Wu, D.Z.; Shen, Q.F.; Cai, S.G.; Chen, Z.H.; Dai, F.; Zhang, G.P. Ionomic responses and correlations between elements and metabolites under salt stress in wild and cultivated barley. Plant Cell Physiol. 2013, 54, 1976–1988. [Google Scholar] [CrossRef] [Green Version]
  48. Abdel Latef, A.A.; Tran, L.-S.P. Impacts of priming with silicon on the growth and tolerance of maize plants to alkaline stress. Front. Plant Sci. 2016, 7, 243. [Google Scholar] [CrossRef] [Green Version]
  49. Zhang, J.T.; Mu, C.S. Effects of saline and alkaline stresses on the germination, growth, photosynthesis, ionic balance and anti-oxidant system in an alkali-tolerant leguminous forage Lathyrus quinquenervius. Soil Sci. Plant Nutr. 2009, 55, 685–697. [Google Scholar] [CrossRef]
  50. Guo, R.; Yang, Z.Z.; Li, F.; Yan, C.R.; Zhong, X.L.; Liu, Q.; Xia, X.; Li, H.R.; Zhao, L. Comparative metabolic responses and adaptive strategies of wheat (Triticum aestivum) to salt and alkali stress. BMC Plant Biol. 2015, 15, 170. [Google Scholar] [CrossRef] [Green Version]
  51. Guo, R.; Shi, L.X.; Yan, C.R.; Zhong, X.L.; Gu, F.X.; Liu, Q.; Xia, X.; Li, H.R. Ionomic and metabolic responses to neutral salt or alkaline salt stresses in maize (Zea mays L.) seedlings. BMC Plant Biol. 2017, 17, 41. [Google Scholar]
  52. Wei, L.X.; Lv, B.S.; Wang, M.M.; Ma, H.Y.; Yang, H.Y.; Liu, X.L.; Jiang, C.J.; Liang, Z.W. Priming effect of abscisic acid on alkaline stress tolerance in rice (Oryza sativa L.) seedlings. Plant Physiol. Bioch. 2015, 90, 50–57. [Google Scholar] [CrossRef] [PubMed]
  53. Wei, L.X.; Lv, B.S.; Li, X.W.; Wang, M.M.; Ma, H.Y.; Yang, H.Y.; Yang, R.F.; Piao, Z.Z.; Wang, Z.H.; Lou, J.H.; et al. Priming of rice (Oryza sativa L.) seedlings with abscisic acid enhances seedling survival, plant growth, and grain yield in saline-alkaline paddy fields. Field Crops Res. 2017, 203, 86–93. [Google Scholar] [CrossRef]
  54. Lv, B.S.; Li, X.W.; Ma, H.Y.; Sun, Y.; Wei, L.X.; Jiang, C.J.; Liang, Z.W. Differences in growth and physiology of rice in response to different saline-alkaline stress factors. Agron. J. 2013, 105, 1889. [Google Scholar] [CrossRef]
  55. Carden, D.E.; Walker, D.J.; Flowers, T.J.; Miller, A.J. Single-cell measurements of the contributions of cytosolic Na+ and K+ to salt tolerance. Plant Physiol. 2003, 131, 676. [Google Scholar] [CrossRef] [Green Version]
  56. Sandhu, D.; Cornacchione, M.V.; Ferreira, J.F.; Suarez, D.L. Variable salinity responses of 12 alfalfa genotypes and comparative expression analyses of salt-response genes. Sci. Rep. UK 2017, 7, 42958. [Google Scholar] [CrossRef]
  57. Li, Z.Y.; Zhang, Q.X.; Gong, Z.Y.; Li, Y.; Xu, H.Y.; Wan, X.F.; Bi, S.Y.; Cao, J.; He, F.; Wan, L.Q.; et al. Analysis of morphological and physiological responses to low Pi stress in different alfalfas. Sci. Agric. Sin. 2017, 50, 3898–3907. [Google Scholar]
  58. Shi, D.C.; Zhao, K.F. Effects of NaCl and Na2CO3 on growth of Puccinellia tenuiflora and on present state of mineral elements in nutrient solution. Acta Pratacu. Sin. 1997, 6, 51–61. (in Chinese). [Google Scholar]
  59. Scasta, J.D.; Trostle, C.L.; Foster, M.A. Evaluating alfalfa (Medicago sativa L.) cultivars for salt tolerance using laboratory, greenhouse and field methods. J. Agri. Sci. 2012, 4, 90. [Google Scholar] [CrossRef] [Green Version]
  60. Zahaf, O.; Blanchet, S.; de Zélicourt, A.; Alunni, B.; Plet, J.; Laffont, C.; de Lorenzo, L.; Imbeaud, S.; Ichanté, J.L.; Diet, A.; et al. Comparative transcriptomic analysis of salt adaptation in roots of contrasting Medicago truncatula genotypes. Mol. Plant. 2012, 5, 1068–1081. [Google Scholar] [CrossRef] [Green Version]
  61. Tani, E.; Sarri, E.; Goufa, M.; Asimakopoulou, G.; Psychogiou, M.; Bingham, E.; Skaracis, G.N.; Abraham, E.M. Seedling growth and transcriptional responses to salt shock and stress in Medicago sativa L., Medicago arborea L., and Their Hybrid (Alborea). Agronomy 2018, 8, 231. [Google Scholar] [CrossRef] [Green Version]
  62. Liu, L.; Chen, L.B.; Li, Z.Y.; Wang, M.Z.; Guo, S.J. Effect of temperature in late autumn on free proline, soluble sugar and POD in alfalfa. Pratac. Sci. 2009, 26, 89–93. [Google Scholar]
  63. Bates, L.S.; Waldren, R.P.; Teare, I.D. Rapid determination of free proline for water-stress studies. Plant Soil. 1973, 39, 205–207. [Google Scholar] [CrossRef]
  64. Cui, L. Comprehensive Evalution of saline-alkali resistance and study on physiological adaption mechanism of alfalfa. Master’s Thesis, Inner Mongolia University for Nationalities, Agronomy College, Tongliao, China, 2014. [Google Scholar]
  65. Li, B.; Yu, H.L. Comprehensive evaluation on salt tolerance of different alfalfa varieties under soda salt and alkaline stress. Acta Agrestia. Sin. 2017, 25, 204–208. [Google Scholar]
  66. Xiong, X.; Gui, W.Y.; Liu, M.H.; Chen, J.H.; Zhang, Y.J. Evaluation of salt tolerance in different alfalfa under uniform and non-uniform salt stress. Acta Pratacu. Sin. 2018, 27, 67–76. [Google Scholar]
  67. Miao, L.H.; Yuan, Q.H.; Wang, Y. Evaluation on salt tolerance of 41 alfalfa varieties at seedling stage. Seed 2016, 35, 81–84. [Google Scholar]
  68. Wang, R.F.; Wang, T.M.; Jin, X.M.; Lu, X.S. Evaluation of salt tolerance of 11 approved alfalfa cultivars at seed germination stage. Pratac. Sci. 2012, 29, 213–218. (in Chinese). [Google Scholar]
  69. Ventroni, L.M.; Volenec, J.J.; Cangiano, C.A. Fall dormancy and cutting frequency impact on alfalfa yield and yield components. Field Crops Res. 2010, 119, 252–259. [Google Scholar] [CrossRef]
  70. Veatch, M.E.; Smith, S.E.; Vandemark, G. Shoot biomass production among accessions of exposed to NaCl. Crop Sci. 2004, 44, 1008–1013. [Google Scholar] [CrossRef] [Green Version]
  71. Rumbaugh, M. Effects of population density on some components of yield of alfalfa1. Crop Sci. 1963, 3. [Google Scholar]
  72. Brown, P.; Tanner, C.B. Alfalfa stem and leaf growth during water stress1. Agron. J. 1983, 75, 799–805. [Google Scholar] [CrossRef]
  73. Rengel, Z. Role of calcium in aluminum toxicity. New Phytol. 1992, 121, 499–513. [Google Scholar] [CrossRef]
  74. Suarez, D.L.; Grieve, C.M. Predicting cation ratios in corn from saline solution composition. J. Exp. Bot. 1988, 39, 605–612. [Google Scholar] [CrossRef]
  75. Lynch, J.; Läuchli, A. Salinity affects intracellular calcium in corn root protoplasts. Plant Physiol. 1988, 87, 351–356. [Google Scholar] [CrossRef] [PubMed] [Green Version]
  76. Zhu, J.K.; Shi, J.; Singh, U.; Wyatt, S.E.; Bressan, R.A.; Hasegawa, P.M.; Carpita, N.C. Enrichment of vitronectin- and fibronectin-like proteins in NaCl-adapted plant cells and evidence for their involvement in plasma membrane-cell wall adhesion. Plant J. 1993, 3, 637–646. [Google Scholar] [CrossRef]
  77. Bernstein, N.; Silk, W.K.; Läuchli, A. Growth and development of sorghum leaves under conditions of NaCl stress: possible role of some mineral elements in growth inhibition. Planta 1995, 196, 699–705. [Google Scholar] [CrossRef]
  78. Walter, J.; Edwards, J.; McDonald, G.; Kuchel, H. Photogrammetry for the estimation of wheat biomass and harvest index. Field Crops Res. 2018, 216, 165–174. [Google Scholar] [CrossRef]
  79. Vadez, V.; Krishnamurthy, L.; Serraj, R.; Gaur, P.M.; Upadhyaya, H.D.; Hoisington, D.A.; Varshney, R.K.; Turner, N.C.; Siddique, K.H.M. Large variation in salinity tolerance in chickpea is explained by differences in sensitivity at the reproductive stage. Field Crops Res. 2007, 104, 123–129. [Google Scholar] [CrossRef] [Green Version]
  80. Bernstein, L.; Francois, L.E. Leaching requirement studies: sensitivity of alfalfa to salinity of irrigation and drainage waters. Soil Sci. Soc. Am. J. 1973, 37, 931–943. [Google Scholar] [CrossRef]
  81. Guo, Z.G.; Liu, H.X.; Wang, S.M.; Tian, F.P.; Cheng, G.D. Biomass, persistence and drought resistance of nine lucerne varieties in the dry environment of west China. Aust. J. Exp. Agr. 2005, 45, 59–64. [Google Scholar] [CrossRef]
  82. Fricke, W.; Akhiyarova, G.; Veselov, D.; Kudoyarova, G. Rapid and tissue-specific changes in ABA and in growth rate in response to salinity in barley leaves. J. Exp. Bot. 2004, 55, 1115–1123. [Google Scholar] [CrossRef]
  83. Passioura, J.B. Scaling up: the essence of effective agricultural research. Funct. Plant Biol. 2010, 37, 585–591. [Google Scholar] [CrossRef]
  84. Sairam, R.K.; Rao, K.V.; Srivastava, G.C. Differential response of wheat genotypes to long term salinity stress in relation to oxidative stress, antioxidant activity and osmolyte concentration. Plant Sci. 2002, 163, 1037–1046. [Google Scholar] [CrossRef]
  85. Dubey, R.S.; Singh, A.K. Salinity induces accumulation of soluble sugars and alters the activity of sugar metabolising enzymes in rice plants. Biol. Plantarum. 1999, 42, 233–239. [Google Scholar] [CrossRef]
  86. Yu, P.J.; Liu, S.W.; Xu, Q.; Fan, G.H.; Huang, Y.X.; Zhou, D.W. Response of soil nutrients and stoichiometric ratios to short-term land use conversions in a salt-affected region, northeastern China. Ecol. Eng. 2019, 129, 22–28. [Google Scholar] [CrossRef]
  87. Chen, Z.H.; Zhou, M.X.; Newman, I.A.; Mendham, N.J.; Zhang, G.P.; Shabala, S. Potassium and sodium relations in salinised barley tissues as a basis of differential salt tolerance. Funct. Plant Biol. 2007, 34, 150–162. [Google Scholar] [CrossRef]
  88. Fakhrfeshani, M.; Shahriari-Ahmadi, F.; Niazi, A.; Moshtaghi, N.; Zare-Mehrjerdi, M. The effect of salinity stress on Na+, K+ concentration, Na+/K+ ratio, electrolyte leakage and HKT expression profile in roots of Aeluropus littoralis. J. Plant Mol. Breeding. 2015, 3, 1–10. [Google Scholar]
  89. Hauser, F.; Horie, T. A conserved primary salt tolerance mechanism mediated by HKT transporters: A mechanism for sodium exclusion and maintenance of high K+/Na+ ratio in leaves during salinity stress. Plant Cell Environ. 2010, 33, 552–565. [Google Scholar] [CrossRef]
  90. Shabala, S.; Cuin, T.A. Potassium transport and plant salt tolerance. Physiol. Plant. 2008, 133, 651–669. [Google Scholar] [CrossRef]
  91. Maas, E.V.; Grieve, C.M. Sodium-induced calcium deficiency in salt-stressed corn. Plant Cell Environ. 1987, 10, 559–564. [Google Scholar]
Figure 1. The stem length (SL) (A) and shoot dry mass (SDM) (B) of 50 alfalfa cultivars field-grown in nonsaline-alkaline (NSA) (open bar) soils and saline-alkaline (SA) (solid bar) soils during the seedling stage. The line represents the SA-tolerance coefficient (SATC). Values are the means of absolute values, n = 3.
Agronomy 10 00191 g001
Figure 2. The shoot soluble sugar content (SS) (A) and shoot proline content (PRO) (B) of 50 alfalfa cultivars field-grown in nonsaline-alkaline (NSA) (open bar) soil and saline–alkaline (SA) (solid bar) soils during the seedling stage. The line represents the saline-alkaline-tolerance coefficient (SATC). Values are the means of absolute values, n = 3.
Agronomy 10 00191 g002
Figure 3. The K+, Na+, Ca2+, and Mg2+ contents (A–D) and the ratios of K+, Ca2+, and Mg2+ to Na+ (E–G) in the shoots of 50 alfalfa cultivars field-grown in nonsaline-alkaline (NSA) (open bar) soils and saline-alkaline (SA) (solid bar) soils during the seedling stage. The line represents saline-alkaline-tolerance coefficient (SATC). Values are the means of absolute values, n = 3.
Agronomy 10 00191 g003
Figure 4. Clustering of the saline-alkaline (SA) tolerance in the 50 alfalfa cultivars based on the two methods. (A) Traditional method, (B) New method.
Agronomy 10 00191 g004
Figure 5. The saline-alkaline-tolerance coefficients (SATCs) of stem length (SL) (A,C) and shoot dry mass (SDM) (B,D) in different categories based on two methods. (A,B) Traditional method. (C,D) New method. Abbreviations: SL, stem length; SDM, shoot dry mass.
Agronomy 10 00191 g005
Table 1. Soil characteristics of the two land types on which 50 cultivars of alfalfa were grown in the field.
TreatmentpHEC CO32−HCO3-ClSO42−Na+Mg2+K+Ca2+OrganicAvailableAvailableAvailable
(μS cm−1)(mg kg−1)(mg kg−1)(mg kg−1)(mg kg−1)(mg kg−1)(mg kg−1)(mg kg−1)(mg kg−1)Matter (%)N (mg kg−1)P (mg kg−1)K (mg kg−1)
NSA7.73166.500.00368.40126.6097.80105.8016.1016.20118.003.2073.9015.00139.10
SA9.09347.220.00633.20192.30316.80502.6012.704.7051.601.1025.5027.2060.50
NSA, SA represent nonsaline-alkaline soil (nonalkaline salt-affected crop field), saline-alkaline soil (alkaline salt-affected crop field), respectively. EC represents electrical conductivity.
Table 2. Growth and physiological characteristics of alfalfa (Medicago sativa L.) under two treatments.
TreatmentSLSDMSSPRONa+K+Ca2+Mg2+K+/Na+Ca2+/Na+Mg2+/Na+
(cm)(g plant−1)(%)(mg g−1)(mg g−1)(mg g−1)(mg g−1)(mg g−1)ratioratioratio
NSA21.010.173.250.124.2314.6819.715.794.395.591.61
SA17.13 *0.13 *7.52 *0.29 *8.18 *21.56 *10.62 *4.31 *5.05 NS1.36 *0.55 *
NSA, SA, SL, SDM, SS, and PRO represent nonsaline-alkaline soil (nonalkaline salt-affected crop field), saline-alkaline soil (alkaline salt-affected crop field), stem length, shoot dry mass, shoot soluble sugar content, and shoot proline content, respectively. * represents significant difference at P = 0.05. NS represents no significant difference at P = 0.05. Values are the means of absolute values under two treatments.
Table 3. Contributions of the saline-alkaline-tolerance coefficients (SATCs) of growth and physiological indices to the D-value based on stepwise regression under two methods.
Traditional MethodNew Method
IndicesR2IndicesR2
[SL]67.90%[Ca2+/Na+]62.50%
[PRO]13.60%[SL]43.40%
[K+/Na+]25.60%[Mg2+]3.20%
[SDM]43.50%[Ca2+]55.00%
[SS]18.20%[SDM]16.70%
[K+]19.20%[PRO]8.60%
[Na+]15.20%[Na+]28.20%
[SL] + [PRO]82.80%[SS]13.90%
[SL] + [PRO] + [K+/Na+]89.70%[K+]9.40%
[SL] + [PRO] + [K+/Na+] + [SDM]96.20%[Ca2+/Na+] + [SL]84.30%
[SL] + [PRO] + [K+/Na+] + [SDM] + [SS]99.00%[Ca2+/Na+] + [SL] + [Mg2+]91.40%
[SL] + [PRO] + [K+/Na+] + [SDM] + [SS] + [K+]99.40%[Ca2+/Na+] + [SL] + [Mg2+] + [Ca2+]96.60%
[SL] + [PRO] + [K+/Na+] + [SDM] + [SS] + [K+] + [Na+]99.90%[Ca2+/Na+] + [SL] + [Ca2+] + [Mg2+] + [SDM]97.70%
____[Ca2+/Na+] + [SL] + [Ca2+] + [Mg2+] + [SDM] + [PRO]99.00%
____[Ca2+/Na+] + [SL] + [Ca2+] + [Mg2+] + [SDM] + [PRO] + [Na+]99.30%
____[Ca2+/Na+] + [SL] + [Ca2+] + [Mg2+] + [SDM] + [PRO] + [Na+] + [SS]99.80%
____[Ca2+/Na+] + [SL] + [Ca2+] + [Mg2+] + [SDM] + [PRO] + [Na+] + [SS] + [K+]99.90%
The [SL], [SDM], [SS], [PRO], [K+], [Na+], [Ca2+], [Mg2+], [K+/Na+], [Ca2+/Na+], and [Mg2+/Na+] represent the SATC of stem length, the SATC of shoot dry mass, the SATC of shoot soluble sugar content, the SATC of shoot proline content, the SATCs of shoot Na+, K+, Ca2+, Mg2+, K+/Na+ ratio, Ca2+/Na+ ratio, and Mg2+/Na+ ratio, respectively. Abbreviations: SL, stem length; SDM, shoot dry mass; SS, shoot soluble sugar content; PRO, shoot proline content.

