Article

Higher Radiation Use Efficiency Produces Greater Biomass Before Heading and Grain Yield in Super Hybrid Rice

1
Jiangsu Provincial Key Lab for Solid Organic Waste Utilization, Nanjing Agricultural University, Nanjing 210095, China
2
College of Resources and Environment, Huazhong Agricultural University, Wuhan 430070, China
*
Author to whom correspondence should be addressed.
Agronomy 2020, 10(2), 209; https://doi.org/10.3390/agronomy10020209
Submission received: 15 January 2020 / Revised: 28 January 2020 / Accepted: 30 January 2020 / Published: 2 February 2020

Abstract

:
To reveal the physiological mechanism underlying the yield advantage of super hybrid rice compared with inbred super rice, a super hybrid rice cultivar Yliangyou 3218 (YLY) and an inbred super rice cultivar Zhendao 11 (ZD) were field grown under five nitrogen (N) fertilizer rates in 2016 and 2017. The average grain yield of YLY across nitrogen fertilizer rates was 10.1 t ha−1 in 2016 and 9.7 t ha−1 in 2017, 29.6% and 21.3% higher than that of ZD in 2016 and 2017, respectively. YLY showed higher above-ground biomass accumulation, especially growth before heading, which was mainly due to its faster green leaf area index (GLAI) formation and greater maximum GLAI (GLAImax). The daily radiation interception (RIdaily) was 15.0% higher in YLY than ZD, but the accumulated radiation interception (RIacc) before heading showed little difference between them because ZD had a longer growth duration. The radiation use efficiency (RUE) of YLY before heading was 54.7% higher than that of ZD (YLY, 2.12 g MJ−1; ZD, 1.37 g MJ−1). Our result demonstrated that the yield advantage of YLY was due to its higher above-ground biomass before heading, which was mainly achieved by its improvement in RUE rather than radiation interception.

1. Introduction

Rice is the main staple food in the world. To meet the substantial increases in food demand due to the rapidly increasing population, rice yield needs to improve further. China, one of the largest rice producers, has successfully increased rice yield through genetic improvement and improved crop management practices [1,2,3]. However, compared with a 3.7% yearly yield increase in 1980s, the increment dropped to 0.9% in 1990s [4]. In order to break the yield ceiling, a “super rice” mega-project was established in 1996 in China [5]. Today, 131 “super” rice varieties have been released. Moreover, a yield more than 12 t ha−1 was found in the field experiments which adopted these varieties [6].
Many studies have been carried out to explore the mechanism underlying the high yield potential of “super” rice [7,8,9]. Compared with ordinary rice varieties, “super” rice varieties have a larger panicle size [10,11], larger green leaf area, longer leaf area duration [4], higher leaf photosynthesis rate [12], greater above-ground biomass [9] and improved root physiological traits [7]. However, it is argued that enhanced properties at the organ level would lead to increased crop yield. For example, Alex et al. [13] found that the enhancement of single leaf photosynthesis had no impact on canopy photosynthesis, which could be explained by the complexity of canopy light interception influenced by canopy structure. Therefore, more information about the characteristics of rice canopy is needed to interplay why “super” rice varieties achieved higher yield.
It is well known that accumulated intercepted radiation (RIacc) and radiation use efficiency (RUE) are key indicators of canopy properties for determining crop biomass [14]. RIacc is explained by the total photosynthetically active radiation (PAR) during crop growth and the fractional PAR intercepted by the crop canopy each day (f) [15]. Little attention was paid to prolonging rice growth duration since recent durations allow multiply cropping within a year considering limited arable land area [16]. Thus, increased rice growth is not a feasible way to improve radiation interception. Green leaf area index of the canopy is a key determiner influencing f [17]. RUE is the slope of linear regression between crop biomass and RIacc, which is determined by canopy photosynthesis [14]. Limited studies have dealt with the relative importance of RIacc and RUE for yield formation. Katsura et al. [18] reported that high rice yield potential was mainly achieved by intense RIacc. Huang et al. [19] indicate that higher RUE rather than RIacc contributed more to yield improvement. This inconsistency may be explained by different cultivars used, various nutrition status. More importantly, the relative contribution of RIacc and RUE to yield improvement is growth stage dependent because RIacc or RUE is not consistent during the whole crop growth period. For example, Clerget et al. [20] observed that rice RUE from emergence to flowering was 1.75 g MJ−1, and it increased to 2.48 g MJ−1 during linear grain filling stage, which resulted in a RUE value of 1.34 g MJ−1 during the whole rice growth duration. Obviously, it is not appropriate to explore the relative importance of radiation component (e.g., RIacc and RUE) only using an integrate value. Alternatively, biomass formation during different stages and under different nitrogen rates should be dealt with separately.
The most crucial growth stage related with rice grain yield varied due to genotypic variation or environmental effects. A number of studies indicated the importance of biomass production after heading [19,21], but Katsura et al. [18] stressed the importance of a higher growth rate during two weeks before full heading. Therefore, it is necessary to elucidate the most crucial growth stage related with rice yield as well as gain further understanding of the relative contribution of RIacc and RUE to yield improvement of “super” rice.
As mentioned above, most of the previous studies compared “super” hybrid rice varieties with traditional hybrid rice varieties or their low yield parent varieties [4,7,9,10,11,12]. In our view, comparing the difference between “super” hybrid rice and inbred super rice is more helpful for understanding the mechanism underlying high yield potential of “super” hybrid rice. Therefore, in the present study, one “super” hybrid rice Yliangyou 3218 (YLY) was compared to one inbred super rice Zhendao 11 (ZD). The objectives of this study were to (1) investigate the yield performance of YLY and ZD; (2) examine the most crucial growth stage determining the yield difference between YLY and ZD; (3) explore whether RIacc or RUE plays a major role in determining the yield difference between super hybrid rice and inbred super rice.

2. Materials and Methods

2.1. Experimental Setup and Design

Field experiments were carried out in 2016 and 2017 in Rugao County (32°26′24″N, 120°29′24″E), Jiangsu Province, China. The chemical properties of the upper soil (0–20 cm) were as follows: pH 7.54, organic matter 20.2 g kg−1, total N 1.97 g kg−1, Olsen-P 10.8 mg kg−1, NH4OAc-K 92.0 mg kg−1. A split-plot design with three replicates was used in the experiments: N rates were the main plots and cultivars were the subplots. The five N treatments were as follows: N0 (0 kg N ha−1), N90 (90 kg N ha−1), N180 (180 kg N ha−1), N270 (270 kg N ha−1), N360 (360 kg N ha−1). N fertilizer supplied as urea was used on four application dates: 40% as basal fertilizer, 20% at mid-tillering stage (MT), 20% at panicle initiation stage (PI), 20% at spikelet differentiation stage. Phosphorus (75 kg P2O5 ha−1) and potassium (90 kg N ha−1) were supplied equally for all treatments. Phosphorus fertilizer supplied as calcium superphosphate was used as basal fertilizer and potassium fertilizer supplied as potassium chloride was used at the basal and panicle initiation stage at a ratio of 1:1. Yliangyou 3218 (YLY, super hybrid rice) and Zhendao 11 (ZD, inbred super rice) were used in this study. YLY (Y58S × Xianghui 3218) is an indica hybrid cultivar developed in 2005. ZD (ZD88 × Wuyunjing 8) is a conventional japonica cultivar developed in 2004. The individual plot size was 25 m2. Pre-germinated seeds were sown in the seedbed one month prior to transplanting. Uniform seedlings were selected for transplanting at a hill spacing of 20 × 14 cm with two seedlings per hill on 22 June 2016 and 20 June 2017. Weed, pest and disease were controlled according to local agricultural practices for rice production.

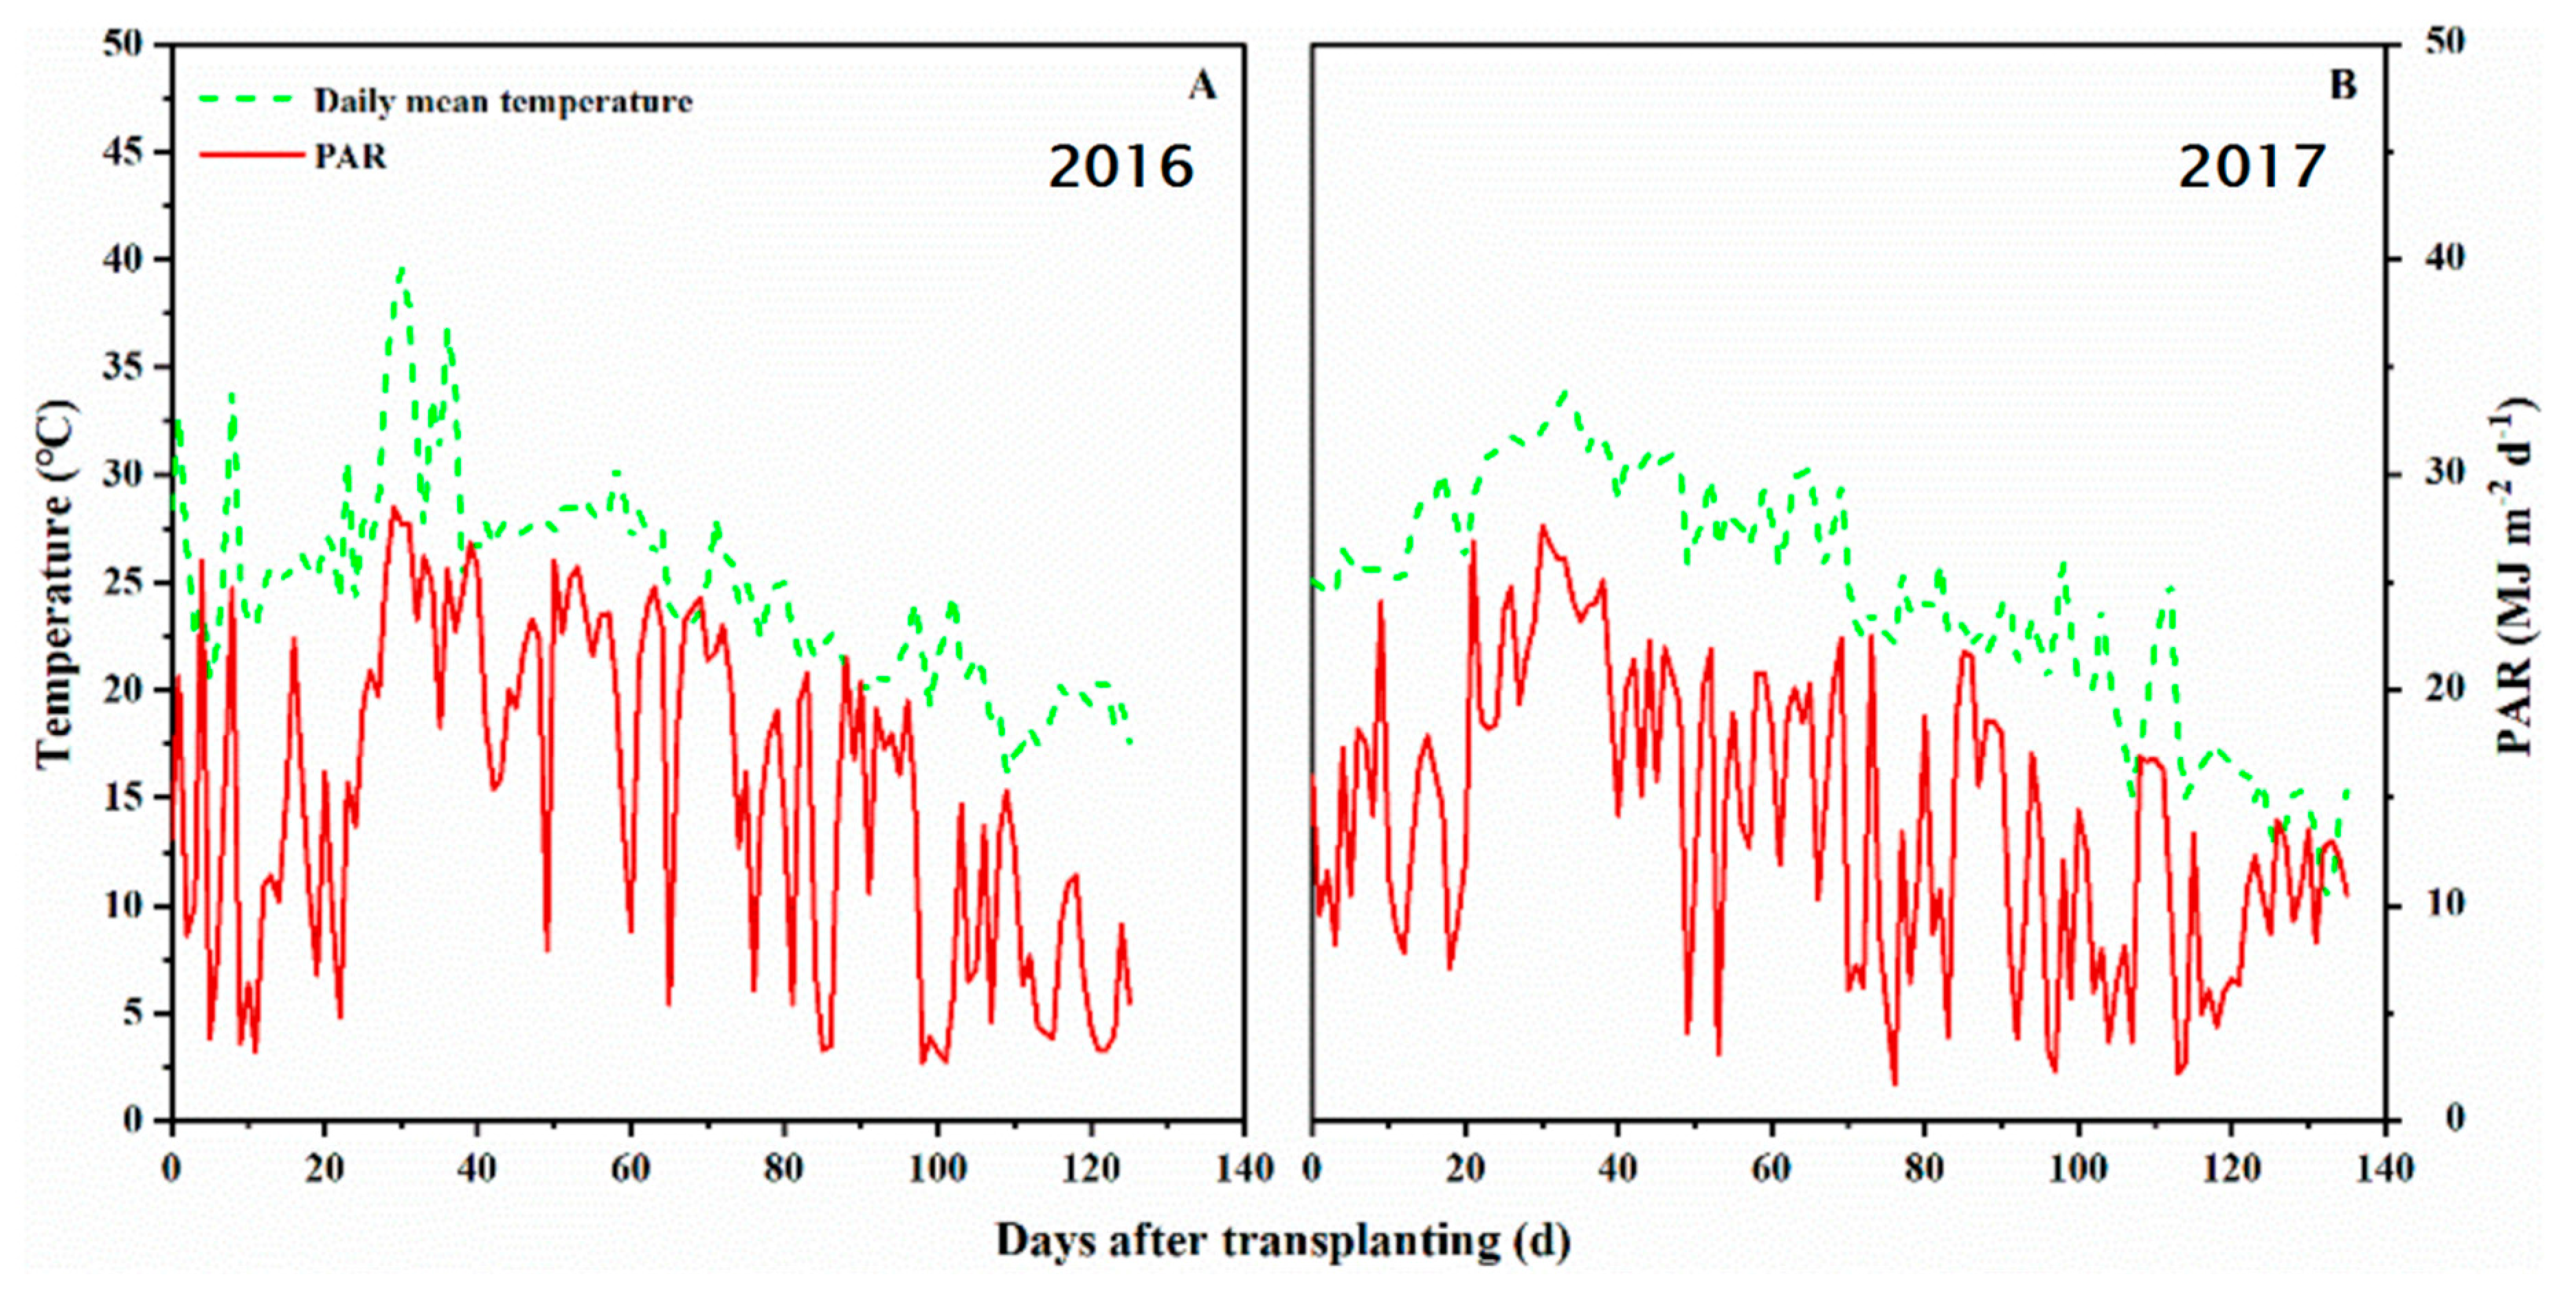
2.2. Meteorological Conditions

A meteorological station located next to the field was used to record air temperature (℃), rainfall (mm), and photosynthetic active radiation (MJ m−2). Thermal times (TT, °Cd) were estimated by daily mean temperature n days after transplanting (Tan):
TT= (Ta1−Tb)+(Ta2−Tb)+(Ta3−Tb)+...+(Tan−Tb)
where Tb was the base temperature when crop growth could be negligible. For rice, Tb was 10 °Cd according to previous studies [22,23].

2.3. Plant Sampling and Measurements

2.3.1. Green Leaf Area Index and Above-Ground Biomass

Green leaf area index was determined by a plant canopy analyzer (PCA, LAI-2200C, LI-COR, Lincoln, NE, USA) at MT, PI and heading stages (HD). Meanwhile, six hills of plants were harvested from each plot, and then these plants were separated into two or three parts: leaf, stem and panicles. Samples were dried with an oven until a stable dry weight was attained.

2.3.2. Estimation of the Growth Pattern of Green Leaf Area

As suggested by Yin et al. [24], a beta growth function was used to fit the dynamics of green leaf area index:
GLAI = GLAImax × [1 + (te − t)/(te − tm)] × (t/te)^[te/(te − tm)]
where t is thermal days (°Cd), te (°Cd) represents the time when the growth of green leaf area ended, and tm (°Cd) is the time at which a maximum green leaf area index was obtained. GLAImax (m2 m-2) is the green leaf area index at te. The maximal growth rate of green leaf area (Cm, m2 m-2 ℃d-1) was calculated as follows:
Cm = (2te − tm)/[te × (te − tm)] × (tm/te) × [tm/(te − tm)] × GLAImax

2.3.3. Fractional PAR Interception (f) and Light Extinction Coefficient (k)

When GLAI determination was completed, measurements of photosynthetic active radiation (PAR) above and below the canopy were conducted with a 1m line quantum sensor (MQ-306, APOGEE, North Logan, UT, USA) from 11:00 to 13:00 in order to estimate fractional PAR interception (f). PAR was recorded at least 10 locations in each plot. The f was estimated as follows:
f = (PAR1-PAR2)/PAR1
where PAR1 is PAR above the canopy and PAR2 is PAR below the canopy. The relationship between GALI and f can be described with an asymptotic equation:
f =1 − e^(−k × GLAI)
where k is the light extinction coefficient, an indicator of canopy structure, which can be solved with the known value of f and GLAI. In the current study, there was no difference in k values among treatments, therefore an averaged k (e.g., 0.428) of all the treatments was used.

2.3.4. Light Interception and Radiation Use Efficiency (RUE)

As mentioned above, photosynthetic active radiation was recorded and daily radiation interception (PARa) was calculated based on it:
PARa = PAR × [1 − e^(−k × GLAI)]
The reflection of PAR by rice canopy was neglected. The sum of PARa was the accumulated PAR interception (RIacc) at given growth period. As shown in Equation 6, PARa calculation requires daily values of GLAI, in the present study, GLAI was measured at given periods as previous studies did. Thus, daily values of GLAI was estimated from transplanting to HD by the Equation 2 in 2016 and a linear decay of GLAI from HD to PM was assumed (Figure S1). There was not enough sampling data for non-linear fitting in 2017 as 2016 did, instead, a linear behavior of GLAI from MT to HD was assumed according to Cosentino et al. [25]. Further, the slope of linear relationship between RIacc and AM was RUE.

2.3.5. Leaf Net Photosynthesis Rate (A)

Leaf net photosynthesis rate was measured during tillering and panicle initiation stage in 2017, using a portable infrared gas analysis system (Li-6400XT, Li-Cor Inc., Lincoln, NE, USA) with an integrated leaf chamber fluorometer (Li-6400-40, Li-Cor Inc., Lincoln, NE, USA). At least six newly expanded leaves for N0 and N180 treatments were selected for measurements from 9:00 to 15:00 on sunny days. The measurement conditions were as follows: photosynthetic photon flux density (PPFD), 1500 μmol m−2 s−1; CO2 concentration (Ca), 400 μmol mol−1 air; leaf temperature, 30 °C; relative humidity, 50–60%; and flow rate, 500 μmol s−1. A (μmol CO2 m−2 s−1) was recorded when it reached a steady state, which usually takes 5–10 min.

2.3.6. Yield and Yield Components

At the maturity stage (PM), the grain yield was estimated from a 5 m2 area plants in the central part of each plot and adjusted to a 14% water content. Then, 12 hill plants in each plot were collected to determine the above-ground biomass and yield components (panicles per hectare, spikelets per panicle, grain filling percentage and 1000-grain weight). The filled grains and unfilled grains were distinguished by winnowing, and the grain filling percentage was the ratio of filled grains to the sum of spikelets.

2.4. Statistical Analysis

Analysis of variance (ANOVA) was used to analyze the data by SPSS 18.0 (SPSS, Chicago, IL, USA), and the significant difference between cultivars and nitrogen treatments within a cultivar was accessed by the least significant difference (LSD) test (p < 0.05). Model fitting to determine parameters associated with the dynamics of green leaf area index was conducted by OriginPro 8.0 software (OriginLab Corporation, Northampton, MA, USA).

3. Results

3.1. Climatic Conditions

As shown in Figure 1, climatic conditions in 2016 and 2017 were similar. For YLY, the accumulated temperature during the rice growth season in 2016 and 2017 were 1826.5 and 1907.1 °C, respectively; for ZD, they were 1872.6 and 1963.1 °C, respectively. The photosynthetic active radiation during rice growth period for YLY were 1892.8 and 1775.9 MJ m−2 in 2016 and 2017, respectively; for ZD, they were 1818.1 and 1924.6 MJ m−2, respectively.

3.2. Yield and Yield components

Across two cultivars, nitrogen fertilizer demonstrated a significant enhancement of grain yield in both 2016 and 2017. Meanwhile, YLY and ZD achieved maximum yield at different N rates, i.e., for ZD it was achieved at about 180 kg ha−1 N, but the grain yield of YLY did not increase significantly when N rate was above 90 kg ha−1 (Figure S2). When compared the yield between these two cultivars, it was found that YLY had a yield advantage than ZD. In 2016, the grain yield of YLY was 16.0% to 46.7% higher than that of ZD at different N rates. Similarly, the yield increment was 4.3% to 41.1% in 2017 (Table 1).
When considering the yield components, the higher grain yield of YLY compared with ZD was mainly due to significant increase in panicles ha−1 and spikelets panicle−1. As for the grain filling percentage and 1000-grain weight, they were higher in ZD than YLY in 2016. However, no significant difference was observed in 2017 (Table 1).

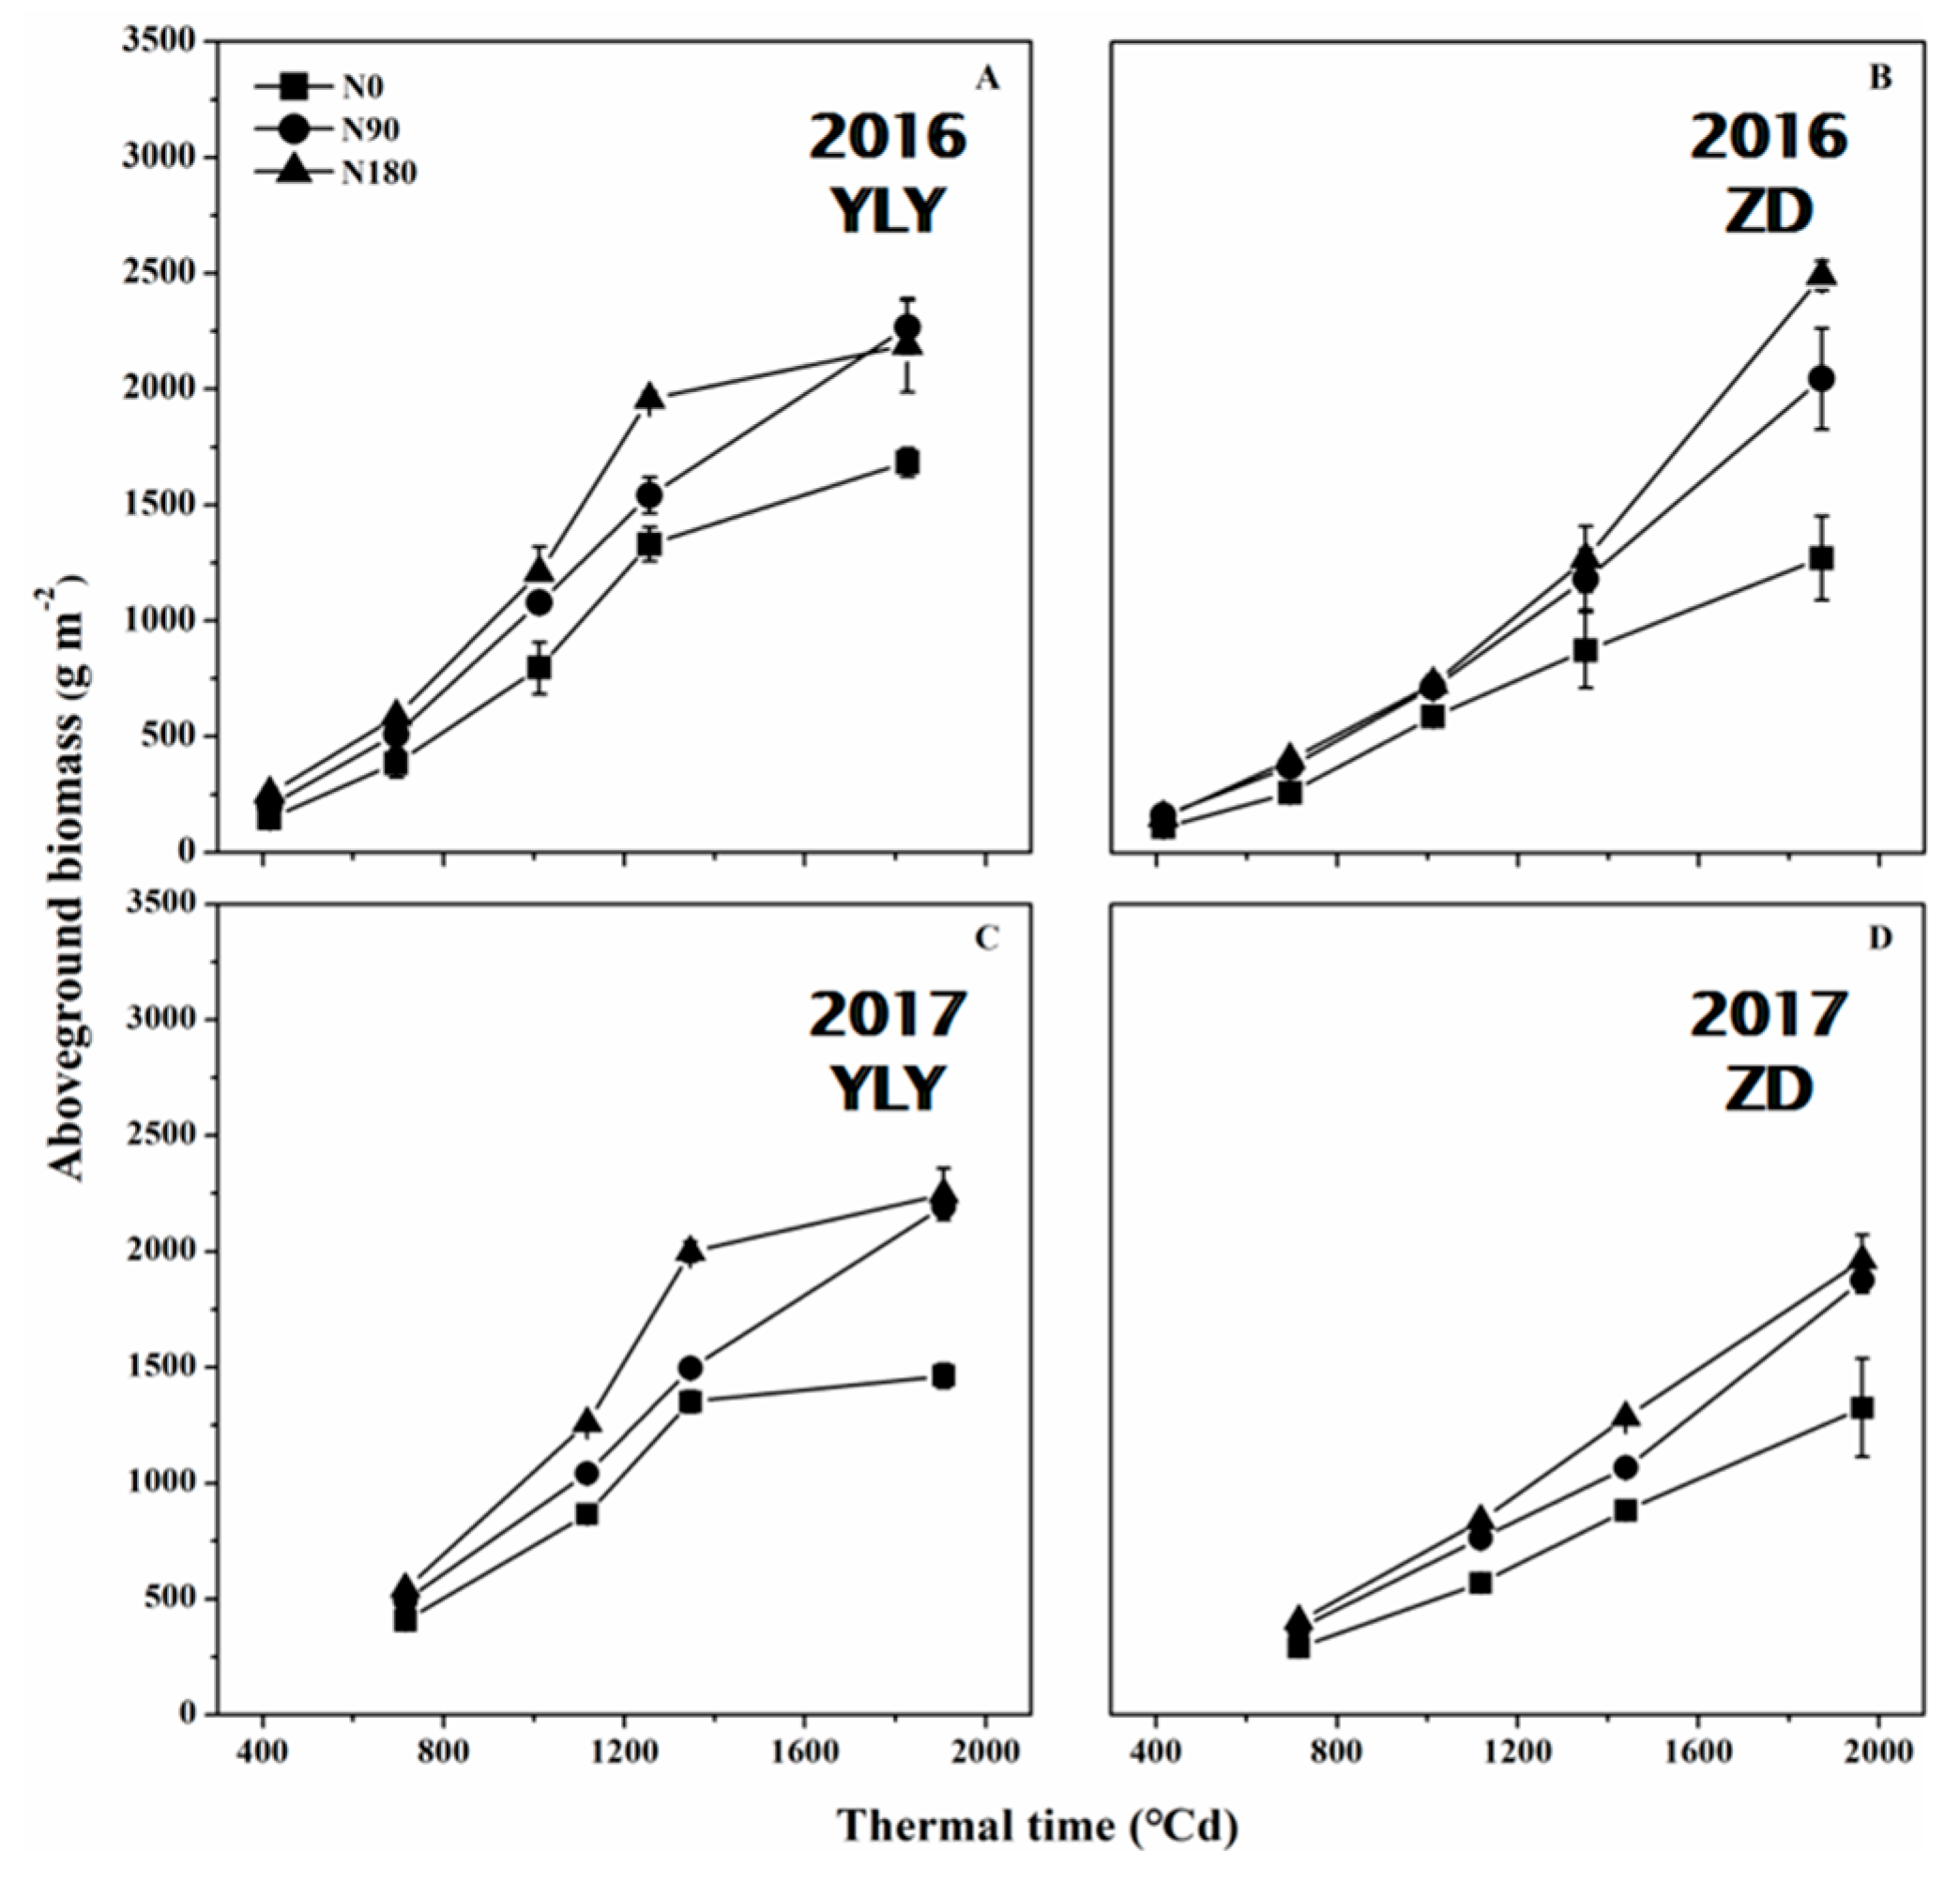
3.3. Above-Ground Biomass (AM)

For each rice cultivar, above-ground biomass increased with the increasing application of N fertilizer either in 2016 or 2017. After averaging above-ground biomass across different growth stages and all N treatments, the annual above-ground biomass of YLY increased by 37.5% relative to that of ZD. As for the growth before heading, the above-ground biomass increment was 47.4%. Moreover, no significant difference was found between 2016 and 2017 in the above-ground biomass of each rice cultivar for all N rates (Figure 2; Table S1).

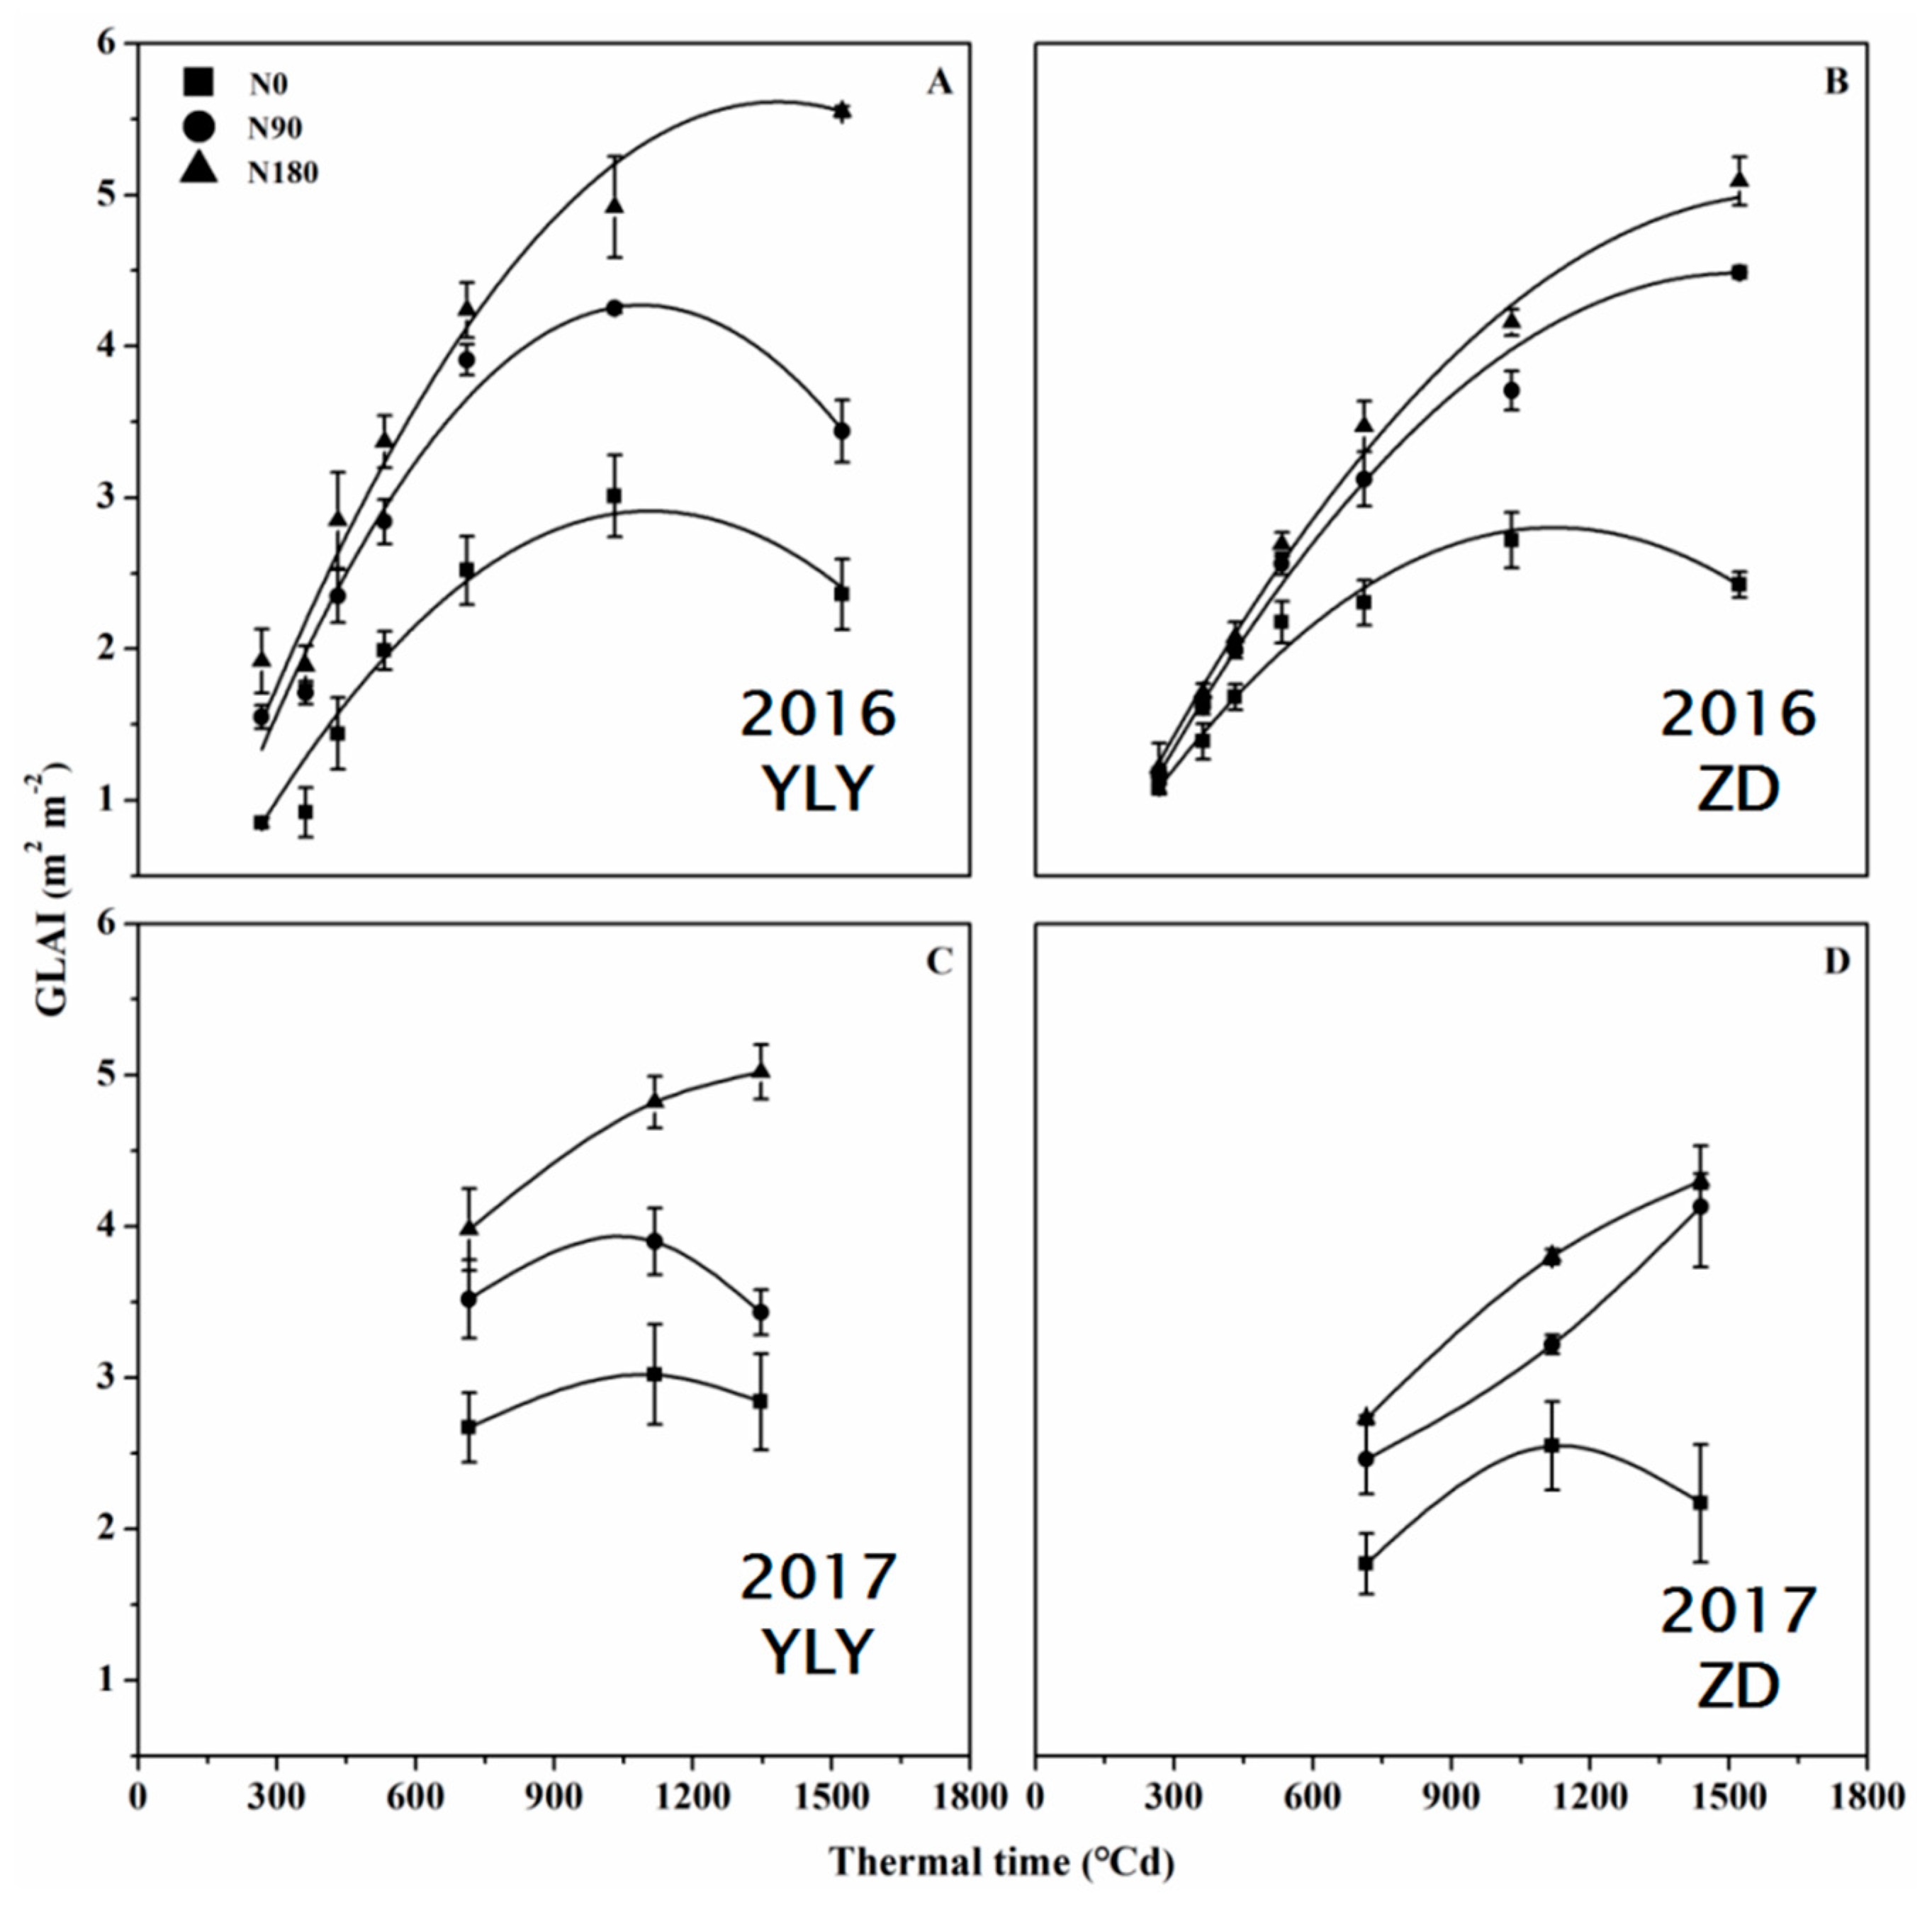
3.4. Green Leaf Area Index (GLAI) and Fractional PAR Interception (f)

As shown in Figure 3, GLAI increased significantly due to increasing N application rate in 2016 and 2017 for each cultivar. When considering the GLAI difference between ZD and YLY, it was found that GLAI of YLY averaged across different N rates and sampling dates was 35.2% higher than that of ZD in 2016, and the GLAI enhancement was 26.2% in 2017 (Table S2). Then GLAI dynamics in 2016 was fitted by the beta function, as shown in Table 2 and at least 91% variation could be explained by this equation. The maximum GLAI (GLAImax) decreased due to limited N supply. The GLAImax averaged across nitrogen rates in YLY was 10.7% higher than that of ZD. The time when maximum of green leaf area index is reached (te) was delayed because of increasing N rate in ZD, however, the opposite trend was found in YLY. The te averaged across nitrogen rates in YLY and ZD was 1226 and 1403 ℃d, respectively. Increased nitrogen supply delayed the time at which the maximum growth rate is achieved tm in both cultivars. The tm averaged across nitrogen rates in YLY and ZD was 256 and 346 ℃d, respectively. Irrespective of cultivars, enhanced nitrogen supply improved the maximum growth rate of green leaf area Cm. Moreover, Cm in YLY was consistently higher than that in ZD (Table S3).
Similar to GLAI, f was restricted due to N deprivation for each year and both cultivars (Figure 4). After averaging data across different sampling dates and N rates, the average f of YLY increased by 19.3% and 10.4% compared with those of ZD in 2016 and 2017, respectively (Table S4).

3.5. Radiation Interception and Radiation-Use Efficiency (RUE)

For both cultivars within each year, an increasing trend was found for accumulated radiation interception (RIacc) with elevated nitrogen supply. RUE was estimated from the slope of the linear relationship between RIacc and AM, which shown that the average RUE across N rates and experiment years of YLY and ZD was 2.12 and 1.37 g MJ−1, respectively. The RUE averaged across cultivars and N rates in 2017 was slightly higher than that in 2016 (Figure 5).

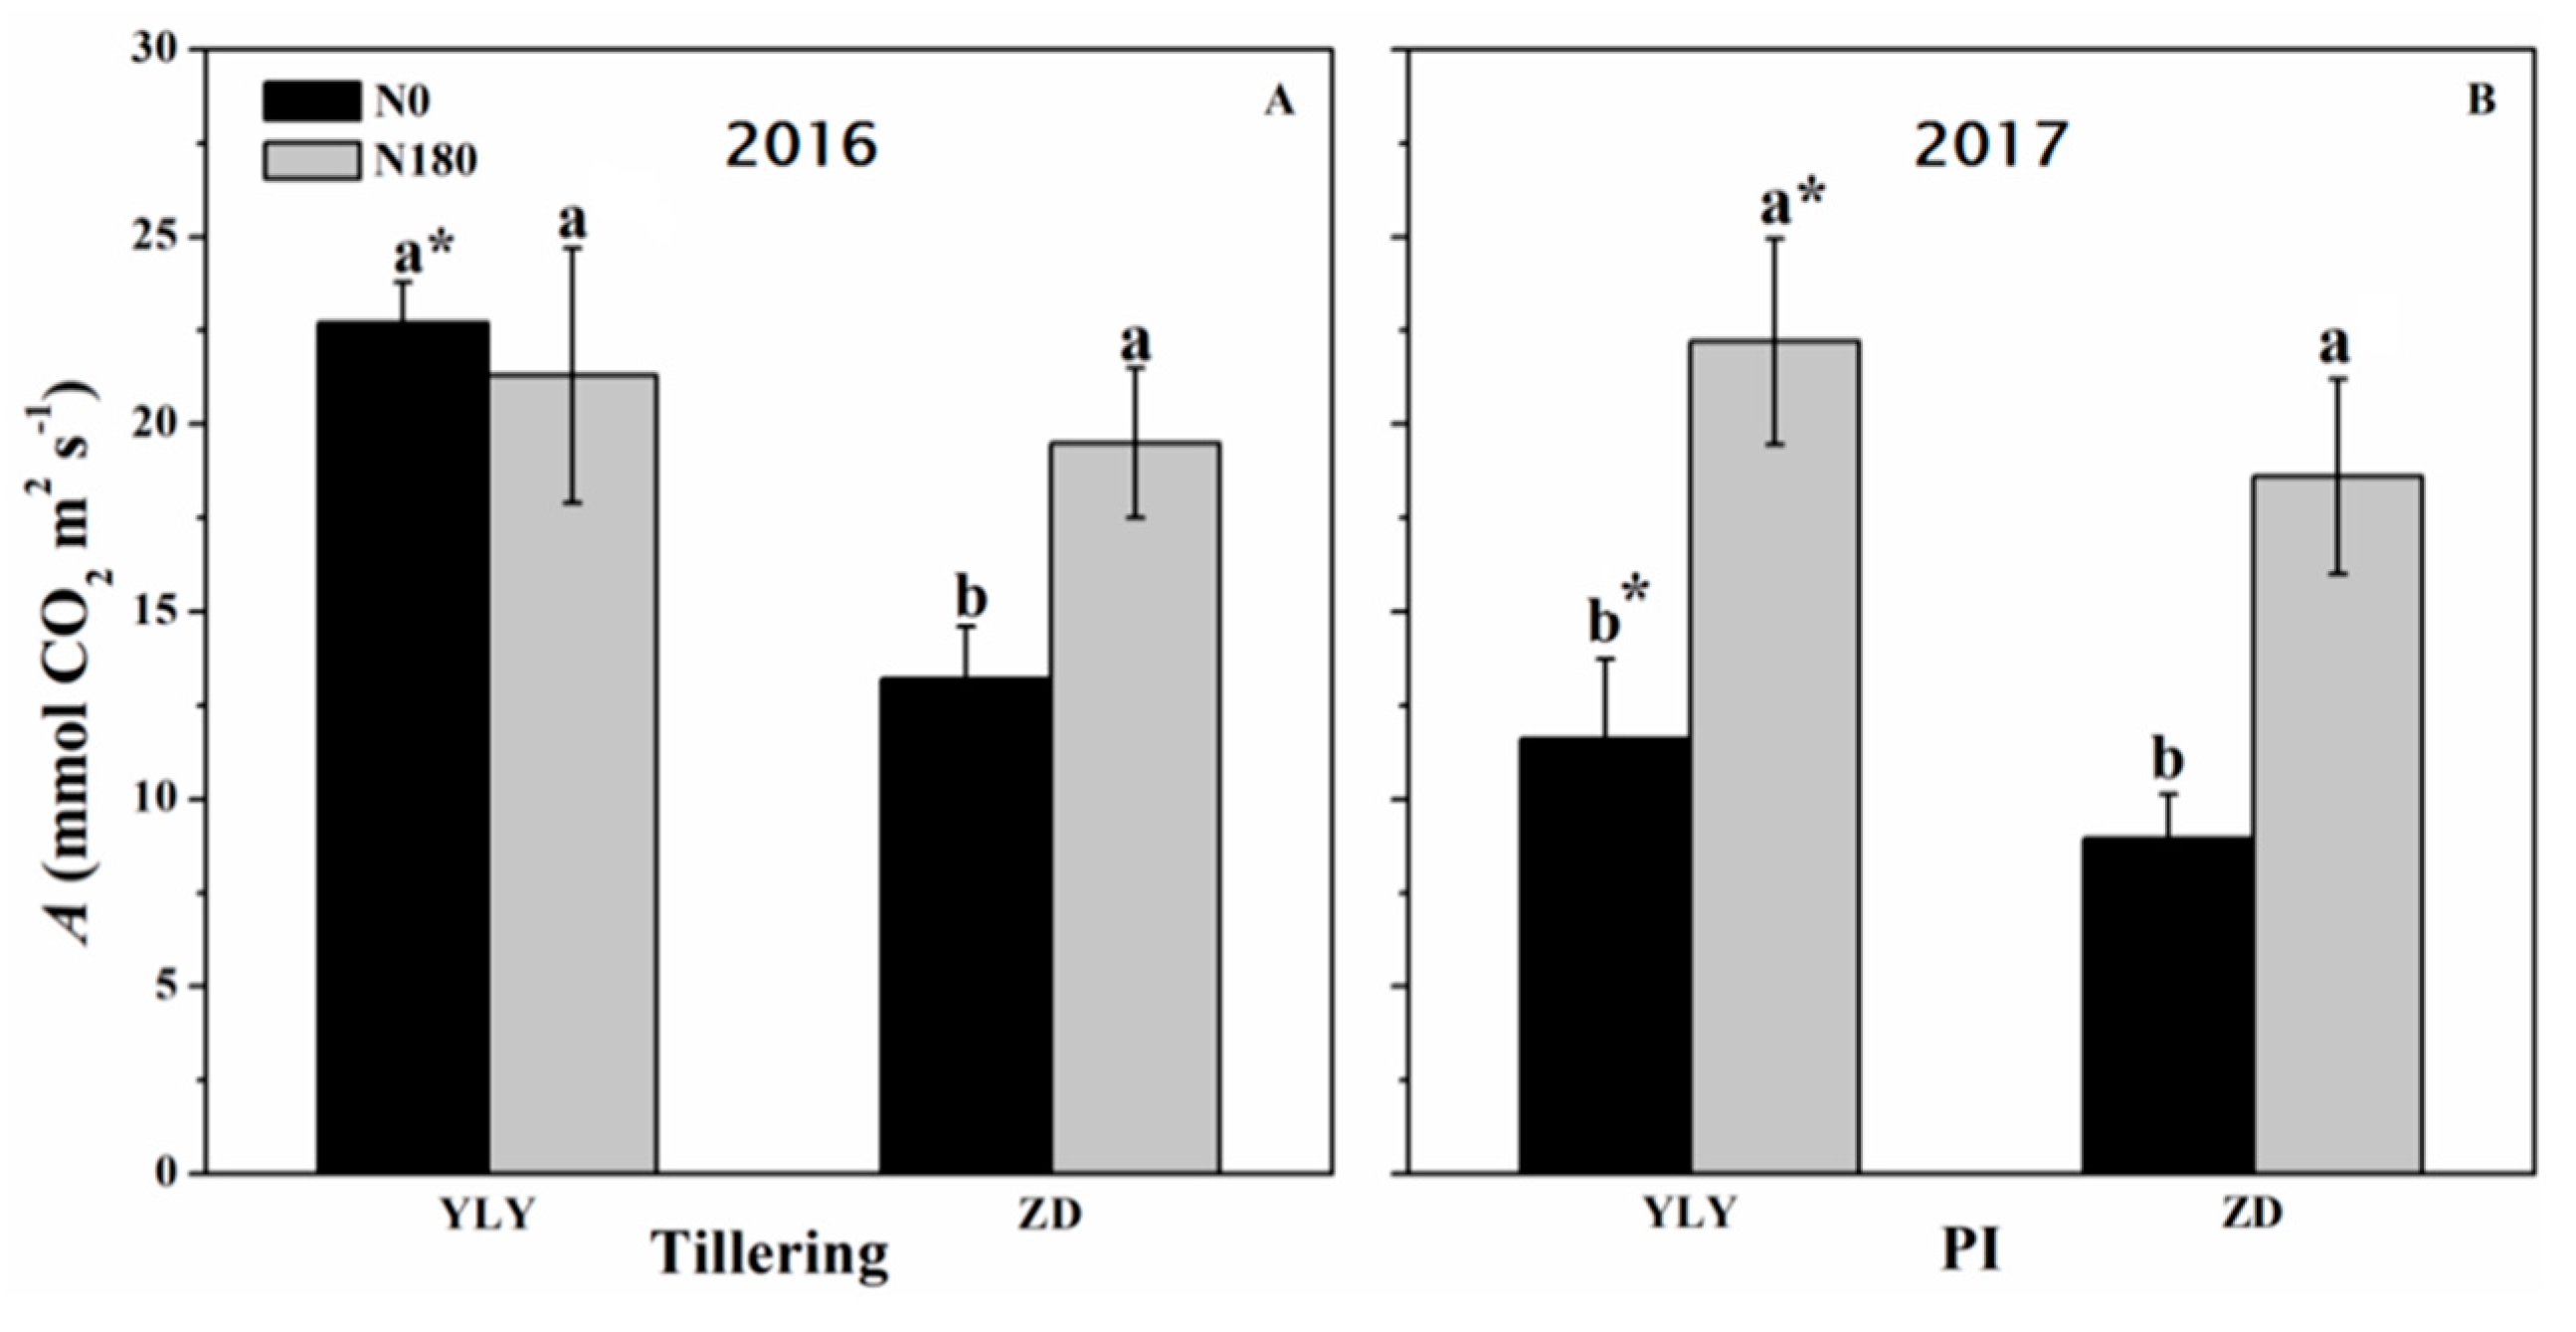
3.6. Leaf Net Photosynthesis Rate (A)

Leaf net photosynthesis rate (A) was enhanced by increased N supply in most cases (Figure 6). During tillering stage, A of YLY was significantly higher than that of ZD under N0 treatment. However, there was no difference between these two cultivars under N180 treatment. During the panicle initiation stage, irrespective of N rates, A of YLY was consistently superior to that of ZD.

4. Discussion

RIacc or RUE: what contributed more to greater biomass accumulation and yield of YLY?
In our study, YLY achieved 4.1–51.4% higher grain yield than ZD across nitrogen rates and years (Table 1). This result confirmed superior yield potential of super hybrid rice in previous studies [26,27]. In terms of yield components (number of panicles, spikelet per panicle, weight of 1000 spikelet and spikelet sterility), it was found that the yield superiority of YLY compared with ZD mainly resulted from the spikelet per panicle, which was consistent with previous studies [26,27]. Besides sink size, source-related characteristics, such as greater biomass accumulation and higher leaf area index after heading are also important for yield potential of super rice achievement [10,28,29]. Our data also confirmed these with respect to source traits as mentioned above (Figure 3 and Figure 4). And averaged across nitrogen rates (N0, N90 and N180) the HI of YLY were 0.564 and 0.567 in 2016 and 2017, and the corresponding values of ZD were 0.513 and 0.520 (Figure S3). This finding was in line with Mae et al. [30], who reported that a large-grain rice cultivar, Akita 63 characterized as high sink capacity (the number of spikelets per unit land area × grain size) exhibited a high HI. It is demonstrated that temporal development of biomass gain (e.g., growth rate) fluctuates largely due to variation in canopy photosynthesis, therefore biomass increment during different stages varies [31], indicating that the contribution of rice growth during different stages to final grain yield is not equal. Our analysis found that rice yield was more dependent on biomass growth before heading rather than after heading in both years (Figure 7), and a similar result was observed by Takai et al. [32].
The yield difference between YLY and ZD was determined by biomass growth before heading, and the biomass improvement in YLY is related to its larger N accumulation and higher nitrogen utilization efficiency (Table S5), which was consistent with Huang et al. [33]. Biomass production is dependent on RIacc and RUE. Then we further analyze RIacc and RUE of these two cultivars during rice growth stages. The results found that daily radiation interception (RIdaily) and RUE of YLY was both enhanced compared with that of ZD (Figure 5 and Figure S3). To better explain the relationship between radiation component (RIacc and RUE) and yield, the beta growth function was used to fitting the green leaf area growth, and the function explained green leaf area growth perfectly (Table 2). According to the results of simulation, the enhanced RIdaily was mainly achieved by faster growth rate of green leaf area (e.g., smaller tm and larger Cm) given that no significant difference exists in the values of light extinction coefficient (k) between cultivars or N rates. Similar values of k demonstrate that the canopy structure of these two cultivars showed little difference, and previous studies also reported that prevailing rice cultivars are close to the optimum canopy structure due to the ideotype approach [6,19,34]. Furtrher, many studies have shown that k was not influenced by nutrition status, such as nitrogen and phosphorous deficiency [15,35]. Because GLAI was observed discontinuously in the present study, simulated GLAI from the beta growth function was used to recalculate RIacc and RUE, and the simulated RUE predicted RUE well (Figure S5). The results found that although the RIdaily was improved in YLY compared with ZD, the RIacc of the former was equal to the latter before heading, because the growth duration of ZD was longer than YLY (Tables S6 and S7). Because of the delayed growth of green leaf area (e.g., larger te, Table 2), the RIacc in ZD after heading was larger than that in YLY. The growth duration may be explained by genotype difference and environmental condition of the experiment site. As suggested by Yoshida [36], indica genotypes prefer warmer conditions compared with japonica genotypes. Thus, the low temperature during the end of rice growth season induced earlier senescence in YLY, and a similar result was found in Wei et al. [27]. As for RUE, the averaged value across N rates in ZD before heading was 1.33 g MJ−1 and in YLY was 2.12 g MJ−1, which was close to the values reported by previous studies (Table S6). The increased RUE in YLY may be attributed to its larger leaf photosynthesis rate during panicle initiation stage (Figure 6). Considering the complexity of canopy structure, the improved leaf photosynthesis may not necessarily result in increased canopy photosynthesis. To gain a comprehensive understanding of the mechanism of RUE, canopy photosynthesis during the whole rice growth season needs to be investigated. Observed and simulated data both showed that the enhancement of RUE was consistently larger than that of RIacc (Figure 5 and Figure S4). Thus, it is reasonable to draw the conclusion that the biomass enhancement of YLY compared to ZD was mainly achieved by RUE improvement, indicating that yield superiority of YLY was more closely related with RUE. A cross location analysis stated that the rice yield over a wide range of regions was more dependent on RIacc than RUE although they admit that RUE improvement is a feasible way to yield promotion based on a nearly a twofold variation in RUE (e.g., 0.99–1.88 g MJ−1) [37]. As discussed above, there exists large variation in RUE during the whole rice growth period, and using an integrated RUE to represent the rice canopy RUE may miss some important information. Take our study for example, the RUE value of the whole season in YLY and ZD showed no difference according to our simulation (Table S6), but it is not reasonable to draw the conclusion that rice yield is more dependent on RIacc since RUE values before heading between these two cultivars indeed had significant difference. In the present study, we stated that RUE improvement was more related to rice yield potential achievement, but we have to admit that the results obtained here may be limited by the specific environmental conditions and cultivars. Cross location studies should be implemented to better understand the most crucial determinants of rice yield potential.

5. Conclusions

Super hybrid rice YLY showed a higher grain yield than inbred super rice ZD. The yield advantage of YLY was mainly achieved by greater above-ground biomass production before heading, larger sink size as showing more spikelets per panicle. Considering the larger increment of RUE than RIacc when comparing the difference between YLY and ZD, we draw the conclusion that the RUE contributed more to yield improvement than RIacc.

Supplementary Materials

The following are available online at https://www.mdpi.com/2073-4395/10/2/209/s1, Figure S1. Schematic representation of the calculation of simulated GLAI for rice from transplanting to maturity in 2016; Figure S2. Estimation of the minimum amount of nitrogen fertilizer for the highest yield of YLY and ZD using the model of linear plus platform.; Figure S3. The harvest index (HI) of YLY and ZD averaged across N0, N90 and N180 in 2016 and 2017; Figure S4. Normalized value of growth rate (GR), daily radiation interception (RIdaily) and radiation use efficiency (RUE) of YLY relative to ZD for the different nitrogen treatments in 2016 and 2017; Figure S5. The relationship between predicted RUE derived from simulated GLAI and observed RUE calculated with field-observed GLAI in 2016. The solid line is the 1:1 line and the dashed line is the fitted linear regression. Table S1 ANOVA analyses of above-ground biomass (AM) in 2016 and 2017.; Table S2 ANOVA analyses of green leaf area index (GLAI) in 2016 and 2017; Table S3 ANOVA analyses of parameters of green leaf area growth in 2016; Table S4 ANOVA analyses of fractional PAR interception (f) in 2016 and 2017; Table S5 Nitrogen accumulation (Nacc), aboveground biomass (AM) and nitrogen utilization efficiency (NUtE) from transplanting to heading in 2016 and 2017.; Table S6 Accumulated radiation interception (RIacc), daily radiation interception (RIdaily) and radiation use efficiency (RUE) estimated by green leaf area index (GLAI) derived from leaf growth function in 2016; Table S7 The growth stages for YLY and ZD at Rugao County, Jiangsu Province, China in 2016 and 2017.

Author Contributions

Y.P. undertook the field sampling, analysis and manuscript preparation; S.G. assisted with filed sampling and analysis of 2016; X.M. and S.W. assisted with sampling analysis of 2017; K.X., J.L. and Z.L. provided manuscript editorial support. S.G. conducted experiment design and data analysis. All authors have read and agreed to the published version of the manuscript.

Funding

This work was supported by the Young Elite Scientists Sponsorship Program by CAST (2018QNRC001), the Innovative Research Team Development Plan of the Ministry of Education of China (IRT_17R56) and the Fundamental Research Funds for the Central Universities (KYT201802).

Acknowledgments

We thank Yan Zhang and Haifei Jia for help with field experiments.

Conflicts of Interest

The authors declare no conflict of interest.

References

  1. Khush, G. Green revolution: The way forward. Nat. Rev. Genet. 2001, 2, 815–822. [Google Scholar] [CrossRef] [PubMed]
  2. Peng, S.; Buresh, R.J.; Huang, J.; Zhong, X.; Zou, Y.; Yang, J.; Wang, G.; Liu, Y.; Hu, R.; Tang, Q.; et al. Improving nitrogen fertilization in rice by site-specific N management. A review. Agron. Sustain. Dev. 2010, 30, 649–656. [Google Scholar] [CrossRef]
  3. Yang, J.; Zhang, J.; Liu, L.; Wang, Z.; Zhu, Q. Carbon remobilization and grain filling in japonica/indica hybrid rice subjected to post-anthesis water deficits. Agron. J. 2002, 94, 102–109. [Google Scholar] [CrossRef]
  4. Katsura, K.; Maeda, S.; Horie, T.; Shiraiwa, T. Analysis of yield attributes and crop physiological traits of Liangyoupeijiu, a hybrid rice recently bred in China. Field Crops Res. 2007, 103, 170–177. [Google Scholar] [CrossRef]
  5. Cheng, S.; Zhuang, J.; Fan, Y.; Du, J.; Cao, L. Progress in research and development on hybrid rice: A super-domesticate in China. Ann. Bot. 2007, 100, 959–966. [Google Scholar] [CrossRef]
  6. Peng, S.; Khush, G.S.; Virk, P.; Tang, Q.; Zou, Y. Progress in ideotype breeding to increase rice yield potential. Field Crops Res. 2008, 108, 32–38. [Google Scholar] [CrossRef]
  7. Zhang, H.; Xue, Y.; Wang, Z.; Yang, J.; Zhang, J. Morphological and physiological traits of roots and their relationships with shoot growth in “super” rice. Field Crops Res. 2009, 113, 10–40. [Google Scholar] [CrossRef]
  8. Zhang, Y.; Tang, Q.; Zou, Y.; Li, D.; Qin, J.; Yang, S.; Chen, L.; Xia, B.; Peng, S. Yield potential and radiation use efficiency of super hybrid rice grown under subtropical conditions. Field Crops Res. 2009, 114, 91–98. [Google Scholar] [CrossRef]
  9. Xiong, J.; Ding, C.Q.; Wei, G.B.; Ding, Y.F.; Wang, S.H. Characteristic of dry-matter accumulation and nitrogen-uptake of super-high-yielding early rice in China. Agron. J. 2013, 105, 1142–1150. [Google Scholar] [CrossRef]
  10. Xu, Z.J.; Chen, W.F.; Huang, R.D.; Zhang, W.Z.; Ma, D.R.; Wang, J.Y.; Xu, H.; Zhao, M.H. Genetical and physiological basis of plant type model of erect and large panicle Japonica super rice in Northern China. Agric. Sci. China 2010, 9, 457–462. [Google Scholar] [CrossRef]
  11. Huang, M.; Zou, Y.B.; Jiang, P.; Xia, B.; Ibrahim, M.; Ao, H.J. Relationship between grain yield and yield components in super hybrid rice. Agric. Sci. China 2011, 10, 1537–1544. [Google Scholar] [CrossRef]
  12. Lv, C.G.; Li, X.; Chen, G.X. Photosynthetic characteristics and its physiological basis of super high-yielding hybrid rice Liangyoupeijiu. Sci. Agric. Sin. 2017, 50, 4055–4070. (In Chinese) [Google Scholar]
  13. Alex, W.; Al, D.; Farquhar, G.D.; Hammer, G.L. Simulating daily field crop canopy photosynthesis: An integrated software package. Funct. Plant Biol. 2018, 45, 362–377. [Google Scholar]
  14. Monteith, J.L. Climate and the efficiency of crop production in Britain. Philos. T. Roy. Soc. London, Ser.B. 1977, 281, 277–294. [Google Scholar]
  15. Sandaña, P.; Ramírez, M.; Pinochet, D. Radiation interception and radiation use efficiency of wheat and pea under different P availabilities. Field Crops Res. 2012, 127, 44–50. [Google Scholar] [CrossRef]
  16. Mitchell, P.L.; Sheehy, J.E. Supercharging rice photosynthesis to increase yield. New Phytol. 2006, 171, 688–693. [Google Scholar] [CrossRef]
  17. Massignam, A.; Chapman, S.; Hammer, G.; Fukai, S. Physiological determinants of maize and sunflower grain yield as affected by nitrogen supply. Field Crops Res. 2009, 113, 256–267. [Google Scholar] [CrossRef]
  18. Katsura, K.; Maeda, S.; Lubis, I.; Horie, T.; Cao, W.; Shiraiwa, T. The high yield of irrigated rice in Yunnan, China: ‘a cross-location analysis’. NJAS-Wagen. J. Life Sc. 2008, 107, 1–11. [Google Scholar]
  19. Huang, L.; Yang, D.; Li, X.; Peng, S.; Wang, F. Coordination of high grain yield and high nitrogen use efficiency through large sink size and high post-heading source capacity in rice. Field Crops Res. 2019, 233, 49–58. [Google Scholar] [CrossRef]
  20. Clerget, B.; Bueno, C.; Quilty, J.R.; Correa, T.Q.; Sandro, J. Modifications in development and growth of a dual-adapted tropical rice variety grown as either a flooded or an aerobic crop. Field Crops Res. 2014, 155, 134–143. [Google Scholar] [CrossRef]
  21. Murchie, E.H.; Yang, J.; Hubbart, S.; Horton, P.; Peng, S. Are there associations between grain-filling rate and photosynthesis in the flag leaves of field-grown rice? J. Exp. Bot. 2002, 53, 2217–2224. [Google Scholar] [CrossRef] [PubMed]
  22. Ahmad, S.; Ghulam, A.; Mukhtar, A.; Zartash, F.; Muhammad, A.A.; Ghulam, R.; Muhammad, A.K.; Gerrit, H. Climate warming and management impact on the change of phenology of the rice-wheat cropping system in Punjab, Pakistan. Field Crops Res. 2019, 230, 46–61. [Google Scholar] [CrossRef]
  23. Islam, M.R.; Sikder, S. Phenology and degree days of rice cultivars under organic culture. Bangladesh J. Bot. 2011, 40, 149–153. [Google Scholar] [CrossRef] [Green Version]
  24. Yin, X.; Goudriaan, J.; Lantinga, E.A.; Vos, J.; Spiertz, H.J. A flexible sigmoid function of determinate growth. Ann. Bot. 2003, 91, 361–371. [Google Scholar] [CrossRef]
  25. Cosentino, S.L.; Patanè, C.; Sanzone, E.; Testa, G.; Scordia, D. Leaf gas exchange, water status and radiation use efficiency of giant reed (Arundo donax L.) in a changing soil nitrogen fertilization and soil water availability in a semi-arid Mediterranean area. Eur. J. Agron. 2016, 72, 56–69. [Google Scholar] [CrossRef]
  26. Wei, H.H.; Meng, T.Y.; Li, C.; Xu, K.; Huo, Z.Y.; Wei, H.Y.; Guo, B.W.; Zhang, H.C.; Dai, Q.G. Comparisons of grain yield and nutrient accumulation and translocation in high-yielding japonica/indica hybrids, indica hybrids, and japonica conventional varieties. Field Crops Res. 2017, 204, 101–109. [Google Scholar] [CrossRef]
  27. Wei, H.Y.; Hu, L.; Zhu, Y.; Xu, D.; Zheng, L.M.; Chen, Z.F.; Hu, Y.J.; Cui, P.Y.; Guo, B.W.; Dai, Q.G.; et al. Different characteristics of nutrient absorption and utilization between inbred japonica super rice and inter-sub-specific hybrid super rice. Field Crops Res. 2018, 218, 88–96. [Google Scholar] [CrossRef]
  28. Jiang, G.; Guo, J.; Meng, Q.; Chen, Y.; Wang, H.; Hu, Z.; Kuang, T. Genes differentially expressed under photoinhibition stress in flag leaves of superhybrid rice Liangyoupeijiu (Oryza sativa) and their genetic origins. Photosynthetica 2005, 43, 231–236. [Google Scholar] [CrossRef]
  29. Wei, H.; Zhang, H.; Blumwald, E.; Li, H.; Cheng, J.; Dai, Q.; Huo, Z.; Xu, K.; Guo, B. Different characteristics of high yield formation between inbred japonica super rice and inter-sub-specific hybrid super rice. Field Crops Res. 2016, 198, 179–187. [Google Scholar] [CrossRef]
  30. Mae, T.; Inaba, A.; Kaneta, Y.; Masaki, S.; Sasaki, M.; Aizawa, M.; Okawa, S.; Hasegawa, S.; Makino, A. A large-grain rice cultivar, akita 63, exhibits high yields with high physiological n-use efficiency. Field Crops Res. 2006, 97, 227–237. [Google Scholar] [CrossRef]
  31. Xue, W.; Lindner, S.; Dubbert, M.; Otieno, D.; Ko, J.; Muraoka, H.; Werner, C.; Tenhunen, J. Supplement understanding of the relative importance of biophysical factors in determination of photosynthetic capacity and photosynthetic productivity in rice ecosystems. Agr. Forest Meteorol. 2017, 232, 550–565. [Google Scholar] [CrossRef]
  32. Takai, T.; Matsuura, S.; Nishio, T.; Ohsumi, A.; Shiraiwa, T.; Horie, T. Rice yield potential is closely related to crop growth rate during late reproductive period. Field Crops Res. 2006, 96, 328–335. [Google Scholar] [CrossRef]
  33. Huang, L.Y.; Sun, F.; Yuan, S.; Peng, S.B.; Wang, F. Different mechanisms underlying the yield advantage of ordinary hybrid and super hybrid rice over inbred rice under low and moderate N input conditions. Field Crops Res. 2018, 216, 150–157. [Google Scholar] [CrossRef]
  34. Qin, J.; Impa, S.M.; Tang, Q.; Yang, S.; Yang, J.; Tao, Y.; Jagadish, K.S.V. Integrated nutrient water and other agronomic options to enhance rice grain yield and N use efficiency in double-season rice crop. Field Crops Res. 2013, 148, 15–23. [Google Scholar] [CrossRef]
  35. Salvagiotti, F.; Miralles, D.J. Radiation interception, biomass production and grain yield as affected by the interaction of nitrogen and sulfur fertilization in wheat. Eur. J. Agron. 2008, 28, 282–290. [Google Scholar] [CrossRef]
  36. Yoshida, S. Fundamentals of Rice Crop Science, 1st ed.; IRRI: Los IRRI, Los Banos, Philippines, 1981; pp. 69–81. [Google Scholar]
  37. Huang, M.; Shan, S.; Cao, F.; Zou, Y. The solar radiation-related determinants of rice yield variation across a wide range of regions. NJAS-Wagen. J. Life Sc. 2016, 78, 123–128. [Google Scholar] [CrossRef]
Figure 1. Daily mean temperature and photosynthetic active radiation (PAR) during rice growth season at Rugao County, Jiangsu Province, China in 2016 (A) and 2017 (B).
Agronomy 10 00209 g001
Figure 2. Above-ground biomass (AM) of YLY (A,C) and ZD (B,D) as a function of thermal time under different N treatments in 2016 (A,B) and 2017 (C,D). Vertical bars represent standard derivation (S.D.) of the mean (n = 3) where these exceed the size of the symbol.
Agronomy 10 00209 g002
Figure 3. Green leaf area index (GLAI) of YLY (A,C) and ZD (B,D) as a function of thermal time under different N treatments in 2016 (A,B) and 2017 (C,D). Vertical bars represents S.D. of the mean (n = 3) where these exceed the size of the symbol.
Agronomy 10 00209 g003
Figure 4. Fractional PAR interception (f) of YLY (A,C) and ZD (B,D) as a function of thermal time under different N treatments in 2016 (A,B) and 2017 (C,D). Vertical bars represent S.D. of the mean (n = 3) where these exceed the size of the symbol.
Agronomy 10 00209 g004
Figure 5. Above-ground biomass as a function of accumulated radiation interception (RIacc) for YLY (A,C) and ZD (B,D) under different N treatments in 2016 (A,B) and 2017 (C,D). Vertical bars represents S.D. of the mean (n = 3) where these exceed the size of the symbol.
Agronomy 10 00209 g005
Figure 6. Net photosynthesis rate (A) of YLY and ZD under different N treatments during tillering (A) and panicle initiation stage (B) in 2017. Data with different letters represents significant difference (p < 0.05) between N treatments within cultivar; * represents significant difference (p < 0.05) between YLY and ZD under the same N treatment.Vertical bars represent S.D. of the mean (n = 3) where these exceed the size of the symbol.
Agronomy 10 00209 g006
Figure 7. Correlation coefficient between growth rate (GR) at different developmental stages and rice yield. BH: growth period before heading; AH: growth period after heading.
Agronomy 10 00209 g007
Table 1. Yield and yield components for YLY and ZD under different nitrogen (N) treatments at Rugao County, Jiangsu Province, China in 2016 and 2017.
YearCultivarNitrogenPanicles m−2Spikelets Panicle-1Grain Filling Percentage (%)1000-Grain Weight (g)Yield (t hm−2)
2016YLYN0190.5 b204.3 b *94.6 a *23.8 a *8.8 b *
N90261.9 a201.3 b *91.0 b *24.4 a *10.9 a *
N180267.9 a*222.7 a *90.1 b *24.3 a *11.0 a *
N270232.2 a*229.0 a *89.7 b *23.7 a10.2 ab *
N360261.9 a*210.3 ab *84.8 c *23.7 a9.4 b *
ZDN0178.6 c125.2 b97.1 a28.1 a6.0 d
N90259.5 b133.8 ab97.5 a27.7 a7.2 c
N180363.1 a132.4 ab95.5 ab26.7 a8.4 ab
N270363.1 a141.5 a96.3 ab24.6 b9.1 a
N360363.1 a136.5 ab94.9 b24.1 b8.1 b
2017YLYN0156.3 d *192.2 a *94.3 a24.7 a7.9 c *
N90183.5 c *204.0 a *94.1 ab24.6 a10.3 a *
N180194.3 bc *185.9 a *93.6 ab24.8 a10.2 ab *
N270201.0 b *197.4 a *93.0 ab24.2 a10.4 a *
N360232.0 a *205.1 a *91.3 b24.5 a9.7 b *
ZDN0189.5 c126.9 b94.0 a27.0 a5.6 d
N90262.5 b142.6 ab95.7 a25.6 a7.6 c
N180311.7 a145.4 ab95.4 a23.4 b8.2 b
N270298.7 a158.2 a94.3 a23.0 b9.3 a
N360302.3 a155.4 a93.2 a23.1 b9.3 a
Data with different letters represents significant difference (p < 0.05) between N treatments within cultivar; * represents significant difference (p < 0.05) between YLY and ZD under the same N treatment.
Table 2. Estimated values for the growth of green leaf area for YLY and ZD in 2016.
CultivarNitrogenGLAImax (m2 m−2)tm (℃d)te (℃d)Cm (m2 m−2 ℃d−1)R2
YLYN03.15 c *366.3 a *1126.3 b0.0041 c *0.940
N904.42 b246.0 b *1105.5 b *0.0060 b *0.955
N1805.57 a *155.5 c *1447.0 a *0.0067 a *0.945
ZDN02.53 c263.8 b1148.8 b0.0033 c0.918
N904.33 b357.5 ab1526.8 a0.0042 b0.973
N1805.01 a418.0 a1534.0 a0.0048 b0.980
GLAImax, the maximum value of green leaf area index (m2 m−2); tm, the time at which the maximum growth rate is achieved (℃d); te, the time when maximum of green leaf area index is reached (℃d); Cm, the maximum growth rate of green leaf area (m2 m−2 ℃d-1). Data with different letters represents significant difference (p < 0.05) between N treatments within cultivar; * represents significant difference (p < 0.05) between YLY and ZD under the same N treatment.

