Abstract
Post-flowering frosts cause appreciable losses to the Australian chickpea industry. The Northern Grains Region (NGR) of Australia, which accounts for nearly 95% of chickpea production in Australia, is frequently subjected to such events. The objective of this study was to map frost risk in chickpea in the NGR and develop strategies to minimise the impacts of such risk. The Agricultural Production System Simulator (APSIM) modelling framework was used to determine spatial and temporal trends in post-flowering frost risk. The NGR could be divided into six broad sub-regions, each delineating locations with similar frost risk. The risk was nearly two to three times greater in the Southern Downs and Darling Downs sub-regions as compared to the Central Queensland Highlands, Dawson Callide, New South Wales, and Northern New South Wales–Western Downs sub-regions. There was an increasing trend in the frequency of frost events in the Southern Downs and New South Wales sub-regions, and a decreasing trend in the Central Queensland Highlands and Dawson Callide sub-regions, consistent with the changing climate of the NGR. In each sub-region, frost risk declined with delayed sowings, but such sowings resulted in simulation of reduced water limited yield potential (unfrosted) as well. The model output was also used to compute 10, 30, 50, and 70% probabilities of the last day of experiencing −3 to 2 °C minimum temperatures and identify the earliest possible sowings that would avoid such temperatures after flowering. Choosing the earliest sowing times with a 30% frost risk could help increase overall yields in environments with high frost risk. Simulations involving genotype x environment x management interactions suggested additional opportunities to minimise frost losses through the adoption of particular cultivars of differing phenology and the use of different agronomy in various environments of the NGR. The study indicates that there is considerable variation in frost risk across the NGR and that manipulating flowering times either through time of sowing or cultivar choice could assist in minimising yield losses in chickpea due to frost.
1. Introduction
The Australian winter grains industry, to which chickpea is an important contributor, loses around $360 million annually to post-flowering frosts (https://grdc.com.au/resources-and-publications/groundcover/ground-cover-issue-103-mar-april-2013/). We define these frost events occurring after the commencement of flowering when minimum temperatures are <=0 °C in the Stevenson screen located 1.5 m above the ground. Increasing resilience of the industry against frost events is particularly important because they cause substantial fluctuations in seasonal yield [1,2,3]. In recognition of this risk, considerable research attention has been given to minimising frost losses to winter cereals [1,4,5]. Similar attention is also required on winter pulses, including chickpea. Over 95% of the total chickpea production in Australia occurs in the Northern Grains Region (NGR) spread over northern New South Wales and much of Queensland. Frosts are common in this region, but the true extent of temporal and spatial frost trends and their impact on chickpea yield stability have remained unquantified.
Recent market developments over the last decade have made chickpea a highly profitable crop, as well as playing a positive role in ensuring sustainable farming systems of the NGR. Coinciding with the International Year of Pulses in 2016, chickpea became Queensland’s top-earning grain crop because of large acreages sown coupled with record average yields of 1.8t/ha and an attractive farm gate price [6]. Favourably, the crop in this season also experienced fewer post-flowering frost events. In contrast, in 2017, due mainly to frosts and to some extent drought, NGR growers achieved less than half of 2016’s record production levels from nearly the same planting area [6]. Thus, the resilience of chickpea to frosts, which is one of the lowest among the winter crops, needs to be increased.
The losses in chickpea yield due to post-flowering frosts seem to arise due to the production of sterile (pseudo) flowers, as well as partial to complete plant mortality [7,8,9]. The use of resistant/tolerant cultivars, as for other abiotic stresses, is one of the potential strategies to minimise post-flowering frost risk, but limited attempts have so far been made to breed such chickpea cultivars [10]. Another useful strategy is to try and match flowering time to relatively frost-free periods. This could be more effectively achieved if we have the knowledge of the drivers of flowering time in the crop which could then be used in a modelling framework to more reliably predict flowering times [11]. However, before breeding frost tolerant cultivars and improving our capability to match phenology to climate, it is necessary to assess spatial and temporal trends in frost risk in the main chickpea growing areas to determine the value of these approaches, as has been done in wheat [3,4,5]. Recent studies have examined the resilience of wheat to post-flowering frosts [4,12]. These studies suggest that despite the warming of climate, frost related production risks seem to be increasing in the Australian wheat belt [4]. In wheat, 10% frost risk is accepted to make earliest planting time decisions [4,13]. In these studies, frost risk to wheat may have been over-predicted, as the effect of soil water status on flowering [2,11] was not considered. Due to indeterminate growth habit and different flowering times of chickpea compared to wheat, the nature of resilience against post-flowering frost risk in chickpea could be very different to wheat. For these reasons, a separate study on chickpea is warranted.
The objectives of this investigation were therefore to characterize spatial and temporal variation in post-flowering frost risk to chickpea in the NGR and develop strategies to minimize this risk through matching of phenology.
2. Materials and Methods
2.1. Mapping of Frost Risk Using Agricultural Production Systems Simulator (APSIM)
The Agricultural Production Systems Simulator (APSIM) (version 7.10) modelling framework, which consists of several farming systems modules developed in Australia and elsewhere to simulate a wide range of complex systems, was used to map post-flowering frost risk. APSIM has been described in detail by Holzworth, et al. [14]. Briefly, APSIM enables simulations of systems that cover a range of plant, soil, climate, and agronomic management interactions. The chickpea module of APSIM [15] uses a thermal time approach to predict the flowering of chickpea using the inputs of only temperature and photoperiod. However, these two factors have inadequately predicted flowering time and hence inadequately predicted the frost effects on yield of the crop [11]. Therefore an alternative scheme to simulate flowering time in chickpea, which is yet to be officially part of APSIM, has recently been developed to include temperature, photoperiod, and soil moisture interactions [11]. In the modified scheme, the effect of soil water on flowering time was simulated using the following equation:
where TTm is the modified thermal time after accounting for decreases associated with soil water, TT is the thermal time in the previous version of the APSIM model, and FASW is fractional available soil water. Equation (1) was operationalised only when FASW was >0.65 and the emergence (growth stage 3) had been reached. The reduction in TT was maximum when FASW was ≥1, i.e., when soil water in the surface 60 cm layer was near the field capacity. FASW was computed using the following equation:
where sw_dep is soil water at the start of the day, ll15_dep is soil water at 1.5 MPa water potential, dul_dep is the soil water at drained upper limit (i.e., field capacity), and n is the number of the layers in the 60 cm soil surface. These layers could number three or four within the top 60 cm surface depending upon the soil-sampling interval adopted for different soils.
TTm = TT × (1.65 − FASW) (when FASW ≥ 0.65 and chickpea stage ≥ 3)
FASW(n) = Σ (sw_dep(n) − ll15_dep(n))/Σ (dul_dep(n) − ll15_dep(n))
The chickpea module of APSIM currently has a limited ability to simulate frost effects on yield due to the lack of adequate parameterisation and calibration. Currently, the frost effect in the module is simulated when ambient temperatures hover between <−5 and −15 °C for the entire growth period, whereas substantial losses in yield can occur even when minimum temperature is between 0 and −5 °C after flowering. It has been estimated that each post-flowering frost event causes about 5% loss in chickpea and incorporation of this effect improved prediction of yield considerably [11]. The 5% loss was derived by regressing the observed yield with the number of frost events. Yield loss for each post-flowering frost event was computed in the manager module, using the following equations:
where YieldL is the yield loss due to frost, YieldW is yield with 12% moisture (potential yield), and YieldGM is the observed (gross margin) yield a grower would harvest. PFF is the post-flowering frost event when the minimum temperature was ≤0 °C.
YieldL = YieldW × (ΣPFF × 0.05)
YieldGM = Yieldw − YieldL
2.2. Spatial and Temporal Frost Risk
To quantify frost risk, flowering and yield losses were simulated for fortnightly sowings from 15 April to 15 July at 46 locations in the NGR. The APSIM user interface was configured to include standard agronomic conditions of 33 plants per m2, 50 cm row spacing, and the cultivar PBA Boundary with a full soil water profile at planting. Long-term daily climatic data (1957–2017) of 46 sites were obtained from the SILO website legacy.longpaddock.qld.gov.au/silo. This weather data is referred to as SILO weather data from here on. The coordinates of the 45 locations, description of their soil types, and water holding capacities have been reported by Chauhan, et al. [16]. The 46th additional location was Oakey with a latitude of −24.4 °S and longitude of 151.7 E, respectively. The soil was a Vertosol with a plant available water holding capacity of 200 mm to a depth of 180 cm. The model output was utilised to compute frost probabilities as described by Goyne, Meinke, Milroy, Hammer and Hare [1] for barley for ≤−3, ≤−2, ≤−1, ≤0, ≤1, and ≤2 °C temperatures recorded in a Stevenson screen at a 1.5 m height. This was done using weather data from 1961 onward. Minimum temperature reaching ≤0 °C after the commencement of flowering constituted a post-flowering frost event. The other temperature thresholds in the ≤−3 to <2 °C range were also considered relevant in order to account for consistent discrepancies in minimum temperature that could occur between the local and the SILO weather data due to elevation or spatial differences. The frost environments were classified according to a procedure developed by Chauhan, Allard, Williams, Williams, Mundree, Chenu and Rachaputi [16] for the 15-April sowing which had the highest frequency of post-flowering frost events. The procedure converts temporal trends into spatial sub-regional groups of locations. Individual locations were also depicted geographically to highlight spatial differences in the classified groups and the magnitude of frost risk across the NGR.
2.3. Frost Management Strategy
Four management strategies were compared in a probability framework, highlighted herein only for Dalby in the Darling Downs region of Queensland. The first strategy was to sow with an expectation of a 10% frost risk (super conservative); the second strategy was to sow with a 20% frost risk (slightly conservative); and the third strategy was to sow with a 30% frost risk (conservative). The first strategy of selecting sowing date being determined based on 10% frost risk is recommended for wheat [4,13]. These three sowings strategies were compared with the highly risky strategy of sowing on 15-April coming with over 84% frost risk for Dalby. The chickpea cultivar PBA Boundary was assumed to be grown at a standard agronomy on full soil water profile, planting starting with the cutoff date for each sowing and ending on 15 July. The rule was to plant only when three days rain exceeded or was equal to 10 mm and the soil has at least 50 mm extractable soil water. Each post-flowering frost event reduced simulated wet yield (12% moisture) by 5% [11].
2.4. Genotype × Environment × Management Interactions
In the field, the choice of planting time is contingent upon different conflicting requirements including to delay sowing to minimise risk of frosts, or to plant early avoiding heat and drought stress during the reproductive period, as well as to maximise potential yield. In addition, planting time is also governed by weather conditions. In such situations, it can be a daunting task to determine what cultivar will be a consistent winner and which agronomic practice will be most suitable for the region, especially since chickpea phenology is also dynamically influenced by soil water [11]. However, a better crop simulation model could suggest the optimum combination of variety and planting time more effectively and inexpensively. To understand if the model would indeed present different scenarios of cultivars and agronomic practices for achieving higher yield, genotype x environment x management (G × E × M) interactions were studied in silico for desi chickpea using four cultivars including Sonali, PBA Seamer, PBA Boundary and Tyson, all of which have been parameterised in APSIM. These cultivar and agronomy options represented a range of maturity times over four sowings (15-April, 15-May, 15-June, and 15-July), half and full starting profile soil water, and three plant populations (20, 30, and 40 plants/m2) at 50 and 100 cm row spacings, all of which were practical options for growers to adopt.
2.5. Statistical Analysis
All APSIM output files were converted into a database using the R program [17]. This and Microsoft Excel programs were used for all statistical and graphical analysis. The frost trends were developed in R. Cluster analysis of environments using percentile ranks of post-flowering frost events was done using the Ward.D method in R. The spatial representation of locations was done using a file of latitudes and longitudes of Australia and the locations in R. The 10, 30, 50, and 70% probabilities of experiencing ≤−3, ≤−2, ≤−1, ≤0, ≤1, and ≤2 °C temperatures were computed through the Quartile function of R. Heat maps were generated using the ‘gplots’ and ‘lattice’ packages in R.
3. Results and Discussion
3.1. Spatial and Temporal Trends in Frost Risk
The simulated yield loss due to frost was highest in the 15-April sowing, which declined as sowings were delayed further (Figure 1), therefore justifying the practice of delaying chickpea sowings. The yield loss was generally proportional to the number of post-flowering frost events derived as yield loss of 5% per frost event. However, delayed sowings also had lower yield potential (unfrosted yield) compared to the earlier sowings. The opportunity to minimise yield losses due to frost is greatest in those sowings and locations in which frost losses are large. These losses tend to vary across locations and hence there is a need to compute losses for each location or sub-region.
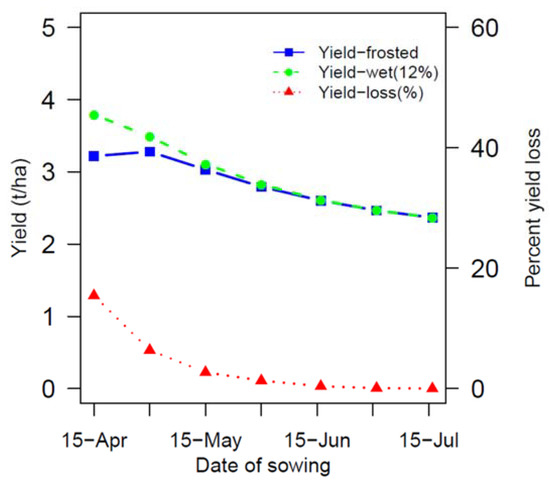
Figure 1.
Mean potential yield with of 12% moisture (Yield-wet), frosted yield, and percent yield loss due to frost in chickpea in different sowings on full profile starting soil moisture across 46 locations of the northern grains region.
Based on the number of post-flowering frost events as a measure of frost risk, the entire NGR could be conveniently divided into six sub-regions (Figure 2 and Figure 3). The frost risk was much greater in the Southern Downs and Darling Downs sub-regions in Queensland, followed in decreasing order by northern New South Wales, New South Wales, Dawson Callide, and Central Queensland Highlands regions. The location membership of sub-regions is only slightly different to membership defined on the basis of drought [16]. For sowings on 15-April, the estimated annual losses in yield of chickpea averaged 31.3% in the Southern Downs and 26.1 % in the Darling Downs compared to much smaller losses in other sub-regions including northern New South Wales-Western Downs (10.5%), Dawson Callide (9.0%) and the lowest in Central Queensland Highlands (2.0%). To avoid frost risk in the two high-risk sub-regions of the Southern Downs and Darling Downs, sowings should be appropriately delayed. Thus, selection of optimum sowing times becomes a trade-off between the acceptance of frost risk and the acceptance of yield losses due to delayed sowings.
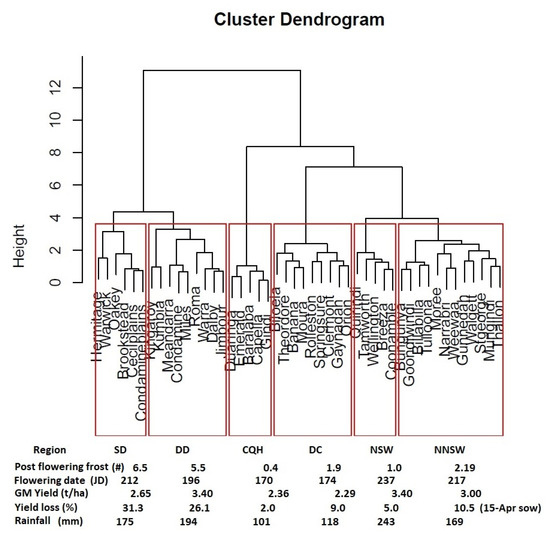
Figure 2.
Sub-regions developed using the mean number of post-flowering frost events, flowering date (Julian date), gross margin yield, yield loss for 15-April sowing and in season rainfall. The sub-regions are CQH = Central Queensland Highlands, DC = Dawson Callide, NNSW-WD = Northern New South Wales and Western Downs (Queensland), NSW = New South Wales, SD = Southern Downs, DD = Darling Downs. The frost indices were derived using 15-April sowing.
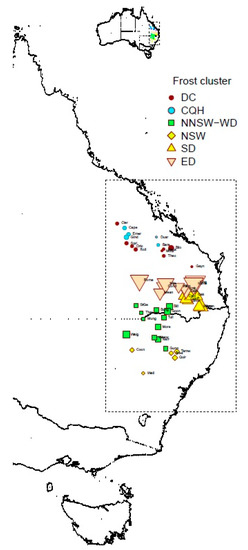
Figure 3.
Spatial representation of locations representing different sub-regions of frost risk with the symbol size (with abbreviated names) representing the relative risk of frost in terms of annual number of post-flowering frost events based on 15-April sowing. The sub-regions are CQH = Central Queensland Highlands, DC =Dawson Callide, NNSW-WD = Northern New South Wales and Western Downs (Queensland), NSW = New South Wales, SD = Southern Downs, DD = Darling Downs.
There were clear spatial trends in frost risk and flowering times. The crop would experience fewer yield reducing post-flowering frost events at higher (>30 °S) and lower (~24 °S) latitudes compared to mid (27 °S) latitudes due to a unique coincidence of flowering time and the day of the last frost event, which varied spatially (Figure 2). The last day of frost (r = 0.72, P ≤ 0.01) and flowering times (r = 0.95, P ≤ 0.01) were later at higher latitudes. The number of frost events (r = 0.58, P ≤ 0.01) and the last day of frost (r = 0.53, P ≤ 0.01) also correlated significantly with the longitude of the 46 locations. The lower frost risk of New South Wales and northern New South Wales agro-ecological regions was surprising (Figure 2 and Figure 3). This could apparently be related to later flowering due to shorter photoperiods, cooler temperatures and higher soil water. This would be attributable to both higher in season rainfall as well as lower evaporative demand.
Climate of the NGR seems to be changing which is evident from the temporal frost trends over time (Figure 4). The locations within the New South Wales sub-region were showing an increase in the number of post-flowering frost events (r = 0.25) from 1961 onwards. Nevertheless, the overall number was still much less than the events in the Southern Downs and Darling Downs in Queensland. There was also a significant increase (r = 0.31, P ≤ 0.05) in the number of post-flowering frost events in the Southern Downs and Northern New South Wales and Western Downs (r = 0.252, P ≤ 0.05) sub-regions. This suggests that under changing climate, Queensland’s Southern Down’s type of environment, which is more prone to frost, could extend down to northern New South Wales–Western Downs sub-regions. In contrast, significant decreases (r = −0.34, P ≤ 0.01) in the number of post-flowering frost events were noted in the Dawson Callide and Central Queensland sub-regions (r = −0.37, P ≤ 0.01), while trends for the Darling Downs, though towards an increase, were not significant. In the Central Queensland Highland and Dawson Callide regions, where frost risk is already low, frost should become less of a problem (Figure 4).
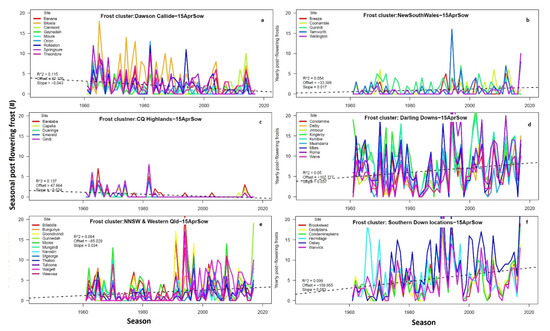
Figure 4.
Temporal trends of 56 years in post-flowering frost frequencies for 15-April sowing for locations of Dawson Callide (a), New South Wales (b), Central Queensland Highlands (c), Darling Downs (d), Northern New South Wales and Western Downs (e) and Southern Downs (f) sub-regions. The dashed line shows increasing and decreasing trend (the adjacent values indicate coefficients of determination (R2), intercept (offset) and slopes of regression lines).
3.2. Strategies to Minimise Frost risk
The probability of the last day of frost was determined in relation to flowering time for different sowings for the 46 locations mentioned in Figure 2, but to illustrate interactions between flowering times and the last frost day, only the most frost prone sub-regions including Southern Downs and Darling Downs, represented by Hermitage and Dalby, respectively, are presented (Figure 5). In each of these sub-regions, delaying sowing could be the most effective strategy to minimise frost risk as it would enable flowering beyond the last day of frost. However, as a delayed sowing tends to result in reduced yield potential due to a reduced emergence to flowering period, terminal drought and heat stresse, delaying sowing beyond a certain date may not be beneficial. If there are no biotic constraints and lodging issues, with each day delay in sowing, the average yield will decline by 14.8 kg/ha in the Southern Downs, 15.4 kg/ha in the Darling Downs, 18.6 kg/ha in the Western Downs, 15.2 kg/ha in the Dawson Callide, and 14.0 kg/ha in the Central Queensland Highlands. Therefore, a careful selection of planting date would be required to avoid frost risk and prevent a decline in yield due to delayed sowing.
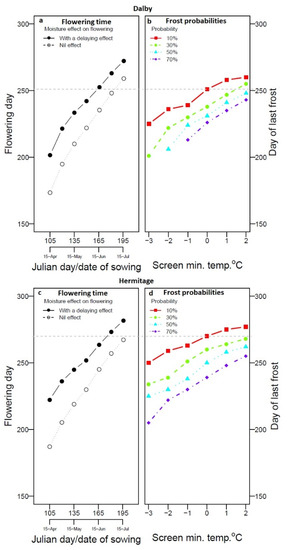
Figure 5.
Simulated Julian day of flowering after accounting for soil water effect (a) represented by a solid line and solid symbols and without accounting for soil water effect (original Agricultural Production Systems Simulator (APSIM) model) as dotted line with open symbol) as a function of planting date (15 April = day 105; 15 July = day 195) for PBA Boundary (dark lines) at Dalby (a) and Hermitage (Warwick, c) in Darling Downs and Southern Downs, respectively. The coloured lines in the right panel for each location (panel b for Dalby and d for Hermitage) represent corresponding frost probabilities based on the entire temperature record of 1961 to 2017 for a range of screen temperatures (2 °C to −3 °C) expressed as the probability of falling below a specified temperature threshold after a certain date (‘Julian day of last frost’). The horizontal dashed grey lines in each panel indicate the planting date that corresponds to a 10% frost risk probability based on the Stevenson screen temperature of 0 °C.
Adequate consideration of the probability of the last day of frost in relation to crop flowering time could enable growers to choose appropriate planting times according to their risk aversion. Farmers could adopt a super conservative strategy, i.e, planting a chickpea crop by selecting a date in which flowering occurs only when risk of frost is no greater than 10%, as is recommended for wheat [4,13]. For example, the earliest planting dates for chickpea with <10% acceptable risk of experiencing at least one frost event were 7 June at Dalby and 17 June for Hermitage (Figure 5). At these two locations, selection of sowing dates with <10% risk (conservative strategy) is likely to give higher yield in low yielding years (characterised by a higher number of post-flowering frosts) compared to sowing on a date with no consideration of risk (risky strategy–15 April sowing).
According to this analysis, the 10% (7 June sowing), 20% (22 May sowing), and 30% risk (15 May sowing), referred to as super conservative, slightly conservative, and conservative strategies, respectively, were compared to the highly risky earliest planting on 15 April (Figure 6a) and resulted in a minimum of 2000 kg/ha simulated yield compared to around 1000 kg/ha with no consideration of frost risk for Dalby (Figure 6b). However, the risky strategy (15 April sowing) was more productive in high yielding years compared to the three conservative strategies. This could be because higher yields would generally be achieved in higher rainfall years, which will also have fewer frost events due to cloudy skies on most days, as was observed in the 2016 season. Some growers, who are less risk averse, could choose sowing dates based on a 30% risk, which will result in similar or higher yields in low yielding years and only slightly less yield than the risky strategy in the high yielding years (Figure 6b). The 10% risk strategy is probably more suitable for wheat [13] because this crop has determinate growth habit and therefore cannot re-flower again to compensate for the lost yield. In contrast, chickpea is indeterminate in nature, and can flower again or continue to flower provided there is sufficient soil moisture to support formation of pods from later formed flowers.
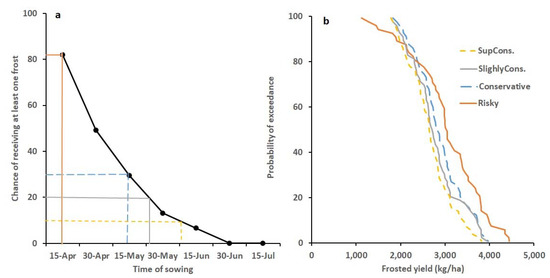
Figure 6.
Risk of receiving at least one frost during the reproductive stage in different sowings at Dalby on the Darling Downs in Queensland (a) and the consequence on yield from the adoption of sowings date based on 10% frost risk (super conservative), 20% frost risk (slightly conservative), 30% frost risk (conservative), and no consideration of frost risk (risky) (b). The probability of exceedance on the y-axis is a statistical metric describing the probability that a particular value on x-axis will be met or exceeded.
In formulating these strategies, no consideration was given to risk of high disease or lodging, as both are currently not modelled. In considering frost risk while also avoiding lodging and disease risk, the conservative approach (<30% frost risk) may be a better option until other constraints are addressed. The 30% frost risk level will allow early plantings that will enable the crop to recover from frost damage, as well as avoiding exposure to drought and heat stress in later growth stages. The earliest planting date of 15-April simulated here in the risky strategy is equivalent to an autumn planting (15 October) in India, which is not considered a risky planting date. This is when most Indian chickpeas are planted and any plantings beyond this date usually result in progressively lower yields [18].
3.3. Genotype × Environment × Management Interactions Related to Frost and Drought
In recent years, there has been an increasing effort to develop shorter duration varieties of chickpea in the Australian chickpea breeding programs to prevent the crop from being exposed to drought and heat stress in the later stages of crop growth. Such short duration germplasm may also require fewer fungicide sprays to protect the crop from Ascochyta rabeii. A more appropriate way to assess appropriate maturity types and their agronomy for different sub-regions could be to examine in silico genotype × environment x management (G × E × M) interactions to determine the best combination of factors. One advantage with this approach could be that one can use historical climatic data to visualise the bigger picture of interactions compared to only a few years of trial data in actual field experiments. With better prediction of flowering and maturity times, such analyses may result in a more reliable matching of cultivar with risk of frosts, heat and drought stress. Such matching has historically been done using empirical approaches at great cost and over a limited number of years. The highly dynamic influence of the soil–water environment on chickpea phenology makes it difficult to predict crop performance and potential variation in all target environments unless assisted by effective models to account for this.
An example of how yield levels from early and later maturing cultivars could have differential adaptation to different environments is highlighted in Figure 7. The early cultivar, Sonali, was lower yielding in the earliest sowings, but the situation appeared to change with later plantings. The difference in flowering time between the early cultivar Sonali and the latest flowering cultivar PBA Boundary was 15 days. In silico visualisation of G × E × M of different cultivars focussing on assessing frost risk using historical climatic data revealed that the use of different cultivar maturity types could assist in minimising frost risk and yield reduction (Figure 7). In general, the earlier flowering cultivar was less suitable in the Dalby environment compared to at Roma where soils have lower water holding capacities. These cultivars have not been bred for frost tolerance, but their frost risk varies mainly due to variation in flowering times. The later flowering cultivars will escape most frosts but could also experience drought and heat stress later in the season. This analysis could guide a breeding program to focus breeding of cultivars of appropriate flowering times for different target production environments. Figure 7 represents long term averages, but based on soil water status and weather forecasts for a particular season, scenarios could be worked out ahead of planting in any given year. Plant population and starting water had considerable impact on yields in different environments. Such analysis could assist growers in making a priory assessment with respect to matching appropriate cultivar maturity and agronomy to their environments. If achieved, enduring profitability from chickpeas could be better realised in the face of frost risk in the NGR.
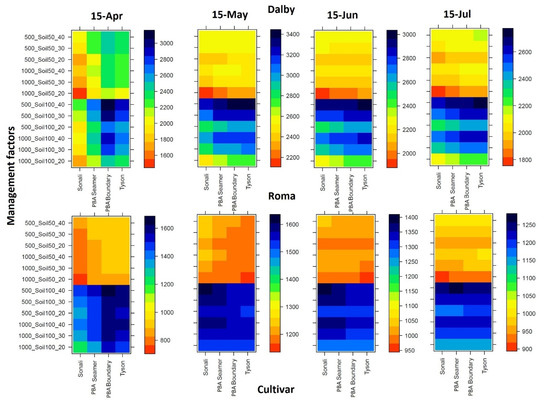
Figure 7.
In silico visualisation of Genotype x Environment x Management interactions to guide identification of higher yielding cultivar (G) and agronomy for different environments (E) for Dalby and Roma. The management (M) factors included two row spacings (500, 1000 mm), half and full starting profile (representing double crop and fallow situations, respectively) and 20, 30, and 40 plants/m2 adopted on four sowing dates. The bar on the right side of each panel is yield (kg/ha).
The findings shown in Figure 6 and Figure 7 could easily be built into a decision support tool that could guide growers to select appropriate cultivars and agronomy, while taking weather forecasts into consideration. The planting date to minimise risk could be different for each environment, soil, and cultivar. The use of a model-based decision support tool could help identify more precise planting dates, cultivar, and row and spacing configurations, thus allowing tactical adjustments in agronomy for individual paddocks. A separate effort will be required to package this more effectively, for example, as a smartphone app.
4. Conclusions
Frost is not generally recognised as a major constraint to chickpea production by the broader national breeding effort. The results presented here suggest that frost is indeed a far bigger constraint to chickpea production in the Darling Down and Southern Downs sub-regions of Queensland than anywhere else in the NGR. To ensure enduring profitability, further investigations on crop improvement and management strategies to minimise the risk are necessary. Several future opportunities have been identified, firstly the acceptance of the 30% threshold of frost risk to impact sowing time selection, and secondly, the use of later maturing cultivars in the earliest planting dates to minimize frost losses in yield. A third opportunity is to undertake a comprehensive modelling assisted g × e × m analysis to determine the best combination of factors to maximise profitability.
Chickpea flowering time is a key adaptive trait which is affected by not only temperature and photoperiod, but also soil water [11]. This study has shown how an assessment of frost risk, in relation to dynamic change in crop flowering time related to soil water, can more accurately predict adverse impacts of frost on chickpea yield. Similar approaches could be adopted to deal with drought and heat stress. The accurate prediction of crop flowering time using the improved APSIM model will open up the wider possibility of using the model as a decision support tool to generate reliable information on frost, drought, and heat stress risks for growers and industry.
Author Contributions
Conceptualization, Y.S.C. and M.R.; methodology, Y.S.C.; software, APSIM.; validation, Y.S.C.; formal analysis, Y.S.C.; investigation, Y.S.C. and M.R.; resources, Queensland Government.; data curation, Y.S.C.; writing—original draft preparation, Y.S.C.; writing—review and editing, Y.S.C. and M.R.; visualization, Y.S.C. and M.R.; supervision, Y.S.C.; project administration, Y.S.C.; funding acquisition, Y.S.C. All authors have read and agreed to the published version of the manuscript.
Funding
This research received funding from the Queensland Government.
Acknowledgments
The Department of Agriculture and Fisheries, Queensland for an innovation project to support this analysis and publication. Acknowledgment is made to the APSIM Initiative which takes responsibility for quality assurance and a structured innovation programme for APSIM’s modelling software, which is provided free for research and development use (see www.apsim.info for details).
Conflicts of Interest
The authors declare no conflict of interest.
References
- Goyne, P.J.; Meinke, H.; Milroy, S.P.; Hammer, G.L.; Hare, J.M. Development and use of a barley crop simulation model to evaluate production management strategies in north-eastern Australia. Aust. J. Agric. Res. 1996, 47, 997–1015. [Google Scholar] [CrossRef]
- McDonald, G.; Sutton, B.; Ellison, F. The effect of time of sowing on the grain yield of irrigated wheat in the Namoi Valley, New South Wales. Aust. J. Agric. Res. 1983, 34, 229–240. [Google Scholar] [CrossRef]
- Zheng, B.; Chenu, K.; Fernanda Dreccer, M.; Chapman, S.C. Breeding for the future: What are the potential impacts of future frost and heat events on sowing and flowering time requirements for A ustralian bread wheat (T riticum aestivium) varieties? Glob. Chang. Biol. 2012, 18, 2899–2914. [Google Scholar] [CrossRef] [PubMed]
- Crimp, S.J.; Zheng, B.; Khimashia, N.; Gobbett, D.L.; Chapman, S.; Howden, M.; Nicholls, N. Recent changes in southern Australian frost occurrence: Implications for wheat production risk. Crop Pasture Sci. 2016, 67, 801–811. [Google Scholar] [CrossRef]
- Zheng, B.; Chapman, S.C.; Christopher, J.T.; Frederiks, T.M.; Chenu, K. Frost trends and their estimated impact on yield in the Australian wheatbelt. J. Exp. Bot. 2015, 66, 3611–3623. [Google Scholar] [CrossRef] [PubMed]
- ABARES. Pulse Australia Crop Report Data. 2019. Available online: https://www.agriculture.gov.au/sites/default/files/documents/austcroprrt20191203_v1.0.0.pdf (accessed on 15 January 2020).
- McKenzie, B.; Hill, G.; Gunaratnam, R.; Jones, A. Evaluation of the ICARDA cold tolerant chickpea nursery. In Proceedings of the Agronomy Society of NZ, Lincoln University, Canterbury, UK, 30 March 1995; pp. 47–50. [Google Scholar]
- Clarke, H.; Siddique, K. Response of chickpea genotypes to low temperature stress during reproductive development. Field Crop. Res. 2004, 90, 323–334. [Google Scholar] [CrossRef]
- Whish, J.P.M.; Castor, P.; Carberry, P.S.; Peake, A.S. On-farm assessment of constraints to chickpea (Cicer arietinum) production in marginal areas of northern Australia. Exp. Agric. 2007, 43, 505–520. [Google Scholar] [CrossRef]
- Singh, K.; Saxena, M.; Gridley, B. Screening Chickpea for Cold Tolerance and Frost Resistance. Ascochyta Blight and Winter Sowing of Chickpeas; Martinus Nijhoff/Dr. W. Junk. Pub.: The Hague, The Netherlands, 1984; pp. 167–177. [Google Scholar]
- Chauhan, Y.S.; Ryan, M.; Chandra, S.; Sadras, V.O. Accounting for soil moisture improves prediction of flowering time in chickpea and wheat. Sci. Rep. 2019, 9, 7510. [Google Scholar] [CrossRef] [PubMed]
- Flohr, B.M.; Hunt, J.R.; Kirkegaard, J.A.; Evans, J.R. Water and temperature stress define the optimal flowering period for wheat in south-eastern Australia. Field Crop. Res. 2017, 209, 108–119. [Google Scholar] [CrossRef]
- Howden, S.; Power, B.; Mckeon, G. Risk management of wheat in a non-stationary climate: Frost in Central Queensland. In Proceedings of the Integrative Modelling of Biophysical, Social and Economic Systems for Resource Management Solutions: International Congress on Modelling and Simulation, Townsville, Queensland, Australia, 14–17 July 2003; pp. 17–22. [Google Scholar]
- Holzworth, D.P.; Huth, N.I.; deVoil, P.G.; Zurcher, E.J.; Herrmann, N.I.; McLean, G.; Moore, A.D. APSIM–evolution towards a new generation of agricultural systems simulation. Environ. Model. Softw. 2014, 62, 327–350. [Google Scholar] [CrossRef]
- Robertson, M.J.; Carberry, P.S.; Huth, N.I.; Turpin, J.E.; Probert, M.E.; Poulton, P.L.; Brinsmead, R.B. Simulation of growth and development of diverse legume species in APSIM. Aust. J. Agric. Res. 2002, 53, 429–446. [Google Scholar] [CrossRef]
- Chauhan, Y.; Allard, S.; Williams, R.; Williams, B.; Mundree, S.; Chenu, K.; Rachaputi, N.C. Characterisation of chickpea cropping systems in Australia for major abiotic production constraints. Field Crop. Res. 2017, 204, 120–134. [Google Scholar] [CrossRef]
- R Core Team. R: A Language and Environment for Statistical Computing; R Foundation for Statistical Computing: Vienna, Austria, 2018. [Google Scholar]
- Neenu, S.; Ramesh, K.; Ramana, S.; Somasundaram, J. Effect of cultivars and sowing dates on nutrient uptake and yield of chickpea under aberrant climatic conditions in black soils of central India. Adv. Res. 2017, 12, 1–11. [Google Scholar] [CrossRef]
© 2020 by the authors. Licensee MDPI, Basel, Switzerland. This article is an open access article distributed under the terms and conditions of the Creative Commons Attribution (CC BY) license (http://creativecommons.org/licenses/by/4.0/).