Abstract
Models can help to explain the main interactions, magnitudes, and velocity by which biological processes accumulate soil organic carbon (SOC) in pastures. An explanatory model using Insight Maker software was constructed for each soil under natural and cultivated pastures, using theoretical carbon models and data which were collected monthly in andisol sites. The model was calibrated and validated by comparing the modeled data to the field data until the smallest prediction error was reached. The indicators used were the mean absolute error (MAE), root-mean-square error (RMSE), mean absolute percentage error (MAPE) and the coefficient of determination (R2). In natural pasture soil, the diversification of organic inputs consistently promoted the growth of microbial biomass and metabolic efficiency. In contrast, intensive management of cultivated pastures, involving the removal of plant cover, plowing and low input of organic matter, stressed the microbial community and increased the potential carbon loss through secondary mineralization and surface runoff. The application of modeling indicated that it is necessary to improve agronomic practices in cultivated pastures, to maintain soil cover and to increase the application of organic fertilizer by 1.5 times, in order to reduce stress on the microbial biomass, accumulate SOC, minimize organic matter mineralization and reduce C losses due to surface runoff. Therefore, improving agricultural management based on the understanding of soil processes will allow increasing the potential for SOC storage, while improving pasture sustainability.
1. Introduction
Pasture makes up the largest percentage of terrestrial ecosystems [1]. The largest reservoir of organic carbon in pastures is the soil organic matter, which contains about 90% of the total system organic C [2]; the primary mechanisms that regulate carbon content in pasture ecosystems include inputs and losses of organic matter [3,4]. Fisher et al. [5] estimated that the input of organic matter into managed pasture soils ranges from 33.5 to 40.5 Mg ha−1 year−1.
In native pastures, data on the magnitude and distribution of stored C and the effects of grazing management on ecosystem processes, which control the cycle and distribution of C, are poorly reported [1]. At the same time, in the literature on Andean pastures, the relationships between management and soil organic carbon (SOC) storage, based on the magnitude, distribution and transfer of carbon in the soil ecosystem, are unknown.
Andean pastures occupy 0.8% of the Earth’s surface and accumulate around 5% of soil carbon worldwide [6]. They are located in the Andes mountain range, which occupies the western part of South America bordering its entire Pacific Ocean coast. From its north end, in western Venezuela, it crosses Colombia, Ecuador, Peru and Bolivia. Andisols predominate in these ecosystems, having the capacity to store severalfold higher amounts of organic carbon due to being formed by volcanic soils [7]. That is to say, pasture management can change soil carbon dynamics; therefore, carefully designed management strategies can promote a higher organic carbon content in the soil while reducing atmospheric CO2 levels [8].
Andean ecosystems are subject to constant transformation due to the growing demand of the human population. In this sense, land use and the use of fertilizers, pesticides and certain types of tillage have been intensified to maintain and increase agricultural productivity [9]. These practices, coupled with the reduction in the amount and quality of organic inputs into the soil, have affected the biogeochemical properties and processes that control the concentration of carbon in the soil in a negative way, decreasing both carbon storage capacity and soil sustainability [10,11]. In this regard, understanding the processes (organic matter breakdown, mineralization and humification) and estimating the magnitude and velocity of flows between compartments and/or system elements are key to understanding the C storage dynamics in the soil [12]; hence, modeling is valuable to assess the effect of physicochemical and biological factors on carbon dynamics under various changes in land use and management practices [13,14,15].
Modeling is increasingly being used in order to understand the changes in ecosystems as a result of change drivers (climate change and changes in land use) [16]. Models vary significantly in terms of complexity and mathematical description of the biogeochemical processes, depending on the complexity and data input requirements [17]. For example, there are different models oriented to ecosystem processes that occur at different spatial and temporal scales, particularly in issues related to soil management and climate change; they are also used to support decision making on carbon management [18]. Currently, there are models of carbon dynamics being validated in various ecosystems and latitudes; however, few have been applied to Andean ecosystems. The existing C models encompass responses from processes and changes in stocks, but none of them details the specific way in which the parameters and mechanisms are affected by agricultural management, from the simplest case without compartments (taking into account degradation as a continuum) to the most refined models of multiple compartments of organic matter with a similar chemical composition. Models include the understanding and prediction of feedback between terrestrial ecosystems and climate [19], land use change [20], and agricultural practices [21]. Based on studies carried out in other ecosystems, we hypothesized that pasture soil management determines carbon storage in the soil and the regulation of biological processes. Therefore, in our investigation, we used an explanatory model of the biological processes that accumulate carbon in agricultural pastures so that it would allow us to understand the management effects on C dynamics. This paper focuses on modeling main interactions, magnitudes, and velocity by which the biological processes accumulate soil carbon under two pasture management schemes in Andean socio-ecosystems in Colombia. Based on the results, we suggested improving practices to promote sustainable development of soils under pasture in this area.
2. Materials and Methods
2.1. Study Area
The study was carried out in the Andean region in Colombia, on the basin of the Piedras River, whose physiographic features are representative of the South American tropical Andes. This basin (2°21′35″ N, 76°33′10″ W) has an area of 66.26 km2 and a perimeter of 39 km. It is an undulated terrain, with slopes between 16% and 50%. The soils are Andisols [22] derived from volcanic ash, with a sandy loam texture (clay~10%) and well drained. They have acidic pH (4.6 to 5.0), with high aluminum saturation and low quantities of calcium, magnesium and phosphorus [23]. This region has a typical equatorial mountain climate with climatic zones (temperate, cold and Paramo climates and sub-Andean and Andean bioclimatic zones) that are affected by the trade winds. The average annual temperature varies between 10.4 °C and 18.4 °C [24]. The region has orographic precipitation, with a mean monthly rainfall of 136 mm: 183 mm month−1 between October and May, and 42 mm month−1 during the dry season from June to September.
In the area, natural forest cover, pastures and crops predominate, of which the study focuses on Andean pasture, which is primarily based on the establishment of the following two systems: (1) natural pasture (Holcus lanatus) is managed by rotating livestock, with each field being grazed for one month and then allowed to rest for two months. Livestock contributed with approximately 98.7 kg ha−1 of manure during two periods per year, which was spread throughout the plot by the farmer. Normally, nitrogenous compounds such as urea and feces remain on the pasture after cattle grazing; (2) cultivated pastures (Pennisetum purpureum) are managed by manual tillage and weeding as well as by the addition of composted manure products (1000 kg ha−1 once the forage has been harvested). Lime (MgCO3, CaCO3) is added to increase the pH (80 kg ha−1) in the land preparation stage, since these are acid soils. Sowing involves the use of manual plowing and irrigation water; plots are cleaned every four months.
2.2. Study Area Selection
The identification of areas by land use was made by mapping the area and, as a result, it was seen that the soils are mainly dedicated to protection areas (natural forest cover) with 1848.9 ha (27.9%), livestock (pastures) 1523.1 ha (22.9%), and agriculture 256.9 ha (3.9%), while the rest is dedicated to tree crops, mining, residential and natural regeneration areas. The type and extent of land use were taken as parameters in order to decide the location and the number of sampling points for carbon quantification. Considering the types of land use and the heterogeneity of the basin in terms of microclimate, cover, type and land use, the specific area of the Arrayanales basin was selected, with an average height of 2495 m above sea level, where 50% of the area corresponds to livestock (natural pasture), 35% to protection areas (natural forest), and 15% is dedicated to agriculture (forage cultivation).
2.3. Experimental Design
Considering the total area dedicated to each use and previous results on the percentage of organic carbon in the soils, we applied the formula described by Pearson, et al. [25] in order to define the soil sampling area, thus obtaining two experimental units for natural pastures and two for cultivated pastures. In this way, a stratified randomized experimental design was applied on four plots. For each soil management system, two experimental plots were established: the first site was used to develop the model of soil carbon storage and the second site to validate the model. Every plot (200 m2) in each management was subdivided into a grid with eight subplots. A composite sample was taken from each subplot, yielding a total of 16 monthly composite samples for the 11-month period (n = 192) by management and site. The samples represented the horizon ‘A’, defined for each soil management regime, corresponding to a depth of 0.20 m (Figure 1).
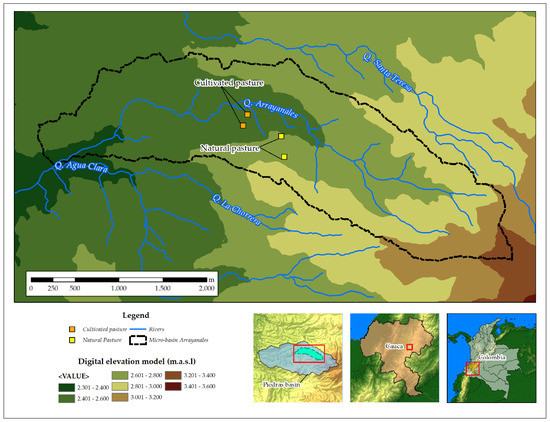
Figure 1.
Study area at the basin of the Las Piedras River, Cauca, Colombia.
2.4. Soil Biogeochemical Analyses
The texture of the samples was determined by the Bouyoucos method using an American Society for Testing and Materials (ASTM) HYDR Fisher Brand D2487-06. Bulk density was determined by the cylinder method [26]. Soil moisture content was determined thermogravimetrically by measuring the water retained after the soil had been saturated and subjected to 0.3 atm NTC ISO/IEC 17025:2005 [27]. The soil pH was determined potentiometrically in a soil-saturated pulp and in a 1:1 soil: water suspension with a Metrohm E-744® pH meter (Herisau, Switzerland), following the US Environmental Protection Agency combined glass-electrode method 9045D [28]. Organic C was measured by the Walkley and Black method of oxidizing the organic carbon in the soil with 1 N potassium dichromate (K2Cr2O7) in an acidic medium. After each sample had stood for 12 h, they were colorimetrically measured in a Spectronic Gensys 20® spectrometer (Madison, WI, USA) set at 585 nm [29,30]. The organic C content in the soil (t C ha−1) was calculated from the percentage values of carbon, bulk density and volume of each sample (cross-sectional area of the sample by the sampling depth). Total N in the soil samples was determined by the Kjeldahl method [31] by the quantitative determination of N from different materials. Microbial biomass C was estimated by fumigation–extraction: samples were fumigated with ethanol-free chloroform, whereas control samples were left unsprayed; after three days, the microbial carbon was extracted [32].
2.5. Model Design
The elements forming the soil carbon storage explanatory model were based on a review of the models in the literature [16,20,33], and the data on the main variables of storage carbon (stocks) on the pasture systems which were measured (Table 1). The model simulated the carbon dynamics in a monthly time step and included the data on organic inputs added by the farming community. The Euler method (numerical integration of ordinary differential equations from an initial given value) was used to run the model.

Table 1.
The physical, chemical and biological characteristics of soils under two management systems: natural pasture and cultivated pasture (soil depth up to 0.20 m).
The soil carbon explanatory model was built using the open source Insight Maker software. It incorporated three pools of organic C: litter (organic C residues); humus (humus C represents from 60% to 80% of SOC, defining associations that preserve SOC from rapid mineralization) [34]; and microbial biomass (with the functional groups expressed in kg ha−1). Each stock represents a fraction of soil organic C according to the state of consolidation of organic matter. The stocks are connected by biological processes of humification (humus formation process), mineralization, assimilation and microorganism decay.
The quality (C:nitrogen-N ratio) and the amount of organic material that enters the system were established as conditional in the model; the chemical composition of organic materials can increase or reduce the mineralization capacity of the microbial community and direct the biological processes. The monthly mineralization rate of organic material was determined by air temperature (T): Equation (1) [35]. Equation (1) shows temperature as the main factor for mineralization, as the clay content, a known impeller of respiration, is very similar in the four study sites. Therefore, theoretical temperature relations were assumed:
In general, the inputs are determined by organic carbon in residues such as dung, leaf litter, pasture roots and organic fertilizer, which are different on each management; the outputs are determined by carbon flows resulting from mineralization and runoff.
2.5.1. Litter Stock
The transformation of organic carbon in litter stock (L; Equation (2)) is determined by the inputs of carbon in the organic residues (dung, leaf litter, roots in the pasture, organic fertilizer for the cultivated pasture) and flow of MB decay. The outputs are determined by the carbon flows resulting from the humification, mineralization and assimilation of the carbon in the organic residues, performed by the microorganisms and regulated by the quality (C:N ratio) and quantity of organic material added and the mineralization rate (K1). The outputs incurred by the hydrological flow of organic carbon that is lost via surface runoff are also considered. The simulated results are expressed in relation to the litter stock over time (t) and the variation of the flows at an exchange rate over time (dt).
where: L is the carbon in the organic residues; Quant is the flow of organic C input; Decay is flow of MB decay; Humification is the flow of humification; Assi is the flow of assimilation from litter stock; Min is the flow of respiration of the organic C in the residues; Runoff is the flow of C in Surface runoff.
2.5.2. Humus Stock
The humus stock (H, Equation (3)) depends on the entry of the humification flow of the organic residues (leaf litter, roots and dung; or organic fertilization), regulated by the fraction of humification and the rate of mineralization. The outward flows of carbon are determined by the rate of mineralization of humus (Min2), represented by the loss of CO2 and the loss of C through assimilation of the microorganisms (Assi2). The simulated results are expressed in relation to the humus stock over time (t) and the variation of flows at an exchange rate over time (dt).
where: H is the carbon in humus; Humification is the flow of humification; Min2 is the flow of secondary mineralization; Assi2 is the flow of assimilation from humus stock.
2.5.3. Microbial Biomass Stock
The carbon stock in the microbial biomass (MB; Equation (4)) is determined by the inputs related to the processes of assimilation, originating from the stocks of organic carbon in the residues (Assi) and humus (Assi2), which are regulated by the rates of mineralization (K1) and the fraction of assimilation corresponding to each process. The outward flow of carbon corresponds to the death of microorganisms regulated by the rate of their decay (Kd). The simulated results are expressed in relation to the microbial biomass stock over time (t) and the variation of flows at an exchange rate over time (dt). The simulated results are expressed in relation to the litter stock in time (t) and the variation of flows at an exchange rate over time (dt).
where: MB is the stock of microbial biomass carbon; Assi is the flow of assimilation from litter stock; Assi2 is the flow of assimilation from humus stock; Decay is the flow of MB decay.
2.6. Parameterization, Calibration and Validation of the Model
The system was parameterized and calibrated through the fractions that determine humification (Fh) [32,33] and mineralization (Fr) [36,37,38], as well as the rates that affect the flows. The rates were compared to those recorded in the literature for equivalent ecosystems and organic material: rate of mineralization (K1) [37,39,40,41,42,43,44], rate of microbial biomass decay (Kd) [45,46], and rate of secondary mineralization of humus (K2) [47]. A sensitivity test was applied to define the parameters that influenced the carbon dynamics. The test algorithm repeated the simulations many times, each time with the value of every stock having a different initial value; changes in the resulting simulation paths were monitored (this is a classic Monte Carlo algorithm). Therefore, some parameters were changed during the calibration. This calibration achieved a satisfactory fitness of simulation in the test runs with the data on the first site. Finally, the model was calibrated for organic carbon stock, microbial biomass and amount of equivalent carbon in the respiration process. Then, the model was validated by comparing the modeled data to the data recorded on the second site under the same soil management regime (validated data). The indicators used were the mean absolute percentage error [48], root-mean-square error (RMSE), the mean absolute error [49] and the coefficient of determination (R2).
3. Results
3.1. Operation, Calibration and Validation of the Model Dynamics of the Soil Carbon Storage under Pastures
Modeling determined that mineralization, humification and assimilation are conditioned by the quality and quantity of organic material inputs and the temperature that determines the mineralization. Each soil management regime has inputs of different quantity and quality of organic materials, and hence they have different mineralization, humification and assimilation rates. The speed of processes (mineralization, humification and assimilation) was established according to ranges of the C:N ratio of organic material input [50]. Organic matter with C:N > 25 or C:N < 10 decreases the mineralization process, resulting in a reduction in metabolite formation and a reduction in CO2 release. A higher ratio (C:N > 25) reduces the carbon flow of humification, thus leading to the preservation of SOC from rapid mineralization of organic matter (humus) and to a decrease in the assimilation of carbon, which affects the growth of cellular tissue on microorganisms. If the C:N ratio of the input material is low, (C:N < 10) the microorganisms require more energy (C), so they must obtain it from the soil, increasing the secondary mineralization [51]. In contrast, when the C:N ratio of the material is between 10 and 25, humification, assimilation and mineralization are faster, since the material can be processed by the microorganisms. Hence, the formation of metabolites and CO2 derived from the processes is increased; they have the necessary amounts of carbon to guarantee the formation of soil aggregates and the carbon availability for the formation of cellular tissue. When the input of organic matter is low, mineralization, humification and assimilation are maintained at an average rate until the input is recovered; at the same time, microorganism decay increases due to the lack of carbon as an energy input for its metabolism.
We found that the mineralization fractions correspond to 0.25 for the natural pasture and 0.20 for the cultivated one; humification was 0.78 for the natural pasture and 0.72 for the cultivated one. The mineralization rates for natural pasture were 0.017 and 0.0080 for the cultivated one; the decay rates of microorganisms were 0.05 and 0.06, respectively; the secondary mineralization was 2.5 × 10⁻⁶ for each management type (Table 2). In the appendix, Table A1 presents the definitions of the parameters for the equation regarding each stock and flow. In addition, Figure 2 presents the general explanatory model of carbon dynamics in pastures.
Table 2.
Parameters resulting from the calibration of the SOC model for natural and cultivated pasture soils.
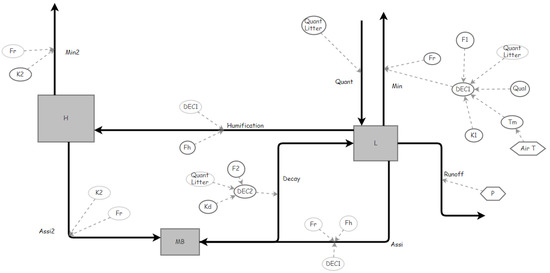
Figure 2.
Soil carbon dynamics under pastures (represented by Insight Maker software). MB (stock of microbial biomass), L (C in the organic residues), H (C in Humus), Quant (flow of organic C input, quantity), Min (flow of respiration of the organic carbon in the residues), Humification (flow of humification), Assi and Assi2 (flow of assimilation), Decay (flow of MB decay), Min2 (flow of secondary mineralization), K1 (fate of residue decomposition), K2 (rate of humus decomposition), Fh (fraction of humification), Fr (fraction of respiration), Kd (rate of MB decay), Runoff (surface runoff), DEC1 (decomposition relation to Qual (C:N ratio of the residues (Quality), Quant, Air T (Air Temperature and F1 (Conditional factor).); DEC2 (decomposition relation to Quant and Kd and F2 (Conditional factor). See units for the parameters (Appendix Table A1).
The results of the validation of the model for soils under natural pastures had a mean absolute percentage error of 1.4% for organic carbon in the soil and of 15% for microbial biomass. The mean absolute error was 1.78 Mg ha−1 for SOC and of 0.040 Mg ha−1 for microbial biomass (Table 3). Root-mean-square error was 1.98 Mg ha−1 for SOC and of 0.055 Mg ha−1 for MB. The coefficient of determination R2 for SOC in natural pasture (MB + humus + litter) was 0.67 (Figure A1). In the cultivated pasture, the mean absolute percentage error was 0.7% for organic C in the soil and 20% for microbial biomass. The mean absolute error was 0.78 Mg ha−1 for SOC and 0.02 Mg ha−1 for biomass (Table 3). Root-mean-square error was 1.10 Mg ha−1 for SOC and 0.03 Mg ha−1 for MB. The coefficient of determination R2 for SOC in cultivated pasture (MB + humus + litter) was 0.62 (Figure A1).
Table 3.
Observed and modeled data in the Insight Maker software and mean absolute error (MAE). Mean organic carbon in the soil (SOC), microbial biomass (MB) and equivalent carbon in respiration (eq C) at 0.20 m depth. The different letters indicate a statistically significant difference at p < 0.05).
3.2. Carbon Dynamics in Soils under Pastures
The dynamics of the litter stock were determined by the input of organic material such as leaf litter, roots and, occasionally, cattle dung in natural pastures, and mainly by organic fertilizer in the cultivated pastures. According to the model, at a depth of 0.20 m in the natural pasture, the litter stock was 33.14 Mg ha−1 of carbon with less monthly variation than under the cultivated pastures (37 Mg ha−1 month−1). In the pasture soils, the respiration was 1.12 Mg C eq ha−1 month−1. In cultivated pastures, the flow of respiration was 0.42 Mg ha−1 month−1 with high variability. The average humus was 89.53 ± 1.00 Mg ha−1 month−1 for the natural pasture and 72.00 ± 0.48 Mg ha−1 month−1 for the cultivated pasture.
The output flows from litter stock depend on the flows of humification, assimilation, and respiration of the stock, which are determined by the rate of mineralization (K1). On average, they were mineralized at 1.1 Mg ha−1 month−1 in natural pastures and 0.42 ± 0.12 Mg ha−1 month−1 in cultivated pastures. The carbon humified in natural pasture was 89.53 Mg ha−1 and 72 Mg ha−1 month−1 in the cultivated pasture; the carbon assimilation was 0.03 Mg ha−1 month−1 in natural pasture and 0.07 ± 0.01 Mg ha−1 month−1 in cultivated pasture. The carbon flow in the surface runoff ranged from 0.39 × 10⁻³ Mg ha−1 to 0.53 × 10⁻³ Mg ha−1 because of extreme precipitation that exceeded 200 mm month−1. In the cultivated pastures, the average carbon flow in the surface runoff was 1.27 × 10⁻³ Mg ha−1 month−1.
Microbial biomass had greater monthly variability in natural pastures (0.24 Mg ha−1 month−1) than in cultivated pastures (0.10), due to constant litter inputs. This flow was determined by the carbon available through humification and respiration, represented by the assimilation fraction and the mineralization rate K1, and an output flow from the decay of microbial biomass at a rate Kd. Both the rate Kd and the metabolic quotient were higher under cultivated pastures than under natural pastures, suggesting a possible imbalance of the microbial community under the crops, and indicating that the progressive and continual management is generating stress in the soil. In both natural and cultivated pastures, the increase in the C stock in humus was not significant; the humification of the litter and the rate of secondary mineralization K2 were low. The soils under the two management systems stored high concentrations of soil organic carbon: 123.7 for natural pastures and 110.3 Mg ha−1 month−1 for cultivated pastures (Figure 3).
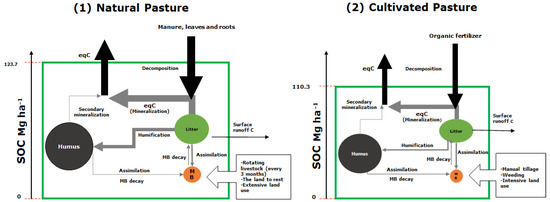
Figure 3.
Carbon storage dynamics for two management schemes resulting from modeling with software Insight Maker: (1) natural and (2) cultivated pasture. Arrows show input and output flows with their respective magnitudes. Circles represent pools and size of organic carbon depots: humus, litter and (MB) microbial biomass.
4. Discussion
4.1. Soil Carbon Dynamics under Pasture Managements (Natural and Cultivated)
The model showed that the main changes in the soil C dynamics under the two pastures took place in the stocks of litter and of microbial biomass. Organic C stocks in litter and microbial biomass are controlled by the quantity and type of organic material input, which varied according to the type of management implemented. In this regard, Koga [52] found a positive relationship between the amount of total carbon input and the change in soil carbon reserves as a result of the management carried out in the soil. The characteristics of the organic material input (the quantity, periodicity and the chemical composition) influence the organic C build-up in the different soil compartments. For example, the natural pastures incorporate higher quantities of organic material through greater below-ground net primary productivity, with the senescence and turnover of plant roots being of great importance for this process [5,42,53]; hence, there was less microbial biomass decrease during the study period. Therefore, in pastures established for over 40 years, the soil carbon content does not differ from the content in forest soils prior to the change in land use [54]. At the same time, the supply of fresh dung increases carbon storage in this soil, averting a net annual loss. It has been shown that the input of organic matter increases C storage in the soil, [55,56] as observed in our study. However, in the case of these cultivated pastures, when the litter stock decreased, the microorganisms showed the lowest biomass. This is due to the fact that organic material is applied only infrequently during forage production and is insufficient for the growth of the microorganisms and for their activity and development to predominate over their rate of decay; this affects the humification and mineralization processes [57]. Therefore, the progressive and continuous management of the soil in this cultivated pasture generates stress, as suggested by the higher rate of microorganism decay, high metabolic coefficient and reduced stock of microbial biomass [57].
In the natural pastures, the higher C:N ratio and the greater variety of the organic matter supplied to the soil system provide the microorganisms a higher quantity of available carbon and enhance the microbial activity in order to mineralize the residue [58]. The output of CO2 (C equivalent in the model) from the soils at 0.70% to 0.78% of the organic material input coincides with the results obtained in the soils under pastures reported by Bertora et al. [37] and Batlle-Aguilar et al. [36]; CO2 emissions were higher in the natural pastures due to the higher input of organic material undergoing mineralization by the microorganisms for the production of energy, and also because of the greater production of roots in the system, which also contribute CO2 [59,60]. In the cultivated pastures, mineralization of the organic material produces a rapid increase in the microbial biomass, leading to significant emission of CO2 [61]. Although the C outputs by surface runoff were not significant for the C dynamics in this kind of pasture soils, the carbon loss was greater in the soil under cultivated pasture. Plowing and weed removal leave the cropped soil uncovered and would thus be expected to increase the potential for carbon loss through washout during intense precipitation events (36.5 L of surface runoff with 9.71 mg L−1 of organic carbon), increasing the susceptibility to soil erosion. In the long term, this could contribute to soil degradation, although this could not be corroborated in this study.
The average values of SOC in these pastures are three times those reported for oxisols in Brazil and the eastern Colombian plains [5,62]. The allophanes present in andisols form highly stable organo-mineral complexes with the organic material, impeding its mineralization and creating a high potential for carbon storage [63,64,65]. No loss of organic carbon from the humus was observed during the study period in either system; 65% to 72% of the organic C was stored in this stock for both management schemes. Thus, improving soil management practices will allow maintaining and increasing carbon storage in the soil, which is a strategy to avoid further land degradation [11] since it can enhance almost every aspect of soil functioning, ranging from soil fertility to soil structure, from water retention and infiltration capacity to the regulation of nutrients [66]. The soil C storage was greater under natural pasture, due to the continual input of organic material and the restricted anthropogenic intervention; this has benefitted the microbial biomass and its metabolic efficiency. In contrast, the soil under cultivated pastures has lower carbon storage, with no gain observed in organic C during the study period, since the inputs of organic material to the system depend on organic fertilizer, and this is only occasionally supplied by the farmers.
4.2. Soil Carbon Management Practices
Based on the modeling, we recommend a 1.5-fold increase in the input of organic fertilizer (compost) to the cultivated pasture (~1000 kg ha−1), supplemented with crop residues. In this sense, the preparation of organic amendments from grazing (manure) make it possible to generate a useful organic amendment in order to compensate for nutrient and organic matter loss in the cultivated soil pasture. Thus, the organic carbon in the litter will increase and, consequently, soil biological processes will increase as well; this could enhance the metabolic rate of the microbial biomass and therefore hold down its mortality rate. Additionally, if the tillage practices are changed to direct sowing without plowing and if organic material, such as stover or litter, is maintained on the soil surface, the organic matter mineralization will be minimized, resulting in lower CO2 emissions, as well as in the reduction of losses from surface runoff. It will now be necessary to determine how much of a benefit the soil organic matter can provide in future climate conditions, both in terms of adaptation and mitigation. The limitations of soil organic matter as a buffer in deteriorating conditions are unknown. The adoption of the aforementioned measures increases carbon storage and gives the soils the potential to mitigate the effects of climate change. In addition, farmers can prevent the increase of surface runoff through improved agricultural practices such as litter farming, alley cropping (agro-forestry), no-tillage farming, strip cropping, contour farming, ridge-and-mound tillage and terrace farming [67,68].
5. Conclusions
Model can help explain the main interactions, magnitudes, and velocity by which the biological processes accumulate soil organic carbon in pasture land. The results of the model may suggest possible strategies to increase soil carbon storage and reduce CO2 emissions through improved soil management in natural and cultivated pastures. The model predicts the dynamics of the organic C in the soil with a good adjustment, based on the results of SOC, which were differentiated as MB, humus, and litter. At the same time, it depicted the relationships among the main elements and the magnitudes and rates of the processes that influence the dynamics of carbon storage in the soils under pastures, especially those components that present measuring difficulties in the field, with values that fit the average respiration data (Ceq) reported in the area. In this sense, the results of the model may explain the effects of management on soil processes, which control the cycle and distribution of C, allowing the suggestion of possible strategies to increase soil carbon storage and to reduce CO2 emissions through improved soil management in natural and cultivated pastures. The main changes in the SOC dynamics took place in the active pools, microbial biomass and litter. Comparing both management schemes suggested that the diversification of organic inputs consistently promoted the growth of microbial biomass and metabolic efficiency. In contrast, intensive cultivated pasture management, involving the removal of plant cover, plowing, and low input of organic matter, puts the microbial community under stress and increases the potential carbon loss through secondary mineralization and surface runoff. Consequently, there is an imperative need to improve agricultural management practices in order to increase the SOC storage potential, while improving agricultural sustainability and lowering atmospheric CO2 emissions.
Author Contributions
Conceptualization, M.-C.O. and A.F.; methodology, J.F.C.O. and M.-C.O.; validation, J.F.C.O., M.-C.O.; formal analysis, J.F.C.O. and M.-C.O.; investigation, M.-C.O.; data curation, J.F.C.O., M.-C.O.; writing—original draft preparation, M.-C.O., J.F.C.O., L.G.; writing—review and editing, M.-C.O., J.F.C.O., L.G.; visualization, M.-C.O., J.F.C.O., L.G., A.F.; supervision, A.F.; funding acquisition, A.F. All authors have read and agreed to the published version of the manuscript.
Funding
This research was funded by Ministerio de Ciencia, Tecnología e Innovación from Colombia grant number ($34.624), Grupo de Estudios Ambientales—Universidad del Cauca [$3000], RICCLISA U.T ($5500) and The APC was funded by (Ecotecma SAS and co-authors).
Acknowledgments
Special thanks to the Ministerio de Ciencia, Tecnología e Innovación from Colombia for funding the doctoral program, to the Red Interinstitucional de Cambio Climático y Seguridad Alimentaria—RICCLISA and the Grupo de Estudios Ambientales—Universidad del Cauca for their logistical and financial support and to Néstor Riaño and Miguel Peña for their presence and technical support throughout the development of this research.
Conflicts of Interest
The authors declare no conflicts of interest.
Appendix A
Table A1.
Parameters of the soil carbon model developed for the natural and cultivated pastures.
Table A1.
Parameters of the soil carbon model developed for the natural and cultivated pastures.
| Abbreviation | Definition | Unit |
|---|---|---|
| MB | Stock of microbial biomass OC | Mg ha−1 |
| L | Carbon in the organic residues | Mg ha−1 |
| H | Humus | Mg ha−1 |
| Quant | Flow of organic input (Quantity) | Mg ha−1 month−1 |
| Min | Flow of respiration of the organic carbon in the residues | Mg ha−1 month−1 |
| Humification | Flow of humification | Mg ha−1 month−1 |
| Assi and Assi2 | Flow of assimilation | Mg ha−1 month−1 |
| Decay | Flow of MB decay | Mg ha−1 month−1 |
| Min2 | Flow of secondary mineralization | Mg ha−1 month−1 |
| K1 | Rate of residue decomposition | month−1 |
| K2 | Rate of humus decomposition | month−1 |
| Fh | Fraction of humification | Adimensional |
| Fr | Fraction of respiration | Adimensional |
| Kd | Rate of MB decay | month−1 |
| Runoff | Surface runoff | Mg ha−1 |
| DEC1 | Decomposition relation Cant, T, C/N | Mg ha−1 month−1 |
| DEC2 | Decomposition relation with Cant | Mg ha−1 month−1 |
| Qual | C:N ratio of residues (Quality) | Adimensional |
| Air T | Air Temperature | Centigrade grade |
| P | Precipitation | mm month−1 |
| F1, F2 | Conditional factors | Adimensional |

Figure A1.
Coefficient of determination (R2) between observed and modeled data on SOC in the monthly time step for both pasture managements: (1) natural and (2) cultivated pasture.
Figure A1.
Coefficient of determination (R2) between observed and modeled data on SOC in the monthly time step for both pasture managements: (1) natural and (2) cultivated pasture.

References
- Suttie, J.M.; Reynolds, S.G.; Batello, C. Grasslands of the World; FAO: Rome, Italy, 2005; Volume 34. [Google Scholar]
- Reeder, J.D.; Schuman, G.E. Influence of livestock grazing on C sequestration in semi-arid mixed-grass and short-grass rangelands. Environ. Pollut. 2002, 116, 457–463. [Google Scholar] [CrossRef]
- Lal, R. Soil Carbon Sequestration Impacts on Global Climate Change and Food Security. Science 2004, 304, 1623–1627. [Google Scholar] [CrossRef]
- Campbell, A.; Miles, L.; Lysenko, I.; Hughes, A.; Gibbs, H. Carbon Storage in Protected Areas: Technical Report; UNEP World Conservation Monitoring Centre: Cambridge, UK, 2008. [Google Scholar]
- Fisher, M.J.; Braz, S.P.; Santos, R.S.M.D.; Urquiaga, S.; Alves, B.; Boddey, R.M. Another dimension to grazing systems: Soil carbon. Trop. Grassl. 2007, 41, 65–83. [Google Scholar]
- Dahlgren, R.A.; Saigusa, M.; Ugolini, F.C. The Nature, Properties and Management of Volcanic Soils. In Advances in Agronomy; Academic Press: Cambridge, MA, USA, 2004; Volume 82, pp. 113–182. [Google Scholar]
- Panichini, M.; Mora, M.; Rumpel, C.; Borie, F.; Matus, F.; Godoy, R.; Bolan, N. Carbon distribution in top-and subsoil horizons of two contrasting Andisols under pasture or forest. Eur. J. Soil Sci. 2012, 63, 616–624. [Google Scholar] [CrossRef]
- Post, W.M.; Kwon, K.C. Soil carbon sequestration and land-use change: Processes and potential. Glob. Chang. Boil. 2000, 6, 317–327. [Google Scholar] [CrossRef]
- Mujuru, L.; Mureva, A.; Velthorst, E.; Hoosbeek, M. Land use and management effects on soil organic matter fractions in Rhodic Ferralsols and Haplic Arenosols in Bindura and Shamva districts of Zimbabwe. Geoderma 2013, 209, 262–272. [Google Scholar] [CrossRef]
- Falcón, R.L. Degradacion del Suelo, Causas Procesos Evaluación e Investigación; Centro Interamericano de Desarrollo e Investigación Ambiental y Territorial—Universidad de los Andes: Merida, Venezuela, 2002. [Google Scholar]
- Keesstra, S.; Bouma, J.; Wallinga, J.; Tittonell, P.; Smith, P.; Cerdá, A.; Montanarella, L.; Quinton, J.; Pachepsky, Y.; Van Der Putten, W.H.; et al. The significance of soils and soil science towards realization of the United Nations Sustainable Development Goals. Soil 2016, 2, 111–128. [Google Scholar] [CrossRef]
- Campbell, E.E.; Paustian, K. Current developments in soil organic matter modeling and the expansion of model applications: A review. Environ. Res. Lett. 2015, 10, 123004. [Google Scholar] [CrossRef]
- Ryan, M.G.; Law, B.E. Interpreting, measuring, and modeling soil respiration. Biogeochem. 2005, 73, 3–27. [Google Scholar] [CrossRef]
- Sanderson, M.A.; Archer, D.; Hendrickson, J.; Kronberg, S.; Liebig, M.; Nichols, K.; Schmer, M.; Tanaka, D.; Aguilar, J. Diversification and ecosystem services for conservation agriculture: Outcomes from pastures and integrated crop–livestock systems. Renew. Agric. Food Syst. 2013, 28, 129–144. [Google Scholar] [CrossRef]
- Turner, M.G.; Carpenter, S.R. Ecosystem Modeling for the 21st Century. Ecosystems 2016, 20, 211–214. [Google Scholar] [CrossRef]
- Battles, J.; Armesto, J.; Vann, D.R.; Zarin, D.J.; Aravena, J.C.; Pérez, C.; Johnson, A.H. Vegetation composition, structure, and biomass of two unpolluted watersheds in the Cordillera de Piuchué, Chiloé Island, Chile. Plant Ecol. 2002, 158, 5–19. [Google Scholar] [CrossRef]
- Peltoniemi, M.; Heikkinen, J.; Mäkipää, R. Stratification of regional sampling by model-predicted changes of carbon stocks in forested mineral soils. Silva Fenn. 2007, 41, 527–539. [Google Scholar] [CrossRef]
- Smith, P.; Smith, J.; Powlson, D.; McGill, W.; Arah, J.; Chertov, O.; Coleman, K.; Franko, U.; Frolking, S.; Jenkinson, D.; et al. A comparison of the performance of nine soil organic matter models using datasets from seven long-term experiments. Geoderma 1997, 81, 153–225. [Google Scholar] [CrossRef]
- Ito, A. Simulated impacts of climate and land-cover change on soil erosion and implication for the carbon cycle, 1901 to 2100. Geophys. Res. Lett. 2007, 34. [Google Scholar] [CrossRef]
- Pansu, M.; Sarmiento, L.; Metselaar, K.; Hervé, D.; Bottner, P. Modelling the transformations and sequestration of soil organic matter in two contrasting ecosystems of the Andes. Eur. J. Soil Sci. 2007, 58, 775–785. [Google Scholar] [CrossRef]
- Nicolardot, B.; Recous, S.; Mary, B. Simulation of C and N mineralisation during crop residue decomposition: A simple dynamic model based on the C:N ratio of the residues. Plant Soil 2001, 228, 83–103. [Google Scholar] [CrossRef]
- United States Department of Agriculture (USDA). Keys to Soil Taxonomy by Soil Survey Staff, 12th ed.; United States Department of Agriculture Natural Resources Conservation Service: Washington, DC, USA, 2014.
- Instituto Geográfico Agustín Codazzi. Estudio General de Suelos y Zonificación de Tierras Departamento del Cauca Escala 1: 100.000; Imprenta Nacional de Colombia: Bogotá, Colombia, 2009; Volume 1.
- CRC. Plan de Ordenación y Manejo de la Subcuenca Hidrográfica del Río las Piedras; Corporación Autónoma Regional del Cauca: Popayán, Colombia, 2006.
- Pearson, T.; Walker, S.; Brown, S. Sourcebook for Land Use, Land-Use Change and Forestry Projects; Winrock International: Washington, DC, USA, 2005. [Google Scholar]
- Burt, R. Soil Survey Staff, Method 3B6a. Soil Survey Laboratory Methods Manual; USDA-NRCS. GPO: Washington, DC, USA, 2004; Volume 42.
- Bittelli, M. Measuring soil water content: A review. HortTechnology 2011, 21, 293–300. [Google Scholar] [CrossRef]
- Environmental Protection Agency. Method 9045D. Soil and Waste pH; Environmental Monitoring and Support Lab., U.S. Environmental Protection Agency: Cincinnati, OH, USA, 2004.
- Schumacher, B.A. Methods for the Determination of Total Organic Carbon (TOC) in Soils and Sediments; EPA: Washington, DC, USA, 2002.
- Soil Survey Staff. Kellogg Soil Survey Laboratory Methods Manual. Soil Survey Investigations Report No. 42, Version 5.0; Burt and Soil Survey Staff, Ed.; U.S. Department of Agriculture, Natural Resources Conservation Service: Lincoln, NE, USA, 2014.
- Gomez-Taylor, M. Total Kjeldahl Nitrogen in Water and Biosolids by Automated Colorimetry with Preliminary Distillation/Digestion; U.S. Environmental Protection Agency Office of Water Office of Science and Technology Engineering and Analysis Division: Washington, DC, USA, 2001.
- Vance, E.; Brookes, P.; Jenkinson, D. Microbial biomass measurements in forest soils: The use of the chloroform fumigation-incubation method in strongly acid soils. Soil Boil. Biochem. 1987, 19, 697–702. [Google Scholar] [CrossRef]
- Porporato, A.; D’Odorico, P.; Laio, F.; Rodriguez-Iturbe, I. Hydrologic controls on soil carbon and nitrogen cycles. I. Modeling scheme. Adv. Water Resour. 2003, 26, 45–58. [Google Scholar] [CrossRef]
- Piccolo, A.; Spaccini, R.; Drosos, M.; Vinci, G.; Cozzolino, V. The molecular composition of humus carbon: Recalcitrance and reactivity in soils. In The Future of Soil Carbon: Its Conservation and Formation; Elsevier Science Publishing Co. Inc.: San Diego, CA, USA, 2018; p. 38. [Google Scholar]
- Jenkinson, D.S.; Andrew, S.P.S.; Lynch, J.M.; Goss, M.J.; Tinker, P.B. The Turnover of Organic Carbon and Nitrogen in Soil [and Discussion]. Philos. Trans. Biol. Sci. 1990, 329, 361–368. [Google Scholar]
- Batlle-Aguilar, J.; Brovelli, A.; Porporato, A.; Barry, D.A. Modelling soil carbon and nitrogen cycles during land use change. A review. Agron. Sustain. Dev. 2011, 31, 251–274. [Google Scholar] [CrossRef]
- Bertora, C.; Zavattaro, L.; Sacco, D.; Monaco, S.; Grignani, C. Soil organic matter dynamics and losses in manured maize-based forage systems. Eur. J. Agron. 2009, 30, 177–186. [Google Scholar] [CrossRef]
- Realpe, I.D.S.B.; Pardo, C.A.A.; Peinado, F.J.M. Efecto de la calidad de la materia orgánica asociada con el uso y manejo de suelos en la retención de cadmio en sistemas altoandinos de Colombia. Acta Agron. 2014, 63, 164–174. [Google Scholar] [CrossRef]
- Antil, R.; Bar-Tal, A.; Fine, P.; Hadas, A. Predicting Nitrogen and Carbon Mineralization of Composted Manure and Sewage Sludge in Soil. Compos. Sci. Util. 2011, 19, 33–43. [Google Scholar] [CrossRef]
- Sánchez-Cárdenas, S.; Crespo-López, G.; Hernández-Chávez, M.; García-Ortega, Y. Estudio de la descomposición de la hojarasca en un pastizal de Panicum maximum Jacq cv. Likoni. Pastos Forrajes 2007, 30, 2007. [Google Scholar]
- Arriola, I.S. Producción de hojarasca y reciclaje de nutrientes de dos especies arbóreas y dos gramíneas en pasturas de Muy Muy, Nicaragua; CATIE: Turrialba, Costa Rica, 2006. [Google Scholar]
- Trujillo, W.; Fisher, M.; Lal, R. Root dynamics of native savanna and introduced pastures in the Eastern Plains of Colombia. Soil Tillage Res. 2006, 87, 28–38. [Google Scholar] [CrossRef]
- Eusufzai, M.K.; Deb, S.K.; Fujii, K.; Maeda, T. Mass Loss and C and N Release from Decomposing Fresh and Composted Residues as Affected by Cold Climate Conditions. Environ. Nat. Resour. Res. 2013, 3, 116–127. [Google Scholar] [CrossRef]
- Soltner, D. Les Bases de La Production Végétale (I): Le Sol, 22nd ed.; Sciences et Techniques Agricoles: Bressuire, France, 2005. [Google Scholar]
- Huang, C.-Y.; Hendrix, P.F.; Fahey, T.J.; Bohlen, P.J.; Groffman, P.M. A simulation model to evaluate the impacts of invasive earthworms on soil carbon dynamics. Ecol. Model. 2010, 221, 2447–2457. [Google Scholar] [CrossRef]
- Fu, S.; Cabrera, M.L.; Coleman, D.; Kisselle, K.W.; Garrett, C.J.; Hendrix, P.F.; Crossley, D.A. Soil carbon dynamics of conventional tillage and no-till agroecosystems at Georgia Piedmont—HSB-C models. Ecol. Model. 2000, 131, 229–248. [Google Scholar] [CrossRef]
- Food and Agriculture Organization (FAO). Manual de Sistemas de Labranza Para América Latina; FAO: Roma, Italy, 1992. [Google Scholar]
- De Myttenaere, A.; Golden, B.; Le Grand, B.; Rossi, F. Mean Absolute Percentage Error for regression models. Neurocomputing 2016, 192, 38–48. [Google Scholar] [CrossRef]
- Willmott, C.; Matsuura, K. Advantages of the mean absolute error (MAE) over the root mean square error (RMSE) in assessing average model performance. Clim. Res. 2005, 30, 79–82. [Google Scholar] [CrossRef]
- Manzoni, S.; Jackson, R.B.; Trofymow, J.A.; Porporato, A. The Global Stoichiometry of Litter Nitrogen Mineralization. Science 2008, 321, 684–686. [Google Scholar] [CrossRef]
- Ratcliffe, S.; Bosman, B.; Carnol, M. Spatial and temporal variability of biological indicators of soil quality in two forest catchments in Belgium. Appl. Soil Ecol. 2018, 126, 148–159. [Google Scholar] [CrossRef]
- Koga, N. Tillage, fertilizer type, and plant residue input impacts on soil carbon sequestration rates on a Japanese Andosol. Soil Sci. Plant Nutr. 2017, 63, 396–404. [Google Scholar] [CrossRef]
- Ibrahim, M.; Chacón, M.; Cuartas, C.; Naranjo, J.; Ponce, G.; Vega, P.; Casasola, F.; Rojas, J. Almacenamiento de carbono en el suelo y la biomasa arbórea en sistemas de usos de la tierra en paisajes ganaderos de Colombia, Costa Rica y Nicaragua. Agrofor. Am. 2007, 45, 27–36. [Google Scholar]
- Trilleras, J.; Jaramillo, V.J.; Vega, E.V.; Balvanera, P. Effects of livestock management on the supply of ecosystem services in pastures in a tropical dry region of western Mexico. Agric. Ecosyst. Environ. 2015, 211, 133–144. [Google Scholar] [CrossRef]
- Kong, A.Y.Y.; Six, J.; Bryant, D.C.; Denison, R.F.; Van Kessel, C. The Relationship between Carbon Input, Aggregation, and Soil Organic Carbon Stabilization in Sustainable Cropping Systems. Soil Sci. Soc. Am. J. 2005, 69, 1078. [Google Scholar] [CrossRef]
- Thomsen, I.; Christensen, B. Yields of wheat and soil carbon and nitrogen contents following long-term incorporation of barley straw and ryegrass catch crops. Soil Use Manag. 2004, 20, 432–438. [Google Scholar] [CrossRef]
- Masto, R.E.; Chhonkar, P.K.; Singh, D.; Patra, A. Changes in soil biological and biochemical characteristics in a long-term field trial on a sub-tropical inceptisol. Soil Boil. Biochem. 2006, 38, 1577–1582. [Google Scholar] [CrossRef]
- Pandey, C.B.; Singh, G.B.; Singh, S.K.; Singh, R.K. Soil nitrogen and microbial biomass carbon dynamics in native forests and derived agricultural land uses in a humid tropical climate of India. Plant Soil 2010, 333, 453–467. [Google Scholar] [CrossRef]
- Luo, Y.; Zhou, X. Chapter 3—Processes of CO2 production in soil. In Soil Respiration and the Environment; Luo, Y., Zhou, X., Eds.; Academic Press: Cambridge, MA, USA, 2006; pp. 35–59. [Google Scholar]
- Ajwa, H.; Dell, C.; Rice, C. Changes in enzyme activities and microbial biomass of tallgrass prairie soil as related to burning and nitrogen fertilization. Soil Boil. Biochem. 1999, 31, 769–777. [Google Scholar] [CrossRef]
- Havlin, J.L.; Beaton, J.D.; Tisdale, S.L.; Nelson, W.L. Soil Fertility and Fertilizers: An Introduction to Nutrient Management. In Soil Fertility and Fertilizers; Pearson Education: Cranbury, NJ, USA, 2004; p. 528. [Google Scholar]
- Tonucci, R.; Nair, P.K.R.; Nair, V.D.; Garcia, R.; Bernardino, F.S. Soil Carbon Storage in Silvopasture and Related Land-Use Systems in the Brazilian Cerrado. J. Environ. Qual. 2011, 40, 833. [Google Scholar] [CrossRef]
- Aran, D.; Gury, M.; Jeanroy, E. Organo-metallic complexes in an Andosol: A comparative study with a Cambisol and Podzol. Geoderma 2001, 99, 65–79. [Google Scholar] [CrossRef]
- Powlson, D.; Gregory, P.; Whalley, W.R.; Quinton, J.; Hopkins, D.; Whitmore, A.; Hirsch, P.R.; Goulding, K. Soil management in relation to sustainable agriculture and ecosystem services. Food Policy 2011, 36, S72–S87. [Google Scholar] [CrossRef]
- Blanchart, E.; Bernoux, M.; Sarda, X.; Siqueira Neto, M.; Cerri, C.; Piccolo, M.; Douzet, J.M.; Scopel, E. Effect of direct seeding mulch-based systems on soil carbon storage and macrofauna in Central Brazil. Agric. Conspec. Sci. 2007, 72, 81–87. [Google Scholar]
- Jackson, R.B.; Lajtha, K.; Crow, S.E.; Hugelius, G.; Kramer, M.G.; Piñeiro, G. The Ecology of Soil Carbon: Pools, Vulnerabilities, and Biotic and Abiotic Controls. Annu. Rev. Ecol. Evol. Syst. 2017, 48, 419–445. [Google Scholar] [CrossRef]
- Food and Agriculture Organization of the United Nations (FAO). Land and Water Development Division. In Soil Tillage in Africa: Needs and Challenges; FAO: Rome, Italy, 1993. [Google Scholar]
- Nzeyimana, I.; Hartemink, A.; Ritsema, C.J.; Stroosnijder, L.; Lwanga, E.H.; Geissen, V. Mulching as a strategy to improve soil properties and reduce soil erodibility in coffee farming systems of Rwanda. Catena 2017, 149, 43–51. [Google Scholar] [CrossRef]


© 2020 by the authors. Licensee MDPI, Basel, Switzerland. This article is an open access article distributed under the terms and conditions of the Creative Commons Attribution (CC BY) license (http://creativecommons.org/licenses/by/4.0/).