Abstract
Cotton suffers from alternations of flood and drought in China. A lysimeter trial was conducted to investigate the responses of various cotton yield indices under water-stress treatments including, flood (five-day, eight-day), drought (10-day, 15-day), and five-day flood followed by 10-day drought, during the flowering and boll-forming stage. The results showed that the seed cotton yield was significantly (p < 0.05) reduced under all water-stress treatments, while the harvest index was not affected under any treatment. Significant decreases in dry matter yield, boll number, and boll hull mass were detected under flood treatments but not under drought treatments. The percentage cotton yield losses per day induced by flood and drought were 6.22% and 2.48%, respectively. Under water stress, the associations between seed cotton yield and relevant yield indices were weakened, but yield losses were still strongly related to the decreases in dry matter yield and boll number. Flood followed by drought caused significant reductions in all yield indices except harvest index; however, the reduction was much lower than the additive reductions induced by flood and drought. These results provide bases for scheduling irrigation and drainage under climate change.
1. Introduction
Drought and flood are two major meteorological disasters all around the world. As for agricultural production, drought is a major reason for soil dryness in fields (inducing agricultural drought), and flood usually brings excessive soil water; both of them severely restrict field crop yields. To eliminate the negative impacts of drought (referring to agricultural drought in this study) and flood stresses on crops, it is essential to develop appropriate irrigation and drainage schedules. However, in the context of global climate change, droughts and flood occur more frequently and severely; they also alternate, which poses new threats to agricultural production [1,2,3,4]. Thus, it is speculated that traditional schedules of irrigation and drainage could be improved by accounting for the particular responses of crop yields under alternating drought and flood stresses.
Cotton (Gossypium hirsutum L.) is a leading industrial crop in the world; however, its production is severely restricted by various factors, such as drought, high temperature, flood, low light, and nutrients deficiency [5,6,7,8,9]. China has been the second largest cotton production country for many years, contributing ~30% of global cotton production [10], and the Middle-Lower Yangtze River plain is one of the three major cotton production regions in China. However, due to climate change, this region is being confronted with increasing threats from the alternations of flood and drought during summer [4]. More importantly, the cotton plants in this area go through critical growth and development stages (i.e., flowering and boll-forming stage [11]) during summer, thus compounding the alternating stress of drought and flood on cotton [3].
Alternating stress of drought and flood is a complex water stress and has many specific forms, such as drought-flood alternation, flood-drought alternation, and drought-drought (flood-flood) alternation. The combined effect of two stresses are usually non-additive [9,12,13]; thus, the specific impact of the combination of drought and flood is expected to be investigated. Currently, rice is the only crop that has been the topic of numerous studies concerning the alternating flood and drought stress [14,15,16,17]. In contrast, only a few scholars have carried out relevant research on upland crops, mainly wheat [2,18], cotton [3], and sugarcane [19]. Moreover, among these studies, the scenario of drought followed by flood was more often investigated than the scenario of flood followed by drought. As a result, to the best of our knowledge, the yield-reducing effects of flood followed by drought on cotton still remain unclear. However, considering that flood-drought patterns occur during the cotton growth period in some regions [3], it is necessary to experimentally study the cotton yield response to flood followed by drought.
To explore the effects of flood followed by drought on cotton, it is imperative to understand cotton responses to drought alone and flood alone. Although flood and drought are totally different water stresses, they affect cotton growth and yield in similar ways. Specifically, the cotton root is the first organ to sense water stress, and its activity and functions are restrained, thus inhibiting water and nutrient uptake by the roots [20,21,22]. Accordingly, the aboveground cotton organs show morphological and physiological responses, such as impeded leaf growth and disturbed physiological processes, which reduces biomass accumulation [23,24,25,26,27]. Moreover, boll formation and survival are affected [3,6,28,29]. Consequently, all these responses result in yield losses. In general, cotton yield was found to be severely reduced by both flood and drought, but the yield-reducing effects are influenced by the intensities and timings of water stress [3,26,30,31,32], as well as other experimental factors such as air temperature and soil nutrients [27,29]. Apart from the abovementioned negative responses of cotton under water stress, cotton also shows adaptive abilities, such as extending roots to deeper soil to extract more water under drought conditions or generating adventitious roots and aerenchyma to extract more oxygen under flood conditions [7,33]. Thus, in some studies, when the drought or flood intensity is mild, cotton yield can avoid obvious reductions [3,6,34,35]. Hence, when cotton suffers from flood followed by drought, cotton adaptation probably plays an important role. For instance, in one cotton experiment [31] that aimed to reveal the yield-reducing effects of flood followed by waterlogging, the results showed that a preceding flood significantly weakened the yield-reducing effect of the following waterlogging stress.
Although the responses of cotton to flood followed by drought remain unclear, relevant studies on other crops have been reported. Wheat and barley research [2,18] has shown that no interaction between flood and drought was found. In comparison, in a sugarcane experimental investigation, adding drought even after flood events did not additively impair sugar yield [19]. It is suggested that crop responses to flood followed by drought depend on the crop species. Cotton is known as a flood-sensitive crop [6]. Under flood followed by drought, cotton is firstly affected by preceding flood and then is subjected to another water stress. How would this combined stress ultimately affect cotton yield is uncertain.
Thus, the objectives of this work were (a) to reveal cotton yield responses to different intensities of flood alone and drought alone and, accordingly, (b) to evaluate the combined impact of flood followed by drought on yield in cotton plants.
2. Materials and Methods
2.1. Experimental Sites
A lysimeter experiment was conducted at the irrigation and drainage field site of Wuhan University (30°33′ N, 114°22′ E), Wuhan, China, from May to October in 2019. Wuhan is the capital of Hubei Province, which is a major cotton-production province in China. The air temperature, precipitation, and sunshine hours in Wuhan during the cotton growing periods are shown in Figure 1a–c. During July and August (i.e., the critical growing period for local cotton), local air temperature, precipitation and solar radiation conditions are sufficient for cotton growth and development. However, the interannual variations in precipitation are relatively large during cotton growth periods (Figure 1b); thus, in some years when precipitation is more unevenly distributed within the year (e.g., 2019), drought stress may occur between two rainfall events and induce alternations of flood and drought [3]. During the water stress period (lasting for 40 days) in our experiment, the additive precipitation was 10.9 mm, averaged daily sunshine duration was 7.7 h, and averaged daily mean temperature was 29.2 °C. Thus, the water stress periods were majorly with sunny weather and little precipitation, which helped speed the process of achieving soil drought conditions.
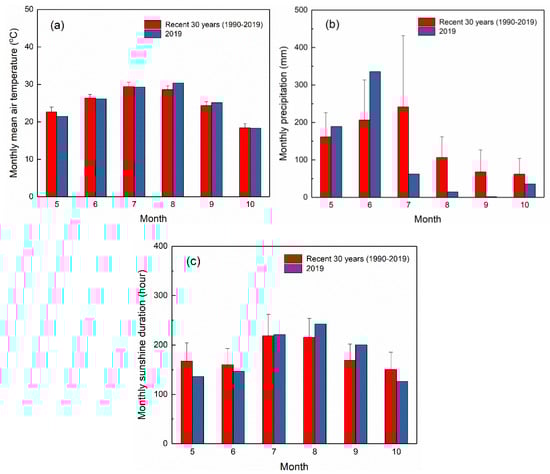
Figure 1.
The monthly air temperature (a), precipitation (b), and sunshine duration (c) at the study area during the experimental year and the recent 30 years. The results of 1990–2019 are the averaged values of these years and are with vertical bars indicating standard deviations. Bars without standard deviations means there is no error or the error was near to zero.
2.2. Lysimeters, Cotton Cultivars, and Field Management
The lysimeters were uniformly 2 m wide, 2 m long, and 3 m deep. Inverted filters consisting of ~0.3 m thick sand and gravel were first placed on the bottom of the lysimeters; then, the soil collected from another district in Wuhan was backfilled into the lysimeters to ~0.10 m from the top of the lysimeters. A set of mobile plastic and transparent shelters were constructed nearby and were moved to cover the lysimeters during rainy days. The lysimeters and shelters are illustrated in Figure 2.
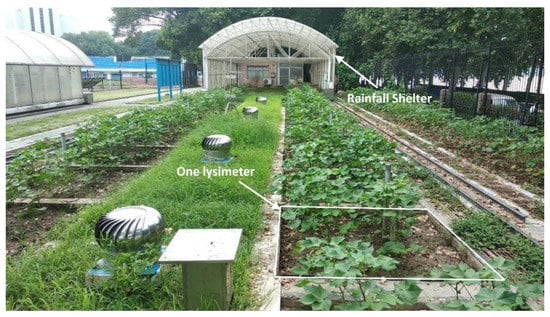
Figure 2.
The employed lysimeters and mobile shelters at the experimental site.
The soil type of the lysimeter soils was classified as silty clay loam soil according to the US soil texture classification [36], with a saturated water content and a field capacity (FC) of 44.6% and 32.0% (in volumetric moisture content), respectively. In addition, each lysimeter was equipped with an automatically controlled water supply and drainage system (designed by Wuhan University, China, [13,37]) capable of regulating the water tables to designated levels.
The cotton cultivar E’kang 9 was chosen because it is a commonly-used cultivar in the research area [13]. Cotton seeds were sown directly on the surface soil of every lysimeter on 25 May, and the cotton plants (including roots) were dug out and collected on 28 October. At each lysimeter, six cotton plants were planted with a row spacing of 0.67 m and a line spacing of 1 m. Compound fertilizers (17% N, 17% P, 17% K) were applied three times (i.e., 25 May, 14 June, and 10 July) at application rates of 280 kg/ha of N, P, and K, respectively. Weeds were removed by hand throughout the cotton growing period. Other field management practices, such as disease and pest control, pruning, and topping, were performed based on local practice.
2.3. Lysimeter Experimental Design
In field conditions, alternations of flood and drought have many specific forms, such as drought-flood, flood-drought, flood-flood, and drought-drought. This work focused on the flood-drought alternation, which is rarely investigated but exists in cotton fields.
To achieve our objectives, different intensities and forms of flood and drought were established. The designed durations and criteria for drought and flood were determined based on our previous cotton experiments in recent years. The flood events were performed by increasing lysimeter water levels, eventually maintaining ~10 cm of surface water. When the flood events were discontinued, the water tables were lowered to the bottom of lysimeters (−260 cm). The drought events were simulated by stopping irrigation, lowering the water table, and keeping rainfall out with the mobile shelters. Based on our previous cotton field experiments that conducted at this experimental site using the same cotton cultivar and soil from 2014 to 2016 (some results have been published [3]), the drought criterion in this study was set to 50% field capacity (FC) at a depth of 30 cm. For the control treatment and the water stress treatments during non-stress periods, the water tables were regulated to −120 cm, which was appropriate for local cotton growth, and irrigation was routinely performed to keep the soil water content above a lower limit of 70% FC [27]. All flood events were performed at early stages of the flowering and boll-forming, which is the most water stress-sensitive stage for cotton and is often confronted with abundant rainfall in the study region. Specifically, on 6 August, the flood treatments and the flood followed by drought treatment were imposed by submerging the cotton plants. When the flood periods were nearly over, the drought treatments were well irrigated (but with free drainage to prevent flood stress), to generate relatively high soil moisture, and thus, achieved a similar drought timing to that in the flood followed by drought treatment. At the end of the flowering and boll-forming stage (2 September), the soil drought conditions started. Finally, when the designated drought durations for the drought treatments and flood followed by drought treatment were achieved, sufficient irrigation was applied to relieve the drought stress.
The lysimeter experiment consisted of a control treatment (CK) and five water stress treatments, including a five-day and an eight-day flood alone (FL1, FL2), a 10-day and a 15-day drought alone (DR1, DR2), and a five-day flood followed by a 10-day drought (FL1-DR1). The experiment was not repeated, but three replicates were used in each water stress treatment, while the CK treatment had four replicates. Thus, 19 lysimeters in total were used in the experiment. The lysimeters were completely randomly arranged. The experimental treatments are shown in Table 1 and the soil moisture contents of all treatment are shown in Table 2.

Table 1.
The flood, drought, flood, followed by drought, and control treatments.
Table 2.
Soil moisture content of different treatments from water stress beginning to harvest.
2.4. Data Collection
Weather data including air mean temperatures, precipitation, and sunshine hour were collected from the national meteorological station located ~20 km from the experimental station.
To investigate the impacts of various forms of water stress on cotton yield, soil, and crop data from each lysimeter were collected for soil moisture, water tables, and five commonly used cotton indices, including seed cotton yield, dry matter yield, boll number, boll hull mass, and harvest index.
2.4.1. Cotton Yield Indices
All of the six cotton plants of each lysimeter were observed for their yield indices. Seed cotton (including lint and seeds in harvestable cotton bolls) was manually picked from opened cotton bolls three times (i.e., 17 September, 30 September, and 25 October) after the cotton bolls opened. At harvest, all of the collected seed cotton was air dried in a dry room for a long period (20 days in this study) [26]. Then, seed cottons from five randomly selected lysimeters were sampled and oven-dried to assess the difference between air-dry and oven-dry weight; the results showed that the difference was indeed slight.
At harvest, the whole cotton plants (including roots) were dug out, cut into pieces, washed and oven-dried (first at 105 °C for 30 min and then at 80 °C till being a constant biomass) to determine the dry matter yield. Specifically, the boll hulls were collected to count their number and then oven-dried to a constant biomass to determine the boll hull mass.
The harvest index was calculated as the ratio of seed cotton yield to total plant biomass [26].
2.4.2. Soil Moisture and Water Tables
The soil water content at of 30 cm soil depth in each lysimeter was continuously monitored (each minute) by using pre-embedded TDR200 moisture transducers (Campbell, Logan, Utah, USA), and the real-time data were recorded by CR1000X data loggers (Campbell, Logan, Utah, USA). In addition, the water tables of every lysimeter wereacontinuously traced (each minute) and recorded by using the automatically controlled water supply and drainage system.
2.5. Data Analyses
To analyze the effects of different water regimes on cotton yield indices, one-way analysis of variance was performed using SPSS 22.0 software (IBM, Amonk, New York, USA). The LSD method was employed to assess the significant differences at the 5% probability level among different treatments. In addition, linear regression and Pearson correlation analysis were also performed using SPSS software. When averaged values of each treatment were used for regression, different weights of the treatments were considered in conducting regression analysis. In this situation, weighted least squares regression was employed and the reciprocal of the error variance of each treatment was set as its weight. As a result, the treatment with less variance was more influential than that with more variance in regression analysis.
As all the examined yield indices were reduced under water stress compared with their levels in the control treatment (as shown in Table 3), a normalized index called percentage reduction in yield indices (PRYI, %) was introduced to assess the losses in yield indices due to a certain water stress. PRYI was calculated as follows:
where YIpot and YIact are the potential and actual levels of the yield indices, respectively. The value range of PRYI is 0–100%. In the very few cases in this study where the PRYI was calculated to be slightly below zero, the value was set to 0 to maintain this range. Specifically, when cotton yield is the investigated yield index, PRYI becomes the percentage reduction in yield (PRY, %), which is an efficient index for analyzing the yield-reducing effects of water stress at different magnitudes [31,38]:
where Ypot and Yact are the potential and actual seed cotton yields, respectively, in this study. PRY infers the yield loss ratio of a crop that is caused by a unit of a certain stress index.
Table 3.
The responses of seed cotton yield, dry matter yield, boll number, boll hull mass, and harvest index under different treatments.
In the practice of field irrigation and drainage, it is crucial to establish and apply the relationship between water stress intensity and crop yield (or yield reduction). Thus, a commonly-used method called the stress day index method (SDI) [39,40] was used in the present work and calculated as follows:
where RY is the relative yield, and Yact and Ypot have the same meanings as in Equation (2). SDI is the stress day index reflecting the intensity of certain water stresses, and m is an undetermined coefficient. By plugging Equation (3) to Equation (2), Equation (2) can be rewritten as follows:
where SDI is the duration of drought or flood (day) in this study. k is the yield-reducing rate of certain water stresses (%/day), which indicates the percentage amount of yield loss induced by per-day water stress. k has been proven to be a good indicator for comparing the yield-reducing rates of different water stresses [31]; a high value of k indicates a high yield-reducing effect of the water stress.
3. Results
3.1. Responses of Cotton Yield Indices under Different Water Stress Treatments
The results of one-way ANOVA analysis and LSD test are shown in Table 3.
It was found that all the flood treatments significantly impaired all yield indices except harvest index. In addition, the drought treatments only impaired seed cotton yield (for 10-day and 15-day drought) and boll hull mass (for 15-day drought). The flood followed by drought treatment imposed significant impairments on all yield indices except the harvest index. However, even though a 10-day drought could significantly reduce seed cotton yield (Table 3), when it occurred immediately after a five-day flood (i.e., the flood followed by drought treatment), no additional yield losses were found. Moreover, apart from seed cotton yield, the reductions in dry matter yield and boll number in the flood followed by drought treatment were also close to the reductions from flood alone or drought alone. In conclusion, it is evident that the combined effect of flood followed by drought on cotton yield was much smaller than the additive effect of flood and drought.
According to the different responses of the five examined yield indices, the most responsive yield index was seed cotton yield, which was the only index that was significantly reduced by all water stress treatments. In contrast, the least responsive parameter was the harvest index, which was not significantly affected by any water stress treatment. The water stress sensitivity levels of dry matter yield, boll number, and boll hull mass were between those of the seed cotton yield and harvest index.
3.2. Associations between Seed Cotton Yield and Relevant Yield Indices under Various Water Regimes
Economic yield factors, such as seed cotton yield, are of the most concern for farmers. Therefore, the relationships between seed cotton yield and the other four yield indices were determined using regression analysis under both water stress and non-water stress conditions. The results are shown in Figure 3.
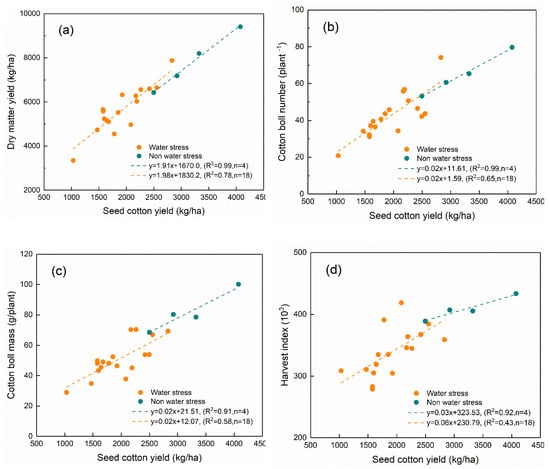
Figure 3.
Linear regressions between seed cotton yield and dry matter yield (a), boll number (b), boll hull mass (c), and harvest index (d) underwater stress and non-water stress conditions. All the presented regression formulas are highly significant, p < 0.01. The non-water stress conditions employed data from the four lysimeters of the CK treatment; the water stress conditions employed data from eighteen lysimeters, including 15 from our five flood and drought treatments (three replicates for each treatment) and three from another three lysimeters that experienced an eight-day flood followed by long-term low soil moisture. The three supplementary lysimeters were part of an original attempt to establish an eight-day flood followed by a 15-day drought, but the soil moisture did not fall below (but very close to) 50% FC until harvest; thus, their water regimes were also considered as flood followed by drought conditions and included to provide more data for regression analysis.
According to the scatter plots of non-water stress conditions, all four yield indices showed clear relationships to seed cotton yield (R2 = 0.91–0.99, Figure 3). In comparison, as illustrated by the distributions of the scatter plots under water stress, these associations were more or less weakened by water stress, varying by index. These results suggested that water stress could alter the associations between seed cotton yield and relevant yield indices. Under water stress conditions, the associations between seed cotton yield and the four yield indices were, in sequence from highest to lowest, dry matter yield (R2 = 0.78), boll number (R2 = 0.65), boll hull mass (R2 = 0.58), and harvest index (R2 = 0.43). A stronger association between seed cotton yield and certain yield index means that the changes in seed cotton yield (i.e., yield loss under water stress) were more associated the changes in certain yield index (i.e., reduction of the certain yield index due to water stress). Thus, this result indicated that, when the cotton suffered water stress, yield loss was related to the decreases in dry matter yield, boll number, boll hull mass, and harvest index, in sequence from highest to smallest. To further assess these associations under different water stresses, Pearson correlation analyses were performed between seed cotton yield and the four indices separately (Table 4).
Table 4.
The Pearson correlation coefficients (r) and p values of the correlation analysis between seed cotton yield and relevant yield indices.
The correlations between seed cotton yield and relevant yield indices were all significant under non-water stress conditions but were significant only in some situations of water stress. In addition, judging from the p values of different water stress situations, the correlation between seed cotton yield and dry matter yield was most consistent under different water conditions, followed by that between seed cotton yield and boll number. Thus, it was concluded that water stress weakened the relationships between seed cotton yield and relevant yield indices, while dry matter yield and boll number were relatively less affected and more consistent.
3.3. The Different Yield-Reducing Effects of Flood Alone and Drought Alone
Flood alone and drought alone imposed different impacts on the cotton yield indices. Different intensities of flood and drought were established in the experiment. The yield-reducing rate k (Equation (4)) of flood alone and drought alone on cotton yield indices were determined and are given in Figure 4.
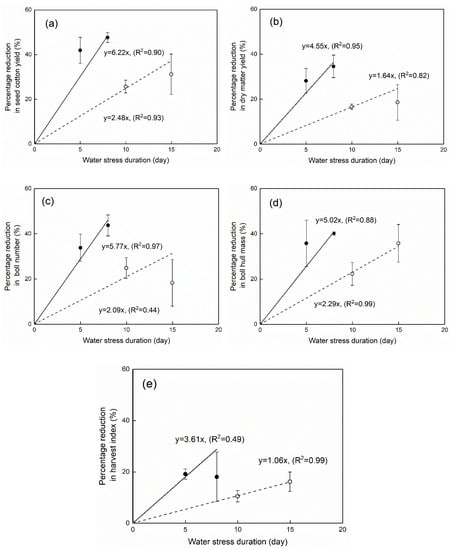
Figure 4.
The yield-reducing rates of flood alone and drought alone on seed cotton yield (a), dry matter yield (b), boll number (c), boll hull mass (d), and harvest index (e). In each subgraph, two solid dots (●) represent the average yield indices under two flood treatments, respectively; two hollow dots (○) represent the average yield indices under two drought treatments, respectively. Error bars show standard errors. The displayed regression equations are derived by using weighted least square regression method, which is capable for accounting for different error variations of different treatments. Bars without standard errors means there is no error or the error is near to zero.
Figure 4 shows that the reductions in cotton seed yield, dry matter yield, and boll hull mass due to drought alone and flood alone always increased with the stress duration. According to Figure 4a, in this study, the percentage cotton yield reduction caused by per-day flood was 6.22% and that caused by per-day drought was 2.48%. In addition, judging from the yield-reducing rates in different cases among the different yield indices, seed cotton yield suffered from the most impairment, followed by boll number and boll hull mass, while the yield-reducing effect of water stress on dry matter yield was not as great as expected. The seed cotton yield, boll number, and boll hull mass are related to cotton fruits, which implies that cotton reproductive growth is more vulnerable to water stress.
3.4. The Yield-Reducing Effect of Flood Followed by Drought
The yield-reducing effect of flood followed by drought was revealed by comparing the PRYIs under flood followed by drought, flood alone, and drought alone. In this study, the five-day flood followed by 10-day drought treatment was only comparable with the five-day flood alone and 10-day drought alone treatments, since they had the same drought and flood durations. The PRYIs of these treatments are shown in Figure 5.
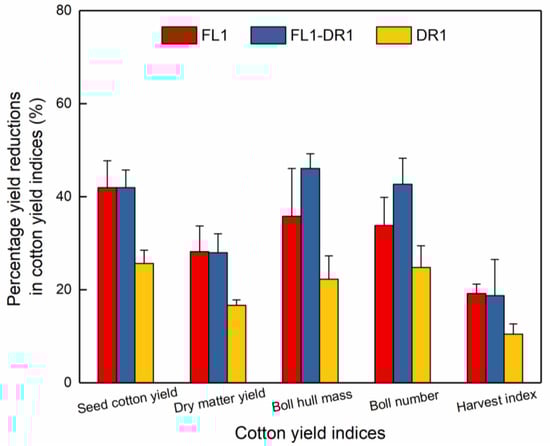
Figure 5.
The percentage reductions in cotton yield indices under flood followed by drought, flood alone, and drought alone. ‘FL1’, ‘FL1-DR1’, and ‘DR1’ represent the treatments of five-day flood alone, five-day flood followed by 10-day drought, and 10-day drought alone, respectively. Error bars indicate standard errors.
According to the PRYI values, the reductions in all cotton yield indices due to flood followed by drought were obviously smaller than the combination of the reductions induced by drought alone and flood alone. This situation is especially apparent for seed cotton yield and dry matter yield: the reductions in seed cotton yield and dry matter yield induced by the flood followed by drought treatment were close to those induced by flood alone. This result indicates that the effects of flood followed by drought were not additive.
4. Discussion
As a worldwide industrial crop, cotton suffers from flood and drought at widespread regions. Many scientists have conducted experimental explorations on the responses of cotton to various water stress situations, which have been systematically reviewed before [7,30,33]. The source of drought stress is the soil water deficit, while that of flood stress is the soil oxygen deficit [41]. However, the soil oxygen deficit exhibits the impact by reducing water uptake by roots. Thus, floods cause physiological drought and are explicitly regarded as water stress in many root water uptake models, such as the well-known Feddes function [42]. Under both flood and drought conditions, cotton roots are affected first, and their activity and functions are impaired, which results in decreased root uptake of water and nutrients [20,22]. Accordingly, the growth of cotton aboveground organs is affected, such as reduced leaf growth, plant height [23,27], leaf water potential, and chlorophyll fluorescence [24,25]. In addition, the regulation of pivotal plant hormones, especially abscisic acid, decreases stomatal conductance and inhibits photosynthesis, which results in less photosynthetic production and less accumulated biomass [23,26]. Meanwhile, cotton boll formation and survival are affected [3,6,28,29]. Ultimately, all of the above impairments from water stress induce severe cotton yield losses. Consistent with previous research, in the present work, significant yield losses were detected in all drought and flood treatments (Table 3).
Numerous scholars have also demonstrated that cotton yield losses increased with the flood or drought intensity [29,32,35]. This conclusion was also confirmed by our results: the flood/drought-induced yield losses increased with the duration of flood or drought (Figure 4a). In most flood stress research, the stress intensity was demarcated by different flood durations [13,26,27,35], which was also the case in the present work (Table 1). As a result, the yield-reducing effects of flood derived from different cotton experiments, including ours, are comparable, and the results are given in Figure 6. It was not surprising to find that the yield-reducing rates derived from different experiments are variable, because flood-induced cotton yield losses depend on many experimental factors, such as cotton cultivar and weather conditions. The results of Qian et al. [31] matched well with the present work; especially, when the flood duration was 5 days, their cotton yield losses were almost the same. This is mainly attributed to the use of the same cotton cultivar and the same experimental site in the two works.
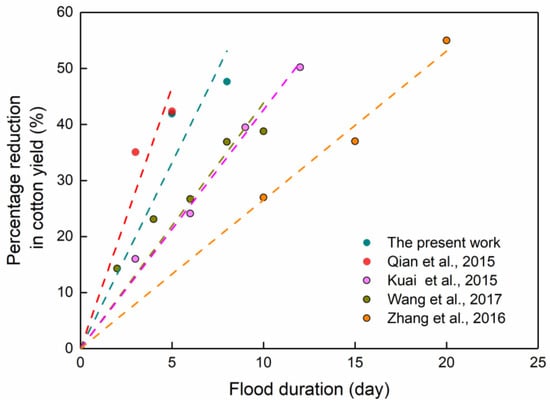
Figure 6.
Comparisons of the yield-reducing rates of flood in recent cotton flood experiments. All of these experiments were carried out at the flowering stage and had unaltered and shallow flood depths during flood periods. The displayed colored lines are linear regressions to determine the yield-reducing rates (i.e., the k in Equation (4)), and their calculated k values are 6.22, 9.93, 4.26, 4.39, and 2.26 for the present work and the literatures [26,27,31,35], respectively.
In comparison with the abovementioned flood stress experiments, existing cotton drought stress experiments have employed diverse approaches to establish different drought intensities. Different levels of irrigation [28,32,34,43,44] were mostly applied to describe drought intensities due to their inclusion in irrigation schedules. In addition, long-term [3,29] or short-term [45] low soil water content were also often applied. In the present work, short-term droughts with low soil water content (falling below 50% FC) over 10–15 days, rather than long-term droughts across cotton growing seasons, were adopted. This is because we attempted to assess the impact of short-term severe drought stress on cotton. As a result, relatively few studies are comparable with the present work in terms of the drought establishment approach. A relatively similar case can be found in a two-year cotton experiment that included drought treatments of 45% FC for 3, 6, and 9 days during the flowering and boll-forming stages [45]. However, in that experiment, the treatment of 45% FC for 3 and 6 days produced even higher cotton yields than the control treatment, which suggested a compensation effect of slight drought stress. Moreover, the treatment of 45% FC for 9 days in that work induced ~50% yield loss among two years and two cultivars. By comparison, in the present work, although the drought treatments imposed significant cotton yield losses (Table 3), the yield losses were less than 40%. Moreover, our drought-induced losses increased linearly with drought duration (Figure 4a). The discrepancy between this study and that work can be attributed to the different cotton cultivars, different soil textures, and scale effects (lysimeter trial vs. small pot trial) [29,44]. Cotton cultivar is an important influential factor in both drought and flood experimental studies. However, restricted by lysimeters numbers, this work employed only one cultivar that was commonly used in the study area. In further work, various cotton cultivars with different water stress tolerances are expected to be included, and more informative results will be obtained. It should be also noted that this work employed lysimeters to establish expected drought conditions, which was a manipulated process rather than natural conditions. As suggested by other scholars [2], the lysimeter experiment results may be different from those under natural soil conditions. Thus, future experimental works under natural conditions need to be performed to confirm our results.
Due to increasing global climate change as well as specific irrigation strategies [14], many agricultural regions, such as the Middle-Lower Yangtze River plain cotton production area, are objectively confronted with the alternating flood and drought stress. For instance, as shown in Figure 1, at our research site, where rainfall was high during July and low during August in 2009; thus, cotton may face flood followed by drought, i.e., heavy rains followed by long-term dry weather.
Currently, research on crop responses to flood followed by drought has mainly concentrated on wheat, barley, and sugarcane [2,18,19], yet different conclusions have been drawn. For wheat and barley, there was almost no interaction between waterlogging and drought, i.e., the combined effect of flood plus drought was additive [2]. In contrast, in a sugarcane experiment, adding drought events just after the end of flood processes did not bring any additive yield reductions [19]. The crop response to flood followed by drought also depends on crop species. For cotton, although its responses to flood followed by drought have not been investigated, relevant experimental studies on cotton have been performed under conditions of drought followed by flood [3] and under flood followed by waterlogging (i.e., perched water tables but without ponded water) [31]. Wu et al. [3] found that the yield reduction induced by drought alone was even greater than that induced by drought followed by flood, suggesting a compensation effect of the later water stress. Similarly, Qian et al. [31] performed a cotton trial and discovered that the preceding flood significantly mitigated the yield-reducing impact of the following waterlogging. Consistent with these previous studies, in this study, the yield-reducing effect of flood alone was close to that of flood followed by drought in terms of seed cotton yield and dry matter yield (Figure 5). Moreover, a 10-day drought significantly reduced seed cotton yield, yet when it occurred just after a five-day flood, no more losses were found compared with those induced by a five-day flood alone (Table 3). Given this evidence, it can be concluded that the combined effect of drought and flood was not additive. In fact, the impacts of early abiotic stress (including flood, drought, heat, and cold) on later abiotic stress have attracted much attention, and the “stress memories” of plants are being studied [12]. The interactive effects between two stresses are related to morphological adaptation and hormonal regulation [12]; when plants are subjected to flood followed by drought, their morphological and physiological adaptive response to the preceding flood probably enhances their tolerance to the subsequent drought. The most promising flood-adaptive strategy for plants is to form aerenchyma and adventitious roots to extract more soil oxygen [46], and cotton also exhibits this strategy [33]. In addition, cotton root vigor recovered after flood and even surpassed that in the unstressed treatment [20]. It is acknowledged that root growth plays an important role in plant response to stresses; hence, in the future experimental work concerning alternating stresses of flood and drought, performing root growth observations, especially tracing root dynamic growth, would be crucial to further reveal cotton response mechanisms.
In field conditions, cotton suffers from various factors, such as water deficit, waterlogging, heat stress, shade stress, and limited nutrients [5,6,7,8,9]. The combined stress of two stresses are also common. As most stresses negatively affect cotton growth, the combined effects of two stresses may be more harmful. For instance, the combined effect of waterlogging and heat stress [13], and that of waterlogging and low light were found positively significant [9], which means the combination of two stresses could induce more impairments on cotton than their additive effects. In comparison, our result regarding flood followed by drought stress showed that the combined effect of flood and drought was obviously less than their additive effects. Similar results have been reported under another scenario of combined stress of drought and flood, i.e., drought followed by flood [3]. In fact, the combined stress of drought and flood was special, since the two stresses can only occur alternately but not synchronously. The alternation processes allow cotton develop adaptation responses (as discussed above), which is probably a key factor for the interactions between drought and flood.
Irrigation and drainage are basic approaches to relieving drought and flood stress on crops. Thus, numerous field experiments on cotton have been conducted to provide guidance for scheduling irrigation and drainage. According to the latest China National Standards on field drainage (GB50288-2018 [47], the endurable flood duration for cotton at the flowering and boll-forming stage is 2 days. However according to the present work, and previous work (Figure 6), a 2-day flood can also impose a severe impact on cotton yields for some cotton cultivars. Thus, it is suggested that for some flood-sensitive cultivars, such the one used in the present work, the endurable flood duration should be shortened to avoid obvious yield reductions. In addition, our results suggested that even a short-term (10–15 day) drought event could impose a significant yield reduction. Thus, timely irrigation should be considered when the soil water content falls to 50% FC over a short period.
Furthermore, field experiments concerning alternating drought and flood stresses on cotton are still insufficient in irrigation and drainage research. Our results, together with previous reports [3], have demonstrated that, when cotton plants suffer from alternating stress of flood and drought, the yield-reducing effect is not additive. These results indicate significant interactions between water stresses in cotton fields. Therefore, it is necessary to develop a comprehensive schedule of irrigation and drainage that emphasizes the aftereffects of early water stress. Comprehensive schedules can be used to reduce the costs of unnecessary irrigation and drainage. For example, when a heavy storm induces inevitable flood in cotton fields and then a long period of dry, hot weather occurs (i.e., drought drivers), the subsequent irrigation schedules might be accordingly reduced since the cotton would be tolerant to drought at that time. Similar operations are also effective for drought followed by flood. It should also be emphasized that, in order to develop reliable comprehensive irrigation and drainage schedules, more detailed water stress experiments that include different stress intensities, forms, and experimental sites are required.
Cotton yield losses under water stress are determined by many factors, such as less plant biomass accumulation, fewer cotton bolls, and a smaller harvest index. Therefore, in previous research [3,27,29], apart from seed cotton yield, many other yield indices were found to be significantly altered by drought and flood. In the present work, dry matter yield, boll hull mass, and boll numbers were significantly reduced by all flood treatments, but were not altered under drought stress (Table 3). The different performances of these indices under drought and flood conditions can be mainly attributed to the short duration (i.e., moderate intensity) of our drought treatments. In particular, the nonsynchronous responses of seed cotton yield and dry matter yield can be explained by the more sensitive response in cotton reproductive growth than in vegetative growth. In fact, the recovery of cotton vegetative growth after water stress has been discovered under both flood and drought conditions [13,45]. Moreover, the harvest index was not reduced by any water stress treatment (Table 3). Similar results have been reported previously [6,43]: although the cotton harvest index is expected to be altered to a certain extent by water stress, it was not always significantly affected under drought and flood conditions.
The relationships between seed cotton yield and other yield indices are usually close; however, few studies have investigated their changes due to water stress. In the present work, all the relationships between seed cotton yield and the other yield indices were found to be significant under non-water stress conditions but were weakened in some water stress cases (Table 4). The weakened relationships implied that the reductions in seed cotton yield and some yield indices under water stress were disproportionate. According to our regression analyses across different water stress regimes (Figure 3), the relationships of dry matter yield and boll number to seed cotton yield were still strong under water stress. This result also showed that cotton yield losses were mostly associated with decreases in dry matter yield and boll number.
The relationships between crop dry matter yield and economic yield (e.g., seed cotton yield) have been widely proven stable; thus, in applications of dry matter models under water stress, the dry matter output is directly converted to economic yield by local-verified regression relationships [37,48,49]. As found in our experimental results (Table 3), the relationship between dry matter yield and seed cotton yield was the closest and most stable among the various yield index relationships, regardless of the presence of water stress, which supports the wide application of this relationship. Another approach to converting dry matter yield to economic yield under water stress is to apply the adjusted harvest index, which is adopted by many crop growth models, such as Aquacrop, [50,51]. In the present work, although the cotton harvest index was not significantly altered by any water treatment, it was slightly reduced by different water stresses, as illustrated in Table 3. Moreover, this slight reduction was in line with the disproportionate responses of seed cotton yield and dry matter yield in this study (Table 3). The reduced harvest index indicates that seed cotton was more sensitive to water stress than dry matter yield, which may be attributed to the recovery of vegetative growth rather than reproductive growth in cotton [13,45].
Close associations between cotton yield reduction and decreased boll number were found in many previous studies [3,6,27,28]. The present study specifically determined the relationship between boll number and seed cotton yield under water stress treatments as well as non-water stress conditions (Figure 3b). Overall, the relationship between seed cotton yield and boll number was very strong under unstressed conditions and was weakened by water stress.
5. Conclusions
This experimental study aimed to investigate the yield-reducing effects of flood alone, drought alone, and flood followed by drought on cotton plants. Severe impacts on all cotton yield indices except harvest index were found in all flood treatments but not in drought treatments. The cotton yield losses induced by flood alone and drought alone both linearly increased with stress duration. Additionally, the per-day percentage yield reduction induced by flood and drought were determined to be 6.22% and 2.48%, respectively. Significant linear relationships between seed cotton yield and relevant yield indices were found under non-water stress conditions, but these associations were weakened by water stress. However, even under water stress, the water stress-induced yield losses were still closely associated with the decreases in dry matter yield and boll number. When cotton suffered from flood followed by drought, the combined effects of the two stresses were not additive in terms of all yield indices. In summary, these findings provide valuable data support for future irrigation and drainage schedules in cotton fields; more importantly, they suggest the necessity of establishing comprehensive irrigation and drainage schedules to account for the interaction between flood and drought.
Author Contributions
Conceptualization, L.Q., X.C., and X.W.; investigation, L.Q. and S.H.; writing—original draft preparation, L.Q. and Y.L.; resource: S.H.; writing—review and editing, X.C. and X.W.; supervision, X.C.; funding acquisition, X.C. and L.Q. All authors have read and agreed to the published version of the manuscript.
Funding
This research was financially funded by the National Natural Science Foundation of China, grant numbers 51861125203, U1911204, 51909286; the National Key R&D Program of China, grant number 2017YFC0405900; the Fundamental Research Funds for the Central Universities, grant number 19lgpy255; the National Research program of Guangzhou Water Authority, grant number 2017-28; the Project for Creative Research from Guangdong Water Resources Department, grant number 2019; and the China Postdoctoral Science Foundation, grant number 2018M643308.
Acknowledgments
We thank Liu Shenzhou, an undergraduate of Wuhan University, who has made great contributions to our field experiment.
Conflicts of Interest
The authors declare no conflict of interest. The funders had no role in the design of the study; in the collection, analyses, or interpretation of data; in the writing of the manuscript, or in the decision to publish the results.
References
- Ding, J.; Huang, Z.; Zhu, M.; Li, C.; Zhu, X.; Guo, W. Does cyclic water stress damage wheat yield more than a single stress? PLoS ONE 2018, 13, e0195535. [Google Scholar] [CrossRef] [PubMed]
- Dickin, E.; Wright, D. The effects of winter waterlogging and summer drought on the growth and yield of winter wheat (Triticum aestivum L.). Eur. J. Agron. 2008, 28, 234–244. [Google Scholar] [CrossRef]
- Wu, H.; Wang, X.G.; Xu, M.; Zhang, J.X. The effect of water deficit and waterlogging on the yield components of cotton. Crop Sci. 2018, 58, 1751–1761. [Google Scholar] [CrossRef]
- Wu, Z.W.; Li, J.P.; He, J.H.; Jiang, Z.H. Large-scale atmospheric singularities and summer long-cycle droughts-floods abrupt alternation in the middle and lower reaches of the Yangtze River. Chin. Sci. Bull. 2006, 51, 2027–2034. [Google Scholar] [CrossRef]
- Constable, G.A.; Bange, M.P. The yield potential of cotton (Gossypium hirsutum L.). Field Crop. Res. 2015, 182, 98–106. [Google Scholar] [CrossRef]
- Bange, M.P.; Milroy, S.P.; Thongbai, P. Growth and yield of cotton in response to waterlogging. Field Crop. Res. 2004, 88, 129–142. [Google Scholar] [CrossRef]
- Ullah, A.; Sun, H.; Yang, X.; Zhang, X.L. Drought coping strategies in cotton: Increased crop per drop. Plant Biotechnol. 2017, 15, 271–284. [Google Scholar] [CrossRef]
- Singh, R.P.; Prasad, P.V.V.; Sunita, K.; Giri, S.N.; Reddy, K.R. Influence of high temperature and breeding for heat tolerance in cotton: A Review. Adv. Agron. 2007, 93, 313–385. [Google Scholar]
- Najeeb, U.; Bange, M.P.; Atwell, B.J.; Tan, D.K.Y. Low incident light combined with partial waterlogging impairs photosynthesis and imposes a yield penalty in cotton. J. Agron. Crop Sci. 2016, 202, 331–341. [Google Scholar] [CrossRef]
- Dai, J.L.; Dong, H.Z. Intensive cotton farming technologies in China: Achievements, challenges and countermeasures. Field Crop. Res. 2014, 155, 99–110. [Google Scholar] [CrossRef]
- Kuai, J.; Liu, Z.W.; Wang, Y.H.; Meng, Y.; Chen, B.L.; Zhao, W.Q.; Zhou, Z.G.; Oosterhuis, D.M. Waterlogging during flowering and boll forming stages affects sucrose metabolism in the leaves subtending the cotton boll and its relationship with boll weight. Plant Sci. 2014, 223, 79–98. [Google Scholar] [CrossRef] [PubMed]
- Wang, X.; Liu, F.L.; Jiang, D. A promising strategy for crop production in response to future climate. J. Integr. Agric. 2017, 16, 2709–2716. [Google Scholar] [CrossRef]
- Qian, L.; Wang, X.G.; Luo, Y.Y.; Sun, H.W.; Luo, W.B. Responses of cotton at different growth stages to aeration stress under the influence of high temperature. Crop Sci. 2018, 58, 342–353. [Google Scholar] [CrossRef]
- Dodd, I.C.; Puértolas, J.; Huber, K.; Pérez, J.G.; Wright, H.R.; Blackwell, M.S.A. The importance of soil drying and re-wetting in crop phytohormonal and nutritional responses to deficit irrigation. J. Exp. Bot. 2015, 66, 2239–2252. [Google Scholar] [CrossRef] [PubMed]
- Shao, G.C.; Deng, S.; Liu, N.; Yu, S.E.; Wang, M.H.; She, D.L. Effects of controlled irrigation and drainage on growth, grain yield and water use in paddy rice. Eur. J. Agron. 2014, 53, 1–9. [Google Scholar] [CrossRef]
- Yao, F.; Huang, J.; Cui, K.; Nie, L.; Xiang, J.; Liu, X.; Wu, W.; Chen, M.; Peng, S. Agronomic performance of high-yielding rice variety grown under alternate wetting and drying irrigation. Field Crop. Res. 2012, 126, 16–22. [Google Scholar] [CrossRef]
- Huang, J.; Hu, T.S.; Yasir, M.; Gao, Y.; Chen, C.; Zhu, R.; Wang, X.; Yuan, H.W.; Yang, J.W. Root growth dynamics and yield responses of rice (Oryza sativa L.) under drought-flood abrupt alternating conditions. Environ. Exp. Bot. 2019, 157, 11–25. [Google Scholar] [CrossRef]
- Gales, K.; Ayling, S.M.; Cannell, R.Q. Effects of waterlogging and drought on winter wheat and winter barley grown on a clay and sandy loam soil. Plant Soil 1984, 80, 67–78. [Google Scholar] [CrossRef]
- Jaiphong, T.; Tominaga, J.; Watanabe, K.; Nakabaru, M.; Takaragawa, H.; Suwa, R.; Ueno, M.; Kawamistu, Y. Effects of duration and combination of drought and flood conditions on leaf photosynthesis, growth and sugar content in sugarcane. Plant Prod. Sci. 2016, 19, 427–437. [Google Scholar] [CrossRef]
- Liu, R.X.; Yang, C.Q.; Zhang, G.W.; Zhang, L.; Yang, F.Q.; Guo, W.Q. Root recovery development and activity of cotton plants after waterlogging. Agron. J. 2015, 107, 2038–2046. [Google Scholar] [CrossRef]
- Luo, H.H.; Yong, H.H.; Zhang, Y.L.; Zhang, W.F. Effects of water stress and rewatering on photosynthesis, root activity, and yield of cotton with drip irrigation under mulch. Photosynthetica 2016, 54, 65–73. [Google Scholar] [CrossRef]
- Reicosky, D.C.; Meyer, W.S.; Schaefer, N.L.; Sides, R.D. Cotton response to short-term waterlogging imposed with a water-table gradient facility. Agric. Water Manag. 1985, 10, 127–143. [Google Scholar] [CrossRef]
- Pettigrew, W.T. Physiological consequences of moisture deficit stress in cotton. Crop Sci. 2004, 44, 1265–1272. [Google Scholar] [CrossRef]
- Zhang, Y.J.; Song, X.Z.; Yang, G.Z.; Li, Z.H.; Lu, H.Q.; Kong, X.Q.; Eneji, A.E.; Dong, H.Z. Physiological and molecular adjustment of cotton to waterlogging at peak-flowering in relation to growth and yield. Field Crop. Res. 2015, 179, 164–172. [Google Scholar] [CrossRef]
- Zahoor, R.; Zhao, W.Q.; Dong, H.R.; Snider, J.L.; Zhou, Z.G. Potassium improves photosynthetic tolerance to and recovery from episodic drought stress in functional leaves of cotton (Gossypium hirsutum L.). Plant Physiol. Biochem. 2017, 119, 21–32. [Google Scholar] [CrossRef]
- Zhang, Y.J.; Chen, Y.Z.; Lu, H.Q.; Kong, X.Q.; Dai, J.L.; Li, Z.H.; Dong, H.Z. Growth, lint yield and changes in physiological attributes of cotton under temporal waterlogging. Field Crop. Res. 2016, 194, 83–93. [Google Scholar] [CrossRef]
- Kuai, J.; Zhou, Z.G.; Wang, Y.H.; Meng, Y.L.; Chen, B.L.; Zhao, W.Q. The effects of short-term waterlogging on the lint yield and yield components of cotton with respect to boll position. Eur. J. Agron. 2015, 67, 61–74. [Google Scholar] [CrossRef]
- Alishah, O.; Ahmadikhah, A. The effects of drought stress on improved cotton varieties in Golesatn province of Iran. Int. J. Plant Prod. 2009, 3, 1735–6814. [Google Scholar]
- Wang, R.; Ji, S.; Zhang, P.; Meng, Y.L.; Wang, Y.H.; Chen, B.L.; Zhou, Z.Z. Drought effects on cotton yield and fiber quality on different fruiting branches. Crop Sci. 2016, 56, 1265–1276. [Google Scholar] [CrossRef]
- Najeeb, U.; Bange, M.P.; Tan, D.K.Y.; Atwell, B.J. Consequences of waterlogging in cotton and opportunities for mitigation of yield losses. AoB Plants 2015, 7, plv080. [Google Scholar] [CrossRef]
- Qian, L.; Wang, X.G.; Luo, W.B.; Jia, W.; Wu, L. Yield reduction analysis and determination of drainage index in cotton under waterlogging followed by submergence. Trans. Chin. Soc. Agric. Eng. 2015, 31, 89–97. [Google Scholar] [CrossRef]
- Yang, C.J.; Luo, Y.; Sun, L.; Wu, N. Effect of deficit irrigation on the growth, water use characteristics and yield of cotton in arid northwest China. Pedosphere 2015, 26, 910–924. [Google Scholar] [CrossRef]
- Zhang, Y.J.; Dong, H.Z. Mechanisms for adapting to waterlogging stress in cotton. Cotton Sci. 2015, 27, 80–88. [Google Scholar]
- Basal, H.; Dagdelen, N.; Unay, A.; Yilmaz, E. Effects of deficit drip irrigation ratios on cotton (Gossypium hirsutum L.) yield and fibre quality. J. Agron. Crop Sci. 2009, 195, 19–29. [Google Scholar] [CrossRef]
- Wang, X.S.; Zhong, D.; Zhang, W.Z.; Meng, Z.J.; Xiao, C.; Lv, M.C. Effect of waterlogging duration at different growth stages on the growth, yield and quality of cotton. PLoS ONE 2017, 12, e0169029. [Google Scholar] [CrossRef] [PubMed]
- Staff, S.S. Keys to Soil Taxonomy; U.S. Department of Agriculture Natural Resources Consevation Service: Washington, DC, USA, 2010; p. 329. [Google Scholar]
- Qian, L.; Wang, X.G.; Luo, W.B.; Qi, Z.M.; Sun, H.W.; Luo, Y.Y. An improved CROPR model for estimating cotton yield under soil aeration stress. Crop Pasture Sci. 2017, 68, 366–377. [Google Scholar] [CrossRef]
- Ding, J.F.; Liang, P.; Wu, P.; Zhu, M.; Li, C.Y.; Zhu, X.K.; Guo, W.S. Identifying the critical stage near anthesis for waterlogging on wheat yield and its components in the Yangtze River Basin, China. Agronomy 2020, 10, 130. [Google Scholar] [CrossRef]
- Shaw, R.E.; Meyer, W.S. Improved empirical representation of plant responses to waterlogging for simulating crop yield. Agron. J. 2015, 107, 1711–1723. [Google Scholar] [CrossRef]
- Evans, R.O.; Skaggs, R.W.; Sneed, R.E. Normalized crop susceptibility factors for corn and soyabean to excess water stress. Trans. ASAE 1990, 33, 1153–1161. [Google Scholar] [CrossRef]
- Milroy, S.P.; Bange, M.P. Reduction in radiation use efficiency of cotton (Gossypium hirsutum L.) under repeated transient waterlogging in the field. Field Crop. Res. 2013, 140, 51–58. [Google Scholar] [CrossRef]
- Feddes, R.A.; Kowalik, P.J.; Zaradny, H. Simulation of Field Water Use and Crop Yield; Centre for Agricultural Publishing and Documentation: Wageningen, The Netherlands, 1978. [Google Scholar]
- Ünlü, M.; Kanber, R.; Koc, D.L.; Tekin, S.; Kapur, B. Effects of deficit irrigation on the yield and yield components of drip irrigated cotton in a mediterranean environment. Agric. Water Manag. 2011, 98, 597–605. [Google Scholar] [CrossRef]
- Snowden, C.; Ritchie, G.; Cave, J.; Keeling, W.; Nithya, R. Multiple irrigation levels affect boll distribution, yield, and fiber micronaire in cotton. Agron. J. 2013, 105, 1536–1544. [Google Scholar] [CrossRef]
- Niu, J.; Zhang, S.P.; Liu, S.D.; Ma, H.J.; Chen, J.; Shen, Q.; Ge, C.W.; Zhang, X.M.; Pang, C.Y.; Zhao, X.H. The compensation effects of physiology and yield in cotton after drought stress. J. Plant Physiol. 2018, 224, 30–48. [Google Scholar] [CrossRef] [PubMed]
- Mustroph, A. Improving flooding tolerance of crop plants. Agronomy 2018, 8, 160. [Google Scholar] [CrossRef]
- Ministry of Housing and Urban-Rural Development of the People’s Republic of China. Design and standard for irrigation and drainage engineering. 2018. Available online: http://www.mohurd.gov.cn/wjfb/201904/t20190402_240004.html (accessed on 1 November 2018).
- Huang, G.H. Modeling soil water regime and corn yields considering climatic uncertainty. Plant Soil 2004, 259, 221–229. [Google Scholar] [CrossRef]
- Akinola, O.A.; Olufayo, A.A.; Oguntunde, P.G. Dynamic crop water production model of plantain yield response to water. Am. J. Exp. Agric. 2014, 4, 1544–1556. [Google Scholar] [CrossRef]
- Ran, H.; Kang, S.Z.; Hu, X.T.; Li, F.S.; Du, T.S.; Tong, L.; Li, S.; Ding, R.S.; Zhou, Z.J.; Parsons, D. Newly developed water productivity and harvest index models for maize in an arid region. Field Crop. Res. 2019, 234, 73–86. [Google Scholar] [CrossRef]
- Steduto, P.; Hsiao, T.C.; Raes, D.; Fereres, E. AquaCrop—The FAO crop model to simulate yield response to water: I. Concepts and underlying principles. Agron. J. 2009, 101, 426–437. [Google Scholar] [CrossRef]


© 2020 by the authors. Licensee MDPI, Basel, Switzerland. This article is an open access article distributed under the terms and conditions of the Creative Commons Attribution (CC BY) license (http://creativecommons.org/licenses/by/4.0/).