1. Introduction
Rapid population growth in developing countries means that more food will be required to meet the demands of growing populations. Rain-fed wheat and barley, as major grain crops worldwide, are planted under a wide range of environments and are a major staple source of food for humans and livestock [
1,
2,
3,
4]. The production of such staple crops influences local food security [
5]. Rain-fed wheat and barley are cultivated on approximately 6 and 0.64 million ha in Iran, respectively [
6]. They are well adapted to the rain conditions of western Iran, where mean precipitation is 350–500 mm. The production of rain-fed wheat and barley per unit area in Iran is low compared to developed countries worldwide [
2]. One of the main causes for this low yield is that the suitability of land for their cultivation has not been determined. To overcome this problem, land suitability assessment is needed, which can help to increase crop yield by growing these crops in the locations that are most suited to their growth [
7].
The first step in agricultural land use planning is land suitability assessment which is often conducted to determine which type of land use is suitable for a particular location [
8]. Land suitability assessment is a method of land evaluation, which identifies the major limiting factors for planting a particular crop [
9,
10]. Land suitability assessment includes qualitative and quantitative evaluation. In the qualitative land suitability evaluations, information about climate, hydrology, topography, vegetation, and soil properties is considered [
11] and in quantitative assessment, the results are more detailed and yield is estimated [
12]. The FAO land evaluation framework [
13,
14] and physical land evaluation methods [
15] have been widely used for land suitability assessment.
Land suitability maps provide the necessary information for agricultural planners and are vital for decreasing land degradation and for assessing sustainable land use. There is a lack of land suitability mapping and associated information in Iran because land suitability surveying and mapping in Iran have followed the traditional approach [
16,
17,
18,
19,
20]. In the traditional approach, abbreviation of the soil variability through a soil map unit to a representative soil profile may cause the precision of the land suitability maps to be lacking and ignores the continuous nature of soil and landscape variation, resulting in the misclassification of sites and discrete and sharply defined boundaries [
21,
22]. Moreover, the traditional approach is time-consuming and costly [
23].
Machine learning (ML) models are capable of learning from large datasets and integrate different types of data easily [
24,
25]. In digital soil mapping framework, these ML models have been applied to make links between soil observations and auxiliary variables to understand spatial and temporal variation in soil classes and other soil properties [
24,
26,
27,
28]. These ML models include artificial neural networks, partial least squares regressions, support vector machines, generalized additive models, genetic programming, regression tree models, k nearest neighbor regression, adaptive neuro-fuzzy inference system, and random forests [
26,
27,
28]. It should be noted that random forests and support vector machines have been the most commonly used techniques in the digital soil mapping community in the last decade due to their relatively good accuracy, robustness, and ease of use. The auxiliary variables can be obtained from digital elevation models (DEM), remotely sensed data (RS), and other geo-spatial data sources [
24,
29,
30,
31,
32,
33,
34,
35].
Although in recent years, ML models have been widely used to create digital soil maps [
24], little attempt has been made for using ML models to digitally map land suitability classes [
36,
37]. For instance, Dang et al. [
38] applied a hybrid neural-fuzzy model to map land suitability classes and predict rice yields in the Sapa district in northern Vietnam. Auxiliary variables included eight environmental variables (including elevation, slope, soil erosion, sediment retention, length of flow, ratio of evapotranspiration to precipitation, water yield, and wetness index), three socioeconomic variables, and land cover. Harms et al. [
39] assessed land suitability for irrigated crops for 155,000 km
2 of northern Australia using digital mapping approaches and machine learning models. They concluded that the coupling of digitally derived soil and land attributes with a conventional land suitability framework facilitates the rapid evaluation of regional-scale agricultural potential in a remote area.
Although Kurdistan province is one of the main agriculturally productive regions of Iran and holds an important role in the country’s crop production rank, the mean yield of rain-fed wheat and barley in these regions is lower than 800 kg ha
−1 [
40]. Land suitability maps can classify the areas that are highly suitable for the cultivation of the two main crops and can help to increase their production. However, such information is commonly scarce in these semi-arid regions. Therefore, the main objective of this study is to assess the land suitability for two main crops based on the FAO “land suitability assessment framework”. Furthermore, in this study, we focus on using machine learning models to predict the spatial distribution of land suitability classes in the most economically feasible way and explore if it works better than the traditional approach—the most common approach to produce land suitability class maps in Iran. Two machine learning models algorithms, random forest (RF) and support vector machine (SVM), were selected due to their successful applications in earlier studies [
29,
30,
31,
32,
33,
34,
35] and their relatively good accuracy, robustness, and ease of use. Importantly, it has been shown that both RF and SVM models work well when soil data are not particularly available. Additionally, it is important in this work to explain the complex relationships between the predicted land suitability class and the auxiliary variables, which can be inferred by exploring the importance of auxiliary variables.
2. Materials and Methods
2.1. Site Description
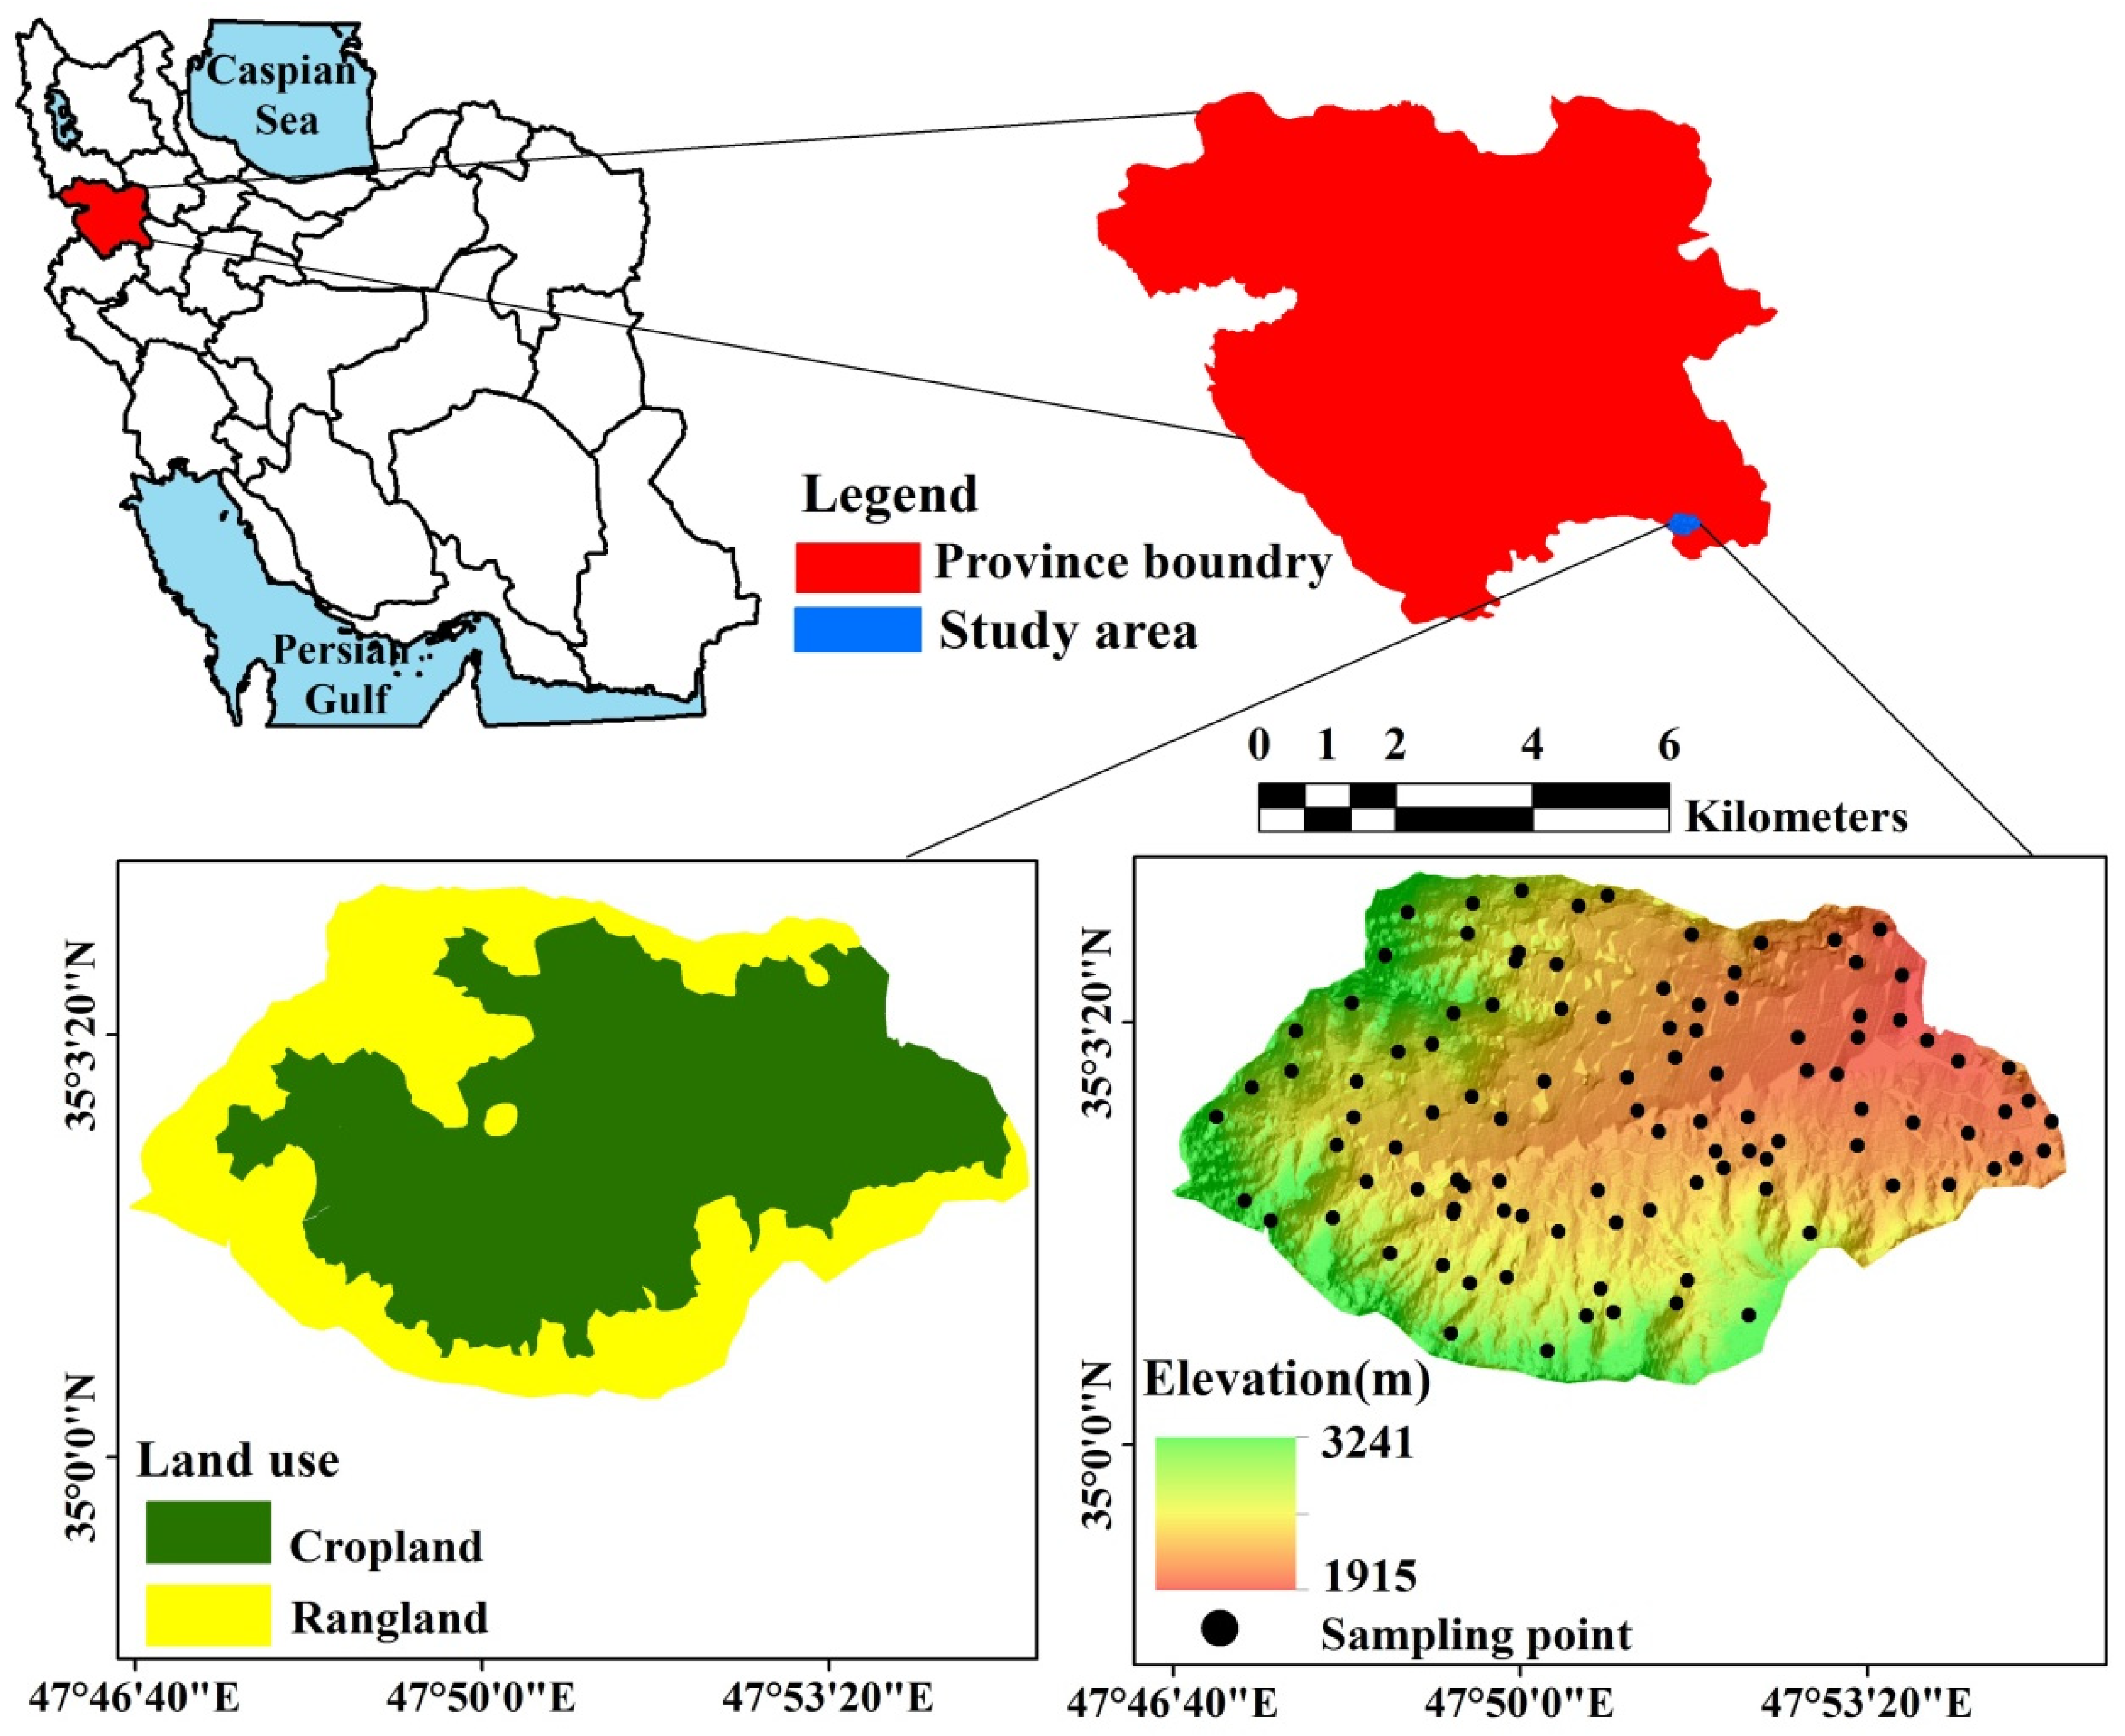
The study area is located in Kurdistan province, western Iran. It surrounds the city of Ghorveh and covers a region of 65 km
2 (
Figure 1). The climate is semi-arid with a cold and rainy winter and a moderate and dry summer. The mean yearly rainfall is 369.8 mm and over 90% of the rain falls between November and March. The mean annual temperature (10.8 °C) is relatively cool. Soil moisture and temperature regimes are Xeric and Mesic, respectively. Elevation varies between 1833 and 2627 m above sea level and the area is surrounded by mountains and hills from the southwest to the southeast. The two main land uses of the study area are cropland (approximately 60%) and rangeland, where rain-fed winter wheat and barley are the most important crops in the study area. (
Figure 1). The geomorphologic units include piedmont, fan, hill, and mountain (based on the method presented in Toomanian et al. [
41] and slope varies from gentle to very steep.
2.2. Procedures
There were several stages to the analysis for this work and a flowchart of the procedures used in this research is shown in
Figure 2. This work was conducted in several stages:
Selecting the locations of 100 soil profiles and collecting soil samples;
Analyzing the physical-chemical properties of the soil samples;
Collecting the topography and climate parameters;
Determining numeric ratings of soil, topography, and climate parameters [
15,
42,
43];
Calculating land suitability index of rain-fed wheat and barley [
44];
Calculating the land suitability class for rain-fed wheat and barley;
Preparing auxiliary variables at a regular grid spacing;
Determining a relationship between auxiliary variables and land suitability class using ML models;
Preparing a ML-based land suitability class map;
Preparing a traditional land suitability class map;
Comparing the ML-based and traditional land suitability class maps.
2.3. Data Collection and Soil Sample Analysis
In this study the locations of 100 soil profiles were assigned using the conditioned Latin hypercube [
45] sampling method. Soil profiles were described [
46] and soil samples were collected from genetic layers, air-dried at room temperature, and then passed through a 2 mm sieve prior to analysis of physical and chemical properties. Organic carbon was measured by wet combustion [
47]. Soil pH and electrical conductivity (EC) were determined in a saturated paste by a pH electrode [
48] and conductivity meter [
49]. Cation exchange capacity (CEC) was determined by the 1 N ammonium acetate (at pH 7.0) method [
50]. The calcium carbonate equivalent (CCE) was measured using a volumetric method [
51]. The particle size distribution was determined by the Bouyoucos hydrometer method [
52]. Exchangeable sodium percentage (ESP) was determined as the ratio of sodium, to CEC. Gypsum content was measured but as it was zero it was not considered further. As required, topography and climatic data for land suitability assessment were also obtained from a digital elevation model (DEM) [
53] and from the Ghorveh synoptic meteorological station for the 30-year period 1987–2017, respectively.
2.4. Land Suitability Assessment
2.4.1. Calculating Land Suitability Index Using Parametric Methods
In this study a qualitative assessment of land was performed to determine land suitability classes for rain-fed wheat and barley. The selection of influencing factors was done based on the growth requirement tables for rain-fed wheat and barley [
42,
43]. Climate (rainfall and temperature), slope, soil texture, gravel, soil depth, CaCO
3, soil pH, organic carbon, EC, and ESP were selected for calculating land suitability index. The selected parameters were scored based on [
43]. The soil, topography, and wetness properties (e.g., gypsum, micro-relief, drainage, flooding, etc.) had no limitation for rain-fed wheat and barley (data not shown) so they were not considered in determining land suitability class. Base saturation percentage and cation exchange capacity (CEC) also were not considered for land suitability because the climate of the region is semiarid [
15]. The average of the selected soil properties was determined by considering a depth-weighted coefficient up to a depth of 100 cm [
15].
After the selection of parameters, the parametric method (square root method) was applied to determine the land suitability index of rain-fed wheat and barley. The methodology initially needs to evaluate climate. Therefore, the climatic index is calculated using a rating of climate characteristics. This climate index was converted to a climate rating and then along with the soil and topography ratings they were applied to calculate the final land suitability index. The square root method applies the following equation to calculate land suitability index (Equation (1)):
where
I is the square root index,
Rmin is the minimum rating, and
A,
B,
C, are the other rating values [
44]. In the parametric method, a numerical rating (0 to 100) is given to each soil property based on the level of limitation presented by each soil property (it is done in consultation with standard charts).
2.4.2. Determining Land Suitability Class
After calculating land index for rain-fed wheat and barley, land suitability classes were determined. Land suitability classes include five classes [
13]: highly suitable (S1), moderately suitable (S2), marginally suitable (S3), and non-suitable (N1 and N2). The land index of the N2, N1, S3, S2, and S1 classes ranged between 0–12.50, 12.50–25, 25–50, 50–75, and 75–100, respectively. Non-suitable (N) land was assumed to have severe limitations which could never be improved, or only marginally so through improvement practices.
2.5. Maps of Land Suitability Class
To prepare a map of land suitability classes across the study area, we implemented two approaches. In the first approach, the maps were prepared using ML models and auxiliary variables. In the second approach, the maps were prepared according the traditional approach, which is the most common approach to produce land suitability class maps in Iran.
2.5.1. ML-Based Land Suitability Map
Two ML algorithms (i.e., SVM and RF) and a set of auxiliary variables (i.e., geomorphology, terrain attributes, and remotely sensed data) were used to predict land suitability classes of rain-fed wheat and barley. We selected two machine learning models including random forest (RF) and support vector machine (SVM) due to their successful applications in earlier studies [
29,
30,
31,
32,
33,
34,
35] and their relatively good accuracy, robustness, and ease of use. Importantly, it has been proved that both RF and SVM work well when there is no massive availability of data. Additionally, it is important in this work to explain the complex relationships between the predicted land suitability class and the auxiliary variables, which can be inferred by the exploring the importance of auxiliary variables.
Grid-Based Auxiliary Variables
Geomorphology maps are useful auxiliary data as they contain useful information such as soil parent material and soil genesis [
29,
33,
54,
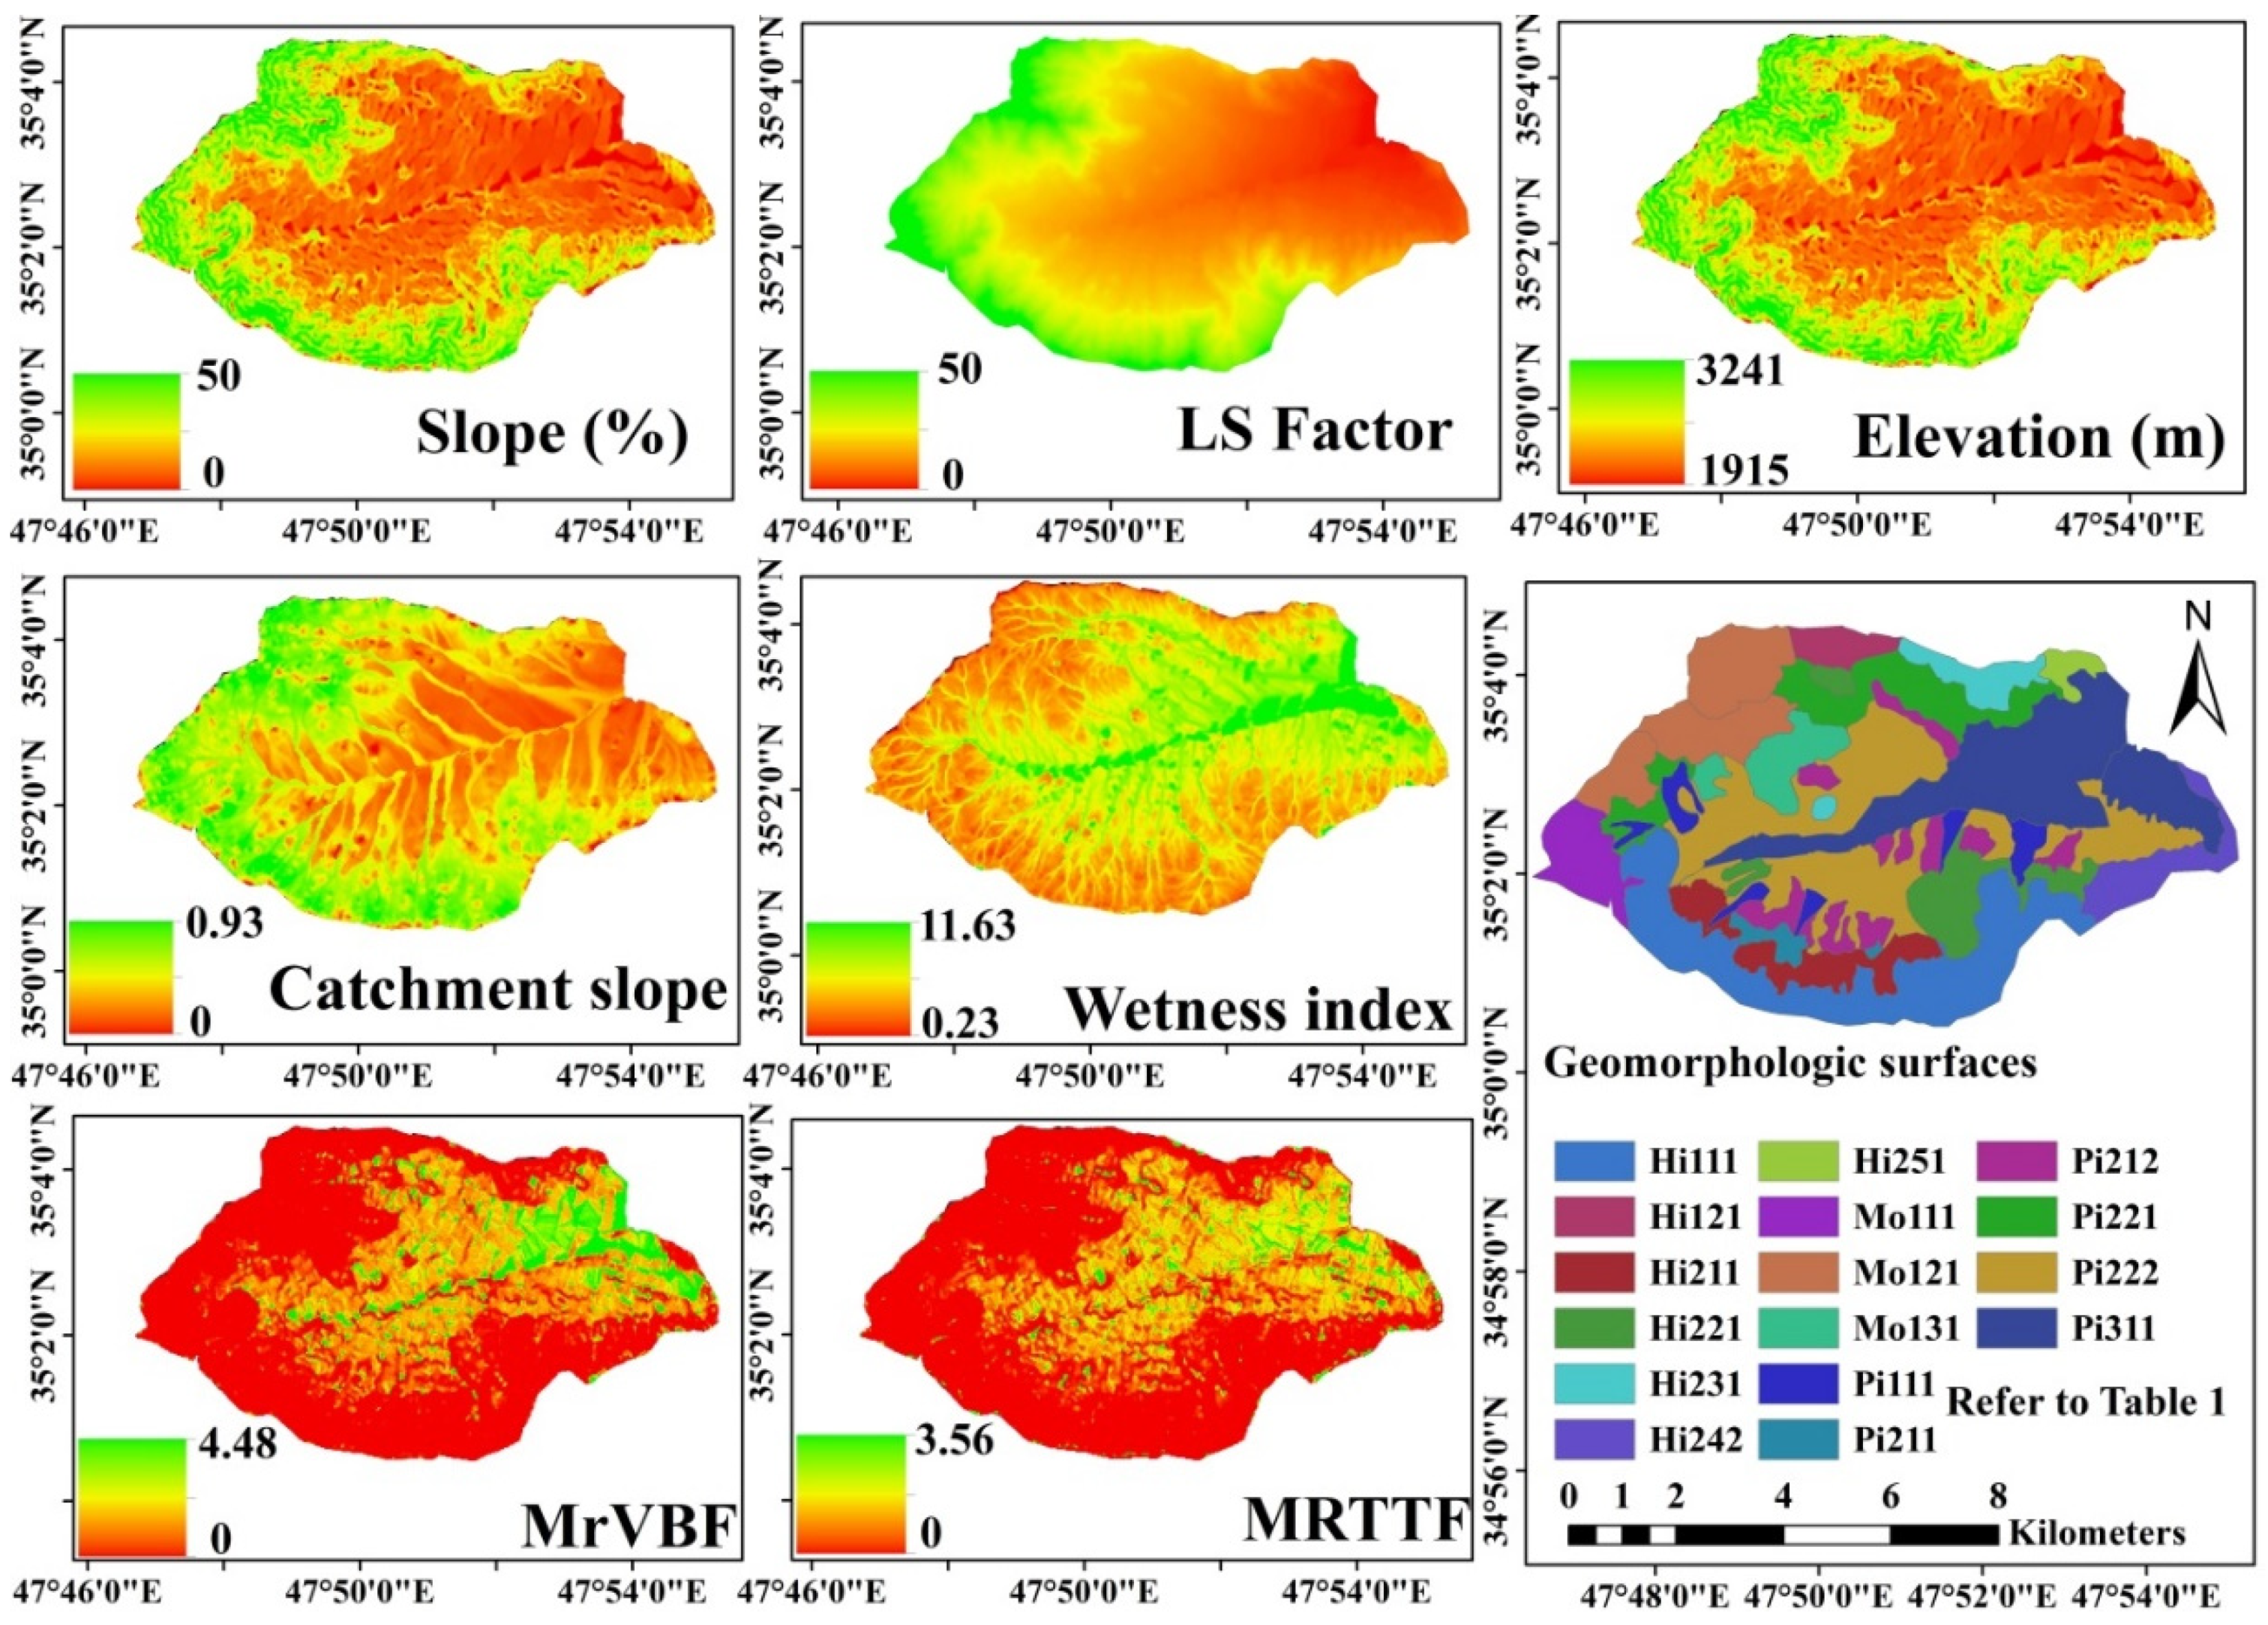
55]. In this study, geomorphological units were delineated into four levels including landscape, landform, lithology, and geomorphological surface based on aerial photos [
41]. The ortho air photos were geo-referenced and the boundaries of the geomorphological surfaces that were delineated were inserted into a GIS environment (
Figure 3).
Terrain attributes including multi-resolution ridge top flatness (MrRTF), catchment network base level (CNBL), elevation (EL), catchment slope (CS), slope (SL), aspect (AS), length-slope factor (LS factor), plan curvature (PC), long curvature (LC), cross curvature (CC), valley depth (VD), topographic wetness index (TWI), and the multi-resolution index of valley bottom flatness (MrVBF) were extracted and computed through a digital elevation model (DEM) with a 10 × 10 m grid cell resolution [
53] using SAGA GIS software (System for Automated Geoscientific Analysis) [
56].
The following spectral bands and spectral indices were derived from a Landsat 8 OLI (operational land imager), acquired on 25 July 2017: spectral bands ((B1 (0.43–0.45 μm), B2 (0.45–0.52 μm), B3 (0.52–0.63 μm), B4 (0.63–0.68 μm), B5 (0.84–0.88 μm), B6 (1.56–1.66 μm), B7 (2.10–2.30 μm)), brightness index (BI, [
57]), normalized difference vegetation index (NDVI, [
58]), soil adjusted vegetation index (SAVI, [
59]), and enhanced vegetation index (EVI, [
60]). The spectral bands and indices were used as auxiliary variables for estimating land suitability class. All auxiliary variables are co-registered to the same raster grid with a size of 30 × 30 m.
Selection of Auxiliary Variables
In our study, we implemented the Boruta algorithm [
61] with the RF classifier in the R statistical package [
62] to rank the most relevant auxiliary variables for mapping land suitability classes. The Boruta algorithm is named after a god of the forest in Slavic mythology [
61]. In short, this approach compares the importance of the auxiliary variables to five shadow variables. The values of those shadow variables are obtained by shuffling values of the auxiliary variables to remove their relationship with land suitability classes. The RF model uses the extended variables (i.e., auxiliary and shadow variables) to predict land suitability classes. Then, the Z-score, which is an indicator of the importance of all relevant auxiliary variables, is computed for each auxiliary variable and its corresponding shadow variable. Technically, the Z-score refers to the mean of accuracy loss divided by standard deviation of accuracy loss. Those auxiliary variables that scored better than the maximum Z-score are flagged as “important”.
Machine Learning Models
Support vector machine (SVM) is a kernel method for classification [
63] and regression problems [
64]. The input data is transformed into a high dimensional feature space with a predefined kernel function. In high dimensional feature space, a linear regression hyperplane is derived for nonlinear relationships. Then, the hyperplane is back-transformed to nonlinear space. The kernel used in this study is a radial basis function. The e1071 package [
65] was used for support vector machine modeling.
Random forest (RF) [
66] is an ensemble technique based on classification and regression trees (CART) [
67]. In respect to the response, CART uses binary splits to create more homogenous groups. For each tree of the ensemble, a bootstrap sample of the training data (instances) is used. Further, only random subsets of the auxiliary variables are used for the split at each node. The final tree outputs are averaged for the final prediction. A RF with a large number of trees is robust against overfitting, noise, non-informative, and correlated features [
66]. The random forest package of [
62] was used for RF training in this study.
Models Evaluation
Ten-fold cross validation with 100 replications was used to assess the ML models. In this study, two common performance metrics, namely kappa index and overall accuracy, were used. The performance metrics are functions of the confusion matrix as shown in
Table 1.
The overall accuracy is the ratio of all correctly classified land suitability classes to all used data. A higher overall accuracy indicates a high model performance (Equation (2)):
The kappa index is a robust index which takes into account the probability that a class is classified by chance [
29]. It is a simple derived statistic that measures the proportion of all possible cases of presence or absence that are predicted correctly by a model after accounting for chance predictions. Similar to the overall accuracy, a higher kappa index indicates a high model performance [
68,
69] (Equation (3)):
2.5.2. Traditional Land Suitability Map
To develop the traditional land suitability maps, the geomorphology map of the study area was used as a base map (
Figure 3). Finally, to compare the traditional and ML-based land suitability, we used an external validation technique based on 22 soil profiles (in addition to the 100 soil profiles used for prediction). The validation criteria used to determine the reliability of classes were the kappa index and overall accuracy.
2.6. Potential Yield
Potential yield is a crop production in an environment with no limitation of water, nutrients, and effective control of pests, diseases, and weeds. In other words, potential yield is defined plant growth under optimum conditions. Estimation of potential production has great importance in agricultural production management. In fact, potential yield represents the possibilities of production capital in different regions because of the difference between the potential yield and the actual average production of farmers in a region determines the amount of productivity in the use of inputs as the production capital. The lower difference (between the potential yield and the actual production) reflects the higher efficiency of inputs and closer to the possible production ceiling. Conversely, the higher difference reflects the greater need for research and development of agriculture.
In this research, potential yield of rain-fed wheat was computed by the FAO model [
15] based on genetic potential plant and climate data such as radiation and temperature. The process contains following stages:
The first stage is calculation of bgm based on Equation (4):
where bgm is the maximum gross production of biomass (kgCH
2Oha
−1 hr
−1), bo is the maximum gross production of biomass on overcast days (kgCH
2Oha
−1 hr
−1), bc is the maximum gross production of biomass on clear days (kgCH
2Oha
−1 hr
−1), and f is fraction of day time that the sky is overcast. The value of f can be as following:
The second stage is calculation of bn based on Equation (5):
where Bn is the net production rate of biomass (kg ha
−1), ct is the respiratory rate that is gained from Equation (6), bgm is the maximum gross production of biomass (kgCH
2Oha
−1 hr
−1), KLAI is the correction factor for LAI (leaf area index) <5 m
2 m
−2, and L is the number of days required for production to be gained.
where Ct is respiration coefficient, C30 is the respiratory rate that for non-legume is 0.0108, t is the average temperature (C0).
The third stage is calculation of potential yield based on Equation (7):
where Y is potential yield (kgCH
2Oha
−1) and Hi is harvest index (ratio of grain yield to aboveground biomass).
4. Conclusions
This study assessed land suitability for rain-fed wheat and barley on agricultural land in Kurdistan province, Iran. This was done using the FAO land suitability assessment framework, parametric method, and two mapping approaches namely ML-based and traditional methods. The MrRTF, MrVBF, slope, LS factor, TWI, catchment slope, elevation, and geomorphology map were the most important auxiliary data for predicting land suitability class of rain-fed wheat and barley. Based on kappa index results, RF was the better ML model for predicting land suitability class of rain-fed wheat and barley compared to the SVM approach. RF has several advantages over other statistical modeling approaches and is considered a powerful modeling technique for predicting land suitability classes. Comparison between traditional and ML-based approaches also showed that the ML-based approach identified larger areas of N2 and S3 classes and smaller areas of the N1 class than the traditional approach.
The traditional approach is time consuming and costly. In contrast, the ML-based approach map is less influenced by these constraints and is preferred for handling the usual land suitability assessment design. This is particularly true in a data-poor region such as Iran, where little soil information is available. Therefore, machine learning and auxiliary data can be an attractive approach for land suitability assessment at the large scale.
In general, the study area results showed low suitability or that it was not suitable for cropland due to of limitations of rainfall in the flowering stage, severe slopes, shallow soil depth, high pH, and gravel. These limitations are the main reasons why the actual yield of rain-fed wheat and barley in the study area is lower than potential yield of those crops. Hence, to improve the suitability of the study area for croplands and increase its production, land improvement operations such as terracing, decreasing pH, increasing soil organic matter by farmyard manure, green manure and cover crops cultivation, supplementary irrigation, and gathering gravel are needed. This study provided useful information that can be applied to quantify the implication of management policies in Kurdistan province and other similar regions.

 ,
, 


