Article

Nitrogen and Sulfur Fertilization in Kale and Swede for Grazing

1
Institute for Agricultural Research, Coyhaique 5950000, Chile
2
Department of Plant Sciences, North Dakota State University, Fargo, ND 58104, USA
*
Author to whom correspondence should be addressed.
Agronomy 2020, 10(5), 619; https://doi.org/10.3390/agronomy10050619
Submission received: 2 March 2020 / Revised: 19 April 2020 / Accepted: 23 April 2020 / Published: 27 April 2020
(This article belongs to the Special Issue Biomass Crop Production, Management, and Ecophysiology)

Abstract

:
Species in the Brassicaceae family, hence forth brassicas, such as forage kale [Brassica. oleracea L. convar acephala (DC)], swede (B. napus L. var. napobrassica), turnip [Brassica rapa L. var. rapa (L.) Thell], and hybrids (B. rapa L. × B. pekinensis L. or B. rapa L. × B. oleracea L.), have become an important source of forage for grazing worldwide. One of the limitations of forage brassicas is the relatively higher water content and low forage yield in rain-fed environments. The objective of this study was to determine swede and kale forage yield and nutritive value response to various nitrogen (N) and sulfur (S) fertilization rates. The study was conducted at two experimental field sites in North Dakota in 2012 and 2014. Kale cv. Maris Kestrel and swede cv. Major Plus and five N rates (0, 50, 100, 150, and 200 kg N ha−1) and two rates of S (0 and 40 kg S ha−1) were evaluated. Swede total forage yield was greater than kale across all nitrogen and sulfur rates. Compared with no N fertilization, N fertilization increased total leaf and root/stems yield and nitrogen accumulation in leaves, roots, and stems. Sulfur did not affect forage yield. Forage nutritive value was greater in swede than kale due to a higher proportion of edible root compared with kale’s higher proportion of fibrous stems. Nitrogen and sulfur interacted with some forage nutritive components. This study results suggest that growers will benefit from greater forage yield in kale and swede if they fertilize with N up to 200 kg N ha−1. Forage yield and nutritive value of swede and kale in the northern Great Plains are novel results, since these crops are not grown for forage and represent an interesting and valuable new alternative for beef cattle growers.

1. Introduction

Forage brassica species have different nutrient requirements, depending on soil fertility, intended use, and the expected yield response [1,2]. The amount of fertilizer to maximize forage yield depends on the difference between crop nutrient demand, and nutrient supply from the soil [2]. Nutrient supply needs to be closely matched to crop demand. Sub-optimal nutrient supply will result in lower yield, while excess nutrient application can lead to leaching and run-off of nutrients, and potentially create nitrate toxicity to animals [3].
Nitrogen (N) is required in large amounts in plant tissue, as a component of plant proteins, amino acids, nucleotides, nucleic acids, and chlorophyll [4]. Nitrogen fertilizer is the most important input in forage brassicas production due to brassicas high N requirement [5]. However, forage yield response to N depends on available soil N, water, and other factors influencing plant growth [3,5,6,7]. De Ruiter et al. [2] indicated the strongest response to N in forage rape (Brassica napus L.) was observed with available N soil content of greater than 150 kg ha−1. Other authors reported forage yield increased with N rates of up to 300 kg ha−1 [3,8].
Nitrogen application influences forage nutritive value in forage brassicas increasing crude protein (CP) content [8]. In turnip, N can also affect metabolizable energy (ME), neutral detergent fiber (NDF), and starch content [8].
Sulfur (S) is the fourth major nutrient in crop production, ranked immediately behind N, phosphorus (P), and K in importance to crop productivity [9,10]. Nitrogen and S requirements of crops are closely related because both nutrients are required for S-containing amino acids (cysteine and methionine), protein synthesis, and various other cellular components, including thiol and secondary S-containing compounds, which have a significant role on protection of plants against stress and pests [4,10,11].
Sulfur metabolism in plants is closely related to N nutrition [12] and N metabolism is strongly affected by the S status of the plant [13,14]. A deficiency in S supply has been shown to depress the uptake of nitrate and the activity of nitrate reductase in maize (Zea mays L.) and spinach (Spinacia oleraceae L.) [15,16], resulting in transient or steady-state nitrate accumulation in other crops [17,18,19].
Sulfur deficiency can lead to slower growth and fewer leaves. Young leaves can become chlorotic and have reduced photosynthetic activity. Ahmad and Abdin [20] (2000) demonstrated that high S fertilization increases ribulose-1,5-bisphosphatecarboxylase/oxygenase (rubisco), chlorophyll, and protein contents in fully expanded upper leaves of Brassica juncea L. and B. campestris L., which implies a better photosynthetic activity in comparison with plants grown without S.
Some crops require as much S as other major nutrients, especially brassica species [4,10,21,22]. However, S fertilization has erratic results. Forage brassicas respond strongly to N fertilizer but seldom to S [1,23]. In general, N:S ratios from 4:1 to 8:1 are ideal for brassicas. A N:S ratio of 7:1 in the soil is required for optimum growth of forage rape [13,22]. Fazili et al. [24] reported that S deficiency limits the N use efficiency; therefore, S addition becomes necessary to achieve maximum N use efficiency from applied fertilizer. Wilson et al. [1] reported that kale’s S extraction was 100 kg S ha−1 while application of 45 kg S ha−1 recorded significantly higher forage yield than 30 kg S ha−1 in forage rape [10].
Brassica forage species can be used as supplemental forage due to their tolerance to low temperature, increasing forage availability in the fall and winter when most traditional forage grasses and legumes are not available or have low nutritive value. The possibility to extend the grazing season for livestock operations, can reduce the operational cost to farmers and improve the profitability of the operation.
Nitrogen and sulfur fertilization studies in forage brassicas in the northern Great Plains of the USA have not been conducted before. Determining optimum N and S fertilizer rates is critical to improve forage yield, nutritive value, and reduce production costs, when producing brassica forages. Therefore, the objective of this study was to determine swede and kale forage yield and nutritive value response to various N (0 to 200 kg N ha−1), and S (0 and 40 kg S ha−1) fertilization rates in different environments in the northern Great Plains region of the United States of America.

2. Materials and Methods

2.1. Experimental Sites

Field experiments were conducted in 2012 and 2014 at Prosper (46°58′ N −97°3′ W, elevation 284 m) and in 2014 the Albert Ekre Grassland Preserve near Walcott (46°33′ N, −97°07′ W, elevation 296 m). The soil type at Prosper is a Kindred-Bearden silty clay loam (Kindred: Fine-silty, mixed, superactive, frigid Typic Endoaquoll; Bearden: fine-silty, mixed, superactive, frigid Aeric Calciaquoll; Perella: fine-silty, mixed, superactive, frigid Typic Endoaquoll). The soil type at Albert Ekre Grassland Preserve is a Mantador-Delamere-Wyndmere fine sandy-loam (Mantador: Coarse-loamy, mixed, superactive, frigid Aquic Pachic Hapludoll; Delamere: coarse-loamy, mixed, superactive, frigid Typic Endoaquoll; Wyndmere: coarse-loamy, mixed, superactive, frigid Aeric Calciaquoll) [25].

2.2. Experimental Design and Management

The experimental design was a randomized complete block with three replicates, and a split-plot arrangement. Kale cv. Maris Kestrel and swede cv. Major Plus were assigned to the main plot. The sub-plots were a factorial arrangement of five N rates (0, 50, 100, 150, and 200 kg N ha−1) and two rates of S (0 and 40 kg S ha−1). Nitrogen and S fertilizer treatments were applied as combinations of the two fertilizers. The fertilization was done using only N as urea and S as gypsum, in five incremental rates of N (0, 50, 100, 150 and 200 kg ha−1) and two rates of S (0 and 40 kg ha−1). Each plot received one of the ten fertilization treatments (5N × 2S = 10), in other words, for each N rate there was one experimental unit with S (40 kg ha−1) and one without S. The experiment with the same exact treatments and evaluation was repeated at three environments (Prosper in 2012 and 2014, and Walcott in 2014). The experiment originally had five environments but two of them were lost due to weather conditions.
Traditional tillage was utilized to prepare the soil, based on one or two passes of a chisel plow in the fall to incorporate crop residues. In spring, one or two passes of a harrow and one pass of a roller were used to prepare the seedbed. The previous crops in Prosper and Walcott was maize and mixed grass for hay, respectively. All the forage brassica plots were seeded with a plot-cone planter (Wintersteiger, Plotseed XL, Salt Lake City, UT, USA), using a sowing rate of 4.9 kg ha−1 and 1.8 kg ha−1 of pure live seed for kale and swede, respectively. Before planting, sowing rates were corrected by seed germination. The sowing depth was approximately 8–15 mm. Each plot was 1.2-m wide and 6.1-m long (7.4 m2), with eight rows spaced 15-cm apart. Sowing and harvest dates of all experiments are indicated in Table 1.
During the first month after planting, grass weeds were controlled by applying Select Max™ (Valent U.S.A. Corporation, Walnut Creek CA, USA) (clethodim:(E)-2-(1-(((3-chloro-2-propenyl)oxy)imino)propy)5-(2-(ethylthio)propyl)-3-hydroxy-2-cyclohexen-1-one) using 1.17 L active ingredient (a.i.) ha−1. Broadleaf weeds were controlled by hand-weeding, one or two times during the season, depending on the weed pressure and regrowth. All weed control was conducted when brassica crops were at rossete stage between stage 2 and stage 3 [25,26]. The crucifer flea beetle (Phyllotreta cruciferae Goeze), was present from emergence to adult plants in both studies. Asana XL (Valent U.S.A. Corporation, Walnut Creek CA, USA) (esfenvalerate: (S)-cyano (3-phenoxyphenyl)methyl (S)-4-chloro-alpha-(1-methylethyl)) was applied at the beginning of the season in 2012. Due to the inefficacy of this insecticide, thereafter flea beetle control was with Sniper (bifenthrin: (2 methyl(1,1’-biphenyl)-3-yl)methyl 3-(2-chloro-3,3,3-trifluoro-1-propenyl)-2,2-dimethyl-cyclopropanecarboxylate) with 0.037 kg a.i. ha−1. Flea beetle control required two applications per season in 2014, and three applications in 2012. Helix Xtra (Syngenta Crop Protection, LLC, Greensboro, NC, USA) (difenoconazole: 1-(2-(2-chloro-4-(4-chlorophenoxy)phenyl)-4-methyl-1,3-dioxolan-2-ylmethyl)-1H-1,2,4-triazole) was used as a seed treatment to prevent flea beetle damage during emergence using 1.5 L 100 kg seed−1..
The fertilizer treatments were broadcasted in one single application approximately at growth stage 2–3 of brassicas (rosette stage), according with Harper and Berkenkamp [26] and Theunissen and Sins [27]. The fertilizers used in this experiment were: urea (CH4N2O), and gypsum (CaSO4 × 2(H2O)). The crops were harvested in October in Prosper, before the killing frost for forage brassicas, or in August at Walcott.

2.3. Evaluations

Soil samples were taken from 0- to 15-cm and 15- to 60-cm depths soon after planting. Three separate soil cores were taken from each plot, for each soil depth, using a closed tube, hand-held soil probe, and mixed together to make composite samples representing each of the two soil depths. Soil samples from 0- to 15-cm were tested for pH, organic matter (OM), sulfate (SO4), phosphorus (P), and potassium (K) by the NDSU Soil Testing Laboratory (Fargo, ND, USA) [28]. Soil P [29], and K were measured with the ammonium acetate method [30] with a Buck Scientific Model 210 VGP Atomic Absorption Spectrophotometer (Buck Scientific, East Norwalk, CT, USA). The nitrate (NO3-N) analysis was performed on the soil samples taken at 0–15 cm and 15–60 cm depth, using the method of transnitration of salicylic acid [31] (Table 2). The fertilization for this experiment was only with N and S. The plots were not fertilized with P and K, because soil test for both nutrients at the three sites were well-above the levels crop yield response is expected for most annual crops in North Dakota (i.e., >16 mg P kg−1 and >250 mg K kg−1) (Table 2) [28].
Before harvest, average plant height was determined by taking three heights in each plot, from the soil surface to the longest vegetative part of the plant (held vertically). Harvest was conducted by hand using a 1 m2 square frame, to determine both above and below ground biomass. A sample from the total forage biomass (leaf and root/stem) per each plot was taken to analyze forage quality. The whole plant biomass harvested was divided into leaves and stems (kale) and into leaves and roots (swede). Enlarged roots were removed from the soil by pulling or using a shovel, to harvest the maximum of enlarged root tissue. Results are presented as dry matter (DM) leaf yield, and root/stem DM yield which is the sum of biomass of roots from swede and stems from kale. Additionally, senesced and dry material fallen off plants onto the soil surface under the canopy was collected, measured, and characterized as dead matter. Total forage biomass yield (leaf + root/stems) plus dead matter represented total biomass yield. Once separated, leaves of each sample were placed in burlap bags and then tagged. Swede roots were collected and washed on the same day, stored in a cold room (4 °C), and then chopped fresh using a food processor (Sunbeam, Le Chef model, Chicago, IL, USA), leaving pieces about 5-mm thick or less. Kale stems were cut longitudinally with a knife in four or more parts according with the thickness of the stem. Stems and chopped root pieces were placed in mesh plastic bags. All the samples (cut stems and chopped roots) were weighed to determine the wet weight and dried at 70 °C until constant weight. Samples were weighed to obtain the dry weight. Dried samples were ground in a mill (Wiley Mill standard Model No. 3, Philadelphia, PA, USA) to 1-mm mesh and then sent for forage quality analysis.
Chemical analysis for 50-leaf, -stem, and -root samples, respectively, were conducted at Animal Sciences Nutrition Laboratory at North Dakota State University. The results were used to build calibration equations to determine nutritional values for near infrared reflectance spectroscopy (NIRS) analysis. The total N content was measured with the Kjeldahl method [32], percentage of ash with Association of Official Agricultural Chemists (AOAC) Method 942.05, and crude protein (CP) with AOAC Method 2001.11. Quality analysis was conducted to determine acid detergent fiber (ADF) (ANKOM, 2011. A200 Method 5, ANKOM Technology, Macedon, NY, USA), neutral detergent fiber (NDF) (ANKOM, 2011.A200 Method 6) and in vitro dry matter digestibility (IVDMD) [33]. Total digestible nutrients (TDN) were then calculated from the above parameters according to Undersander [34]. Then, all samples were analyzed in a near-infrared reflectance instrument (Foss-Sweden Model 6500, Minneapolis, MN, USA), for the same forage quality components indicated previously, in Dr. Undersander’s laboratory, University of Wisconsin, Madison, following the methods described by Abrams et al. [35].
The N accumulation (N total) in each species/treatment plot was determined from the CP content, obtained from NIRS results. Nitrogen content was calculated with the equation: N = CP/6.25. Nitrogen accumulation was calculated arithmetically multiplying the above and below ground forage biomass yield in kg ha−1 by the N content. Total N accumulation (kg N ha−1) of forage produced was calculated using the N concentration (g kg−1) in the tissue (leaf or root/stem), times the total biomass yield produced per ha.

2.4. Statistical Analysis

The statistical analysis was conducted using standard procedures for a randomized complete block design (RCBD) with factorial or split-plot arrangement. Each location/year combination was defined as an environment and was considered a random effect in the statistical analysis. Nitrogen and S fertilization rates and species were considered fixed effects. Analysis of variance and mean comparisons were conducted using the MIXED procedure in statistical analysis software (SAS, Cary, NC, USA) [36]. Error mean squares were compared for homogeneity among environments according to the folded F-test and, if homogeneous, then a combined analysis of variance was performed across environments. Only fixed effects and interactions among fixed effects are discussed. Significant interactions with environment are not discussed because represent a non-repeatable response. Treatment means separation was determined by F-protected least significant difference (LSD) comparisons at the p ≤ 0.05 probability level. Regression analysis was conducted to determine the response to N and S fertilization. Leaf, root/stem, and dead matter yield values were converted to a relative scale from 1–100%, to account for the yield variation in different locations and years. Linear and quadratic regression models were constructed with both, relative and absolute values, and tested with the corresponding error. The regression models were all at the p ≤ 0.05 level of significance.

3. Results and Discussion

3.1. Forage Brassica N and S Effect on Leaf, Stem, and Root Yield

Kale and swede forage biomass yield (leaf and root/stem) increased linearly up to 200 kg N ha−1, indicating that these species could actually have a response to greater N rates. The analysis of variance combined across three environments for Prosper in 2012 and 2014 and Walcott 2014, of leaf, root/stem, total biomass yield (leaf + root/stem), dead matter yield, total biomass yield, and total N concentration are presented in Table 3. The triple interaction of species by N by S was significant for root/stem yield and leaf + root/stem yield (Table 3). The double interactions N by S, S by species, and N by species were not significant for any parameter. The S main effect was not significant. Species main effect was significant for all parameters except leaf yield, total leaf N, and total root/stem N. The N main effect was significant for all parameters evaluated (Table 3).
Leaf yield of kale and swede averaged across fertilization rates and environments ranged between 3.10 and 3.32 Mg ha−1 respectively. Leaf yield across species, S rates and environments increased from 2.50 to 3.87 Mg ha−1 with 0 to 200 kg N ha−1 rates (Table 4). Root/stem yield was much higher than leaf yield with a stronger response to N than leaf yield (Table 4). Leaf area in swede ranged between was 27–32% of the total plant biomass without considering dead mass. In kale, leaf area ranged between 46–54%. Even dead matter accumulated during the season responded to N rates. This was likely due to plants with higher N rates had more leaves dying due to shading from leaves above.
The triple interaction N by S by species was mainly due to magnitude difference between swede and kale yields, rather than a true interaction of treatments; however, this significant interaction seems to indicate that S fertilization might reduce the need of N fertilization in swede, but not in kale (Table 5). Swede had higher total root/stem yield and leaf + root/stem yield than kale for all N and S rates (Table 5). This is explained because in swede the biomass from the enlarged root is much greater than that of kale stems. Swedes root yield is about 2/3 of the total plant biomass while in kale stem and leaf yield are similar. Root/stem yield in swede was highest with the 200 kg N ha−1 rate and no S application. When sulfur was applied, highest root/stem yield was obtained at 150 kg N ha−1, however, it was not significantly different than the 200 kg N ha−1 rate. In kale, N did not increase root/stem yield regardless of sulfur rate. For the leaf + root/stem yield, both species had the highest yield with the 200 kg N ha−1 rate. The addition of sulfur in swede produced the highest root/stem yield and leaf + root/stem yield with the 150 kg N ha−1 rate, which might indicate that in the presence of S less N fertilizer might be needed to achieve same total forage yield goal.
The strong response of both species to N was observed across S rates (Table 3). Most of the significant responses in root/stem yield and leaf + root/stem yield were between 0 kg N ha−1 and 200 kg N ha−1. Forage brassicas often respond strongly to N but seldom to S [1,6].
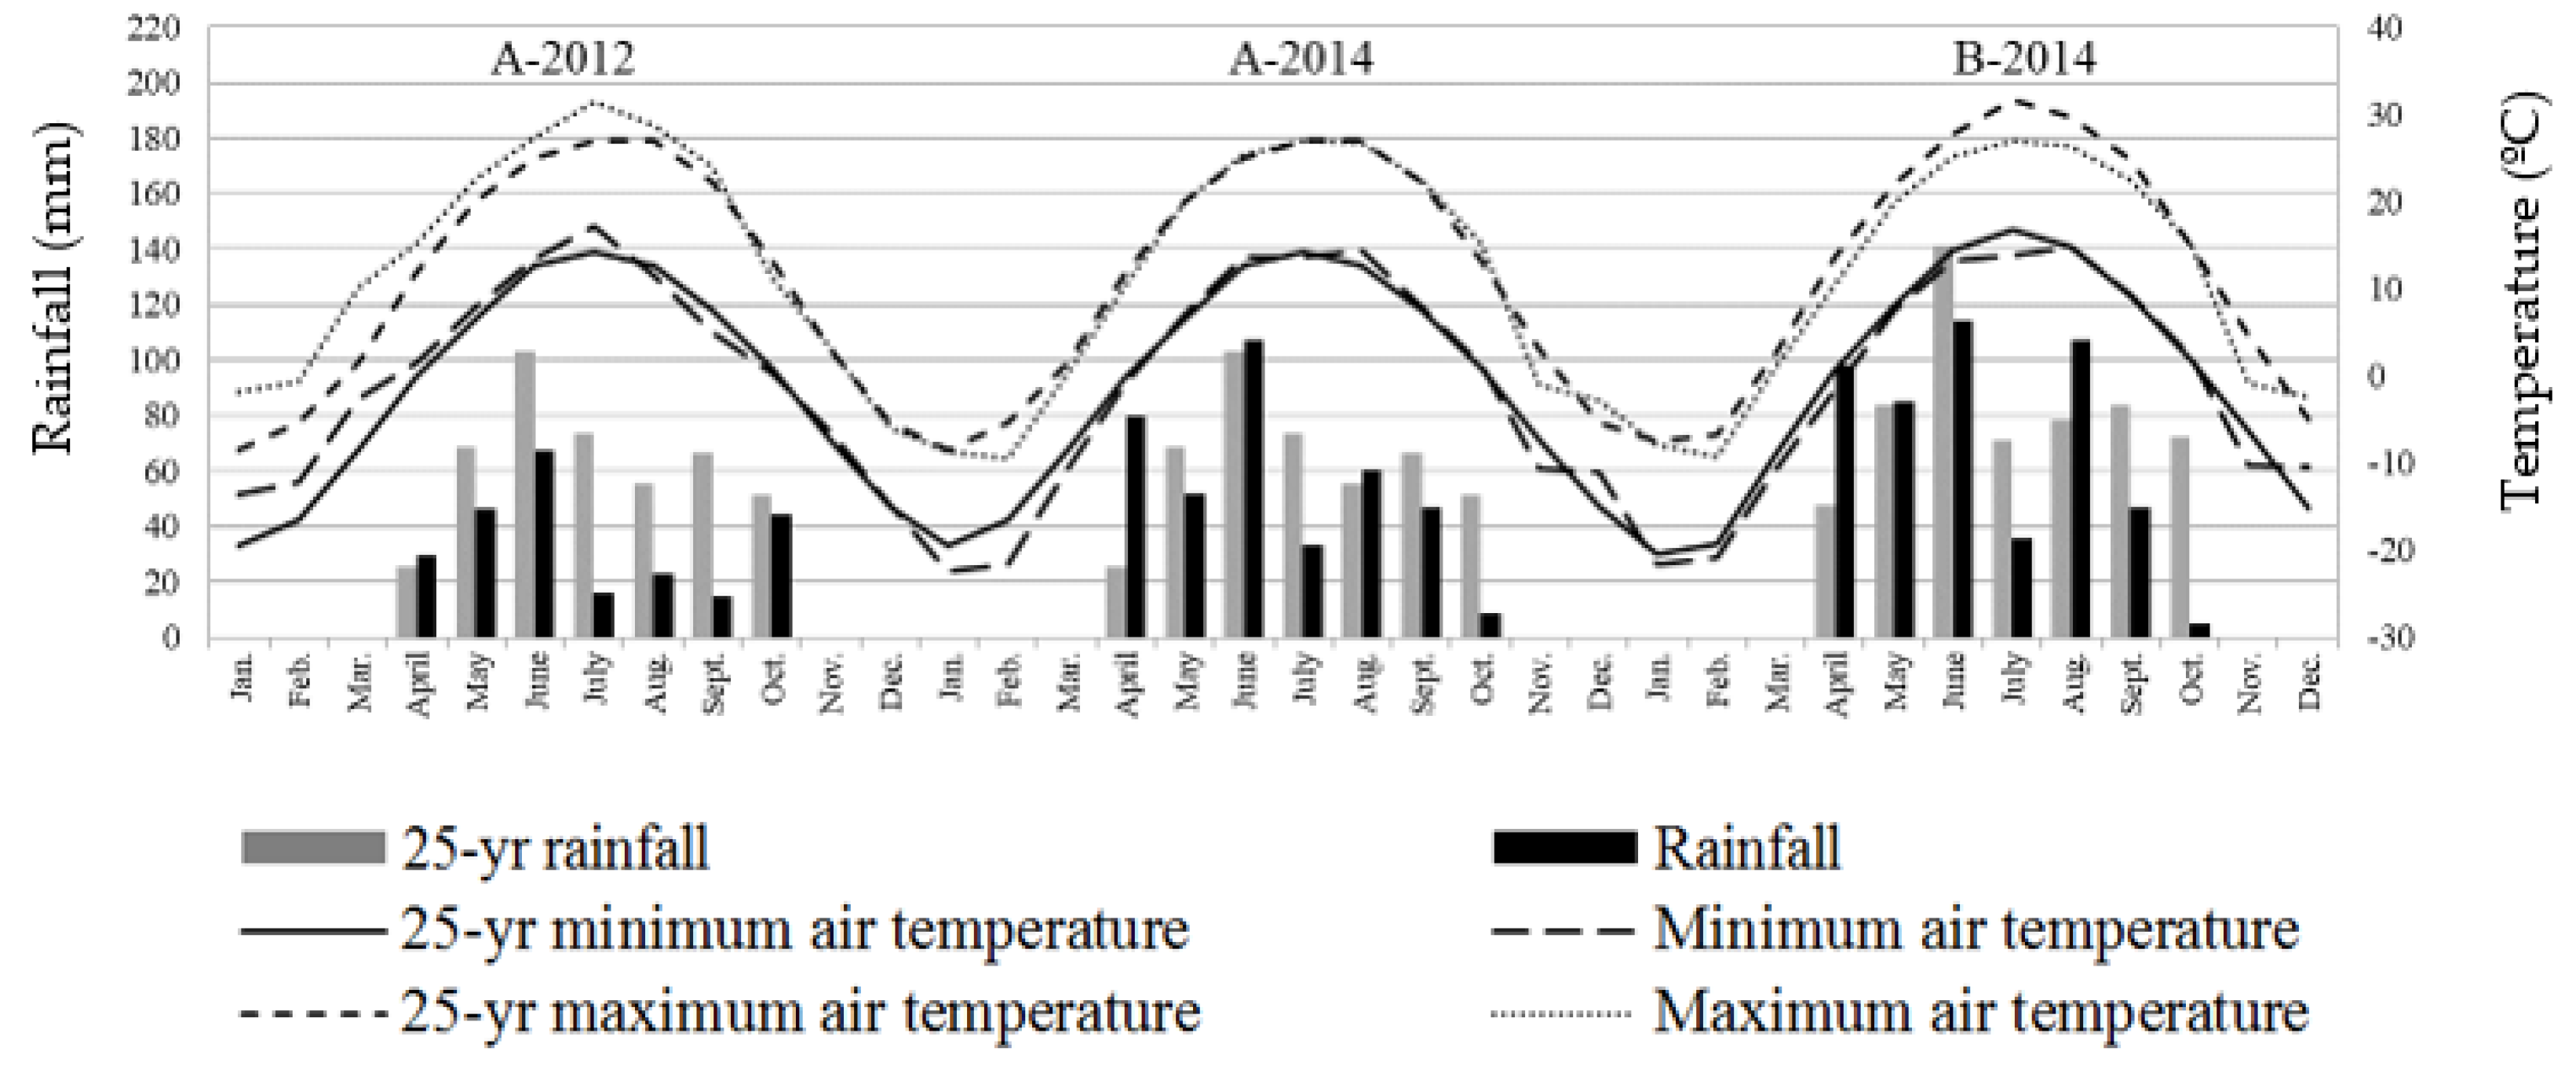
Leaf, stem and root yield of both crops were lower in Prosper in 2012 (data not shown). The most critical rainfall deficiency was in Prosper in 2012, with only 242 mm of rainfall during the growing season, compared with 445 mm of 25-yearrainfall average (Figure 1). The rainfall in Walcott was slightly below the 25-year historical average, with 493 and 578 mm of rainfall during the growing season. In general, the rainfall between sowing and emergence time was adequate, with the lowest amount of rainfall (46.2 mm) in May, in Prosper in 2012 (Figure 1).
The minimum and maximum temperature recorded during 2012 and 2014 were relatively similar to the 25-year average (Figure 1). The highest minimum and maximum temperatures were observed in July and August, and the lowest minimum and maximum between December and February. The hottest summers were observed in 2012 in Prosper, with about 2.7 °C above average. The 2014 summer was similar to the average temperature in Prosper. In Walcott, the summer was the coolest, with 3 °C below average. These temperatures are adequate for plant growth of Brassica spp. [2].
The climatic parameters are highly important on forage brassica performance. Growing degree days (GDD, base temperature 0 °C) to maturity have a major effect on forage brassica biomass yield potential [2]. Forage brassicas, although cool-season crops, are highly tolerant to heat, but heat in general speeds up reproductive development. High dry matter production with temperatures of about 32 °C have been reported [37]. Forage brassicas accumulate about 1.1 Mg DM ha−1 per each 100 GDD, base temperature 0 °C and maximum temperature 32 °C, without soil water constraints nor fertility [2].
Water availability is the main environmental source of forage yield variation in brassica forages [2], and water deficits during the growing season reduce forage yield [38]. Swede needs 38 mm H2O week−1 during the season to maximize root yield [39]. Kale and rape have more vigorous root systems than swede and turnip and, therefore, they can utilize stored water more efficiently [2].
Regression analysis of yield response to N was conducted on relative values to account for magnitude differences among environments. Leaf and root/stem yield, leaf + root/stem) dead matter yield and total biomass yield (leaf + root/stem + dead matter biomass yield) showed linear response with increasing N rates (0, 50, 100, 150, and 200 kg N ha−1) (Figure 2; Figure 3). These increments in forage yield with increased N rates are in accord with Chakwizira et al. [41], who reported a linear response in forage yield of brassicas to N rates up to 200 kg N ha−1. Other authors also reported increments in yield with increasing N rates [42,43]; however, these authors found quadratic response instead of the linear response observed in the present study. In most of the cases, the difference in biomass yield between the highest N rate (200 kg N ha−1) and the lowest (0 kg N ha−1) was between 15% for dead matter yield and 23% for leaf yield.

3.2. Response of N and S Fertilization on N Accumulation

As for total forage yield, a strong interaction of N by S by species was observed for total root/stem N and total forage N accumulation, which was likely due to a magnitude effect. Total N accumulation was greater in swede roots than in kale stems at all N and S rates (Table 6). This is likely related to the higher root yield in swedes compared with kale stems. Nitrogen accumulation increased as N rates increased. Nitrogen accumulation in root/stem and in total forage was significantly greater with S application only for the 150 kg ha−1 rate (Table 6). This might indicate that S interacted with N accumulation. Plants might accumulate more N in the presence of both nutrients, rather than just high N rates. In kale, the interaction of N by S was not significant for any N rate. Application of N fertilizer can lead to accumulation of nitrate (NO3-N) in forage brassicas, particularly when N application rates exceed the requirement [7]. This may result in potentially toxic NO3-N (antinutritional compounds) content in grazeable plant tissues, leading to animal health issues and/or environmental pollution [44].
Forage kale and rape (Brassica napus L.), generally have higher NO3-N concentration than turnip and swede. This is because roots, the major yield component of swede, have lower NO3-N content than stems, which make up the bulk of yield in kale and rape [7]. Additionally, Chakwizira et al. [41] reported that NO3-N contents were higher in kale stems and petioles (which included the midrib of the leaf) than in leaves. In a survey conducted in Nebraska, they determined that 48% of fresh brassica samples were considered at risk for causing nitrate toxicity as they exceeded the 2100 mg NO3/kg DM threshold [45].
On average, differences in total N between the highest and lowest N rate was higher in leaves (33%) than in roots and stems (20%). The trend observed in N as main effect could be explained because brassica forages respond to N fertilization up to 400 kg N ha−1 [23,44]. The available N for forage brassicas (swede and kale) in the present experiment could have limited the growth to reach the maximum potential yield, thus brassicas showed a lineal response instead of typical quadratic response observed in experiments with different N rates [44]. Another important factor that could explain the observed response to N fertilization is the soil N content. Prosper 2012 and Walcott 2014 had 44 and 31 kg ha−1 of N-NO3 in the soil at 0–60 cm (Table 2). The soil N-NO3 plus the highest N rate used in the present experiment would have been less than 250 kg N ha−1 available for brassica growth, in these two environments (Table 2), which is less than the recommendations of Chakwizira et al. [45]. Conversely, Wilson and Manley [46] did not find a response to N in kale because the NO3-N content of the soil was high. According to Fletcher et al. [47], kale can have null response to N in soils with high NO3-N; conversely, in low N soils the response is usually significant. However, is important to know that forage brassicas can take up water and nutrients from 0.9 to 1 m deep [6,7]. Thus, the N available for plant growth could have been greater than 250 kg N ha−1. Additionally, Vos and van der Putten [48] reported that the response to N fertilizer in brassicas depends on the amount of residual and mineralized N in the soil, which is influenced by the cropping history.
Nitrogen response is also related with the water availability. The response can be greater when irrigation is used or at least adequate rainfall occurs during the growing season [23,49]. Brassicas must have at least 500 mm of water to avoid yield reduction by water deficit [46]. Fletcher et al. [6] mentioned that drought conditions of 100 mm rainfall produce half of yield compared with full irrigation (328 mm). However, in the environments evaluated in the present experiment the rainfall was low (210, 267, and 251 mm of rainfall in Prosper 2012 and 2014 and Walcott 2014, respectively) (Figure 1). This agrees with de Ruiter et al. [2], who reported water availability is the main environmental source of forage yield variation in brassicas.
Forage yield was composed of 31% leaves and 58% dead matter at the lowest N rate, but with the highest N rate applied, the percentage of both leaves and dead matter increased (Figure 2 and Figure 3), respectively. That probably occurred; because with limited N, the leaf area declined faster as leaves senesced mobilizing N to growing points and new leaves [46]. The relative total N was higher for leaves than for root/stem, and as N rates increased total N increased. The total N rate was greater in leaves which can be observed in Figure 4. These results are in accord with the information provided by Chakwizira et al. [41], and Wilson and Maley [46].

3.3. Forage Nutritive Value

Forage nutritive value of leaves was not affected by N or S rates or species main effect but there was a significant interaction between species and S for crude protein (CP) and acid detergent lignin (ADL) (Table 7). Crude protein was greater in swede fertilized with 40 kg S ha−1 compared with kale at 40 kg S ha−1 (Table 8). Crude protein concentration in kale and swede leaves ranged from 95 to 138 g kg−1. Crude protein concentration in swede and kale in this study were above those needed by beef cattle. A gestating cow in the mid-1/3 of pregnancy and weighing 540 kg requires 10 kg of dry matter intake with 71 g kg−1 of crude protein [50] Several studies have reported that CP increases in leaves and stems with N fertilization but the response depends on N fertilization and weather conditions [43,51]. Higher CP can be explained by higher leaf:stem ratio which is promoted by N availability [51]. Conversely, other authors did not find effect of increasing N rates on leaf and root yield of turnip [5]. The lack of response of forage nutritive value to N in this study was likely due to high soil N or high mineralization rate of residues of the previous crop.
Forage brassicas are more succulent and higher in nutritive value than almost any other type of forage [37] and provide forage when the majority of warm- and cool-season grasses and legumes are unproductive [52,53,54,55]. However, the nutritional content of brassica crops is variable and depends on environment but also of the degree of maturity of the plant at harvest time [56]. Forage brassicas are highly productive, digestible forbs that contain relatively high levels of CP and digestible carbohydrates [57]. Crude protein concentration in leaves was higher in swede than in kale at 40 kg S ha−1 (p ≤ 0.05) (Table 8). Crude protein values in forage brassicas ranges from 130 to 280 g kg−1 varying with species, harvest maturity, and environment [10,58,59]. Crude protein content in shoots and roots depends on the cultivars used [53]. Additionally, N fertilization and weather conditions influence CP content [60]. The null response to increasing N rates on CP in this study can be explained by soil water deficiency because 2012 was a very dry environment (Figure 1) or due to the high N content in the soils used in these experiments, mainly in Prosper 2014 (Table 2).
Acid detergent lignin in leaves tended to be higher (p < 0.05) with 40 kg S ha−1 rates than 0 without S fertilization, and also in kale compared with swede (Table 8). However, ADL was statistically higher in swede with no S applied compared with ADL in kale with 40 kg S ha−1. These results agree with Jung et al. [43] and Kunelius at al. [61], who mentioned that kale usually has lower digestibility and higher fiber, due to their longer and fibrous stems.
Total digestible nutrients were higher (p < 0.05) in swede than kale, at both S rates averaged across all N rates (Table 8). Kale had a TDN of 700–710 g kg−1 compared with 800 g kg−1 TDN in swede. This can be explained by the higher concentration of water soluble carbohydrates in swede compared with kale. Additionally, kale usually has lower dry matter digestibility than other forage brassicas due to their longer and fibrous stems [42,61]. The N by S interaction was significant for NDF, ADF, ADL, NDFD, and TDN for root/stems averaged across species and environments (Table 9). Fiber components, NDF and ADF, were lower when only S fertilizer was applied compared with no S or N fertilizer application. Oppositely, at the highest N rate, NDF and ADF were higher when S was applied than without application. In addition, fiber digestibility and TDN were significantly higher when S was applied in the absence of N fertilizer compared with no S application (Table 10). At higher N rates, plants grow faster and taller changing the proportion of root/stems and leaves. Fiber digestibility is higher in leaves than in stems and roots. Without N fertilization, S fertilizer application (40 kg S ha−1) reduced NDF, ADF, and ADL content increasing digestibility and TDN in comparison to no S application. Sulfur, similarly to N, has a role in protein synthesis, including many enzymes in cell wall components synthesis. Sulfur, likely substituted N functions in part when N was a limiting factor, allowing the plant to mobilize carbon resources away from fiber synthesis and secondary pathways leading to lignin formation. In addition sulfur mobility in the plant is limited, thus in the treatment with no N or S application, sulfur could not complement N functions [13,14].

4. Conclusions

Kale and swede forage biomass yield (leaf and root/stem) increased up to 200 kg N ha−1 in a linear response, indicating that these species could actually have a response to greater N rates. However, higher N rates will likely not be economical; even if forage yield is increased and might lead water contamination and environmental problems. Swede total forage yield was greater than that of kale across all N and S rates. Nitrogen fertilization increased total leaf, root/stems, and dead matter yield and N accumulation in both leaves and roots. Thus, the recommendation for growers in the northern Great Plains is to fertilize with at least 200 kg ha−1 of N for maximum forage yield and a high valuable feed resource for early fall.
The interaction of N and S rates did not affect forage yield but had an effect on some of the root/stems quality constituents. Nitrogen fertilization main effect across species did not increase crude protein as expected. This likely because crude protein content in swede was significantly higher than that of kale. Forage nutritive value was greater in swede than kale due to higher proportion of edible root compared with kale higher proportion of fibrous stems. This study results suggest that growers will benefit from greater forage yield in kale and swede if they fertilized with N up to 200 kg N ha−1, but not with S. Forage yield and nutritive value of swede and kale in the northern Great plains are novel results, since these crops currently are not grown for forage and represent an interesting and valuable new alternative for beef cattle growers.

Author Contributions

O.T. conducted experiments, analyzed data, made tables and figures, wrote the first manuscript draft and edited it further. D.S. collaborated on the execution of experiments and editing and formatting of manuscript. M.B., obtained the funding, wrote project proposal, designed experiments, assisted with statistical analysis, and wrote the final manuscript. All authors have read and agreed to the published version of the manuscript.

Funding

This research was possible thanks to the funding provided by the North Dakota State University Agricultural Experimental Station project ND 01557 and NC-SARE.

Acknowledgments

The authors also wish to thank all technical staff, visiting scientists, undergraduate, and graduate students that helped support these studies.

Conflicts of Interest

The authors declare no conflict of interest.

References

  1. Wilson, D.; Reid, J.; Zyskowski, R.; Maley, S.; Pearson, A.; Armstrong, S.; Catto, W.; Stafford, A. Forecasting fertilizer requirements of forage brassica crops. Proc. N. Z. Grassl. Assoc. 2006, 68, 205–210. [Google Scholar]
  2. De Ruiter, J.; Wilson, D.; Maley, S.; Fletcher, A.; Fraser, T.; Scott, W.; Berryman, S.; Dumbleton, A.; Nichol, D. Management Practices for Forage Brassicas; Forage Brassica Development Group: Christchurch, New Zealand, 2009; p. 62. [Google Scholar]
  3. Chakwizira, E.; Fletcher, A.; Meenken, E.; Johnstone, P.; Maley, S.; Arnold, N.; Armstrong, S.; George, M.; Sim, R.; Minchin, R.; et al. Dry matter response of swede crops to nitrogen and phosphorus application in Southland and central North Island regions of New Zealand. Agron. N. Z. J. 2011, 41, 23–37. [Google Scholar]
  4. Grant, C.; Bailey, L. Fertility management in canola production. Can. J. Plant Sci. 1993, 73, 651–670. [Google Scholar]
  5. Keogh, B.; McGrath, T.; Grant, J. The effect of sowing date and nitrogen on the dry-matter yield and nitrogen content of forage rape (Brassica napus L.) and stubble turnips (Brassic rapa L.) in Ireland. Grass Forage Sci. 2011, 67, 2–12. [Google Scholar]
  6. Fletcher, A.; Wilson, D.; Maley, S.; Mccallum, J.; Shaw, M. The effect of sulphur and nitrogen fertiliser on levels of antinutritional compounds in kale. Proc. N. Z. Grassl. Assoc. 2010, 72, 79–84. [Google Scholar]
  7. Fletcher, A.; Chakwizira, E. Nitrate accumulation in forage brassicas. N. Z. J. Agric. Res. 2012, 55, 413–419. [Google Scholar]
  8. Jacobs, J.; Ward, G. Effect of nitrogen application on dry matter yields, nutritive characteristics and mineral content of summer-active forage crops in southern Australia. Anim. Prod. Sci. 2011, 51, 77–86. [Google Scholar]
  9. Jamal, A.; Moon, Y.; Abdin, M. Sulphur -a general overview and interaction with nitrogen. Aust. J. Crop Sci. 2010, 4, 523–529. [Google Scholar]
  10. Piri, I.; Rahimi, A.; Tavassoli, A.; Rastegaripour, F.; Babaeian, M. Effect of sulphur fertilizer on sulphur uptake and forage yield of Brassica juncea in condition of different regimes of irrigation. Afr. J. Agric. Res. 2012, 7, 958–963. [Google Scholar]
  11. Anjum, N.; Gill, S.; Umar, S.; Ahmad, I.; Duarte, A.; Pereira, E. Improving growth and productivity of oleiferous brassicas under changing environment: Significance of nitrogen and sulfur nutrition, and underlying mechanisms. Sci. World J. 2011, 12, 1–12. [Google Scholar]
  12. Reuveny, Z.; Dougall, D.K.; Trinity, P.M. Regulatory coupling of nitrate and sulphate assimilation pathways in cultured tobacco cells. Proc. Natl. Acad. Sci. USA 1980, 77, 6670–6672. [Google Scholar] [PubMed] [Green Version]
  13. Janzen, H.; Bettany, J. Sulfur nutrition of rapeseed. Influence of fertilizer nitrogen and sulfur rates. Soil Sci. Soc. Am. J. 1984, 48, 100–107. [Google Scholar]
  14. Duke, S.H.; Reisenauer, H.M. Roles and requirements of sulfur in plant nutrition. In Sulfur in Agriculture; Tabatabai, M.A., Ed.; Agronomy Monograph No. 27; American Society of Agronomy: Madison, WI, USA, 1986; pp. 123–168. [Google Scholar]
  15. Friedrich, J.W.; Schrader, L.E. Sulfur deprivation and nitrogen metabolism in maize seedlings. Plant Physiol. 1978, 61, 900–903. [Google Scholar] [PubMed] [Green Version]
  16. Prosser, I.M.; Purves, J.V.; Saker, L.R.; Clarkson, D.T. Rapid disruption of nitrogen metabolism and nitrate transport in spinach plants deprived of sulphate. J. Exp. Bot. 2001, 52, 113–121. [Google Scholar] [PubMed]
  17. Dietz, K.J. Leaf chloroplast development in relation to nutrient availability. J. Plant Physiol. 1989, 134, 544–550. [Google Scholar]
  18. McGrath, S.; Zhao, J. Sulphur uptake, yield responses and interaction between nitrogen and sulphur in winter oilseed rape (Brassica napus). J. Agric. Sci.-Camb. 1996, 126, 53–62. [Google Scholar]
  19. Gilbert, S.M.; Clarkson, D.T.; Cambridge, M.; Lambers, H.; Hawkesford, M.J. SO42–deprivation has an early effect on the content of ribulose-1,5-bisphosphate carboxylase/oxygenase and photosynthesis in young leaves of wheat. Plant Physiol. 1997, 115, 1231–1239. [Google Scholar]
  20. Ahmad, A.; Abdin, M.Z. Interactive effect of sulphur and nitrogen on the oil and protein contents and on the fatty acids profiles of oil in the seeds of rapeseed (Brassica campestris L.) and mustard (Brassica juncea L. Czern. and Coss). J. Agron. Crop Sci. 2000, 185, 49–54. [Google Scholar]
  21. Manaf, A.; Ul-Hassan, F. Effects of sulphur on fatty acid accumulation in brassica cultivars. Int. J. Agric. Biol. 2006, 8, 588–592. [Google Scholar]
  22. Chen, G.; Clark, A.; Kremen, A.; Lawley, Y.; Price, A.; Stocking, L.; Weil, R. Brassicas and mustards. In Managing Cover Crops Profitably, 3rd ed.; Clark, A., Ed.; Sustainable Agriculture Research and Education: College Park, MD, USA, 2007; pp. 81–90. [Google Scholar]
  23. Fletcher, A.; Sinton, S.; Gillespie, R.; Maley, S.; Sim, R.; de Ruiter, J.; Meenken, E. Drought response and water use efficiency of forage brassica crops. Agron. N. Z. 2010, 40, 105–117. [Google Scholar]
  24. Fazili, I.; Jamal, A.; Ahmad, S.; Masoodi, M.; Khan, J.; Abdin, M. Interactive effect of sulphur and nitrogen on nitrogen accumulation and harvest in oilseed crops differing in nitrogen assimilation potential. J. Plant Nutri. 2008, 31, 1203–1220. [Google Scholar]
  25. Web Soil Survey. Available online: http://websoilsurvey.sc.egov.usda.gov/App/HomePage.htm (accessed on 6 January 2020).
  26. Harper, F.; Berkenkamp, B. Revised growth-stage key for Brassica campestris and B. napus. Can. J. Plant Sci. 1975, 55, 657–658. [Google Scholar]
  27. Theunissen, J.; Sins, A. Growth stages of brassica crops for crop protection purposes. Sci. Hort. 1984, 24, 1–11. [Google Scholar]
  28. Franzen, D. North Dakota Fertilizer Recommendation: Tables and Equations. Available online: https://www.ndsu.edu/fileadmin/soils/pdfs/sf882.pdf (accessed on 6 January 2020).
  29. Olsen, S.R.; Cole, C.V.; Watanabe, F.S.; Dean, L.A. Estimation of Available Phosphorus in Soils by Extraction with Sodium Bicarbonate; U.S. Department of Agriculture Circular: Washington, DC, USA, 1954; p. 19. [Google Scholar]
  30. Warncke, D.; Brown, J.R. Potassium and other basic cations. In Recommended Chemical Soil Test Procedures for the North Central Region. North Central Reg. Publ. 221 (revised); Brown, J.R., Ed.; Univ. Missouri Ag. Exp. Station: Columbia, MO, USA, 1998; pp. 36–38. [Google Scholar]
  31. Cataldo, B.A.; Haroon, M.; Schrader, L.E.; Youngs, V.L. Rapid colorimetric determination of nitrate in plant tissue by nitration of salicylic acid. Commun. Soil Sci. Plant Anal. 1975, 6, 71–80. [Google Scholar]
  32. Speirs, J.; Mitchell, W.J. Estimation of nitrogen by Kjeldahl’s method note in the ammonia distillation. J. Inst. Brewing. 2013, 42, 247–250. [Google Scholar]
  33. Tilley, J.M.A.; Terry, R.A. A two stage technique for the in vitro digestion of forage crops. J. Bri. Grassl. Soc. 1963, 18, 104–111. [Google Scholar]
  34. Undersander, D.; Moore, J.E. Relative forage quality (RFQ) -indexing legumes and grasses for forage quality. In Proceedings of the Proceeding National Alfalfa Symposium, San Diego, CA, USA, 13–15 December 2004; p. 4. [Google Scholar]
  35. Abrams, S.M.; Shenk, J.; Westerhaus, F.E. Determination of forage quality by near infrared reflectance spectroscopy: Efficacy of broad-based calibration equations. J. Dairy Sci. 1987, 70, 806–813. [Google Scholar]
  36. SAS Institute. SAS User’s Guide: Statistics; SAS Institute: Cary, NC, USA, 2014. [Google Scholar]
  37. Smith, D.; Collins, M. Forbs. In Forages: An Introduction to Grassland Agriculture, 6th ed.; Barnes, R.F., Nelson, C.J., Collins, M., Moore, K.J., Eds.; Iowa State Press: Ames, IA, USA, 2003; pp. 215–230. [Google Scholar]
  38. Rowe, B.; Neilsen, J. Effects of irrigating forage turnips, Brassica rapa var. rapa, during different periods of vegetative growth. 1. Turnip yields, yield components and growth rates. Crop Pasture Sci. 2010, 61, 885–891. [Google Scholar]
  39. Vegetable Fodder and Forage Crops for Livestock Production: Rutabagas. Available online: http://cru.cahe.wsu.edu/CEPublications/FS054E/FS054E.pdf (Accessed on 6 January 2020).
  40. NDAWN. North Dakota Agricultural Weather Network. NDAWN Center; North Dakota State Univ.: Fargo, ND, USA, 2016; Available online: http://ndawn.ndsu.nodak.edu (Accessed on 6 January 2020).
  41. Chakwizira, E.; Johnstone, P.; Fletcher, A.; Meenken, E.; de Ruiter, J.; Brown, H. Effects of nitrogen rate on nitrate-nitrogen accumulation in forage kale and rape crops. Grass Forage Sci. 2015, 70, 268–282. [Google Scholar]
  42. Jung, G.; Byers, R.; Panciera, M.; Shaffer, J. Forage dry matter accumulation and quality of turnip, swede, rape, Chinese hybrids and kale in the eastern USA. Agron. J. 1986, 78, 245–253. [Google Scholar]
  43. Albayrak, S.; Camas, N. Performance of forage turnip (Brassica rapa L.) cultivars under different nitrogen treatments. J. Fac. Agric. 2006, 21, 44–48. [Google Scholar]
  44. Chakwizira, E.; de Ruiter, J.; Maley, S. Nitrogen uptake and nitrogen use efficiency of forage kale crops grown under varying amounts of water and nitrogen fertiliser rates in shallow soils. In Proceedings of the 17th ASA Conference, Hobart, Australia, 20–24 September 2015; Available online: www.agronomy2015.com.au (accessed on 6 January 2020).
  45. Lenz, M.E.; Farney, J.K.; Kern, R.J.; Orvis, C.E.; Drewnoski, M.E. Nitrate toxicity in annual forages: Survey of beef producer perspectives and samples submitted to a commercial testing laboratory in Nebraska. Appl. Anim. Sci. 2019, 35, 455–463. [Google Scholar] [CrossRef]
  46. Wilson, D.; Maley, S. Nitrogen balance for kale. In Proceedings of the 13th Australian Agronomy Conference. Perth, Western, Australia, 10–14 September 2006; Turner, N., Acuna, T., Eds.; Australian Society of Agronomy Inc.: Warragul, Australian, 2006. [Google Scholar]
  47. Fletcher, A.; Brown, H.; Wilson, D.; Maley, S. Forage production and nitrogen uptake of kale. In Proceedings of the 3rd Australasian Dairy Science Symp, Melbourne, Australia, 18–20 September 2007; Chapman, D.F., Clark, D.A., Macmillan, K.L., Nation, D.P., Eds.; Australian Society of Agronomy Inc.: Warragul, Australian, 2006; pp. 335–342. [Google Scholar]
  48. Vos, J.; van der Putten, P. Field observations on nitrogen catch crops. I Potential and actual growth and nitrogen accumulation in relation to sowing date and crop species. Plant Soil. 1997, 195, 299–309. [Google Scholar]
  49. Chakwizira, E.; Gillespie, R.; Maley, S.; George, M.; Michel, A. Water and nitrogen use efficiency of forage kale crops. Agric. N. Z. 2013, 43, 67–80. [Google Scholar]
  50. Lalman, D.; Richards, C. Nutrient Requirements of Beef Cattle. Oklahoma Cooperative Ext. Serv., Oklahoma State Univ.: Stillwater, OK, USA. 2017. Available online: http://pods.dasnr.okstate.edu/docushare/dsweb/Get/Document-1921/E-974web.pdf (accessed on 4 April 2020).
  51. Pelletier, G.; Donefer, E.; Darisse, J. Effects of dates and levels of N fertilization on yields, chemical an in vitro digestibility of forage kale. Can. J. Plant Sci. 1976, 56, 63–70. [Google Scholar]
  52. Rao, S.; Horn, F. Planting season and harvest date effects on dry matter production and nutritional value of brassica spp. in the Southern Great Plains. Agron. J. 1986, 78, 327–333. [Google Scholar]
  53. Penrose, C.; Bartholomew, H.; Sulc, R.; Schumacher, S.; Duff, R. Performance of brassica cultivars from New Zealand and United States seed sources in Southeast Ohio, USA. Proc. N. Z. Grassl. Assoc. 1986, 57, 111–113. [Google Scholar]
  54. Altinok, S.; Karakaya, A. Effects of growth season on forage yields of different brassica cultivars under Ankara conditions. Turk J. Agric. For. 2003, 27, 85–90. [Google Scholar]
  55. Salmon, R.W.; Dumbleton, A.J. The effect of seed treatment and depth of sowing on forage brassica crop establishment in no-tillage situations. Proc. N. Z. Grassl. Assoc. 2006, 68, 211–214. [Google Scholar]
  56. Francisco, M.; Velasco, P.; Lema, M.; Cartea, M. Genotypic and environmental effects on agronomic and nutritional value of Brassica rapa. Agron. J. 2011, 103, 735–742. [Google Scholar]
  57. Arnold, M.; Lehmkuhler, J. Forage-Related Cattle Disorders, Brassicas: Be Aware of the Animal Health Risks; Development Cooperative Ext. Serv., Univ. of Kentucky: Lexington, KY, USA, 2014; p. 3. Available online: http://www2.ca.uky.edu/agc/pubs/ID/ID223/ID223.pdf (accessed on 6 January 2020).
  58. Teuber, O.; Almonacid, P.; Monsalve, M.; Monsalve, E. Production and Nutritional Quality of Five Brassicas Forages Species (Brassica Spp.) in the Intermediate Zone of Aysen, Patagonia (Chile); Alfaro, M., Luders, C., Eds.; Sociedad Chilena de Producción Animal SOCHIPA AG, Casilla 58-D: Temuco, Chile, 2009; pp. 79–80. [Google Scholar]
  59. Villalobos, L.; Brummer, J. Evaluation of Brassicas for Fall Forage. In Proceedings of the Western States Alfalfa and Forage Symposium, Reno, NV, USA, 11–13 December 2013; Available online: http://alfalfa.ucdavis.edu/+symposium/proceedings/2013/13WAS-23_Villalobos_Brassicas.pdf (accessed on 6 January 2020).
  60. Tiryakioglu, H.; Turk, M. Effects of different sowing and harvesting times on yield and quality of forage turnip (Brassica rapa L.) grown as a second crop. Turk. J. Field Crop. 2012, 17, 166–170. [Google Scholar]
  61. Kunelius, H.; Halliday, L.; Sanderson, J.; Gupta, U. Effect of harvest dates on yield and composition of forage kale. Can. J. Plant Sci. 1989, 69, 143–149. [Google Scholar]
Figure 1. Monthly average minimum and maximum air temperatures and monthly total rainfall in 2012, and 2014 compared with the 25-year (1990–2014) average in Prosper (A), and Walcott (B) [40].
Agronomy 10 00619 g001
Figure 2. Regression model for relative leaf (y1), root/stem (y2), and total forage yield (leaf + root/stem, y3) averaged across swede and kale affected by different nitrogen (N) rates averaged across three environments in Prosper and Walcott, ND, USA in 2012 and 2014.
Agronomy 10 00619 g002
Figure 3. Regression model for relative dead matter (y1) and total biomass yield (leaf + root/stem + dead matter, y2) of swede and kale averaged, affected by different nitrogen (N) rates averaged across three environments in Prosper and Walcott, ND, USA in 2012 and 2014.
Agronomy 10 00619 g003
Figure 4. Regression model for relative leaf, root/stem, and leaf + root/stem total nitrogen (N) of swede and kale averaged, affected by different N rates averaged across three environments in Prosper and Walcott, ND, USA in 2012 and 2014.
Agronomy 10 00619 g004
Table 1. Sowing and harvest dates and number of days from sowing to harvest for experiments at Prosper and Walcott, ND, USA, in 2012 and 2014.
20122014
LocationSowingHarvestNo. DaysSowingHarvestNo. Days
Prosper
2 May25 Oct17623 May15 Oct145
Walcott
16 May22 Aug98
Table 2. Soil test results at the experimental sites in Prosper and Walcott, ND, USA in 2012 and 2014.
LocationNO3-N
(0–15 cm)
NO3-N
(15–60 cm)
NO3-N
(0–60 cm)
S-SO4 PKOMpH
--------------------------kg ha−1--------------------------mg kg−1-----g kg−1
2012
Prosper
172744-29305397.2
2014
571452021024285387.3
Walcott 2014
62531851397297.4
S-SO4, pH, organic matter (OM), P—Olsen, K from 0–15 cm depth. Phosphorus (P), potassium (K), nitrate nitrogen (NO3-N).
Table 3. Analysis of variance and mean squares of absolute values for brassica leaf, root/stem, leaf + root/stem, dead matter and total biomass yield, and total nitrogen (N) for leaf, root/stem and total forage yield for N and sulfur (S) rates in Prosper 2012 and 2014 and Walcott, ND, USA in 2014.
Source of VariationdfLeaf Yield §Root/Stem YieldLeaf and Root/Stem YieldDead Matter Total Biomass YieldTotal Leaf NTotal Root/ Stem NTotal Forage N
Env 219,577199,414281,525190,096 ***922,59079,42534,552196,746
Rep(env)62565330210,8392091 *13,85464419254158
Sp14068851,286 **973,068 **30,1901,346,052 **19,251119,129234,224 *
Env × Sp226,761 *8532515419865649317979087781
Env × Sp × rep63318 ***1904639337261712417 ***7345083 **
N415,018 ***21,268 *70,275 **4021 **107,042 **6887 ***9653 **32,268 ***
Env × N86323877654431688431328791196
S16645411521,22363329,19518755540
Env × S26063 ***14,61736,62737633,761135735029168
N × S495352998683224 705547210461909
Env × N × S8122338999205 *39310,674 *431799 *1908 *
N × Sp437713211871109952872735911410
Env × N × Sp81692 *32277208 4058818 *484998 **2427 *
S × Sp10.1107310961006420521411642378
Env × S × Sp2518958 *78294548387972128 **1809
N × S × Sp410156310 *11,837 *20911,641 *3021248 **2432 *
Env × N × S × Sp8647122121805842392217142413
Error1086372571446337455723336901470
CV % 2531262021303428
Env = Environment, Rep = Replicate, Sp = Species and cultivars. *, **, *** Significant at 0.05, 0.01, and 0.001 probability levels, respectively. § Mean squares values in columns 1–5 were divided by 1000, but not in columns 6–8. Total N accumulation = N accumulated by leaves + root/stem. Degrees of freedom (df), coefficient of variation (CV).
Table 4. Leaf, root/stem, leaf + root/stem, and dead matter yield, N accumulation in the root/stem and total nitrogen (N) accumulated in (leaf + root/stem) response to N rates averaged across sulfur (S)rates, species, and environments.
N RateLeaf YieldRoot/StemLeaf + Root/StemDead MatterN Accum Root/StemTotal N Accumulated (Leaf + Root/Stem
kg ha−1-------------------Mg ha−1-----------------------------------kg ha−1-------------
02.504.206.712.8559108
502.544.647.182.7665112
1003.165.058.213.1277134
1503.745.509.253.4188160
2003.876.1810.013.5299177
LSD (0.05)0.430.941.120.271417
SE0.351.091.031.0314.533.5
Least significant differences (LSD); standard error (SE).
Table 5. Swede and kale root/stem yield and leaf + root/stem yield with five nitrogen (N) rates and two sulfur (S) rates averaged across three environments at Prosper and Walcott, ND, USA, in 2012 and 2014.
Root/Stem YieldLeaf + Root/Stem Yield
N RateS Rate (kg S ha−1)
kg N ha−1040040
Swede (Mg ha−1)
06.75.59.28.1
506.76.99.29.8
1007.07.610.710.9
1506.19.19.413.7
2008.78.512.412.6
Kale (Mg ha−1)
02.22.44.35.2
502.82.25.24.5
1002.63.35.46.0
1503.43.46.77.2
2003.44.17.08.2
LSD12.02.4
LSD22.33.3
LSD31.72.7
SE1.251.55
Least significant differences (LSD1) to compare between means of species for a same rate of N and S in different species. LSD2 to compare between means of S rates for same N rate and species. LSD3 to compare between means of N rates for same S rate and species. SE = Standard error for the interaction N × S × Species.
Table 6. Swede and kale total root/stem nitrogen (N) accumulation and total N accumulated in forage (leaf + root/stem) with five N rates and two sulfur (S) rates averaged across three environments at Prosper and Walcott, ND, USA, in 2012 and 2014.
Total Root/Stem NTotal Forage N
N RateS Rate (kg S ha−1)
kg N ha−1040040
Swede (kg N ha−1)
08673144129
508791134151
100104110180170
15093136172228
200127133215197
Kale (kg N ha−1)
037427684
5050349470
10047509690
1506261120121
2006773135125
LSD14250
LSD23349
LSD32942
SE18.236.5
Least significant differences (LSD1) to compare between means of species for a same rate of N and S in different species. LSD2 to compare between means of S rates for same N rate and species. LSD3 to compare between means of N rates for same S rate and species. SE = Standard error for the interaction N × S × Species.
Table 7. Analysis of variance and mean squares of forage quality components of brassica leaves for nitrogen (N) and (S)rates and species in Prosper 2012 and 2014, and in Walcott, ND, USA in 2014.
Source of VariationdfAshCP §NDFADFADLIVDMDNDFDTDN
Env 260,970109,22575,50517,385248124,33934,01567,638 ***
Rep(Env)610631889327518615882858 *
Sp1898941,4661875338976916,859743218,269
Env × Sp2544073,904 ***26,503 *12,434 **5254 ***383716815848
Env × Sp × Rep61377 ***1371 ***454273 *99 ***214 *1251408 ***
N41518191478046797194551333
Env × N8416105655139765348195 *457
S17366504154352437023613495
Env × S28462370809117893682221009 *
N × S42781127882393022
Env × N × S8325481461174316790513
N × Sp42862311163659334152114
Env × N × Sp8583431458311 *35259236 *433
S × Sp13582054 *1480.00597 *598182428
Env × S × Sp2854679832954821491088 *
N × S × Sp4733237166728164134925
Env × N × S × Sp8263217389186 21124105396
Error108280301225123209389318
CV, % 1114669112
Env=Environment, Rep=Replicate, Sp= Species. *, **, *** Significant at 0.05, 0.01, and 0.001 probability levels, respectively. § Forage quality components: Crude protein (CP), neutral detergent fiber (NDF), acid detergent fiber (ADF), acid detergent lignin (ADL), in vitro dry matter digestibility (IVDMD), neutral detergent fiber digestibility (NDFD) and total digestible nutrients (TDN), coefficient of variation (CV), degrees of freedom (df).
Table 8. Crude protein and ADL for leaves and TDN for root/stems of swede and kale with five nitrogen (N) rates and two sulfur (S) rates across three environments at Prosper and Walcott, ND, USA, in 2012 and 2014.
CP LeavesADL LeavesTDN Root/Stems
S rate (kg S ha−1)
Species040040040
--------------------------------------g kg−1-------------------------------------------------
Swede1381334749803803
Kale114955054706716
LSD0.05 (SE)31 (32.4)6 (6.6)14 (26.0)
Crude protein (CP), acid detergent lignin (ADL), total digestible nutrients (TDN), least significant differences (LSD), standard error for the interaction S × Species (SE).
Table 9. Analysis of variance and mean squares of forage quality components of brassica root/stem for nitrogen (N) and sulfur (S) fertility in Prosper 2012 and 2014, and in Walcott, ND, USA in 2014.
Source of VariationdfAshCP §NDFADFADLIVDMDNDFDTDN
Env 2201313,055467,585269,69215,525411,292275,83896,691
Rep(Env)627881510296325310631034736
Sp118,66639,073733,317438,37630,135661,025714,067377,346
Env × Sp23408547645,904 **29,045 **2257 **50,573 **42,278 *24,718 ***
Env × Sp × Rep6239 ***6511262 *722 *4411341244 *688 **
N4316104514329108019361631785
Env × N8159526784519471215838454
S1765312518621637777611307
Env × S2584225622420737716197450
N × S4562082417 **1463 **102 *2549 **2421 **629 *
Env × N × S86824623413216284226149
N × Sp4124 *28314968445011261171386
Env × N × Sp8251311031 *664 **68 **1576 **1401 ***593 *
S × Sp1948353815914435423181271 *
Env × S × Sp2322 *1159 *1960 **1105 **80 **2085 **2954 ***50
N × S × Sp4299443625929543407227
Env × N × S × Sp8571661831007148112132
Error1084916545827524540453179
CV, % 9126610332
Env = Environment, Rep = Replicate, Sp = Species and cultivars. *, **, *** Significant at 0.05, 0.01, and 0.001 probability levels, respectively. § Forage quality components: Crude protein (CP), neutral detergent fiber (NDF), acid detergent fiber (ADF), acid detergent lignin (ADL), in vitro dry matter digestibility (IVDMD), neutral detergent fiber digestibility (NDFD) and total digestible nutrients (TDN), coefficient of variation (CV), degrees of freedom (df).
Table 10. Neutral detergent fiber, ADF, ADL, NDFD, and TDN for root/stems with five nitrogen (N) rates and two sulfur (S) rates averaged across two species and three environments at Prosper and Walcott, ND, USA, in 2012 and 2014.
NDFADFADLNDFDTDN
S Rate (kg S ha−1)
N Rate (kg ha−1)040040040040040
-------------------------------g kg−1------------------------------
03533342722574844773792756768
503543452722654746776782756765
1003523582712754849775769754756
1503643532812715148762772745756
2003343562572744549794771760752
LSD0.05 (SE)12 (51.2)9 (38.9)3 (9.3)11 (39.5)11 (23.5)
Forage quality components: neutral detergent fiber (NDF), acid detergent fiber (ADF), acid detergent lignin (ADL), neutral detergent fiber digestibility (NDFD), and total digestible nutrients (TDN). Least significant differences (LSD), standard error for the interaction N rate × S rate (SE).

