Article

Effects of Soft Rock and Biochar Applications on Millet (Setaria italica L.) Crop Performance in Sandy Soil

1
Key Laboratory of Degraded and Unused Land Consolidation Engineering, Ministry of Land and Resources of China, Xi’an 710075, China
2
College of Life Science, Yulin University, Yulin 719000, China
3
State Key Laboratory of Soil Erosion and Dryland Farming on the Loess Plateau, Institute of Soil and Water Conservation, Chinese Academy of Sciences and Ministry of Water Resources, Yangling 712100, China
*
Author to whom correspondence should be addressed.
Agronomy 2020, 10(5), 669; https://doi.org/10.3390/agronomy10050669
Submission received: 13 April 2020 / Revised: 29 April 2020 / Accepted: 8 May 2020 / Published: 18 May 2020

Abstract

:
In arid and semi-arid regions, desertification threatens crop production because it reduces the soil’s capacity to retain water and soil nutrients. At two fertilizer levels (90 kg N hm−2 and 45 kg P hm−2 and 270 kg N hm−2 and 135 kg P hm−2), the effects of soft rock (sand: soft rocks = 3:1) and biochar (4500 kg hm−2) applications on soil moisture, soil nutrients, and millet (Setaria italica L.) photosynthesis, yield, and its agronomic traits (biomass, thousand kernel weight, harvest index) were investigated in a field experiment in the Mu Us Sandy Land of China in 2018–2019. The addition of biochar and soft rock singly increased soil water content, alkali-hydrolyzed nitrogen (AN), total nitrogen (TN) and phosphorus (TP), and organic matter content significantly, suggesting that their application may increase the nutrient and water holding capacity of soil. Application of biochar and soft rock singly increased the net photosynthesis rate of millet flag leaf, at the flowering stage, from 15.97% to 56.26%. Biochar and soft rock application increased the yield range (2109.0 kg hm−2 to 5024.7 kg hm−2) from 5.26% to 54.60% under the same fertilizer level. Correlation analyses showed grain yield was significantly correlated with photosynthesis rate at the flowering stage, which was significantly correlated with soil AN at flowering, soil TP at flowering and harvest, and soil TN at flowering. These results indicated that the application of biochar and soft rock singly could increase soil fertilizer holding capacity to improve the photosynthesis rate at flowering, and, therefore, lead to improvements in crop yield.

1. Introduction

Land desertification is a serious environmental problem all over the world, affecting one-fifth of the world’s population. It is a major threat to the sustainability of agriculture and economic development, especially in arid and semi-arid regions [1,2]. Generally, land degradation mechanisms involve the loss of soil water which further intensifies soil desertification [3]. Decreases in soil water holding capacity and increases in the loss of soil nutrients cause soil to become barren [4]. Desertification induces a decline in soil carbon and nutrients and soil water which affects plant growth and accelerates soil erosion by wind and rain [5,6]. In the future, soil degradation is likely to have a greater impact on agricultural incomes as yields decrease and input costs grow in irrigated, high-quality rain-fed, densely populated, and low-fertility lands.
The Mu Us Sandy land, located at the border of Inner Mongolia autonomous region and Shaanxi province, China, lies at the junction between arid and semi-arid regions and is one of the four major sandy landscapes in China. It has undergone extensive desertification which can mainly be attributed to climate change and anthropogenic activities such as overgrazing, inappropriate farm intensification, and vegetation removal for firewood. This desertification has not only resulted in an increase in bare soil and loss of soil resources (e.g., loss of nutrients and serious degradation of the soil) but has also had implications for sustainable environmental growth in China and the world [7]. Because of the necessity to produce high crop yields to feed a large human population, the Mu Us Sandy land is becoming the second most important source of grain in Shaanxi province [8]. High agricultural production levels in the Mu Us Sandy land have required the consumption of very high amounts of water and fertilizer because of the low water and nutrient holding capacity of the sandy soil. Therefore, methods that improve the ability of sandy soil to store water from limited precipitation, reduce evapotranspiration, and increase water-use efficiency, must be developed to ensure that the environment is protected, and agricultural development is sustainable.
In the Mu Us Sandy land region, there is a particular soft rock known as pishayan, which covers an area of more than 1.67 × 10⁶ hm2 and was named as the “Earth Cancer” by local people [8,9]. This soft rock displays the properties of stone under drought conditions, but becomes soft like mud when it is saturated with water [10]. Therefore, in areas dominated by pishayan, crops cannot grow. In recent years, the strong water holding capacity of soft rocks like pishayan attracted the attention of many researchers [10,11,12]. When soft rocks were added to sandy soil at a mixed ratio of 1:3, the resulting soil mix had an increased water holding capacity as the water infiltration rate was decreased and the hydraulic conductivity was saturated [12]. In a crop yield experiment which used a mixing ratio of 1:2 (soft rock: sandy soil), the biomass and crop yield of maize (Zea mays L.) increased; the maize yield in the soils in which soft rock was added was 3471 kg hm−2 (80% higher than the yield in sandy soil) [8]. Water-use efficiency also increased as a result of the improved water holding capacity gained from the addition of soft rock [8]. The addition of soft rock to sandy soil is now considered an effective method in improving this type of land for agriculture [13]. However, the soft rock and sandy soil mixture contains a low content of organic matter because the sandy soil tends to be barren [11]. Organic matter is an essential component of agricultural soil and affects water holding capacity. In the past, to mitigate this and increase yields in sandy soils, chemical fertilizers were added, which subsequently caused air and underground water pollution [14]. Biochar, a biomass-derived char, contains more than 50% organic matter [15]. The application of biochar has been shown to increase yields of tomato, wheat, corn, peanuts, and rice by improving soil properties [16,17,18,19,20]. Biochar can substantially decrease nutrient leaching, which suggests that the application of biochar could be a useful method to improve the soil nutrient holding capacity [21]. Biochar has been widely used in improving sandy soil [22,23].
Importantly, previous studies on soft rock application in sandy land were done to detect the soil bulk density, soil water content, grain yield, and water-use efficiency and biochar effect on soil hydraulic conductivity [23,24]. However, a gap remains on the impact of these practices on soil nutrients properties, crop physiology, and yield-related traits. Furthermore, a study that contained these two improvement practices on sand land was beneficial in comparing soft rock and biochar. And in fact, most farmers in the Mu Us Sandy land planted the foxtail millet (Setaria italica L.), which has high nutritional value. Now, the performance of millet growing in these improved soils remained unclear. Here, we hypothesize that the application of soft rock and biochar in improving sand soil could enhance the yield of foxtail millet through improving the nutrient and water holding capacity of soil. To address these aims, soil nutrients, crop grain yield, aboveground biomass, net photosynthetic rate, and other agronomic traits were measured in a two-year (2018 and 2019) field experiment.

2. Materials and Methods

2.1. Experimental Site and Design

The experimental site was in a field station in the Shaanxi Institute of Sand Control (38°19′49″ N, 109°42′42″ E, 1201 m a.s.l. Mu Us Sand Land) with a typical warm temperate monsoon climate, Shaanxi Province, China. The annual average temperature is 8.3 °C and the mean annual precipitation is 365.7 mm. Precipitations are concentrated in July and August. In our experimental period (2018), the maximum precipitation was observed in August. However, the precipitation was 206 mm in July, followed by 246 mm in August, which was 150% higher than usual. The cumulative precipitation during the growing season (from early May to the end of September) was 615.3 mm in 2018 and 421.9 mm in 2019 (Figure 1).
The experiment was designed based on two fertilizer levels containing a normal yield pattern (90 kg N hm−2 and 45 kg P hm−2 (NY)) and a high yield pattern (270 kg N hm−2 and 135 kg P hm−2 (HY)). The number of other fertilizers (75 kg K hm−2, 15 kg Zn hm−2 and 1 kg B hm−2) were the same for both fertilizer levels. The fertilizers were applied when the ground was tilled. Four treatments of biochar and soft rock were added to the sandy soil as follows: sand only (CK); sand and biochar (C; 4500 kg biochar hm−2); sand and soft rock (SR; sand: soft rock = 3:1); and sand, biochar, and soft rock (SRC; 4500 kg biochar hm−2 and sand: soft rocks = 3:1). Therefore, in our experiment, there were eight groups (Table 1 and Figure S1). A randomized complete block design with a split-plot treatment and four replicates per treatment was used. Each plot was 4-m wide by 5-m long. The plots consisted of homogenous sandy soil prior to our experiment. Before the start of the experiment, the land was bare sand and the land had not been used to grow crops. The soft rock was collected from the Dongsheng district, Erdos city, Inner Mongolia. The biochar was produced from crop straw (585 g kg−1 total C, EC 1.27 mS cm−1) by Liaoning Golden Future Agriculture Technology Co., Ltd. (Anshan, Liaoning province, China). The properties of the soft rock, sandy soil, and biochar used in our experiment are shown in Table 2. A total depth of 20 cm of the soil mix was added on top of the sandy soil plots.

2.2. Crop Management

Changsheng07, a variety of foxtail millet bred by millet research institute Shanxi Academy of Agricultural Science in 2009, was selected for our experiment. Foxtail millet is an important commercial food crop in the local region and Changsheng07 is widely used in local foxtail millet production as it has a strong resistance to desiccation [25]. The seeds were sown on 7 May 2018, and 11 May 2019, respectively. Seeds were spread evenly in the field with a row spacing of 50 cm. When seedlings reached the two-leaf stage, artificial thinning was conducted to maintain a plant spacing of 6–7 cm (300,000 plants hm−2). At the jointing stage, a net was placed at 2.5 m above the ground to prevent access to birds; the net was removed at harvest. Because of the dry climate with low rainfall, the plots were irrigated with underground water before sowing and before the seedling stage in July to ensure seed emergence and seedling growth. Plots were not irrigated between July and late September when the harvest was conducted.

2.3. Sample Collection

When 80% of the plants were in flower (12 August 2018, and 14 August 2019), the aboveground biomass was collected in order to measure dry matter accumulation. Ten plants from each plot were manually cut close to the ground, taken to the laboratory, dried to a constant weight at 75 °C, heated to 105 °C for 20 min so as to deactivate all enzymes, and then weighed. At the flowering stage of growth seasons in 2018 and 2019, soil to a depth of 0–20 cm was collected, and alkali-hydrolyzed nitrogen (AN), available phosphorus (AP), and soil organic matter were measured. During the harvest stage of the 2019 growth season, soil to a depth of 0–20 cm was collected, and AN, AP, and soil organic matter were measured. Soil total nitrogen (TN) and phosphorus (TP) measured during the 2019 growing season. Soil samples from five points per plot, following an s-shaped distribution in the plot, were collected and mixed to give one combined sample for each plot. At the flowering stage, soil samples to depths of 0–20 cm and 21–40 cm were collected using a soil borer to measure soil water content. Fresh soil weight (FW) was weighed immediately after soil collection. After the samples were dried at 105 °C, the dry weight (DW) was obtained. The detection held four replications. The soil water content (SWC, %) was calculated as follows:
SWC = (FW − DW)/DW × 100
At harvest time (25 September 2018, and 30 September 2019), the mature vegetation from a 1-m2 quadrant in each plot was collected manually. Following collection, the spike numbers for each plot were counted then the spike number per hm2 was calculated. When natural withering was complete, total aboveground biomass was measured and then the plants were artificially threshed to measure the grain yield. Lastly, the harvest index (HI) was calculated according to the following formula [26]:
HI= (Grain yield)/(Total aboveground biomass) × 100
The thousand kernel weight was counted manually and then weighed.

2.4. Net Photosynthetic Rate

Net photosynthetic rate is considered to be one of the most important indexes for evaluating the capacity of crop yield formation [26]. In this study, the photosynthetic rate of two growth stages (jointing stage and anthesis stage) were measured. Photosynthetic traits were recorded during the 2018 and 2019 growing seasons. The photosynthetic traits of new fully expanded leaves at the jointing stage and flag leaves at anthesis were measured, in all plots, between 9:30 a.m. and 11:30 a.m. using a Li-6400 portable photosynthesis system (LI-COR Inc., Lincoln, NE, USA). The photosynthetic traits of new fully expanded leaves or flag leaves were calculated as the mean readings for five leaves (one leaf per plant) per plot. All measurements were performed on the middle portions of the leaf exposed to full sunlight, approximately half-way along the length of the leaf.

2.5. Soil Properties Measurements

Soil nutrient measurements were conducted according to methods described by Bao [27]. Soil organic matter was measured using the potassium dichromate oxidation heating method. Soil AN was detected using the alkali solution diffusion method. Soil AP was measured using the Olsen method (extraction agent: 0.05 mol/L NaHCO3). Soil TN was detected with Kjeldahl determination and TP was detected using the Mo-Sb anti-spectrophotography method. Soil pH was detected using a benchtop pH meter (SevenExcellence pH Meter Line, METTLER TOLEDO, Greifensee, Switzerland). According to experiment design, the detection was with four replications and every replication held two technological replications.

2.6. Data Analysis

The effects of the treatments (CK, C, SR, and SRC), years (2018 and 2019), fertilizer levels (NY and HY), and their interactions on the measured variables were evaluated using one- and three-way ANOVA. When F-values were significant, the least significant difference (LSD) test was used to compare means. Pearson correlation analyses were used to assess correlations between grain yield, soil indexes, and photosynthetic rate. All statistical analysis was performed through SPSS (SPSS Inc., Chicago, IL, USA) software. The figures were created using SigmaPlot 12.5 (Systat Software Inc., San Jose, CA, USA).

3. Results

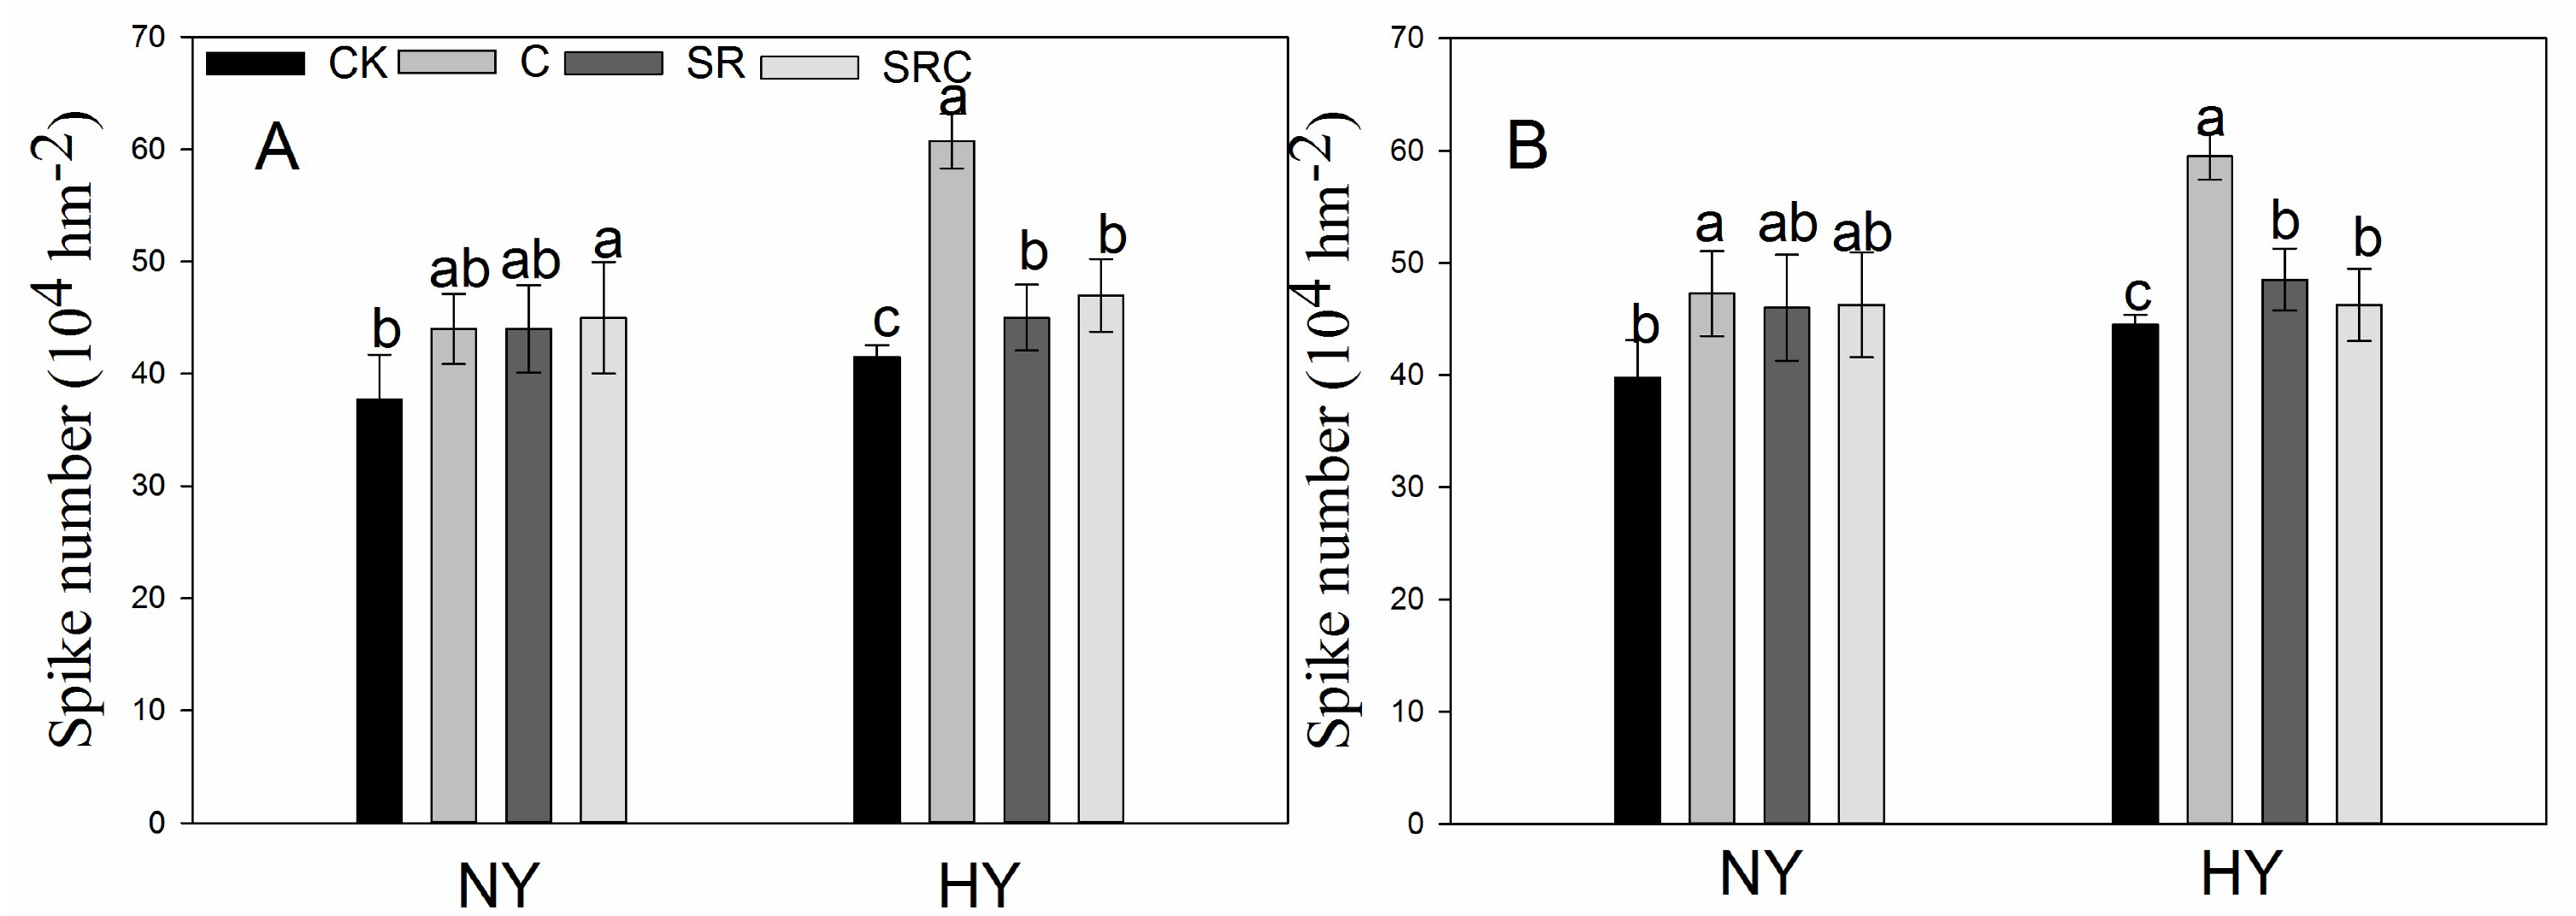
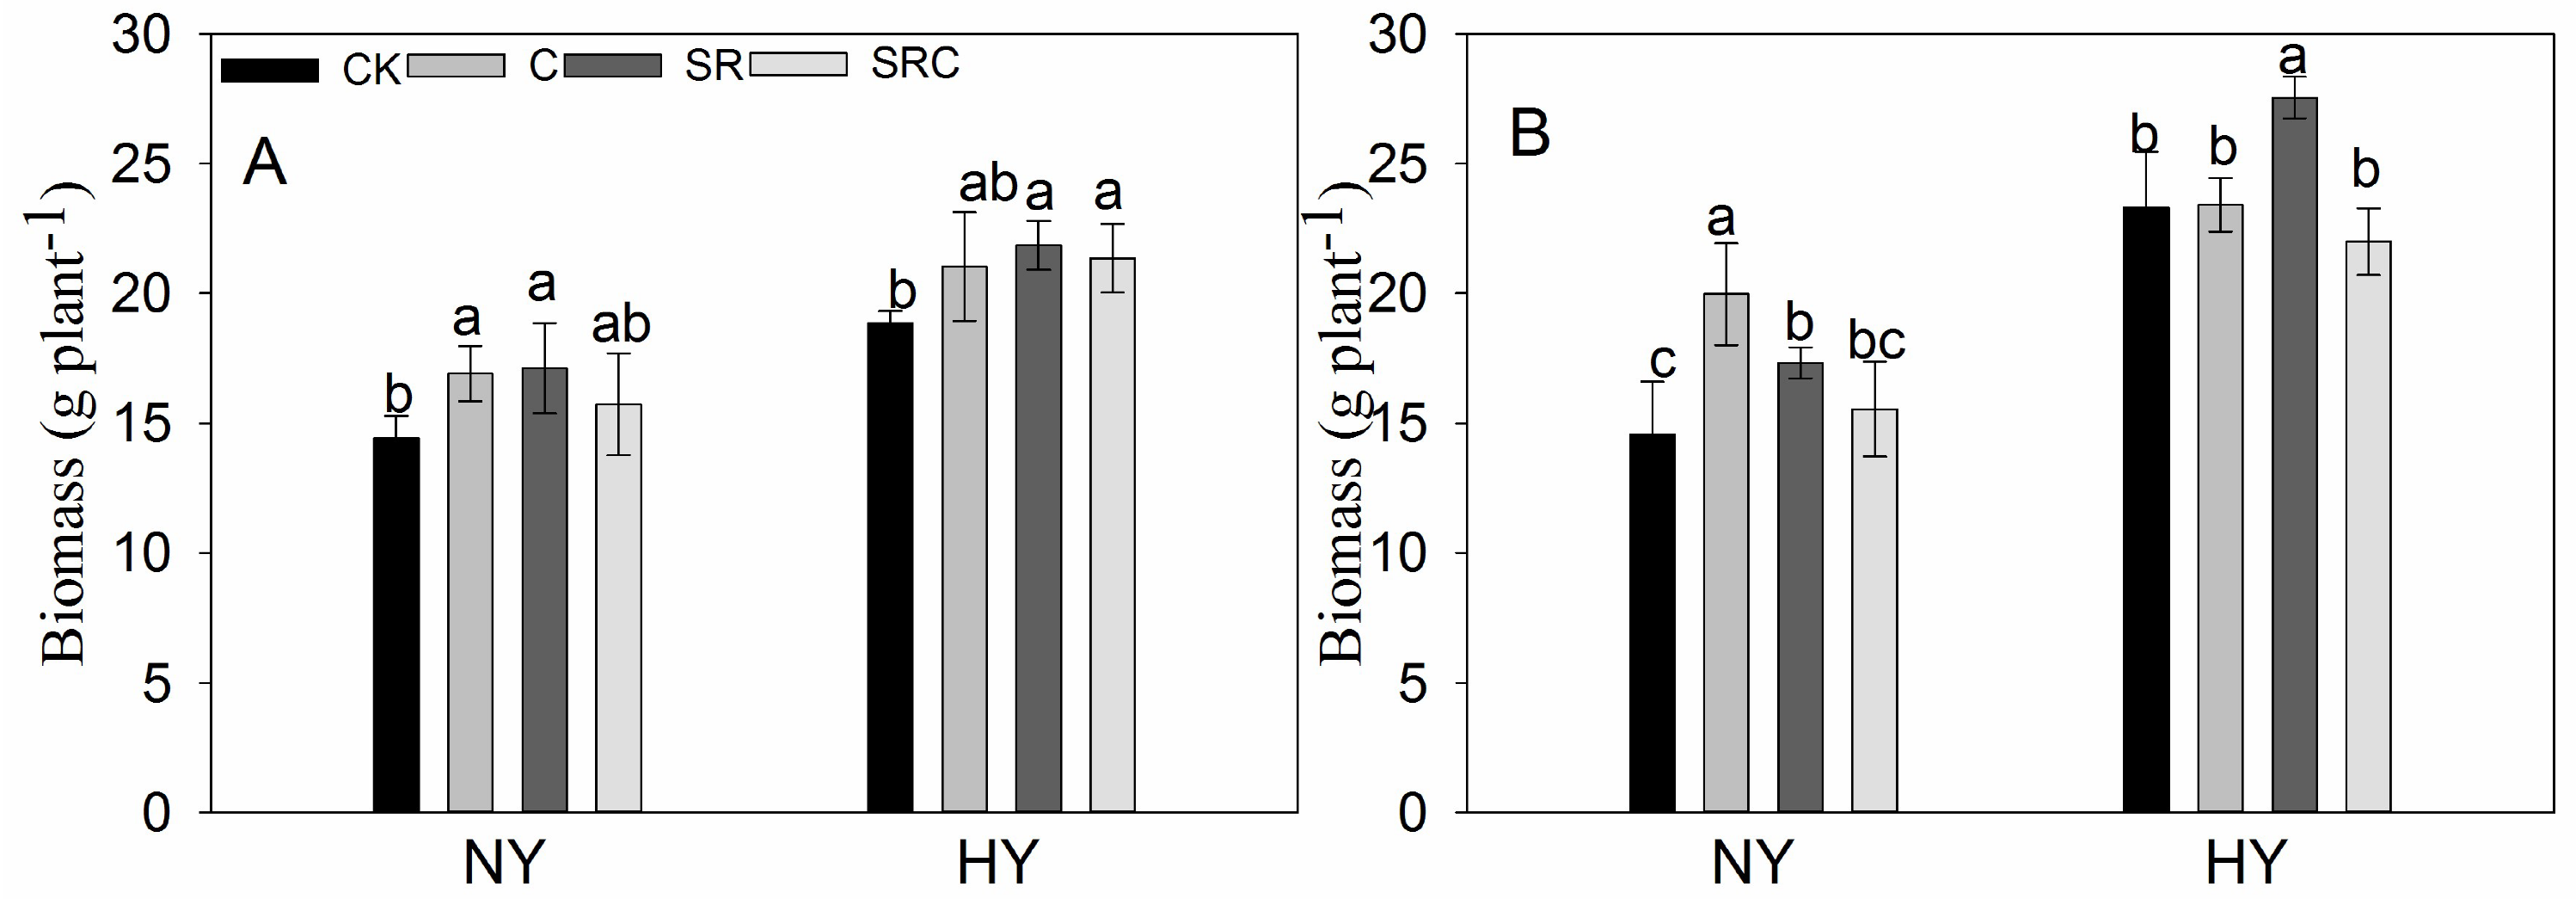
3.1. Grain Yield and Related Agronomic Traits

Grain yield was significantly affected by treatment, year, fertilizer, and the interactions (Table 3). In the 2018 growing season, the yield over all treatments ranged from 2109.0 kg hm−2 (CK + NY) to 5024.7 kg hm−2 (C + HY). Under the normal fertilizer treatments, the C treatment increased the yield significantly, while the SR and SRC treatments did not increase yield significantly. In the high yield treatment, the C and SR treatments increased yield significantly compared with CK, while there was no significant difference between the CK and SRC treatments. The increases in yield were 46% and 16.8%, respectively. In the 2019 growing season, the yield ranged from 2772.7 kg hm−2 (CK + NY) to 4898.7 kg hm−2 (C + HY). Compared with the 2018 season, the average yield increased by 18.6%. In 2019, C and SR treatments produced a higher yield than the CK treatment at the same fertilizer level. In 2019, the C treatment produced the highest yield of all treatments in the same fertilizer level.
Biomass was significantly affected by treatment, fertilizer but not year (Table 3). Therefore, the data were pooled over the two years. The C and SR treatments increased the biomass significantly under both fertilizer levels. There were no significant differences between the SRC and the CK treatments or between the SRC and C and SR treatments at the same fertilizer level.
HI was significantly affected by fertilizer, year, and interactions (Table 3). In the 2018 season, under both fertilizer levels, Treatment C had the highest HI (25.9% and 30.0%) of all the treatments. In 2018, the lowest HI (22.2% in NY and 26.2% in HY) was found in the SR and SRC treatment, respectively. In 2019, there was no significant difference between treatments under the normal fertilizer level. Under the high fertilizer level, the SRC had the highest HI (37.0%), while Treatment C had the lowest HI (30.5%). Overall, the HI in 2019 increased by 25.6% when compared with the HI in 2018.
One thousand kernel weight expresses the degree of fullness of the grain. In 2018, under the normal fertilizer level, the SR treatment produced the highest thousand kernel weight index (2.35 g), which is 14.1% higher than that of CK (Figure 2). Under the high fertilizer level, there was no significant difference in thousand kernel weight between treatments. In 2019, under the normal fertilizer level, the SR treatment had the highest thousand kernel weight (2.47 g), while the C treatment had the lowest thousand kernel weight (2.10 g). CK had the maximum thousand kernel weight under the high fertilizer level. Under the high fertilizer level, the application of soft rock and biochar singly increased spike number significantly compared with CK in both seasons (p < 0.05, Figure 3), and the increase ranged from 9.1% to 46.3%. Under the normal fertilizer level, the SRC treatment in 2018, and the C treatment in 2019 produced the most spikes. There was no significant difference among the C, SR, and SRC treatments under the normal fertilizer level.
To detect dynamic changes in millet growth, the biomass at anthesis was measured (Figure 4). In 2018, the SR treatment had the highest biomass accumulation under both fertilizer levels (17.1 g per plant under NY, and 21.8 g per plant under HY), while there was no significant difference among SR, C, and SRC treatments. In 2019, under the normal fertilizer level, the C treatment produced the highest biomass (19.7 g per plant), while under the high fertilizer level the SR treatment produced the highest biomass accumulation (27.6 g per plant).

3.2. Soil Properties

Because of the necessary irrigation of plots completed before July, it was not possible to measure natural soil moisture during irrigation. Therefore, we measured soil water content at anthesis on 12 August 2018 and 14 August 2019. The C treatment decreased the soil water content (at a depth of 0–20 cm) compared with the other three treatments under the normal fertilizer levels in 2018 but in high fertilizer level treatment C had the highest soil water content compared with the other treatments (Table 4). In 2019, these three treatments held higher water contents than that of CK at a depth of 0–20 cm. At the depth of 21–40 cm, the SR treatment had the highest water content, followed by the C, SRC, and CK treatments under the normal fertilizer level in 2018. At the 21–40 cm soil depth, all three treatments had considerably higher water contents (more than 200%) than that of CK.
To understand how soft rock and biochar help the soil retain nutrients, we measured soil nutrient content (Table 5, Figure S2). Results showed that, at the flowering stage under both fertilizer levels, SR increased the AN and AP content significantly compared with the CK treatment in both growth stages and increased TN and TP content, especially in normal fertilizer level treatment in the 2019 growing season. The C treatment did not allow the soil to maintain significantly more AP compared to the CK treatment in either season and fertilizer level, while C treatment increased TN and TP content significantly compared with CK treatment. The SRC treatment had not exhibited higher TP content than that of CK (p > 0.05). At the normal fertilizer level, SRC had the second-highest AN content after the SR in 2018 and the third-highest AN content after SR and CK in 2019. However, under the same fertilizer level, the soil AN and AP contents in 2019 did not greatly increase compared with the AN and AP contents in 2018. In the C and SR treatments, organic matter content, in 2018, and both fertilizer treatments, increased significantly compared with the CK treatment. The C and SR treatments both produced a high organic matter content and there was no significant difference between them. The other treatments, SRC and CK, though lower than C and SR, still had higher organic matter contents four times greater than the low content in both fertilizer levels. In 2019, organic matter content greatly increased. As in 2018, the C and SR treatments produced a higher organic matter content than the other treatments (SRC followed by CK) and there was no significant difference between the two treatments (under both fertilizer levels). At the harvest stage, the SR treatment increased soil P, N, and organic matter significantly compared with the CK treatment and there was no significant difference between the SR and C treatment under either fertilizer level. 3.3. Photosynthetic Response.
The net photosynthetic rate ranged from 23.06 to 33.62 µmol CO2 m−2 s−1 in 2018 at the jointing stage (Table 6). At this stage, the C and SR treatment caused a significant increase in the net photosynthetic rate compared with CK. At the flowering stage, the increase in the net photosynthetic rate in SR and C treatments was significant compared with CK. In 2019, at the jointing stage, CK held the highest photosynthetic rate among these four groups under high fertilizer level, while under normal fertilizer level, the SR and C treatments had a higher photosynthetic rate than CK. At the flowering stage, the photosynthetic rate of SR and C treatments was higher than that of CK.

3.3. Correlation Analysis

The correlation analysis showed that grain yield was significantly positively correlated with biomass at harvest (r2 = 0.89, p < 0.01), flowering (r2 = 0.74, p < 0.01), organic matter content at flowering (r2 = 0.71, p < 0.01), soil AN at flowering (r2 = 0.55, p < 0.05), soil TP at flowering (r2 = 0.84, p < 0.01), soil TP at harvest (r2 = 0.75, p < 0.05), soil TN at flowering (r2 = 0.72, p < 0.05), soil TN at harvest (r2 = 0.73, p < 0.05), spike number (r2 = 0.58, p < 0.05), and photosynthetic rate at flowering (r2 = 0.69, p < 0.01) (Table 7). Harvest biomass was significantly correlated with biomass at flowering (r2 = 0.63, p < 0.01), soil AN (r2 = 0.57, p < 0.05), spike number (r2 = 0.77, p < 0.01), and photosynthetic rate at flowering (r2 = 0.87, p < 0.01). There was no significant correlation between soil AP and the other agronomic traits, except soil AN (p < 0.05). The photosynthetic rate at flowering was significantly correlated with soil AN at flowering (r2 = 0.55, p < 0.05), soil TP at flowering (r2 = 0.79, p < 0.05), soil TP at harvest (r2 = 0.74, p < 0.05), soil TN at flowering (r2 = 0.72, p < 0.05), and spike number (r2 = 0.69, p < 0.01). The organic matter content was significantly correlated with yield and biomass (p < 0.05). The thousand kernel weight was not significantly correlated with any other index.

4. Discussion

Sandy soils, which are low nutrient content, poor water, and fertilizer retention, occupy a large proportion of global arable lands [13]. As we know, lots of approaches are used to improve sandy soil crop productivity, such as fertilization, returning straw to field, cultivation modes, and so on. Among those approaches, soil conditioners can improve soil properties, increase soil water and fertilizer retention capacity, and crop productivity [12,13,15]. In our two-year research study, it was demonstrated that the application of biochar and a local soft rock can increase the grain yield of millet significantly. The application of biochar in non-sandy agriculture fields of average fertility has been widely researched and is known to increase yields [28,29]. Our results confirmed that, in sandy soil, biochar can increase grain yield. In past research, it was found that biochar applications can increase the yield and water-use efficiency of Sorghum bicolor L. [30]. Based on our combined results, it could be concluded that biochar is also suitable for use in desert sandy soil management. In our study, the addition of soft rock increased yield significantly, which was consistent with previous results for wheat, potato, and maize [31]. In many test indexes, soft rock application achieved similar results to biochar application.

4.1. Soft Rock Increases the Soils Ability to Retain Nutrients from Fertilizers

Previous studies have proved that soil conditioners, such as polyacrylamide, biochar can effectively increase the water holding capacity, decreasing deep percolation, and reducing evaporation in sandy soils [21,32]. Soft rock applications increase grain yield by improving the soil water retention capacity in sandy soil [8,11]. Here, the application of soft rock could maintain a higher soil water content especially at depths of 21–40 cm after long periods without irrigation, while in the first year, biochar treatment had not increased soil water content compared with CK at depth of 0–20 cm. This is because the application of soft rock on sandy soil may decrease the infiltration rate and saturated hydraulic conductivity [12]. Usually, the sand soil holding high soil saturated hydraulic conductivity and bulk density was averse to hold water. According to a previous study, the application of soft rock could decrease these indexes [11]. Mixing soft rock and sandy soil decreased the soil saturated hydraulic conductivity and bulk density to increase water holding capacity. It was found that biochar application increased soil water content (0–20 cm) with aging, which was consistent with a previous study, in which authors found that biochar application decreased the soil water content in the first year [33]. This may be because the application of biochar increased the soil porosity and decreased the soil water holding capacity [33]. Lately, the improvement of organic matter induced by application of biochar increased soil water holding capacity, as previous research reported [34]. Therefore, it could be concluded that soft rock and biochar applications to sandy soil increase soil water, which could be beneficial to improving nutrient holding capacity.
In sandy soil, nutrient leaching is a major threat to agricultural production [35]. Soil organic matter and nutrient level are important indicators for evaluating soil quality, and they are also affected by the application of soil conditioners [36,37]. Sandy soil has greater permeability coefficients and low fertilizer retention and soft rock has more fine particles with hydrophilic and absorbent properties. In our result, the organic matter was increased with the application of soft rock (Table 5). Bacterium experiment showed that mixing soft rock and sand could increase the diversity, uniformity, and richness index of bacteria was significantly compared with control soil of only sand and increase accumulation of soil organic matter [38]. This indicated that the application of soft rock could affect the bacteria community to regulate the soil organic matter accumulation, and this could explain the increase of organic matter in our experiment. Biochar was found to increase soil fertilizer retention [21], while in our results the biochar had not exhibited a strong ability to hold AP and AN (Table 4). In fact, biochar application in sand soil was found to decrease soil bulk density and increase soil porosity [33]. The huge soil porosity could induce the fertilizer missing into deep soil under flooding irrigation and heavy rainfall conditions in our experiment. While the soft rock held strong capacity in absorbing water, this could be the main reason for mixing soft rock with sand which increased the soil AN and AP.

4.2. Soft Rock Increases Photosynthesis and Yield of Millet

Net photosynthetic rate is an important index used to evaluate crop yield production ability [26,39,40,41] and promoting the photosynthetic rate or yield are the most reliable indicators for evaluating the performance of soil conditioners. In the present study, soft rock and biochar application had increased flowering photosynthetic rate and yield significantly (Table 6), suggesting that soft rock has great potential as a useful soil conditioner in the sandy soil. We found that the flowering photosynthetic rate was significantly correlated with yield and this indicates that in millet the flowering photosynthesis is important for yield production in millet. Photosynthesis at jointing had little effect on grain yield accumulation compared to photosynthesis at flowering. These results are consistent with results obtained for wheat [41,42]. Much research on soil fertilizer management has focused on photosynthesis [43,44]. A higher nitrogen supply contributes to a higher photosynthesis rate in wheat [45]. We found that a higher photosynthesis rate (which was positively correlated with grain yield) was significantly related to soil nutrient content, especially the soil total phosphorus. In many previous studies, phosphorus was found to play an important role in maintaining high photosynthesis rates [46,47]. In fact, as soil amendments, potassium polyacrylate, polyacrylamide, and humic acid had been found to have a highly significant effect (p < 0.01) on potato photosynthesis characteristics [48] and biochar application increased the soil organic carbon to improve the leaf photosynthesis [49]. Taking all these together, it should be found that no matter higher fertilizers supply or soil amendments application could increase crop photosynthesis. However, in our study, the photosynthesis rate was not correlated with soil available phosphorus, while total phosphorus was significantly correlated with grain and photosynthesis rates. This may be because sandy soil has strong phosphorus adsorption rates, which may have decreased the effectiveness of the phosphorus fertilizer. Therefore, the application of biochar and soft rock may increase flowering photosynthesis through improving soil hydrolyzable nitrogen and total phosphorus to increase the grain yield.

5. Conclusions

Application of soft rock as a soil amendment in sandy land improved the capacity of soil holding water and fertilizer. This study suggested that the application of soft rock could increase the soil AP, AN TP, and TN, while the improvement in AP and AN from biochar treatment was not significant. Because of the improved fertilizer holding capacity, the application of soft rock increased the photosynthesis rate at flowering, which is an important factor in improving grain yield. This study showed the potential of soft rock as an amendment to improve soil properties and millet yield in the Mu Us Sandy land. Further research is needed to investigate how soft rock changes the soil properties to improve the nutrient holding and water holding ability of the soil.

Supplementary Materials

The following are available online at https://www.mdpi.com/2073-4395/10/5/669/s1, Figure S1: Schematic diagram of the field layout. NY, 90 kg N hm−2 and 45 kg P hm−2 and HY, 270 kg N hm−2, and 135 kg P hm−2. CK, sand only; C, sand and biochar; SR, sand and soft rock; SRC, sand, biochar, and soft rock. The blue line indicated the PVC pipe for irrigation, and slash indicated the buffer zone; Figure S2: Effects of biochar and soft rock treatments on soil total nitrogen (TN) and phosphorus (TP) at two fertilizer levels in 2019. CK, sand only; C, sand and biochar; SR, sand and soft rock; SRC, sand, biochar, and soft rock; NY, normal yield pattern; HY, high yield pattern.

Author Contributions

Experimental design, J.Y.; data collecting, N.Z. and Y.S.; writing—original draft preparation, Y.S.; writing—review and editing, J.Y.; project administration, J.Y.; funding acquisition, J.Y. and S.Z. All authors have read and agreed to the published version of the manuscript.

Funding

The study was sponsored by the National Natural Science Foundation of China (31960223), Key laboratory of Degraded and Unused Land Consolidation Engineering, the Ministry of Land and Resources (SXDJ2018-07 and SXDJ2018-08), the Young Talents recommendation by the Yulin Association for Science and Technology (20190126), a PhD Research Start-up Fund from Yulin University (17GK19 and 17GK18) and the Key Laboratory of Water and Soil Loss Process and Control in Loess Plateau, Water Resources Ministry (201804).

Acknowledgments

We gratefully acknowledge help from Shiqiang Liu from Northwest university and students from Yulin University for their assistance in data collecting.

Conflicts of Interest

The authors declare no conflicts of interest.

References

  1. Zhang, J.-Y.; Gu, P.F.; Li, L.Y.; Zong, L.Y.; Zhao, W.-J. Changes of soil particle size fraction along a chronosequence in sandy desertified land: A fundamental process for ecosystem succession and ecological restoration. J. Soils Sediments 2016, 16, 2651–2656. [Google Scholar] [CrossRef]
  2. Jiang, L.; Jiapaer, G.; Bao, A.; Kurban, A.; Guo, H.; Zheng, G.; De Maeyer, P. Monitoring the long-term desertification process and assessing the relative roles of its drivers in Central Asia. Ecol. Ind. 2019, 104, 195–208. [Google Scholar] [CrossRef]
  3. D’Odorico, P.; Bhattachan, A.; Davis, K.F.; Ravi, S.; Runyan, C.W. Global desertification: Drivers and feedbacks. Adv. Water Resour. 2013, 51, 326–344. [Google Scholar] [CrossRef]
  4. Scherr, S.J. Soil Degradation: A Threat to Developing-Country Food Security by 2020? International Food Policy Research Institute: Washington, DC, USA, 1999. [Google Scholar]
  5. Kosmas, C.; Danalatos, N.; Cammeraat, L.H.; Chabart, M.; Diamantopoulos, J.; Farand, R.; Gutierrez, L.; Jacob, A.; Marques, H.; Martinez-Fernandez, J.; et al. The effect of land use on runoff and soil erosion rates under Mediterranean conditions. Catena 1997, 29, 45–59. [Google Scholar] [CrossRef]
  6. Yang, D.; Kanae, S.; Oki, T.; Koike, T.; Musiake, K. Global potential soil erosion with reference to land use and climate changes. Hydrol. Process. 2003, 17, 2913–2928. [Google Scholar] [CrossRef]
  7. Yu, F.C.; Yu, F.H.; Dong, M. Scale-Dependent Spatial Heterogeneity of Vegetation in Mu Us Sandy Land, a Semi-Arid Area of China. Plant Ecol. 2002, 162, 135–142. [Google Scholar]
  8. Sun, Z.; Han, J. Effect of soft rock amendment on soil hydraulic parameters and crop performance in Mu Us Sandy Land, China. Field Crops Res. 2018, 222, 85–93. [Google Scholar] [CrossRef]
  9. Ni, H.; Zhang, L.; Zhang, D.; Wu, X.; Fu, X. Weathering of pisha-sandstones in the wind-water erosion crisscross region on the Loess Plateau. J. Mountain Sci. 2008, 5, 340–349. [Google Scholar] [CrossRef]
  10. Liang, Z.; Wu, Z.; Yao, W.; Noori, M.; Yang, C.; Xiao, P.; Leng, Y.; Deng, L. Pisha sandstone: Causes, processes and erosion options for its control and prospects. Int. Soil Water Conserv. Res. 2019, 7, 1–8. [Google Scholar] [CrossRef]
  11. Sun, Z.; Han, J.; Wang, H. Soft rock for improving crop yield in sandy soil in the Mu Us desert, China. Arid Land Res. Manag. 2019, 33, 136–154. [Google Scholar]
  12. Ma, W.; Zhang, X. Effect of Pisha sandstone on water infiltration of different soils on the Chinese Loess Plateau. J. Arid Land 2016, 8, 331–340. [Google Scholar] [CrossRef] [Green Version]
  13. Han, J.; Xie, J.; Zhang, Y. Potential role of feldspathic sandstone as a natural water retaining agent in Mu Us Sandy Land, Northwest China. Chin. Geograph. Sci. 2012, 22, 550–555. [Google Scholar] [CrossRef]
  14. Liu, X.J.; Zhang, Y.; Han, W.X.; Tang, A.H.; Shen, J.L.; Cui, Z.L.; Vitousek, P.; Erisman, J.W.; Goulding, K.; Christie, P.; et al. Enhanced nitrogen deposition over China. Nature 2013, 494, 459–462. [Google Scholar] [CrossRef] [PubMed]
  15. Sohi, S.P.; Krull, E.; Lopez-Capel, E.; Bol, R. Chapter 2—A Review of Biochar and Its Use and Function in Soil. In Advances in Agronomy; Academic Press: Cambridge, MA, USA, 2010; pp. 47–82. [Google Scholar]
  16. Qu, J.; Zheng, J.; Zheng, J.; Zhang, X.; Yu, X. Effects of wheat-straw-based Biochar on yield of rice and nitrogen use efficiency of late rice. J. Ecol. Rural Environ. 2012, 28, 288–293. [Google Scholar]
  17. Alburquerque, J.A.; Salazar, P.; Barrón, V.; Torrent, J.; Villar, R. Enhanced wheat yield by biochar addition under different mineral fertilization levels. Agron. Sustain. Dev. 2013, 33, 475–484. [Google Scholar] [CrossRef] [Green Version]
  18. Xu, C.Y.; Hosseini-Bai, S.; Hao, Y.; Rachaputi, R.C.N.; Wang, H.; Xu, Z.; Wallace, H. Effect of biochar amendment on yield and photosynthesis of peanut on two types of soils. Environ. Sci. Pollut. Res. 2015, 22, 6112–6125. [Google Scholar] [CrossRef]
  19. Sukartono Utomo, W.H.; Kusuma, Z.; Nugroho, W.H. Soil fertility status, nutrient uptake, and maize (Zea mays L.) yield following biochar and cattle manure application on sandy soils of Lombok, Indonesia. J. Trop. Agric. 2011, 49, 47–52. [Google Scholar]
  20. Graber, E.R.; Meller Harel, Y.; Kolton, M.; Cytryn, E.; Silber, A.; Rav David, D.; Tsechansky, L.; Borenshtein, M.; Elad, Y. Biochar impact on development and productivity of pepper and tomato grown in fertigated soilless media. Plant Soil 2010, 337, 481–496. [Google Scholar] [CrossRef]
  21. Laird, D.; Fleming, P.; Wang, B.; Horton, R.; Karlen, D. Biochar impact on nutrient leaching from a Midwestern agricultural soil. Geoderma 2010, 158, 436–442. [Google Scholar] [CrossRef] [Green Version]
  22. Wang, H.; Huang, Y.; Shen, C.; Wu, J.; Yan, A.; Zhang, H. Co-transport of Pesticide Acetamiprid and Silica Nanoparticles in Biochar-Amended Sand Porous Media. J. Environ. Qual. 2016, 45, 1749–1759. [Google Scholar] [CrossRef]
  23. Trifunovic, B.; Gonzales, H.B.; Ravi, S.; Sharratt, B.S.; Mohanty, S.K. Dynamic effects of biochar concentration and particle size on hydraulic properties of sand. Land Degrad. Dev. 2018, 29, 884–893. [Google Scholar] [CrossRef]
  24. Yu, O.-Y.; Raichle, B.; Sink, S. Impact of biochar on the water holding capacity of loamy sand soil. Int. J. Energy Environ. Eng. 2013, 4, 44. [Google Scholar] [CrossRef] [Green Version]
  25. Hao, X.F.; Wang, J.Z.; Wang, G.Q.; Wang, X.Y.; Wang, L.Y. Analysis on the High Yield, Stable Yield and Adaptability of New Millet Varity Changsheng 07. J. Hebei Agric. Sci. 2011, 15, 1–3. [Google Scholar]
  26. Yan, J. Selection of Yield-Related Traits for Wheat Breeding in Semi-Arid Region. Int. J. Agric. Biol. 2018, 20, 569–574. [Google Scholar] [CrossRef]
  27. Bao, S. Soil Agrochemical Analysis; China Agriculture Press: Beijing, China, 2010. [Google Scholar]
  28. Huang, M.; Fan, L.; Jiang, L.; Yang, S.; Zou, Y.; Uphoff, N. Continuous applications of biochar to rice: Effects on grain yield and yield attributes. J. Integr. Agric. 2019, 18, 563–570. [Google Scholar] [CrossRef]
  29. Peng, X.; Tong, X.; Hao, L.; Wu, F. Applicability of biochar for limiting interrill erosion and organic carbon export of sloping cropland in a semi-arid area of China. Agric. Ecosyst. Environ. 2019, 280, 68–76. [Google Scholar] [CrossRef]
  30. Laghari, M.; Mirjat, M.S.; Hu, Z.; Fazal, S.; Xiao, B.; Hu, M.; Chen, Z.; Guo, D. Effects of biochar application rate on sandy desert soil properties and sorghum growth. Catena 2015, 135, 313–320. [Google Scholar] [CrossRef]
  31. Han, J.C.; Liu, Y.S.; Luo, L.T. Research on the Core Technology of Remixing Soil by Soft Rock and Sand in the Maowusu Sand Land Region. China Land Sci. 2012, 26, 87–94. [Google Scholar]
  32. Lepore, B.J.; Thompson, A.M.; Petersen, A. Impact of polyacrylamide delivery method with lime or gypsum for soil and nutrient stabilization. J. Soil Water Conserv. 2009, 64, 223–231. [Google Scholar] [CrossRef]
  33. Ahmed, F.; Arthur, E.; Plauborg, F.; Razzaghi, F.; Kørup, K.; Andersen, M.N. Biochar amendment of fluvio-glacial temperate sandy subsoil: Effects on maize water uptake, growth and physiology. J. Agron. Crop Sci. 2018, 204, 123–136. [Google Scholar] [CrossRef]
  34. Saxton, K.E.; Rawls, W.J. Soil Water Characteristic Estimates by Texture and Organic Matter for Hydrologic Solutions. Soil Sci. Soc. Am. J. 2006, 70, 1569–1578. [Google Scholar] [CrossRef] [Green Version]
  35. She, X.; Zhang, X.; Wei, X. Improvement of water absorbing and holding capacities of sandy soil by appropriate amount of soft rock. Trans. Chin. Soc. Agric. Eng. 2014, 30, 115–123. (In Chinese) [Google Scholar]
  36. Kabirinejad, S.; Kalbasi, M.; Khoshgoftarmanesh, A.H.; Hoodaji, M.; Afyuni, M. Effect of incorporation of crops residue into soil on some chemical properties of soil and bioavailability of copper in soil. Int. J. Adv. Biol. Biomed. Res. 2014, 2, 2819–2824. [Google Scholar]
  37. Bouranis, D.L.; Vlyssides, A.G.; Drossopoulos, J.B.; Karvouni, G. Some characteristics of a new organic soil conditioner from the co-composting of olive oil processing wastewater and solid residue. Commun. Soil Sci. Plant Anal. 1995, 26, 2461–2472. [Google Scholar] [CrossRef]
  38. Zhen, G.; Han, J.; Li, J. Response of organic carbon mineralization and bacterial communities to soft rock additions in sandy soils. Peer J. 2020, 8, 8948. [Google Scholar]
  39. Sinclair, T.R.; Horie, T. Leaf Nitrogen, Photosynthesis, and Crop Radiation Use Efficiency: A Review. Crop Sci. 1989, 29, 90–98. [Google Scholar] [CrossRef]
  40. Richards, R.A. Selectable traits to increase crop photosynthesis and yield of grain crops. J. Exp. Bot. 2000, 51, 447–458. [Google Scholar] [CrossRef]
  41. Sun, Y.; Wang, X.; Wang, N.; Chen, Y.; Zhang, S. Changes in the yield and associated photosynthetic traits of dry-land winter wheat (Triticum aestivum L.) from the 1940s to the 2010s in Shaanxi Province of China. Field Crops Res. 2014, 167, 1–10. [Google Scholar] [CrossRef]
  42. Jiang, G.M.; Sun, J.Z.; Liu, H.Q.; Qu, C.M.; Wang, K.J.; Guo, R.J.; Bai, K.Z.; Gao, L.M.; Kuang, T.Y. Changes in the rate of photosynthesis accompanying the yield increase in wheat cultivars released in the past 50 years. J. Plant Res. 2003, 116, 347–354. [Google Scholar] [CrossRef]
  43. Sangakkara, U.R.; Frehner, M.; Nösberger, J. Effect of Soil Moisture and Potassium Fertilizer on Shoot Water Potential, Photosynthesis and Partitioning of Carbon in Mungbean and Cowpea. J. Agron. Crop Sci. 2000, 185, 201–207. [Google Scholar] [CrossRef]
  44. Saikia, P.; Bhattacharya, S.S.; Baruah, K.K. Organic substitution in fertilizer schedule: Impacts on soil health, photosynthetic efficiency, yield and assimilation in wheat grown in alluvial soil. Agric. Ecosyst. Environ. 2015, 203, 102–109. [Google Scholar] [CrossRef]
  45. Li, D.; Tian, M.; Cai, J.; Jiang, D.; Cao, W.; Dai, T. Effects of low nitrogen supply on relationships between photosynthesis and nitrogen status at different leaf position in wheat seedlings. Plant Growth Regul. 2013, 70, 257–263. [Google Scholar] [CrossRef]
  46. Borchardt, M. Effects of flowing water on nitrogen- and phosphorus-limited photosynthesis and optimum N:P ratios by Spirogyra fluviatilis (Charophyceae). J. Phycol. 2004, 30, 418–430. [Google Scholar] [CrossRef]
  47. Vengavasi, K.; Pandey, R. Root exudation potential in contrasting soybean genotypes in response to low soil phosphorus availability is determined by photo-biochemical processes. Plant Physiol. Biochem. 2018, 124, 1–9. [Google Scholar] [CrossRef]
  48. Xu, S.; Zhang, L.; Mclaughlin, N.B.; Mi, J.; Chen, Q.; Liu, J. Effect of synthetic and natural water-absorbing soil amendments on photosynthesis characteristics and tuber nutritional quality of potato in a semi-arid region. J. Sci. Food Agric. 2016, 96, 1010–1017. [Google Scholar] [CrossRef]
  49. Sarma, B.; Borkotoki, B.; Narzari, R.; Kataki, R.; Gogoi, N. Organic amendments: Effect on carbon mineralization and crop productivity in acidic soil. J. Cleaner Prod. 2017, 152, 157–166. [Google Scholar] [CrossRef]
Figure 1. Monthly and long-term averages of precipitation and temperature at the experimental site.
Agronomy 10 00669 g001
Figure 2. Effects of biochar and soft rock treatments on the thousand kernel weight of millet grown in two fertilizer levels conducted in 2018 (A) and 2019 (B). CK, sand only; C, sand and biochar; SR, sand and soft rock; SRC, sand, biochar, and soft rock; NY, normal yield pattern; HY, high yield pattern. Data were shown in mean ± SE. Different letters indicate significant differences (p < 0.05).
Agronomy 10 00669 g002
Figure 3. Effect of biochar and soft rock treatments on the spike number in two fertilizer levels conducted in 2018 (A) and 2019 (B). CK, sand only; C, sand and biochar; SR, sand and soft rock; SRC, sand, biochar, and soft rock; NY, normal yield pattern; HY, high yield pattern. Data were shown in mean ± SE. Different letters indicate significant differences (p < 0.05).
Agronomy 10 00669 g003
Figure 4. Effects of biochar and soft rock treatments on millet biomass at flowering under two fertilizer levels conducted in 2018 (A) and 2019 (B). CK, sand only; C, sand and biochar; SR, sand and soft rock; SRC, sand, biochar, and soft rock; NY, normal yield pattern; HY, high yield pattern. Data were shown in mean ± SE. Different letters indicate significant differences (p < 0.05).
Agronomy 10 00669 g004
Table 1. The experiment design in this study.
NY
90 kg N hm−2 and 45 kg P hm−2
HY
270 kg N hm−2 and 135 kg P hm−2
CK----
C4500 kg biochar hm−24500 kg biochar hm−2
SRsand: soft rocks = 3:1
at 0–20 cm
sand: soft rocks = 3:1
at 0–20 cm
SRC4500 kg biochar hm−2 and sand: soft rocks = 3:1 at 0–20 cm4500 kg biochar hm−2 and sand: soft rocks = 3:1 at 0–20 cm
Note: CK, sand only; C, sand and biochar; SR, sand and soft rock; SRC, sand, biochar, and soft rock; NY, normal yield pattern; HY, high yield pattern.
Table 2. Primary physical properties of sand soil, biochar, and soft rock in the study site.
MaterialTextureSand (%)Silt (%)Clay (%)BD (Mg m−3)TNTPpHOrganic Matter (%)
Aeolian sandy soilSand94.64.31.11.570.080.247.40.153
Soft rock18.932.1491.330.020.718.10.165
Biochar8.11.5810.570.512
Note: Percentage of clay (<0.002 mm), silt (0.002–0.05 mm), and sand (0.05–2 mm) particles, measured by pipette method; BD, bulk density, measured by undistributed soil core method. Total N, determined using the Kjeldahl method, soil pH was measured with a soil–water ratio of 1:2.5 using an ion pH meter.
Table 3. Effects of biochar and soft rock application treatments on grain yield and related agronomic traits of millet under two fertilizer levels.
YearNYHY
CKCSRSR+CCKCSRSR+C
Grain Yield (kg/hm2)20182109.0 ± 76.9b2882.0 ± 199.5a2220.3 ± 122.5b2140.3 ± 202.3b3439.7 ± 237.7c5024.7 ± 240.8a4018.3 ± 76.8b3349.8 ± 170.7c
20192722.7 ± 57.6c3914.0 ± 137.8a3226.3 ± 93.1b3555.7 ± 287.5ab3168.5 ± 78.5c4898.75 ± 87.1a4452.0 ± 333.3ab4092.3 ± 281.4b
Biomass (kg/hm2)20188664.3 ± 250.0b11,125.0 ± 620.2a10,076.8 ± 882.3ab9344.5 ± 757.4ab11,519.5 ± 410.9c16,757.3 ± 982.1a14,258.3 ± 601.7ab12,772.3 ± 594.0b
20198454.5 ± 341.2c11,987.5 ± 740.4a9969.7 ± 75.1b11,541.5 ± 1280.6ab9181.8 ± 185.6c16,042.0 ± 390.8a13,717.3 ± 626.5b11,294.5 ± 1387.1bc
HI (%)201824.3 ± 0.2a25.9 ± 0.8a22.2 ± 0.8b22.8 ± 0.3b29.8 ± 1.1ab30.0 ± 0.3a28.3 ± 1.1bc26.2 ± 0.1c
201932.3 ± 0.27a32.8 ± 1.2a31.6 ± 2.3a31.4 ± 2.5a34.5 ± 0.3b30.5 ± 0.4b32.3 ± 1.0b37.0 ± 2.1a
Probability level of ANOVA
Grain yieldBiomassHI
Y ***ns***
F *********
T ******ns
Y × F ******
Y × T **ns**
F × T ***ns
Y × F × T nsns*
Note: CK, sand only; C, sand and biochar; SR, sand and soft rock; SRC, sand, biochar, and soft rock; NY, normal yield pattern; HY, high yield pattern. Y, year; F, fertilizer level (NY and HY); T, treatments. ***, ** and * indicated the significance in 0.001, 0.01 and 0.05 level, respectively. NS showed there was no significance. Different letters show significant differences (p < 0.05) in the same year and fertilizer level.
Table 4. Effects of biochar and soft rock treatments on soil water content under two fertilizer levels.
Soil Depth (cm)20182019
NY (%)HY (%)NY (%)HY (%)
CK0–2011.73 ± 0.058.67 ± 0.529.10 ± 0.647.69 ± 1.13
21–406.47 ± 0.114.84 ± 0.137.93 ± 0.655.80 ± 0.68
C0–209.12 ± 0.079.71 ± 0.9211.02 ± 0.729.56 ± 0.31
21–4013.5 ± 0.5213.12 ± 0.1814.36 ± 1.0613.31 ± 0.31
SR0–2011.2 ± 0.169.65 ± 1.1211.36 ± 0.7010.76 ± 1.51
21–4014.5 ± 0.259.06 ± 0.1913.07 ± 0.6710.94 ± 0.67
SRC0–2011.0 ± 0.369.65 ± 0.1411.23 ± 0.6910.01 ± 0.29
21–4012.3 ± 0.1912.54 ± 0.1313.63 ± 1.6412.24 ± 0.18
Note: CK, sand only; C, sand and biochar; SR, sand and soft rock; SRC, sand, biochar, and soft rock; NY, normal yield pattern; HY, high yield pattern. Data were shown in mean ± SE.
Table 5. Effects of biochar and soft rock treatments on soil properties at two fertilizer levels.
20182019
AP (mg/kg)AN (mg/kg)Organic Matter (%)AP (mg/kg)AN (mg/kg)Organic Matter (%)
Flowering NYCK0.038 ± 0.005c7.000 ± 0.001c0.069 ± 0.000c0.040 ± 0.001c8.050 ± 0.350b0.274 ± 0.010c
C0.039 ± 0.001c6.998 ± 0.001c0.241 ± 0.035a0.039 ± 0.001c7.350 ± 0.350b0.389 ± 0.058a
SR0.131 ± 0.016a14.00 ± 7.00Ea0.251 ± 0.068a0.134 ± 0.101a13.650 ± 1.050a0.342 ± 0.035ab
SRC0.074 ± 0.003b8.401 ± 0.002b0.155 ± 0.017b0.073 ± 0.001b7.450 ± 0.349b0.309 ± 2.50Eb
HYCK0.065 ± 0.005c10.50 ± 0.001c0.171 ± 0.034c0.068 ± 0.001c10.50 ± 5.25Ec0.301 ± 0.011c
C0.063 ± 0.008c14.00 ± 0.002b0.286 ± 0.017a0.052 ± 0.001d14.50 ± 0.002b0.412 ± 0.012a
SR0.150 ± 0.035b17.50 ± 0.002a0.271 ± 1.07Ea0.158 ± 0.101b18.50 ± 0.348a0.359 ± 6.00Eb
SRC0.418 ± 0.221a14.00 ± 0.003b0.221 ± 0.034b0.446 ± 0.041a15.50 ± 0.348b0.368 ± 2.50Eb
HarvestNYCK///0.019 ± 0.009a6.710 ± 0.642b0.317 ± 0.014c
C///0.025 ± 0.009b7.173 ± 0.107b0.351 ± 0.014b
SR///0.075 ± 0.019a10.896 ± 0.849a0.385 ± 0.014ab
SRC///0.064 ± 0.019a10.111 ± 0.354a0.400 ± 0.034a
HYCK///0.094 ± 0.019c12.330 ± 1.190b0.381 ± 0.014b
C///0.102 ± 0.009bc12.936 ± 0.383b0.403 ± 0.014ab
SR///0.149 ± 0.009a16.415 ± 0.428a0.400 ± 0.014ab
SRC///0.119 ± 0.039ab14.155 ± 0.678b0.420 ± 0.024a
Note: CK, sand only; C, sand and biochar; SR, sand and soft rock; SRC, sand, biochar, and soft rock; NY, normal yield pattern; HY, high yield pattern. Data were shown in mean ± SE. Different letters show significant differences (p < 0.05) in the same year and fertilizer level.
Table 6. Effects of biochar and soft rock treatments on the photosynthetic rate in two fertilizer levels.
20182019
Jointing Stage
(µmol CO2 m−2 s−1)
Flowering Stage
(µmol CO2 m−2 s−1)
Jointing Stage
(µmol CO2 m−2 s−1)
Flowering Stage
(µmol CO2 m−2 s−1)
NYCK24.58 ± 0.7712.14 ± 0.2720.90 ± 0.4613.9 ± 0.26
C27.74 ± 1.1616.55 ± 0.9221.70 ± 0.2816.12 ± 0.80
SR25.74 ± 1.3416.94 ± 0.4021.14 ± 0.8616.58 ± 0.64
SRC28.01 ± 0.4014.25 ± 0.1022.62 ± 0.5317.83 ± 0.50
HYCK23.94 ± 1.7916.76 ± 0.2423.18 ± 0.7115.41 ± 0.31
C33.62 ± 1.2226.19 ± 0.5619.43 ± 1.1221.62 ± 1.05
SR27.58 ± 1.3220.86 ± 0.7522.43 ± 1.0518.78 ± 0.64
SRC23.06 ± 1.7223.27 ± 0.6322.95 ± 0.4816.76 ± 0.20
Note: CK, sand only; C, sand and biochar; SR, sand and soft rock; SRC, sand, biochar, and soft rock; NY, normal yield pattern; HY, high yield pattern.
Table 7. Correlations between grain yield, biomass, soil properties, and photosynthesis.
GYBHBFTKWAPFAPHOMFOMHANFANHTPFTPHTNFTNHSNPnJPnFSWC20SWC40
GY 0.89 **0.74 **−0.06 0.16 0.60 0.71 **0.62 0.55 *0.60 0.84 **0.75 *0.72 *0.73 *0.58 *0.01 0.69 **−0.23 0.17
BH 0.63 **−0.25 0.11 0.49 0.41 0.53 0.57 *0.49 0.76 *0.66 0.66 0.69 0.77 **0.27 0.87 **−0.13 0.26
BF 0.10 0.35 0.815 *0.55 *0.53 0.74 **0.82 *0.75 *0.71 *0.69 0.82 *0.51 *−0.10 0.48 −0.33 −0.02
TKW 0.14 0.23 0.16 0.01 0.24 0.23 −0.18 −0.08 −0.05 −0.25 −0.03 0.01 −0.16 −0.30 0.07
APF 0.54 0.14 0.59 0.53 *0.54 0.41 0.47 0.47 0.10 0.23 −0.13 0.26 0.00 0.17
APH 0.34 0.82 *0.90 **1.00 **0.75 *0.85 **0.84 **0.69 0.58 0.27 0.57 −0.04 −0.03
OMF 0.47 0.28 0.34 0.81 *0.64 0.66 0.68 0.34 −0.44 0.16 −0.15 0.30
OMH 0.63 0.82 *0.78 *0.94 **0.83 **0.67 0.72 *0.27 0.67 0.20 0.35
ANF 0.89 **0.72 *0.68 0.84 **0.59 0.66 **0.04 0.55 *−0.05 0.03
ANH 0.75 *0.84 **0.84 **0.69 0.58 0.27 0.58 −0.04 −0.03
TPF 0.91 **0.81 *0.77 *0.78 *−0.18 0.79 *0.01 0.33
TPH 0.87 **0.83 *0.78 *0.15 0.74 *0.10 0.32
TNF 0.82 *0.87 **0.05 0.72 *0.43 0.47
TNH 0.79 *0.10 0.69 0.20 0.32
SN 0.25 0.69 **0.19 0.55 *
PnJ 0.38 −0.04 0.03
PnF −0.10 0.22
SWC20 0.47
SWC40
Note: ** p < 0.01, * p < 0.05. Grain Yield, GY; Biomass at harvest, BH; Biomass at flowering, BF; Thousand kernel weight, TKW; Soil available phosphorus at flowering, APF; Soil available phosphorus at harvest, APH; Soil organic matter at flowering, OMF; Soil organic matter at harvest, OMH; Soil available nitrogen at flowering, ANF; Soil available nitrogen at harvest, ANH; Soil total phosphorus at flowering, TPF; Soil total phosphorus at harvest, TPH; Soil total nitrogen at flowering, TNF; Soil total nitrogen at harvest, TNH; Spike number, SN; Net photosynthesis at jointing, PnJ; Net photosynthesis at flowering, PnF; Soil water content (0–20), SWC20; Soil water content (20–40), SWC40.

