Article

Forecasting Yield and Lignocellulosic Composition of Energy Cane Using Unmanned Aerial Systems

1
Department of Biological and Agricultural Engineering, Texas A&M University, College Station, TX 77843, USA
2
Department of Soil and Crop Sciences, College Station, TX 77843, USA
3
Texas A&M AgriLife Research, Weslaco, TX 78596, USA
*
Author to whom correspondence should be addressed.
Agronomy 2020, 10(5), 718; https://doi.org/10.3390/agronomy10050718
Submission received: 24 April 2020 / Revised: 12 May 2020 / Accepted: 15 May 2020 / Published: 17 May 2020
(This article belongs to the Special Issue Phenotyping for Resilient and Sustainable Crops)

Abstract

:
Crop monitoring and appropriate agricultural management practices of elite germplasm will enhance bioenergy’s efficiency. Unmanned aerial systems (UAS) may be a useful tool for this purpose. The objective of this study was to assess the use of UAS with true color and multispectral imagery to predict the yield and total cellulosic content (TCC) of newly created energy cane germplasm. A trial was established in the growing season of 2016 at the Texas A&M AgriLife Research Center in Weslaco, Texas, where 15 energy cane elite lines and three checks were grown on experimental plots, arranged in a complete block design and replicated four times. Four flights were executed at different growth stages in 2018, at the first ratoon crop, using two multi-rotor UAS: the DJI Phantom 4 Pro equipped with RGB camera and the DJI Matrice 100, equipped with multispectral sensor (SlantRange 3p). Canopy cover, canopy height, NDVI (Normalized Difference Vegetation Index), and ExG (Excess Green Index) were extracted from the images and used to perform a stepwise regression to obtain the yield and TCC models. The results showed a good agreement between the predicted and the measured yields (R2 = 0.88); however, a low coefficient of determination was found between the predicted and the observed TCC (R2 = 0.30). This study demonstrated the potential application of UAS to estimate energy cane yield with high accuracy, enabling plant breeders to phenotype larger populations and make selections with higher confidence.

1. Introduction

When producing biofuels from dedicated bioenergy crops, maintaining high yields in low input conditions is a priority if global environmental change and increase in world population are considered [1]. Benefits from bioenergy crops can be expanded by deploying varieties adapted for growth on marginal or degraded lands. Promoting high yielding bioenergy crops with positive attributes for water use and soil impact will also expand bioenergy benefits, not to mention the production of bioenergy in land that makes a small contribution to food production.
Perennial C4 plant species such as energy sorghums (Sorghum bicolor), sugarcanes, and energy canes (Saccharum spp.) are promising feedstock species for the South Central and Southern U.S. regions, where favorable weather conditions would allow maximum biomass production rates. The combination of high productivity (~20 dry tons per acre), resulting from the C4 photosynthesis, with high light, water, and nitrogen use efficiency, drought tolerance, and wide adaptation, make them well suited for marginal lands [2]. Because these species are perennial, they can also be ratooned (harvested and allowed to re-sprout from the roots or rhizomes, in the case of Saccharum spp.) for several years before replanting is necessary [3]. These species provide other environmental benefits compared to traditional row crops, including extensive root systems, which can increase nutrient capture, improve soil quality, sequester carbon, reduce erosion, and increase growth rate.
Of these energy crops, sugarcane is extremely high yielding, producing large quantities of biomass. Nonetheless, minimal efforts have been employed to develop varieties under low-input management specifically. The plant has tremendous yield potential but is restricted to subtropical and tropical regions. However, because modern sugarcane varieties have been derived from a hybridization process involving S. officinarum and the wild cane S. spontaneum [4], which has drought and cold resistance [5], the creation of energy cane adapted to low input conditions is possible.
Sugarcane genetic breeding is a long process that takes between 10 and 12 years involving hybridization crosses and field selection of new genotypes [6]. Since the crop is highly polyploid and open-pollinated, the hybridization step generates hundreds of thousands of different genotypes to be selected. Because the species is clonally propagated, the biggest challenge for breeders is to identify, among those genotypes, the very few individuals that will produce higher yields consistently over the years and across different environments, a process that may generate an enormous amount of phenotypic data to be analyzed.
In the past, sugarcane breeding programs were looking for higher productivity of sugar, but now some breeding programs are also focused on high yield of fiber [7]. Different from conventional sugarcane (Saccharum spp.), energy cane is selected more for fiber than sucrose composition [8]. Therefore, as energy cane breeding programs work to develop a high-yield, low-input production system, two important goals for novel germplasm are maximizing productivity and optimizing composition.
Plants have developed different responses to abiotic stresses, resulting in different traits for avoidance or tolerance [9]. The incorporation of such traits in plant breeding may be facilitated through phenotyping protocols [10]. High-throughput phenotyping is particularly important in studies of tolerance to abiotic stresses, such as drought. The highly complex responses of plants to drought require the dissection of such responses into a series of component traits, which can be measured most efficiently and accurately with non-destructive image technologies [11]. The use of one of these technologies, red, green, blue (RGB) digital cameras has allowed estimating green biomass via specifically developed indices [12].
Crop yield is commonly estimated with manual surveys or by establishing the relationship between agronomic factors or climatic factors and crop yield based on statistical analysis methods [13]. However, several observations and sampling of experimental plots are required to determine the parameters of a yield prediction model [14]. New approaches have been used for crop yield prediction. You et al. (2017) [15] forecasted soybean yield in the United States at county-level with deep learning models such as convolutional neural networks (CNN) and long-short term memory (LSTM) networks. Their models performed better than traditional remote sensing methods with a 30% reduction of root mean square error (RMSE). Similarly, Khaki et al. (2020) [16] proposed a model to predict corn and soybean yield across the Corn Belt in the United States using convolutional neural networks (CNNs) and recurrent neural networks (RNNs) based on environmental data and management practices. The model outperformed other methods tested, achieving a RMSE between 9% and 8% of their corresponding average yields. Some disadvantages of these methods are the lack of specific regression relationships, and the labor-intensive calculation process, which substantially restrict their efficiency and implementation.
Unmanned aerial systems equipped with various sensors are being used for non-destructive high-throughput phenotyping [14]. Digital and multispectral cameras are frequently used sensors. Some of the applications of these sensors for field-based phenotyping include biomass estimation, canopy surface modeling, and crop height estimation [17,18,19]. Therefore, unmanned aerial systems have been used to predict yield with plant physiological parameters and vegetation indices [14]. Sanches et al. (2017) [20] predicted sugarcane yield in Brazil using the LAI (Leaf Area Index) and GRVI (Green-Red Vegetation Index). Their results showed that GRVI estimated yield (R2 = 0.69) with higher accuracy than LAI (R2 = 0.34), but when both indices were combined, the yield was estimated with greater precision (R2 = 0.79). However, the authors suggested for future studies the incorporation of plant height and additional indices to improve the results. Chea et al. (2020) [21] developed prediction models for Brix, Pol, fiber, and CCS (Commercial Cane Sugar) value using six vegetation indices (GNDVI, NDVI, RVI, CIgreen, CIrededge, and SRPIb). Their findings indicate that CIrededge is correlated with pol (R2 = 0.77) and CCS (R2 = 0.68), independent of variety, whereas brix models depend on the variety and need different vegetation indices. A weak correlation (R2 = 0.35–0.50) was found between fiber content with the six vegetation indices.
Even though the use of UAS to predict yield and composition of sugarcane has been evaluated, information is missing about the utilization of this technology for energy cane. Additionally, most studies have been focused on the commercial or industrial benefits that UAS can provide. However, this research proposes to use UAS as a tool that facilitates the acquisition of phenotypic information. For this reason, the objective of this study is to assess the use of UAS with true color and multispectral imagery to predict the yield and total cellulosic content (TCC) of newly created energy cane germplasm.

2. Materials and Methods

2.1. Study Site

The study was conducted on an experimental farm at the Texas A&M AgriLife Research and Extension Center in Weslaco, Texas (26°9′41.96″ N, 97°56′30.72″ W, 21 m AMSL). This region has a humid subtropical climate (Cfa) with an average annual rainfall of 632 mm. A trial was established in the growing season of 2016 in an area of 0.93 ha, where 15 energy cane elite lines and three checks were planted on 9.1 × 3.0 m plots with rows oriented in a north-south direction on a Raymondville clay loam soil. The experimental plots were arranged in a completely randomized block design, replicated four times (Figure 1).

2.2. Imagery Acquisition and Processing

Two multi-rotor UAS were used to acquire the data, a DJI Phantom 4 Pro and a DJI Matrice 100 (SZ DJI Technology Co., Ltd., Shenzen, China) (Table 1). The Phantom was equipped with an RGB sensor with a resolution of 20 megapixels, and 1” CMOS (Complementary Metal Oxide Semiconductor) detector. The Matrice was equipped with a SlantRange 3p multispectral sensor (SlantRange Inc., San Diego, CA, USA) and an ambient illumination sensor that can be used to help calibrate images when sunlight conditions are changing at the time of data collection. The SlantRange 3p sensor has a spatial resolution of 4.8 cm/pixel at 120 m above ground level (AGL).
Images were acquired on July 17, September 18, November 14, and December 19 of 2018, corresponding to 273, 210, 153, and 118 days before harvesting, respectively. The RGB images were collected at 20 m AGL and 80% overlap and sidelap, whereas the multispectral images were collected at 30 m AGL and 70% overlap and sidelap. Flights were conducted between 10:00 AM and 12:00 PM with wind speed less than 8 km/h to avoid image distortion. For georeferencing purposes, eight ground control points (GCPs) were placed uniformly in the study area. The GCPs were surveyed twice with a differential dual frequency, post processed kinematic (PPK) GPS system, collecting data at 20 Hz (V-map Air model, Micro Aerial Projects L.L.C., Gainesville, FL, USA).
SlantView (SlantRange Inc., San Diego, CA, USA) software was used to export radiometrically calibrated multispectral images for further analysis. Both RGB and multispectral images were processed in Agisoft Metashape Professional software (Agisoft LLC, St. Petersburg, Russia) to generate the orthomosaics and digital surface models (DSMs).

2.3. Feature Extraction

2.3.1. Canopy Height

Point cloud datasets were imported into Quick Terrain Modeler (Applied Imagery, Chevy Chase, MD, USA) software to generate the canopy height models (CHMs). The ground surface was estimated with the AGL Analyst tool, and a 10 m grid sampling distance was selected. The digital terrain model (DTM) created was subtracted from the digital surface model (DSM) to obtain the CHMs. Additionally, the generated CHMs were processed in ENVI (Harris Geospatial Solutions Inc., Broomfield, CO, USA) to set the negative values to zero. CHMs were imported into ArcGIS 10.6.1 (ESRI, Redlands, CA, USA) in which average canopy height (CH) per plot was extracted.

2.3.2. Canopy Cover

RGB orthomosaic images were converted into binary images with the canopeo algorithm [22] in QGIS (Open Source Geospatial Foundation Project), where zero designates non-green canopy pixels, and one denotes green canopy pixels. The zonal statistics tool was used to compute the total number of pixels and the sum of green canopy pixels within each plot. Then, percentage canopy cover (CC) was calculated as the ratio of green canopy pixels to the total number of pixels using Equation (1).
C C = ( c a n o p y   p i x e l s p i x e l s ) × 100

2.3.3. Normalized Difference Vegetation Index (NDVI)

The Normalized Difference Vegetation Index (NDVI) was calculated in ArcGIS 10.6.1 based on the multispectral orthomosaic images. In the raster calculator, the near infrared (NIR) and red bands were selected to generate the index (Equation (2) [23]). Then, average NDVI values per plot were extracted using the zonal statistics as a table tool. This index is reported to be well correlated with biomass and has been used to describe crop phenology in tomatoes [24,25].
N D V I = ( N I R R e d ) ( N I R + R e d )

2.3.4. Excess Green Index (ExG)

To calculate the Excess Green Index (ExG), the RGB orthomosaic images were imported into ArcGIS 10.6.1. The raster calculator tool was used to create the ExG expression by selecting the green, red, and blue bands (Equation (3) [26]). Average ExG values per plot were extracted with the zonal statistics as a table tool.
E x G = 2 g r b
where g, r, and b are the normalized spectral components, according to:
r = R R + G + B ,   g = G R + G + B   ,   b = B R + G + B
R, G and B denote the values of the red, green, and blue bands, respectively.

2.4. Cell Wall Composition Analysis

Before harvesting, one sample of 10 stalks per variety was collected per replicate for composition analyses. In the laboratory, the chemical composition of the energy cane bagasse was determined (cellulose, hemicellulose, and lignin) with near infrared spectroscopy [27].

2.5. Harvest Data

At the end of the season the trial was harvested with a Cameco sugarcane harvester on April 16, 2019, and the plot weights were measured with a small capacity weigh wagon (3-Ton Weigh Wagon, CAMECO) instrumented with three load cells [28]. Then, the yield was calculated in megagrams per hectare (Mg ha−1).

2.6. Data Analysis

The data were analyzed in JMP 14 software (SAS Institute Inc., Cary, NC, USA) to identify outliers with the quantile range outlier’s method. A tail quantile value of 0.25 was defined, which means that the interquartile range is between the 0.25 and 0.75 quantiles of the data. Then a multiplier (Q) of 1.5 was selected to identify values as outliers. An outlier was calculated as any value more than Q times the interquartile range from the lower and upper quantiles.
A multivariate analysis was performed in JMP 14 software to find the pairwise and higher relationships among the CC, CH, NDVI, ExG, yield, and total cellulosic content (TCC). This analysis allowed summarization of the linear relationships between flights to check for data consistency. A correlation probability report was generated, which showed the p-values that correspond to a test of the null hypothesis that the true correlation between the variables is zero.

2.7. Yield and Total Cellulosic Content Models

A stepwise regression approach with a k-fold cross validation was implemented in JMP 14 to obtain the yield and TCC models with the data from the varieties Ho02−113, TH16−19, and TH16-25. Six folds were selected to split the data into groups of equal number of observations. The stopping rule adopted was Max K-Fold RSquare, which attempted to find a model to maximize the coefficient of determination for the validation set. Stepwise multiple linear regression is a commonly implemented empirical statistical method for high-throughput field phenotyping [29]. It is used to improve the prediction performance of the models by eliminating unnecessary factors and selecting significant factors [30].

3. Results

3.1. Statistics

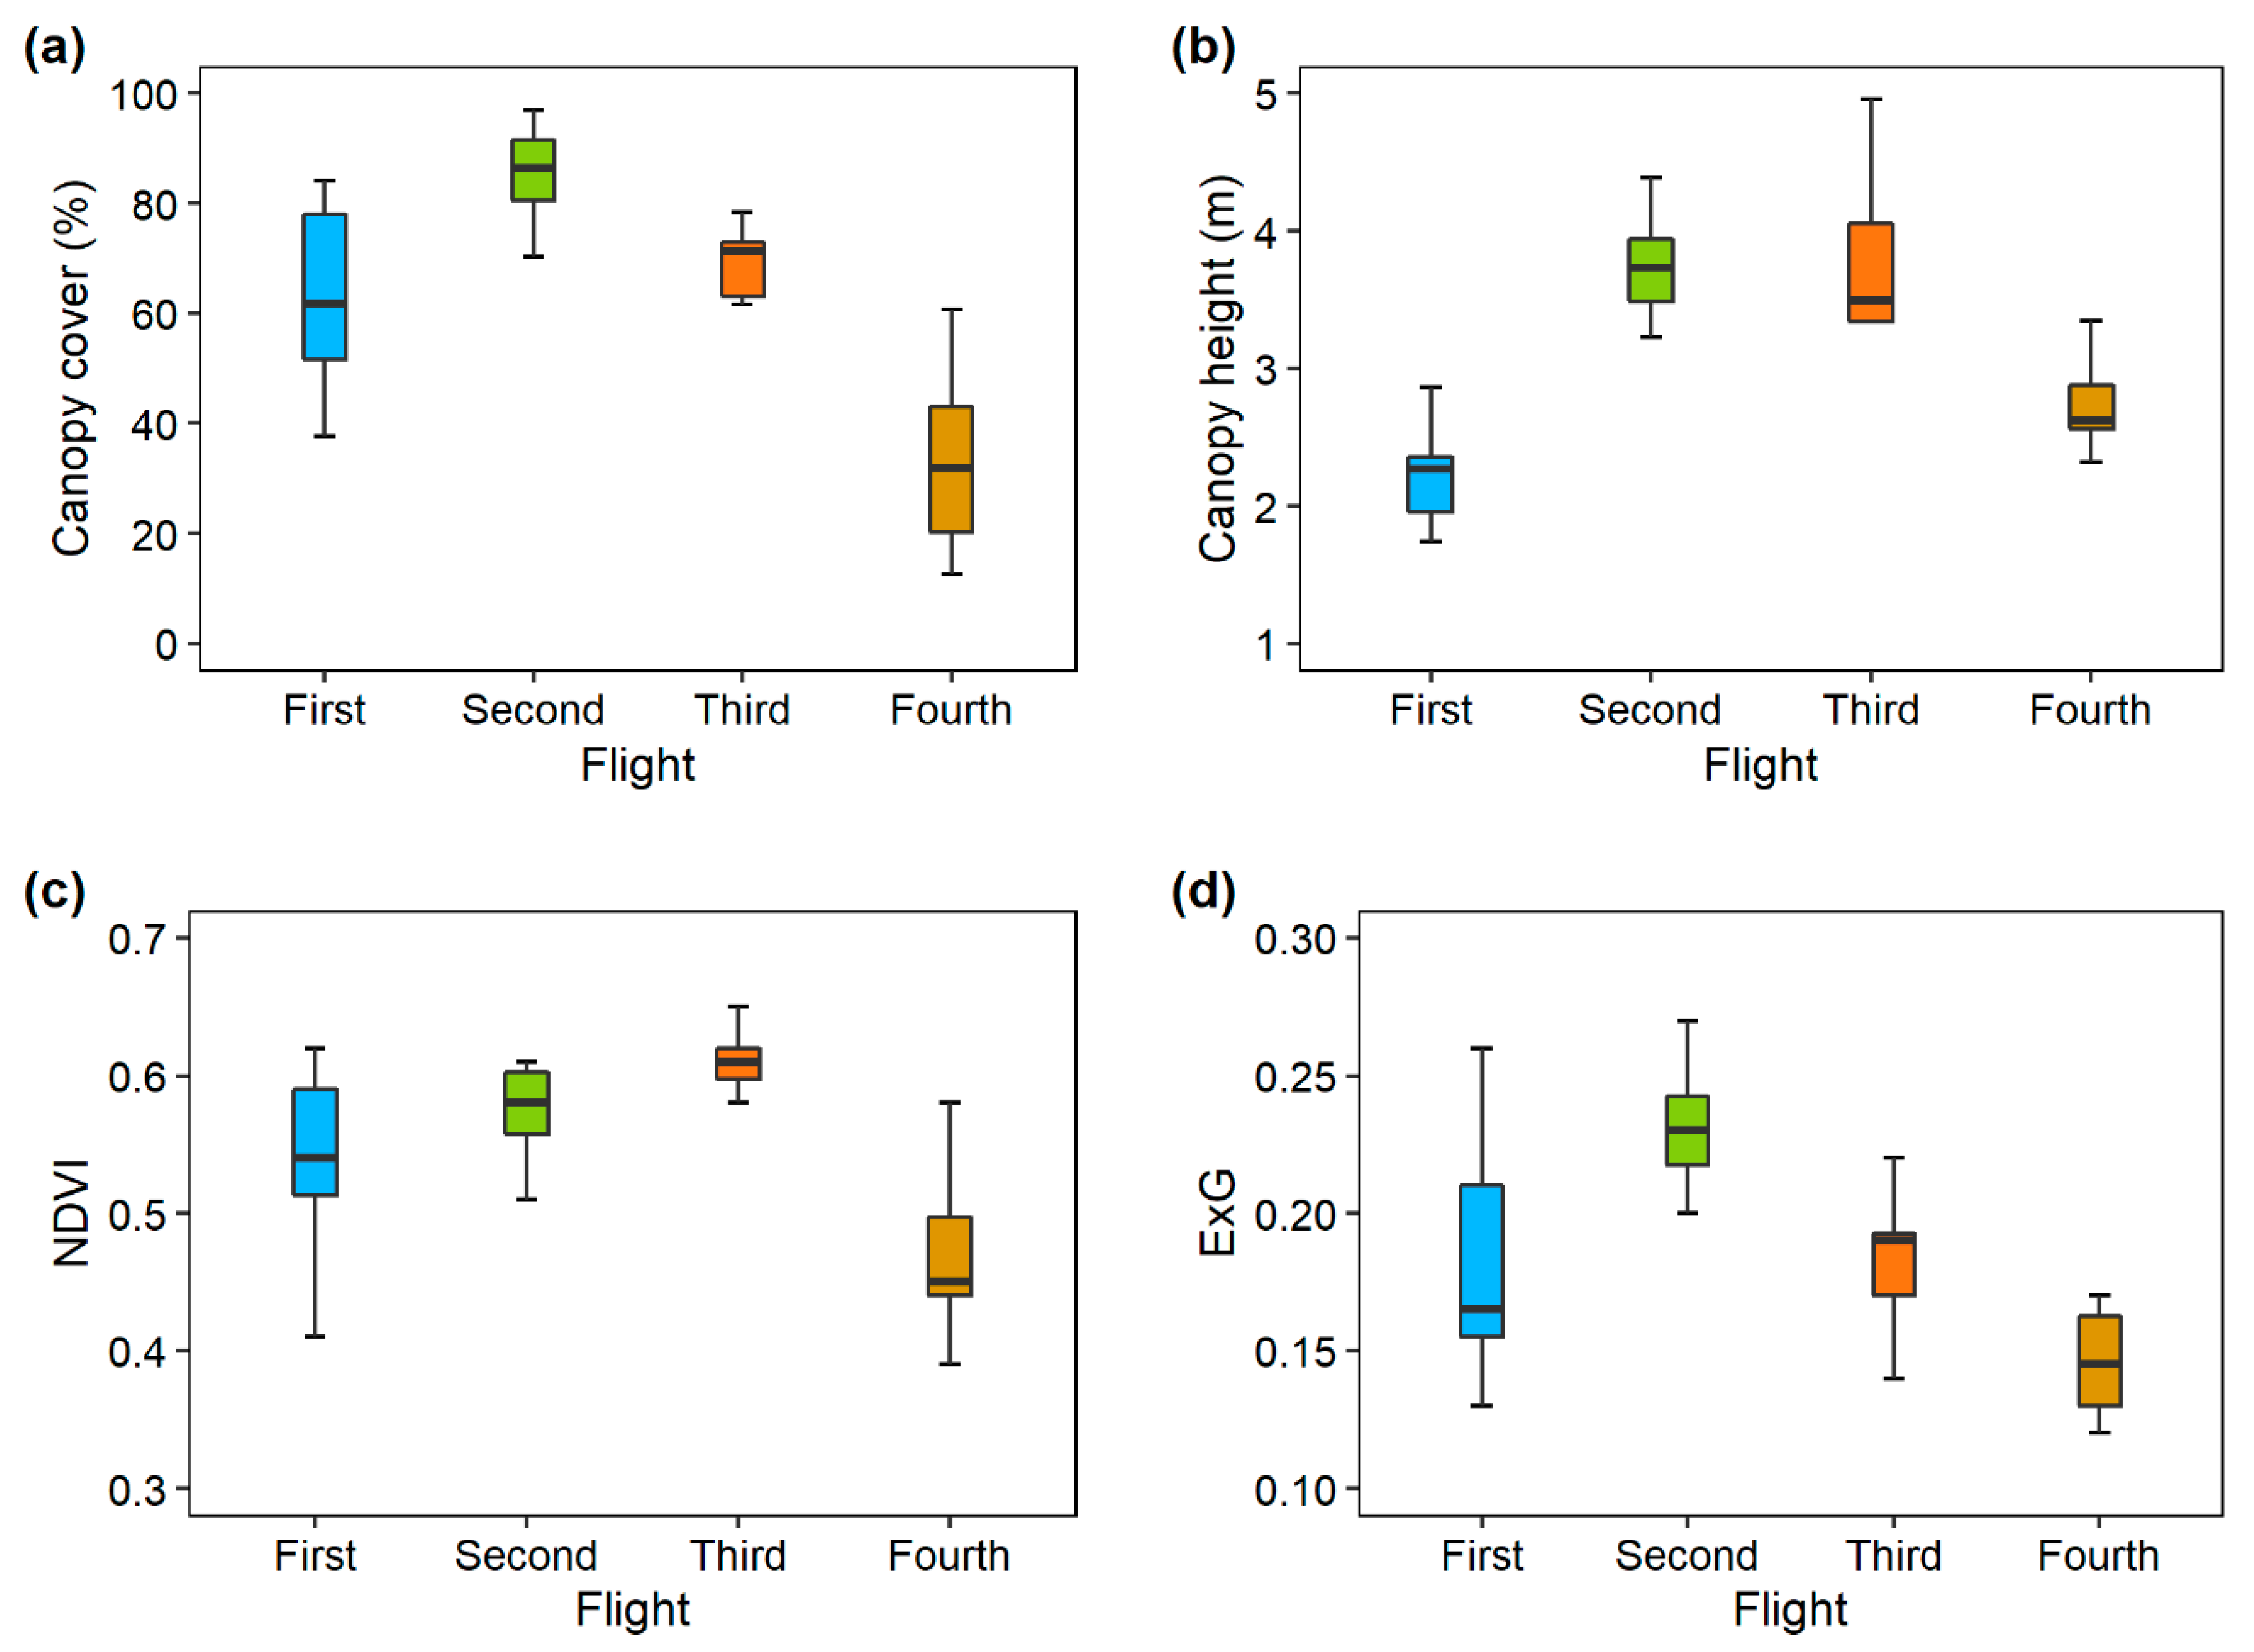
After an initial analysis, no outliers were found in the variables CC, CH, NDVI, and ExG obtained from the UAS images, and in the observed yield and TCC (Table 2). The highest mean CC, CH, and ExG values were observed for the second flight (85.74, 3.73, and 0.23, respectively), while the lowest values of CC and ExG were for the fourth flight; the lowest mean CH was observed during the first flight. Similarly, the highest mean NDVI values were obtained for the third flight (0.61), whereas the lowest NDVI values were for the fourth flight.
The canopy cover variability was greater during the third flight, evidenced by the negatively skewed distribution (Figure 2a). Canopy height variability was higher during the first, third, and fourth flights, which presented a negatively skewed distribution for the first flight and a positively skewed distribution for the third and fourth flights (Figure 2b). NDVI showed higher variation in the fourth flight with a positively skewed distribution (Figure 2c). ExG variability was observed in the first flight with positively skewed distribution and the third flight with a negatively skewed distribution (Figure 2d).

3.2. Relationship Analysis

The correlations among the independent variables were analyzed between flights (Table 3). CC showed high temporal consistency between the first and the fourth flight (r = 0.73); however, a weak correlation was found between the other flights. Positive relationships associated with height were consistent throughout the evaluation period, being the lowest correlation between the first and fourth flight (r = 0.73), whereas the highest correlation was between the first and second flight (r = 0.93). A strong positive relationship was found between NDVI values of the first and second flight (r = 0.76), and between the first and fourth flight (r = 0.60); nevertheless, for the remaining flights, weak positive or negative correlations were observed. The highest ExG correlation was between the first and fourth flight (r = 0.63), followed by the correlation between the first and second flight (r = 0.39), whereas weak positive relationships were found for the remaining flights.
From each flight were identified the variables with a moderate or strong correlation with yield and TCC. For the first flight, CC, CH, and NDVI were positively related to yield, whereas CC and ExG were associated with TCC. For the second flight, CC, CH, and NDVI were positively correlated to yield; CC, CH, and ExG were related to TCC. For the third flight, the variables associated with yield were CH and NDVI: the first variable was positively correlated, and the second negatively correlated. In contrast, CH, NDVI, and ExG were related to TCC: CH was positively correlated and NDVI and ExG negatively correlated. For the fourth flight, all the variables were moderately related to yield; CC, CH, and ExG were associated with TCC.

3.3. Energy Cane Yield and TCC Models

The yield models were obtained for the four flights after performing a stepwise regression, and the coefficient of determination (R2), p-value, and RMSE were used to evaluate the model’s performance (Table 4). The variables that most influenced energy cane yield were NDVI and canopy height.
The models for the first and third flight showed a good coefficient of determination to estimate energy cane yield. The lowest R2 was for the fourth flight, while the highest R2 corresponded to the third flight (Table 4).
In the same way, total cellulosic content (TCC) models for the fourth flights presented different coefficients of determination, p-values, and RMSE (Table 5). Nonetheless, since the variables were not significantly correlated to TCC, then low R2 were obtained for all the flights.
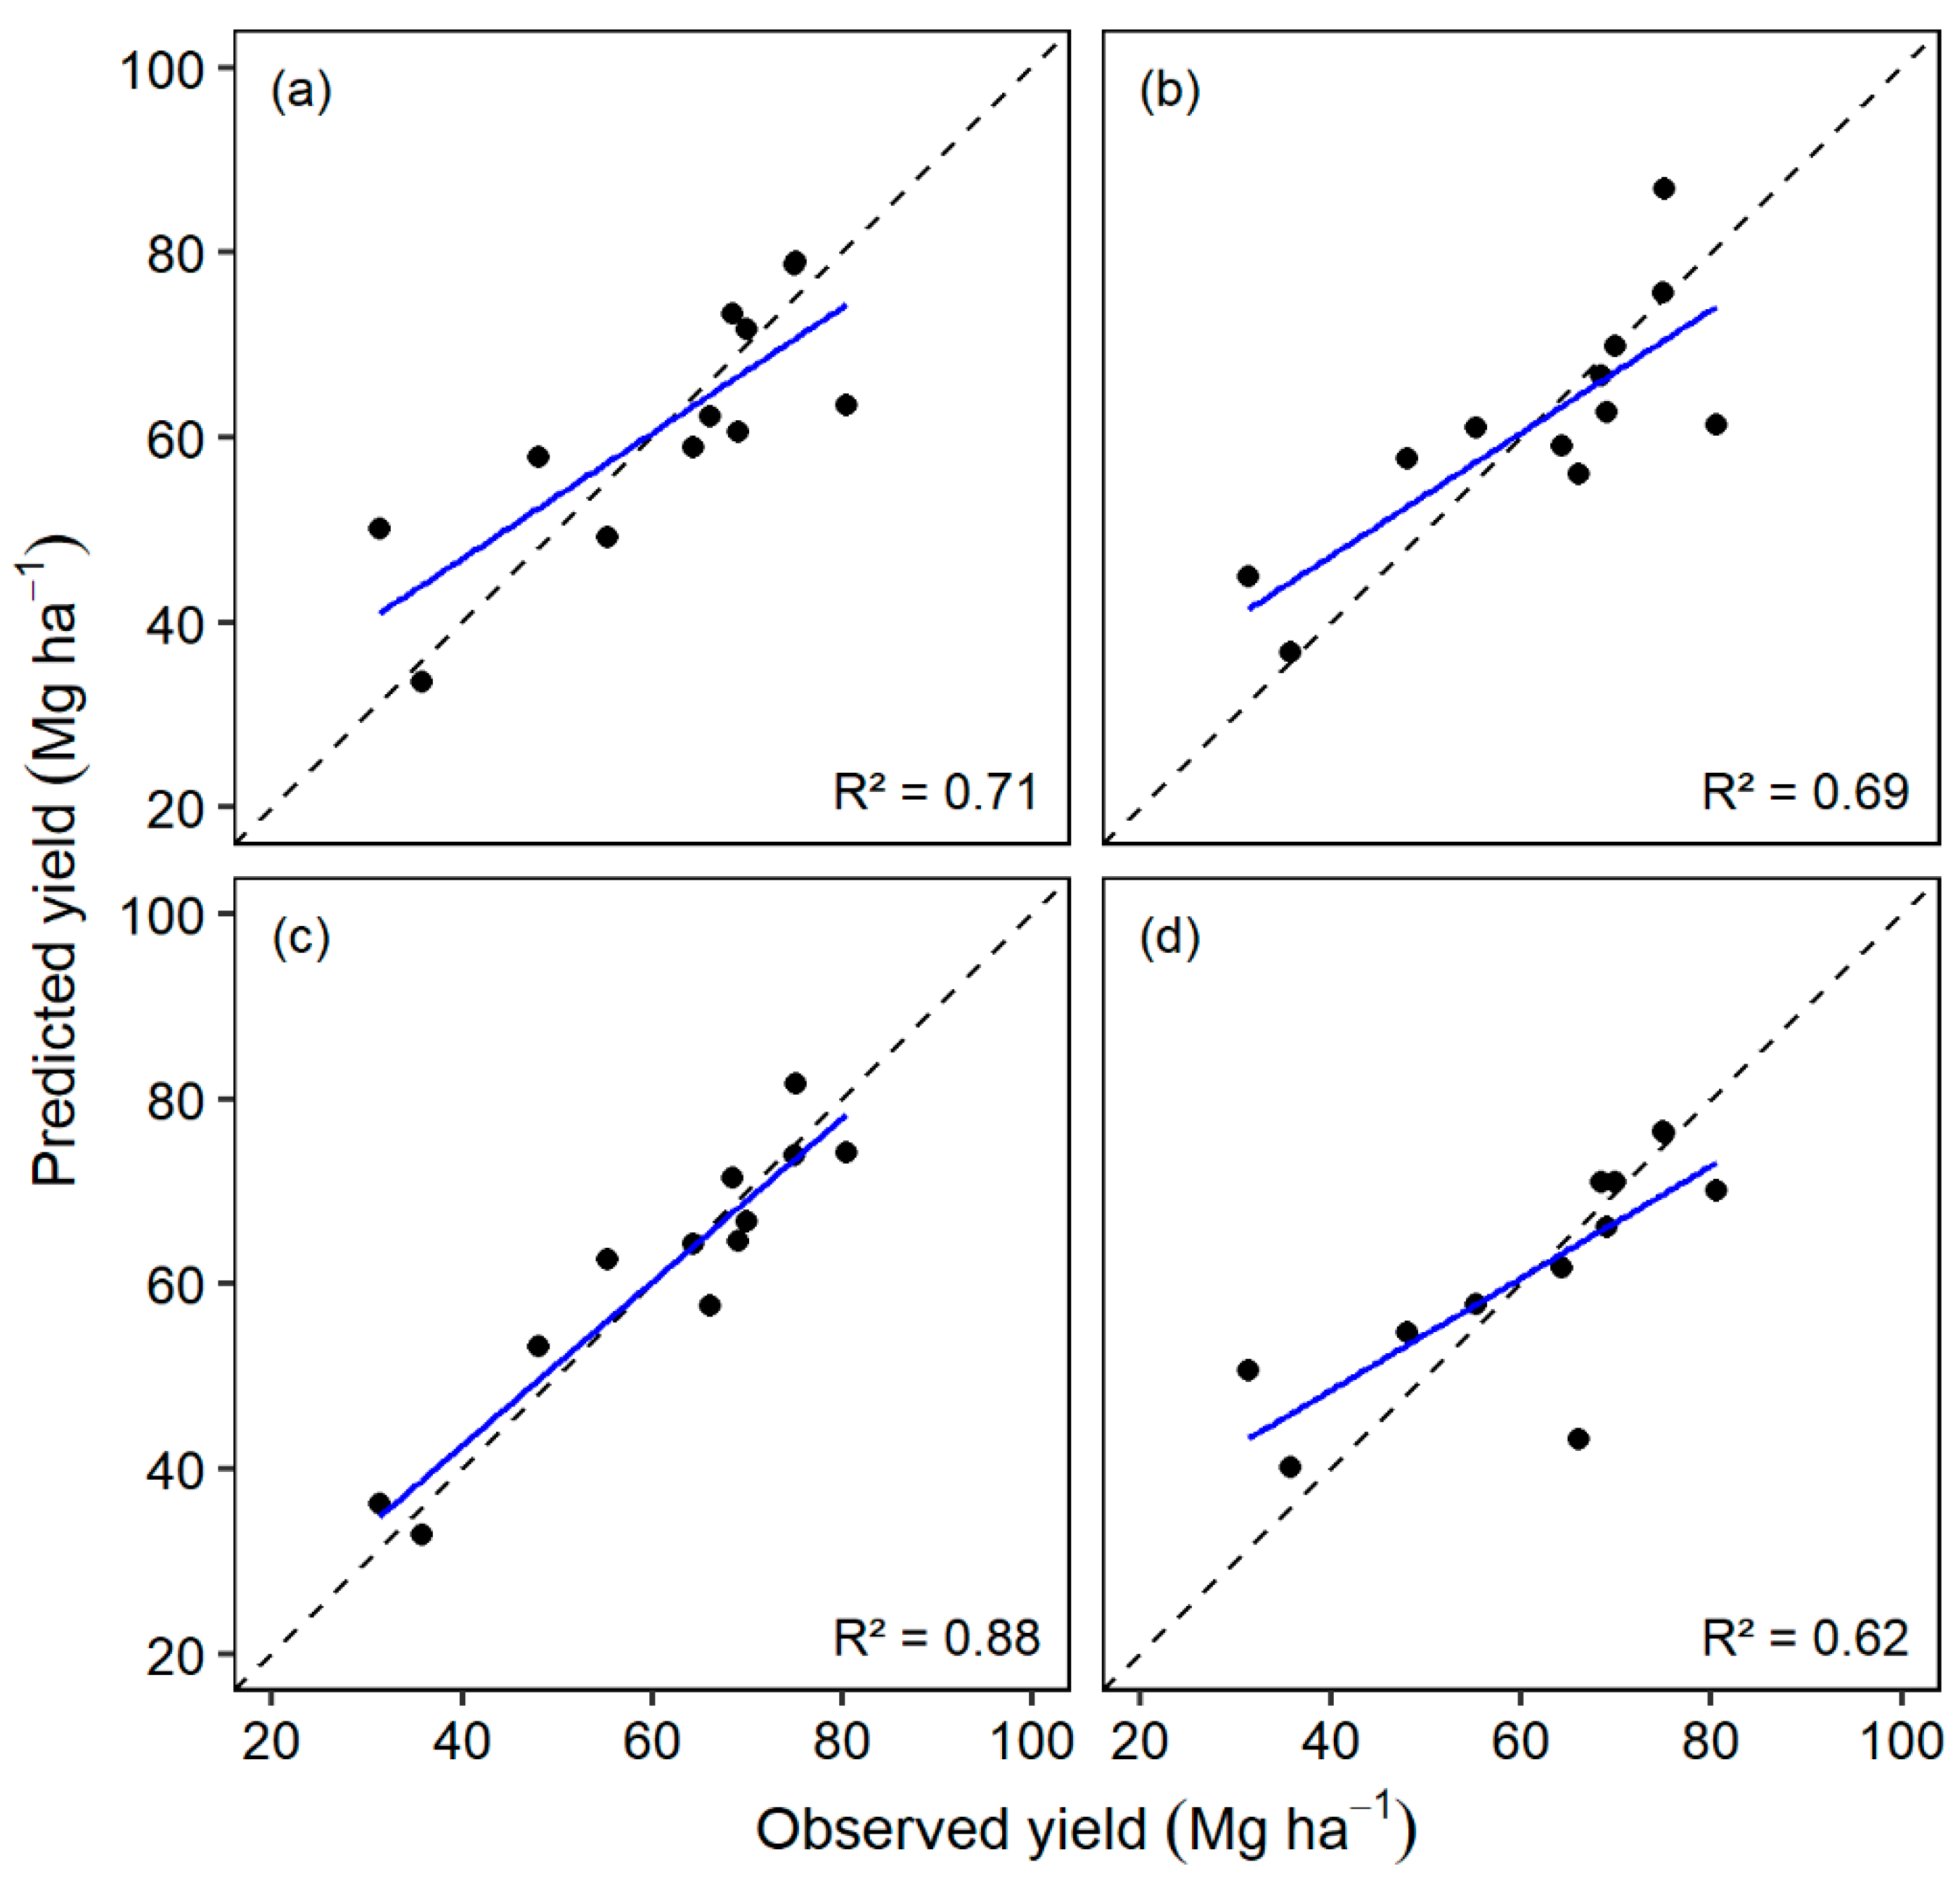
The relationship between observed and predicted yield is presented in Figure 3. This figure shows that the best relationship between observed and predicted yield is given by the model for the third flight with a coefficient of determination of 0.88 (Figure 3c). In contrast, the lowest relationship of yields is found in the model for the fourth flight (Figure 3d).
The relationship between observed TCC and predicted TCC is showed in Figure 4, where the best agreement between the observed and predicted TCC is provided by the model for the third flight with a coefficient of determination of 0.30 (Figure 4c). On the other hand, the lowest relationship of TCC is observed in the model for the second flight (Figure 4d).

4. Discussion

True color and multispectral imagery can be used to extract plant measurements and vegetation indices to estimate yield. However, it is necessary to know the best time of data collection to make the predictions, so there is a need for assessing the accuracy of the models generated for each of the flights. A previous study by Sanches et al. (2018) [20] found that the inflection point of biomass accumulation by the crop is a useful reference in the estimation of sugarcane yield with UAS images.
NDVI has been used in several studies of yield prediction, and it has shown good results [12,31,32,33]. In this study, it was significantly or moderately correlated to yield for the first (r = 0.84) and second (r = 0.55) assessments. Nevertheless, the higher correlation was observed during the first flight, which indicates that this crop stage can be used to collect UAS imagery for energy cane yield prediction.
Sugarcane height is highly correlated with biomass and nitrogen uptake [34]. Additionally, height can be an indicator of yield and other parameters since it is highly influenced by soil, total sugar, leaf nitrogen, temperature, and light intensity [35,36]. Nevertheless, when sugarcane plants attain a certain height, they start to lodge, and environmental factors such as wind can cause plant breakage [35]. In this experiment, plant height was also affected by wind, and for the last two assessments, lodging was evident. The yield models for the third and fourth flights contain canopy height as one of their predictors; however, since the measurements after lodging are not representative, then these models could have some limitations estimating energy cane yield.
Canopy cover is related to crop growth and water use [37]; for this reason, it is an important parameter in crop monitoring. Energy cane canopy cover did not play an essential role in yield prediction; it was moderately correlated with yield for first assessment (r = 0.32) and the fourth assessment (r = 0.44). However, it was strongly correlated with yield for the second assessment (r = 0.70). These results are due mainly to the thresholds used to separate green vegetation from non-vegetation according to the canopeo algorithm [22].
ExG is useful for discriminating between green and non-green vegetation [26]. This index has been used coupled with crop classified mean heights to predict corn grain yield, and it showed good results [38]. Opposite to these findings, in the present study, the mean ExG values for the first, second, and third assessments were not significantly correlated to energy cane yield; it only was significantly correlated to yield for the fourth flight (r = 0.60).
In this study, a stepwise regression analysis was implemented to obtain the yield and TCC models, and the accuracy was assessed by means R2, p-value, and RMSE. Energy cane yield was satisfactorily estimated by two of the models, which were built with UAS data collected 273 and 153 days before harvest. The predictor for the first model is NDVI, which implies that the acquisition of multispectral imagery is required, whereas, for the second model, the predictors are CC, CH, and ExG, which can be extracted from RGB images. The performance of these models was also satisfactory since RMSE ranged from 6.26 to 8.89 Mg ha−1. These findings are similar to the model performances found by Pinheiro Lisboa et al. (2018) [31], of between 0.24 and 10.34 Mg ha−1, and the RMSE reported by Fernandes et al. (2017) [39], ranging from 7.20 to 11.0 Mg ha−1. Nevertheless, the performance of the model for the fourth flight was not satisfactory, since it was 11.39 Mg ha−1.
The previous findings may apply to other locations if the environmental conditions at the time of the data collection are appropriate. It can also be applied to other crops such as sorghum [40], maize [41], wheat [42], and rice [32]. Furthermore, other variables that may be included in future yield prediction models could be abiotic stresses, such as temperature, precipitation, and solar radiation, which would increase the importance of this technology as a valuable tool for the breeding of stress tolerant varieties [43].
TCC was not successfully estimated by the models created, and the main reason for this was the lack of correlation of TCC with the variables used. The coefficient of determination ranged from 0.21 to 0.30. These results agree with those reported by Chea et al. (2020) [21], who found a weak correlation (R2 = 0.35–0.50) between fiber content with GNDVI (Green Normalized Difference Vegetation Index), NDVI (Normalized Difference Vegetation Index), RVI (Ratio Vegetation Index), CIgreen (Green Chlorophyll Index), CIrededge (Red Edge Chlorophyll Index), and SRPIb (Simple Ratio Pigment Index). Moreover, Roberts et al. (2011) [44] highlighted that lignocellulosic content indices rely on short-wave-infrared (SWIR) wavelengths, and wavelengths from 1500 to 1800 nm and 2000 to 2350 nm, which compare reflectance at an absorbing wavelength to a non-absorbing wavelength. In this case, hyperspectral imagery was not available to calculate indices such as CAI (Cellulose Absorption Index) [45] or NDLI (Normalized Difference Lignin Index) [46], so this could be a limiting factor to predict TCC in energy cane.

5. Conclusions

This study assessed the utilization of UAS in the prediction of yield and composition of energy cane. Crop parameters and vegetation indices (NDVI and ExG) were extracted from visible and multispectral imagery to generate the models. The yield was satisfactorily estimated by two of the models created, the first model with data collected 273 days before harvest (R2 = 0.88) and the second with data collected 153 days before harvest (R2 = 0.71). TCC was not estimated satisfactorily, and the highest coefficient of determination was 0.30. This study demonstrated the potential application of UAS to estimate energy cane yield with high accuracy, enabling plant breeders to phenotype larger populations and make selections with higher confidence. Further investigation is required for TCC prediction considering the use of hyperspectral imagery.

Author Contributions

Author contribution are listed as follows: Conceptualization, U.C., J.E and J.A.T.; methodology, U.C., J.E., T.M., J.A.T.; software, U.C., J.S. and T.M.; formal analysis, U.C., J.A.T. and J.A.d.S.; investigation, J.A.d.S., U.C., J.E., T.M. and J.A.T.; resources, J.E. and J.A.d.S.; data curation, U.C., T.M., J.A.d.S. and J.S.; writing—original draft preparation, U.C.; writing—review and editing, U.C., J.E., J.A.d.S., T.M., J.A.T. and J.S.; visualization, U.C. and J.E.; supervision, J.E. and J.A.T.; project administration, J.E.; funding acquisition, J.E. and J.A.d.S. All authors have read and agreed to the published version of the manuscript.

Funding

This research was funded by USDA-NIFA, grant number 554772 and the Hatch project “Development of Engineering Tools for Soil and Water Conservation”, accession number 1016863.

Conflicts of Interest

The authors declare no conflict of interest.

References

  1. Takeda, S.; Matsuoka, M. Genetic Approaches to Crop Improvement: Responding to Environmental and Population Changes. Nat. Rev. Genet. 2008, 9, 444–457. [Google Scholar] [CrossRef]
  2. Somerville, C.; Youngs, H.; Taylor, C.; Davis, S.C.; Long, S.P. Feedstocks for Lignocellulosic Biofuels. Science 2010, 329, 790–792. [Google Scholar] [CrossRef] [Green Version]
  3. Ellis, R.D.; Merry, R.E. Sugarcane Agriculture. In Sugarcane; Blackwell Publishing Ltd.: Oxford, UK, 2004; pp. 101–142. [Google Scholar] [CrossRef]
  4. Da Silva, J.A.G.; Sorrells, M.E.; Burnquist, W.L.; Tanksley, S.D. RFLP Linkage Map and Genome Analysis of Saccharum Spontaneum. Genome 1993, 36, 782–791. [Google Scholar] [CrossRef]
  5. Park, J.-W.; Benatti, T.R.; Marconi, T.; Yu, Q.; Solis-Gracia, N.; Mora, V.; Da Silva, J.A. Cold Responsive Gene Expression Profiling of Sugarcane and Saccharum Spontaneum with Functional Analysis of a Cold Inducible Saccharum Homolog of NOD26-like Intrinsic Protein to Salt and Water Stress. PLoS ONE 2015, 10, e0125810. [Google Scholar] [CrossRef]
  6. Scortecci, K.C.; Creste, S.; Calsa, T.; Xavier, M.A.; Landell, M.G.A.; Figueira, A.; Benedito, V.A. Challenges, Opportunities and Recent Advances in Sugarcane Breeding. In Plant Breeding; Abdurakhmonov, I., Ed.; InTech: Rijeka, Croatia, 2012; pp. 267–296. [Google Scholar]
  7. Carvalho-Netto, O.V.; Bressiani, J.A.; Soriano, H.L.; Fiori, C.S.; Santos, J.M.; Barbosa, G.V.S.; Xavier, M.A.; Landell, M.G.A.; Pereira, G.A.G. The Potential of the Energy Cane as the Main Biomass Crop for the Cellulosic Industry. Chem. Biol. Technol. Agric. 2014, 1, 20. [Google Scholar] [CrossRef] [Green Version]
  8. Matsuoka, S.; Kennedy, A.J.; dos Santos, E.G.D.; Tomazela, A.L.; Rubio, L.C.S. Energy Cane: Its Concept, Development, Characteristics, and Prospects. Adv. Bot. 2014, 2014, 597275. [Google Scholar] [CrossRef] [Green Version]
  9. Levitt, J., II. Water, Radiation, Salt and Other Stresses. In Responses of Plants to Environmental Stresses; Academic Press: New York, NY, USA, 1980; p. 607. [Google Scholar]
  10. Salekdeh, G.H.; Reynolds, M.; Bennett, J.; Boyer, J. Conceptual Framework for Drought Phenotyping during Molecular Breeding. Trends Plant Sci. 2009, 14, 488–496. [Google Scholar] [CrossRef]
  11. Berger, B.; Parent, B.; Tester, M. High-Throughput Shoot Imaging to Study Drought Responses. J. Exp. Bot. 2010, 61, 3519–3528. [Google Scholar] [CrossRef] [Green Version]
  12. Casadesús, J.; Kaya, Y.; Bort, J.; Nachit, M.M.; Araus, J.L.; Amor, S.; Ferrazzano, G.; Maalouf, F.; Maccaferri, M.; Martos, V.; et al. Using Vegetation Indices Derived from Conventional Digital Cameras as Selection Criteria for Wheat Breeding in Water-Limited Environments. Ann. Appl. Biol. 2007, 150, 227–236. [Google Scholar] [CrossRef]
  13. Swain, K.C.; Thomson, S.J.; Jayasuriya, H.P.W. Adoption of an Unmanned Helicopter for Low-Altitude Remote Sensing to Estimate Yield and Total Biomass of a Rice Crop. Trans. ASABE 2010, 53, 21–27. [Google Scholar] [CrossRef] [Green Version]
  14. Yang, G.; Liu, J.; Zhao, C.; Li, Z.; Huang, Y.; Yu, H.; Xu, B.; Yang, X.; Zhu, D.; Zhang, X.; et al. Unmanned Aerial Vehicle Remote Sensing for Field-Based Crop Phenotyping: Current Status and Perspectives. Front. Plant Sci. 2017, 8, 1111. [Google Scholar] [CrossRef] [PubMed]
  15. You, J.; Li, X.; Low, M.; Lobell, D.; Ermon, S. Deep Gaussian Process for Crop Yield Prediction Based on Remote Sensing Data. In Proceedings of the Thirty-First AAAI Conference for Artificial Intelligence (AAAI-17), San Francisco, CA, USA, 4–10 February 2017. [Google Scholar]
  16. Khaki, S.; Wang, L.; Archontoulis, S.V. A CNN-RNN Framework for Crop Yield Prediction. Front. Plant Sci. 2020, 10, 1750. [Google Scholar] [CrossRef] [PubMed]
  17. Mathews, A.; Jensen, J. Visualizing and Quantifying Vineyard Canopy LAI Using an Unmanned Aerial Vehicle (UAV) Collected High Density Structure from Motion Point Cloud. Remote Sens. 2013, 5, 2164–2183. [Google Scholar] [CrossRef] [Green Version]
  18. Diaz-Varela, R.A.; Zarco-Tejada, P.J.; Angileri, V.; Loudjani, P. Automatic Identification of Agricultural Terraces through Object-Oriented Analysis of Very High Resolution DSMs and Multispectral Imagery Obtained from an Unmanned Aerial Vehicle. J. Environ. Manag. 2014, 134, 117–126. [Google Scholar] [CrossRef]
  19. Zarco-Tejada, P.J.; Diaz-Varela, R.; Angileri, V.; Loudjani, P. Tree Height Quantification Using Very High Resolution Imagery Acquired from an Unmanned Aerial Vehicle (UAV) and Automatic 3D Photo-Reconstruction Methods. Eur. J. Agron. 2014, 55, 89–99. [Google Scholar] [CrossRef]
  20. Sanches, G.M.; Duft, D.G.; Kölln, O.T.; Luciano, A.C.D.S.; De Castro, S.G.Q.; Okuno, F.M.; Franco, H.C.J. The Potential for RGB Images Obtained Using Unmanned Aerial Vehicle to Assess and Predict Yield in Sugarcane Fields. Int. J. Remote Sens. 2018, 39, 5402–5414. [Google Scholar] [CrossRef]
  21. Chea, C.; Saengprachatanarug, K.; Posom, J.; Wongphati, M.; Taira, E. Sugar Yield Parameters and Fiber Prediction in Sugarcane Fields Using a Multispectral Camera Mounted on a Small Unmanned Aerial System (UAS). Sugar Tech 2020, 1–17. [Google Scholar] [CrossRef]
  22. Patrignani, A.; Ochsner, T.E. Canopeo: A Powerful New Tool for Measuring Fractional Green Canopy Cover. Agron. J. 2015, 107, 2312–2320. [Google Scholar] [CrossRef] [Green Version]
  23. Rouse, J.W.; Haas, R.H.; Schell, J.A.; Deering, D.W. Monitoring Vegetation Systems in the Great Plains with ERTS. In NASA Goddard Space Flight Center 3d ERTS-1 Symposium; NASA: Washington, DC, USA, 1974; pp. 309–317. [Google Scholar]
  24. Thenkabail, P.S.; Smith, R.B.; De Pauw, E. Hyperspectral Vegetation Indices and Their Relationships with Agricultural Crop Characteristics. Remote Sens. Environ. 2000, 71, 158–182. [Google Scholar] [CrossRef]
  25. Enciso, J.; Avila, C.A.; Jung, J.; Elsayed-Farag, S.; Chang, A.; Yeom, J.; Landivar, J.; Maeda, M.; Chavez, J.C. Validation of Agronomic UAV and Field Measurements for Tomato Varieties. Comput. Electron. Agric. 2019, 158, 278–283. [Google Scholar] [CrossRef]
  26. Woebbecke, D.M.; Meyer, G.E.; Von Bargen, K.; Mortensen, D.A. Color Indices for Weed Identification under Various Soil, Residue, and Lighting Conditions. Trans. ASAE 1995, 38, 259–269. [Google Scholar] [CrossRef]
  27. Berding, N.; Brotherton, G.A.; le Brocq, D.G.; Skinner, J.C. Near Infrared Reflectance Spectroscopy for Analysis of Sugarcane from Clonal Evaluation Trials: I. Fibrated Cane. Crop Sci. 1991, 31, 1017–1023. [Google Scholar] [CrossRef]
  28. Bischoff, K.P.; Gravois, K.A.; Schexnayder, H.P., Jr.; Hawkins, G.L. The Effect of Harvest Method and Plot Size on the Estimation of Sugarcane Yield. J. Am. Soc. Sugar Cane Technol. 2001, 21, 51–60. [Google Scholar]
  29. Richards, J. Computer Processing of Remotely-Sensed Images: An Introduction. Earth-Sci. Rev. 1990, 27, 392–394. [Google Scholar] [CrossRef]
  30. Yu, X.; Liu, Q.; Wang, Y.; Liu, X.; Liu, X. Evaluation of MLSR and PLSR for Estimating Soil Element Contents Using Visible/near-Infrared Spectroscopy in Apple Orchards on the Jiaodong Peninsula. Catena 2016, 137, 340–349. [Google Scholar] [CrossRef]
  31. Pinheiro Lisboa, I.; Melo Damian, J.; Roberto Cherubin, M.; Silva Barros, P.P.; Ricardo Fiorio, P.; Cerri, C.C.; Pellegrino Cerri, C.E. Prediction of Sugarcane Yield Based on NDVI and Concentration of Leaf-Tissue Nutrients in Fields Managed with Straw Removal. Agronomy 2018, 8, 196. [Google Scholar] [CrossRef] [Green Version]
  32. Zhou, X.; Zheng, H.B.; Xu, X.Q.; He, J.Y.; Ge, X.K.; Yao, X.; Cheng, T.; Zhu, Y.; Cao, W.X.; Tian, Y.C. Predicting Grain Yield in Rice Using Multi-Temporal Vegetation Indices from UAV-Based Multispectral and Digital Imagery. ISPRS J. Photogramm. Remote Sens. 2017, 130, 246–255. [Google Scholar] [CrossRef]
  33. Kyratzis, A.C.; Skarlatos, D.P.; Menexes, G.C.; Vamvakousis, V.F.; Katsiotis, A. Assessment of Vegetation Indices Derived by UAV Imagery for Durum Wheat Phenotyping under a Water Limited and Heat Stressed Mediterranean Environment. Front. Plant Sci. 2017, 8, 1114. [Google Scholar] [CrossRef] [Green Version]
  34. Portz, G.; Amaral, L.R.; Molin, J.P. Measuring Sugarcane Height in Complement To Biomass. In Proceedings of the 11th International Conference on Precision Agriculture, Indianapolis, IN, USA, 15–18 July 2012. [Google Scholar]
  35. De Souza, C.H.W.; Lamparelli, R.A.C.; Rocha, J.V.; Magalhães, P.S.G. Height Estimation of Sugarcane Using an Unmanned Aerial System (UAS) Based on Structure from Motion (SfM) Point Clouds. Int. J. Remote Sens. 2017, 38, 2218–2230. [Google Scholar] [CrossRef]
  36. Rahman, S. Growth, Yield and Quality of Plant and Ratoon Crops of Sugarcane as Affected by Plant Material and Management Practices. Ph.D. Thesis, University of Rajshahi, Rajshahi, Bangladesh, 2012. [Google Scholar]
  37. Trout, T.J.; Johnson, L.F.; Gartung, J. Remote Sensing of Canopy Cover in Horticultural Crops. HortScience 2008, 43, 333–337. [Google Scholar] [CrossRef] [Green Version]
  38. Geipel, J.; Link, J.; Claupein, W. Combined Spectral and Spatial Modeling of Corn Yield Based on Aerial Images and Crop Surface Models Acquired with an Unmanned Aircraft System. Remote Sens. 2014, 6, 10335–10355. [Google Scholar] [CrossRef] [Green Version]
  39. Fernandes, J.L.; Ebecken, N.F.F.; Esquerdo, J.C.D.M. Sugarcane Yield Prediction in Brazil Using NDVI Time Series and Neural Networks Ensemble. Int. J. Remote Sens. 2017, 38, 4631–4644. [Google Scholar] [CrossRef]
  40. Shafian, S.; Rajan, N.; Schnell, R.; Bagavathiannan, M.; Valasek, J.; Shi, Y.; Olsenholler, J. Unmanned Aerial Systems-Based Remote Sensing for Monitoring Sorghum Growth and Development. PLoS ONE 2018, 13, e0196605. [Google Scholar] [CrossRef] [Green Version]
  41. Maresma, Á.; Ariza, M.; Martínez, E.; Lloveras, J.; Martínez-Casasnovas, J. Analysis of Vegetation Indices to Determine Nitrogen Application and Yield Prediction in Maize (Zea Mays L.) from a Standard UAV Service. Remote Sens. 2016, 8, 973. [Google Scholar] [CrossRef] [Green Version]
  42. Fu, Z.; Jiang, J.; Gao, Y.; Krienke, B.; Wang, M.; Zhong, K.; Cao, Q.; Tian, Y.; Zhu, Y.; Cao, W.; et al. Wheat Growth Monitoring and Yield Estimation Based on Multi-Rotor Unmanned Aerial Vehicle. Remote Sens. 2020, 12, 508. [Google Scholar] [CrossRef] [Green Version]
  43. Ashapure, A.; Oh, S.; Marconi, T.G.; Chang, A.; Jung, J.; Landivar, J.; Enciso, J. Unmanned Aerial System Based Tomato Yield Estimation Using Machine Learning. In Autonomous Air and Ground Sensing Systems for Agricultural Optimization and Phenotyping IV; Thomasson, J.A., McKee, M., Moorhead, R.J., Eds.; SPIE: Baltimore, MD, USA, 2019; Volume 11008, p. 22. [Google Scholar] [CrossRef]
  44. Roberts, D.; Roth, K.; Perroy, R. Hyperspectral Vegetation Indices. In Hyperspectral Remote Sensing of Vegetation; Thenkabail, P.S., Huete, A., Lyon, J.G., Eds.; CRC Press: Boca Raton, FL, USA, 2011; pp. 309–328. [Google Scholar] [CrossRef]
  45. Daughtry, C.S.T. Agroclimatology: Discriminating Crop Residues from Soil by Shortwave Infrared Reflectance. Agron. J. 2001, 93, 125–131. [Google Scholar] [CrossRef]
  46. Serrano, L.; Peñuelas, J.; Ustin, S.L. Remote Sensing of Nitrogen and Lignin in Mediterranean Vegetation from AVIRIS Data: Decomposing Biochemical from Structural Signals. Remote Sens. Environ. 2002, 81, 355–364. [Google Scholar] [CrossRef]
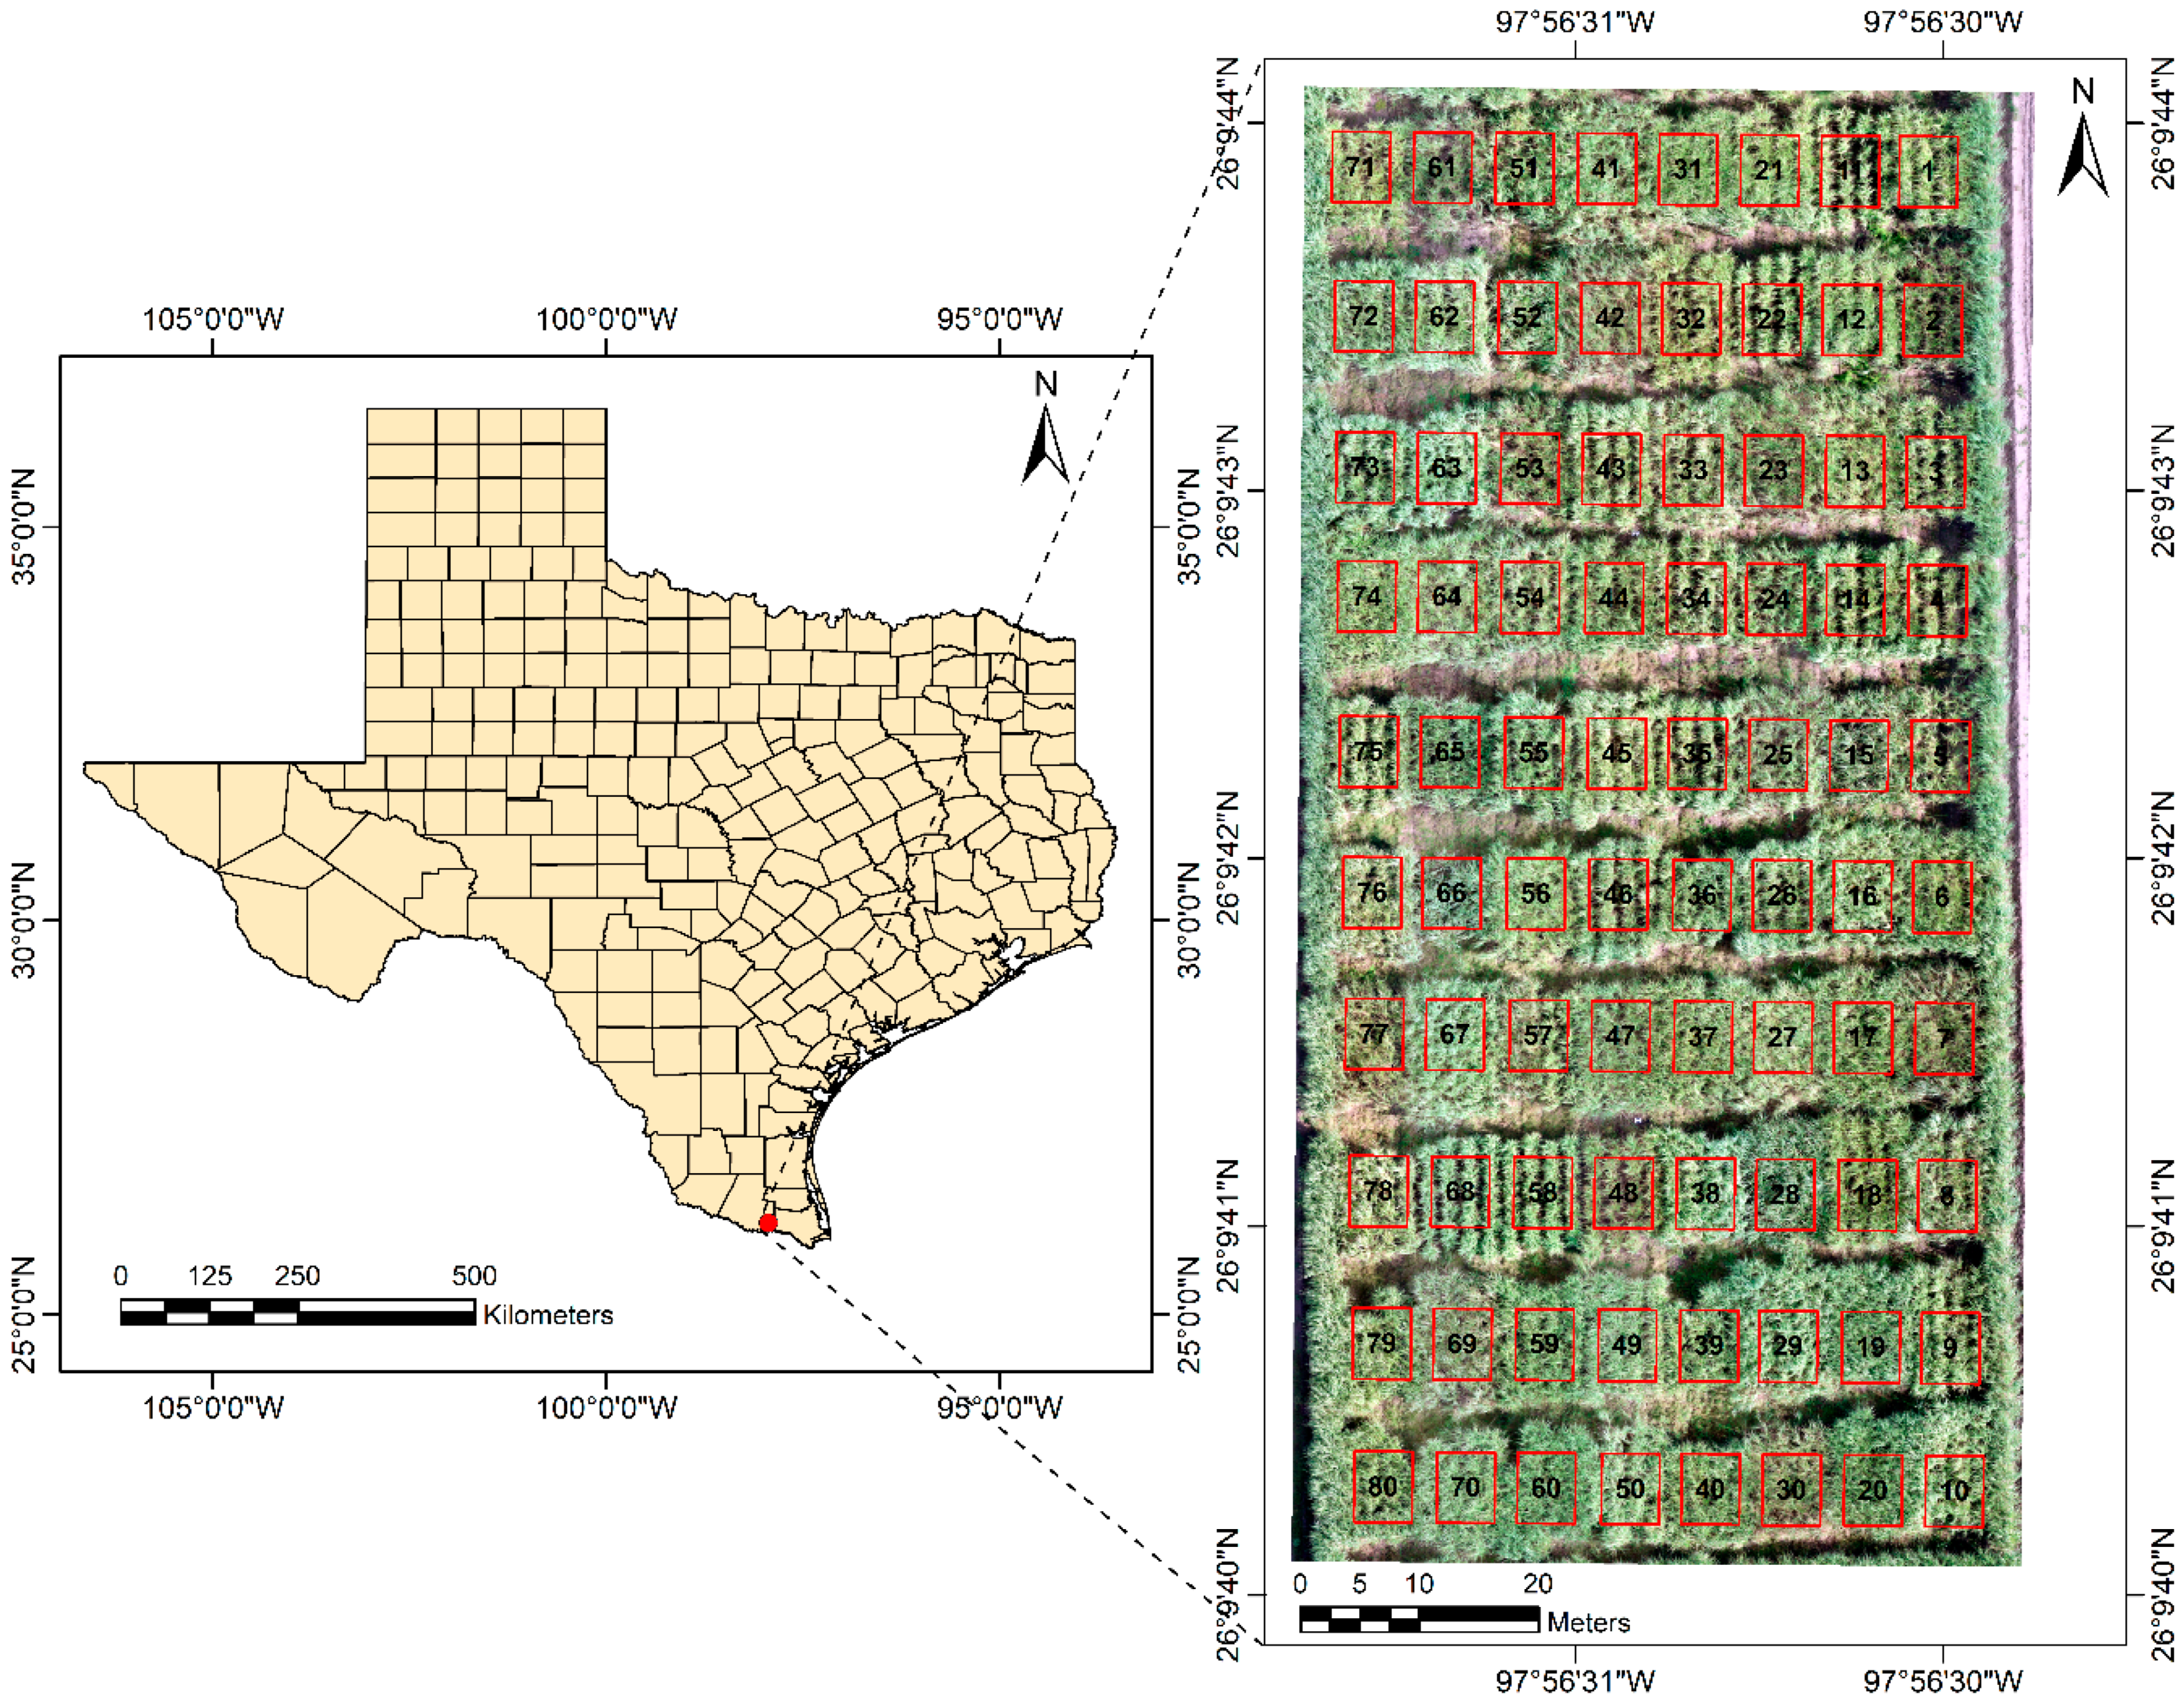
Figure 1. Study area location with the experimental plots.
Agronomy 10 00718 g001
Figure 2. Box-plot of canopy cover (a), canopy height (b), NDVI (c), and ExG (d).
Agronomy 10 00718 g002
Figure 3. Relationship between the observed and predicted yields for the first (a), second (b), third (c), and fourth (d) flights.
Agronomy 10 00718 g003
Figure 4. Relationship between the observed and predicted TCC for the first (a), second (b), third (c), and fourth (d) flights.
Agronomy 10 00718 g004
Table 1. Specifications for the UAS and the sensors used to collect the data.
DJI Phantom 4 Pro
with RGB Sensor
Matrice 100 with
SlantRange 3p Sensor
Sensor resolution (pixels)5472 × 36481280 × 1024
Spectral resolutionR, G, BNIR, red edge, R, G
Weight (g)13882781
Table 2. Descriptive statistics of canopy cover (CC), canopy height (CH), Normalized Difference Vegetation Index (NDVI), Excess Green Index (ExG), yield, and total cellulosic content (TCC).
NMeanMedianSDMinMax
CC–1st1261.3561.8516.0337.7584.02
CC–2nd 1285.7486.307.8070.3797.02
CC–3rd1269.7871.255.9661.6978.34
CC–4th1233.1831.8416.9312.5960.79
CH– 1st 122.222.270.331.742.86
CH– 2nd123.733.730.353.234.39
CH–3rd123.603.500.892.034.96
CH–4th122.762.620.342.323.35
NDVI–1st120.540.540.060.410.62
NDVI–2nd 120.580.580.030.510.61
NDVI–3rd120.610.610.020.580.65
NDVI–4th120.470.450.050.390.58
ExG–1st120.180.170.040.130.26
ExG–2nd120.230.230.020.200.27
ExG–3rd120.180.190.020.140.23
ExG–4th 120.120.130.040.050.17
Yield (Mg ha−1)1261.5767.3015.7431.3680.49
TCC 1262.1861.873.6755.9966.91
1st–first flight (July 17, 2018), 2nd–second flight (September 18, 2018), 3rd–third flight (November 14, 2018), 4th–fourth flight (December 19, 2018), N–sample size, SD–standard deviation, Min–minimum value, Max–maximum value.
Table 3. Correlation coefficient matrix between CC, CH, NDVI, ExG, yield, and TCC.
CC 1CC 2CC 3CC 4CH 1CH 2CH 3CH 4NDVI 1NDVI 2NDVI 3NDVI 4ExG 1ExG 2ExG 3ExG 4Yield TCC
CC 11.00
CC 2 0.461.00
CC 30.010.141.00
CC 40.73 **0.47−0.191.00
CH 10.560.54−0.320.791.00
CH 20.560.63 *−0.320.710.93 ***1.00
CH 30.550.83 ***0.040.550.78 **0.83 ***1.00
CH 40.560.71 **0.000.530.73 **0.83 ***0.76 **1.00
NDVI 10.290.81 **−0.010.330.72 **0.79 **0.85 ***0.85 ***1.00
NDVI 2 0.080.82 **0.140.000.290.380.63 *0.480.76 **1.00
NDVI 3−0.44−0.58 *−0.06−0.16−0.13−0.21−0.47−0.19−0.31−0.561.00
NDVI 40.350.480.180.530.71 **0.66 *0.66 *0.67 *0.60 *0.360.091.00
ExG 10.85 ***0.43−0.150.81 **0.570.570.380.550.290.00−0.230.201.00
ExG 20.420.71 **0.500.26−0.010.050.370.260.280.53−0.70 *0.020.391.00
ExG 3−0.09−0.080.450.120.110.00−0.04−0.060.08−0.120.250.140.100.051.00
ExG 4 0.65 *0.49−0.090.89 ***0.82 **0.73 **0.64 *0.460.430.14−0.320.59 *0.63 *0.260.311.00
Yield 0.320.70 *−0.090.440.75 **0.79 **0.90 ***0.63 *0.84 ***0.55−0.440.440.260.240.130.60 *1.00
TCC 0.490.30−0.100.530.280.350.390.320.07−0.08−0.360.070.370.31−0.400.330.321.00
1 First flight, 2 second flight, 3 third flight, and 4 fourth flight. * p < 0.05, ** p < 0.01, *** p < 0.001.
Table 4. Energy cane yield models with the coefficient of determination, p-value, and RMSE for the flight campaigns.
FlightModelR2p-ValueRMSE
07/17/18yield = 222.08 NDVI–58.390.710.00068.89
09/18/18yield = 30.66 CH + 148.40 NDVI − 138.340.690.00499.64
11/14/18yield = − 0.68 CC + 16.26 CH + 177.04 ExG + 18.250.880.00046.26
12/19/18yield = − 0.70 CC + 26.14 CH + 381.68 ExG − 32.950.620.043211.39
Table 5. Energy cane TCC models with the coefficient of determination, p-value, and RMSE for the flight campaigns.
FlightModelR2p-ValueRMSE
07/17/18TCC = 0.11 CC + 55.260.240.10323.35
09/18/18TCC = 3.58 CH + 47.19 ExG + 38.000.210.35193.61
11/14/18TCC = 1.54 CH − 57.14 ExG + 67.150.300.19963.39
12/19/18TCC = 0.11 CC + 58.390.280.07793.27