Abstract
A field experiment was conducted to study the effects of different tillage methods, and their interaction on the dynamic changes of straw decomposition rate, mechanical properties, and micro-structure of the stalk. A nylon mesh bag technique was used. An obvious change was observed in the decomposition rate of straw, and its mechanical, and micro-structural properties. The decomposition rate of straw was increased in all tillage treatments. Specifically, it increased consistently in conventional and dry rotary tillage, and sharply in wet rotary tillage. Furthermore, for all tillage, the mechanical properties like shear and bending strengths decreased sharply while compressive strength first decreased linearly and then increased, whereas the micro-structure of wheat straw showed a fluctuating trend, i.e., it changed neither regularly nor consistently over time. Moreover, the micro-structure of the stalk explained the morphological changes to the straw that returned to the field, which may impact the mechanical properties. However, these changes could not explain the degradation trend of straw directly. The findings of the study could be used as a theoretical reference for the design of tillage and harvesting machinery keeping in view soil solidification and compaction dynamics.
1. Introduction
The rice-wheat rotation system is the main cropping system in the Jiangsu Province of China [1]. High-yield wheat also produces a large amount of straw [2], but poor management leads to straw burning, which deteriorates soil fertility [3]. Fully mechanized straw returning is the most effective measure to solve the problems of excessive straw [4], but time deficiency in dual cropping systems from harvest to sowing signposts the requirements of an appropriate mechanization package for straw returning. A reasonable mechanized tillage method could be helpful for rapid straw returning. Traditional mixing of straw and soil with different tillage methods is the dominant practice in the region. Mixing through plowing increases the soil microbial activities and soil respiration [5], which leads to higher straw decomposition [6], and improves the soil, water, and heat conditions [7]. This could increase the organic matter, nitrogen, phosphorus, potassium, and other nutrients in the soil [8] to promote the growth of the next crop [9]. Ditch burying is another way to return the straw. In a simulated burying test, the temperature and moisture content of the straw can be accurately controlled [10], while a field test can effectively explain the changes in the moisture and nutrient contents of straw returned to the field [11]. Rotary tillage could fully mix straw and soil, and reduce soil damage compared with other types of tillage [12]. The changes to the structure and physicochemical properties of straw returned to the field are mainly determined by the straw itself [13]. A small amount of returned straw cannot be fully utilized. An excessive amount of returned straw not only increases the power consumption and operation intensity of the returning machinery but also reduces the yield of the next crop. Full straw returning can realize the full utilization of straw for fertilization. If the returning time is short, the straw does not decompose completely, which results in higher carbon emissions [14]. If the returning time is long, the residual straw easily accumulates in soil, which causes pests and diseases to proliferate and reduces the crop yield [15]. To address and investigate the correlation between excessive straw and rice-wheat stubble production, we studied the short-term changes in wheat straw for full returning with different tillage treatments.
The whole straw returning process includes harvesting, mixing, and burying. Straw and tillage mechanics are the vital constraints in this loop. The mechanical properties of straw have greatly influenced the cutting tool design and the fuel consumption of the tractor [16], and tillage implements that case soil compaction and solidification [17]. Furthermore, under the annual crop rotations, the straw returned from the previous season might also influence the properties of the soil. Therefore, the dynamic change in the mechanical properties of straw after it is returned to the field is an important topic of tillage mechanics research. To a certain extent, the changes in the micro-structure of the straw during its decomposition can affect the changes in its mechanical properties [18]. For example, the compressive properties of tomatoes or grapes can provide a theoretical basis for fruit harvesting and transport machinery design [19]. The mechanical properties of cotton and sugarcane stalks during harvesting affect the blade design and cutting process of harvesting machinery [12]. The straw of different lengths affects the movement of the straw and soil mixture and the operation of a rotary tiller [12]. Straw can be compacted with soil to stabilize soil structure, and plant stubble and residual roots can solidify soil [20]. The micro-structure of straw can help to explain changes in its mechanical properties, but, currently, there is relatively little research on how the straw micro-structure directly affects the benefits of straw returning [16]. Traditionally, the benefits of returning straw to the field were described in terms of three aspects, namely, straw, soil, and crop. However, it is not easy to realize changes in physical components such as the dry quality of straw in a field experiment. The changes to the component nutrients involve the disposition of various reagents, which has safety risks and is cumbersome [21]. Physical parameters such as the soil water content, bulk density, and porosity are commonly explored in dryland experiments [22] and comparatively difficult for paddy fields. For example, the organic matter, nitrogen, phosphorus, potassium, and other parameters of soil are not easy to test [23], and soil microorganisms and their produced biological enzymes are difficult to collect, extract and test [24] in paddy fields as the fluent water in the paddy field changes the original nutrients state of the soil. Moreover, the growth of the following crop is not only controlled by genes but also by the differences between seeds and individuals. It is vulnerable to factors such as the growth environment and climate. Therefore, it is necessary to determine whether the growth of the next crop is influenced by genes, environment, or by tillage. The extent of the influence of each factor remains to be seen when the crop growth is used to directly indicate the effect of returning straw to the field [25]. Meanwhile, there are obvious difficulties with using traditional indicators for evaluating returning benefits. Some indicators are not necessarily intuitive and persuasive. The mechanical properties of straw not only explain the effect of straw returning directly on harvesting and farming machinery, but also reflect the compaction and solidification state of the returned straw and soil to a certain extent. In addition, the micro-structure can be used to explain changes in the stalk mechanical properties. Therefore, it is necessary to determine the mechanical and structural characteristics of straw to illustrate the benefits of straw returning to the field and machinery design, and reduce the complexity of traditional indicators.
Many studies in the literature have examined the effects of soil tillage, straw type, and the quantity and time of straw returned on the direct straw returning. However, few studies have examined the effects of tillage on straw mechanics and micro-structure to understand the dynamics of soil compaction and solidification. This study used the nylon mesh bag method [26] to examine the short-term full straw return to the field with conventional (plowing), dry rotary, and wet rotary tillage. The shearing, bending, and compressive strengths of wheat stalks were tested at the same moisture content and testing speed. The micro-morphology of the straw surface was observed to determine the potential impact of mechanical properties on soil deformation and solidification in different periods.
2. Materials and Methods
2.1. Experimental Site and Sampling Time
The experiment was conducted at the Comprehensive Demonstration Base of Rice and Wheat Science and Technology of Sihong County, Jiangsu Academy of Agricultural Sciences, located at the longitude and latitude of 118°15′21.90″–118°15′42.38″ E, 33°21′47.50″–33°22′04.53″ N (Figure 1), in the middle reaches of the Huaihe River at 11.6 m above sea level. The soil type is shajiang black soil (local name) according to the Chinese Soil Taxonomy, and clay loam in the US classification scheme. The average soil moisture content, average soil bulk density, and total soil porosity were 23.05%, 1.38 g·cm−3, and 47.85%, respectively at a soil depth of 0–20 cm. The available nitrogen contents of tested subfields 1, 3, 5, 7, and 9 were 163.23, 138.50, 132.63, 125.40, and 144.39 mg kg−1, respectively. The available potassium contents were 207.26, 153.02, 137.73, 146.52, and 171.77 mg kg−1, respectively. The region was specified with rice-wheat rotation from decades, i.e., rice (From 20 June to 20 October)—wheat (Next year from 30 October to 10 June).
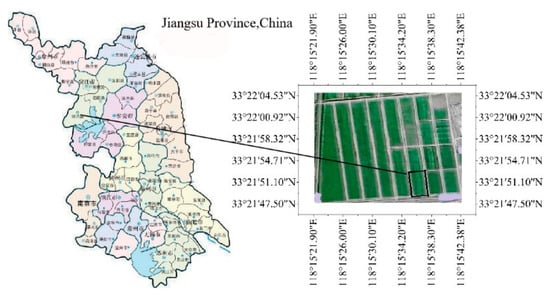
Figure 1.
Experimental site.
The experimental site is situated in the transition zone between north subtropical and warm temperate zone in the East Asian monsoon region. The average annual temperature, precipitation, and sunshine are 14.6 °C, 893.9 mm, and 2326.7 h, respectively. The frost-free period is 213 days, there are 9.2 days of snowfall, and the average annual wind speed is 3.7 m/s. The maximum, minimum temperatures, and average rainfall during the experiment were depicted in Figure 2.
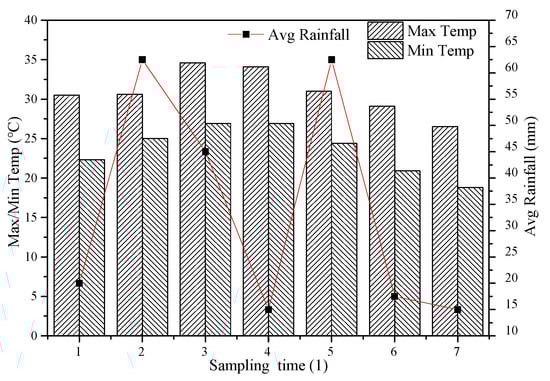
Figure 2.
Distribution of the mean monthly temperature and rainfall during the experiment.
The wheat straw was harvested from June 10 to 15, 2018, and the rice was transplanted from June 18 to 19, 2018. The mature straw was cut manually (dated June 10 to 25), packed in net bags (dated June 27 to 28), and buried underground (June 29). The sampling time was from June 29 (date of the first sample) to September 28, 2018; a total of 7 samples were taken every 15 days.
2.2. Experimental Equipment’s
Following equipment’s were used for measurements.
The TMS-PRO food texture analyzer [27] (American Food Technology Corporation, Virginia, USA), the DHG-series electric thermostatic drying oven (Shanghai Yiheng Scientific Instruments Co., Ltd., Shanghai, China), the OLS 4100 laser confocal microscope(Olympus Corporation, Tokyo, Japan), the electronic balance (Shanghai Yaoxin Electronics Technology Co., Ltd., Shanghai, China), the digital Vernier caliper (Shanghai Meinette Industrial Co., Ltd., Shanghai, China), the ultra-micro grinder (80–300 mesh), the five steel rulers, and the wooden ruler.
2.3. Methods and Order
2.3.1. Method
The single-factor test method was adopted in this experiment. The experiment was carried out in long-term secured field (Figure 3) divided into 9 subfields numbered 1 … 9. Due to dual crop rotation and dual straw retunings to the field, we further separated these subfields into wheat, rice, wheat + rice retunings, and blank (no returnings) groups. Rice harvested in October 2017 and straw returned to subfields 3, 7, and 9, Wheat harvested during the experiment (June 2018) and straw retuned to subfields 1, 3, 5, 7, and 9 while subfields 2, 4, and 8 were kept as non-straw retuning during the whole rotation. Furthermore, subfields 1–4 were plowed while subfields 4–8 and 9 were dry and wet rotary tilled, respectively. The wheat straw was buried in the corresponding subfields and sampled, cleaned, and measured regularly. The planting belt between the subfield and roadside was 6±1 m, and the subfield and isolated belt were separated by a ridge covered with PVC film. Thus, straw returned with different tillage methods could be obtained. After wheat straw was harvested, only five subfields with wheat straw returned to field were tested, i.e., 1, 3, 5, 7, 9.
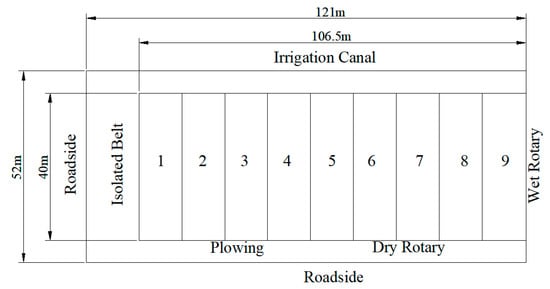
Figure 3.
Field layout.
2.3.2. Experimental Order
The step by step order of the experiment was explained below and also elaborated in Figure 4.
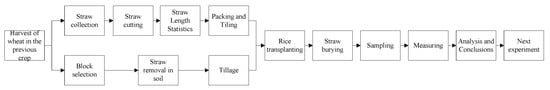
Figure 4.
Order of the experiment.
- Harvest: Wheat was harvested, and straw was collected and cut to lengths of 5–15 cm, while the rest was not cut for manual recovery.
- Field and straw treatments: For non-returning subfields, the straw and stubbles were removed first then plowed and later dry rotary tilled. Furthermore, after plowing, the paddy field was soaked for more than 48 h and then wet rotary tilled. The plow depths of the three tillage methods were 20.05, 13.8, and 19.61 cm, respectively. For the straw: straw was collected artificially and cut to lengths of 5–30 cm in increments of 5 cm with an error of <0.5 cm. It was then packed into net bags to be buried underground with a fresh weight of 200 g.
- Mesh bags: Nylon mesh bags containing straw were buried underground at a depth of 5 cm below the soil and each subfield had six bags.
- Samplings: Initially, wheat straw samples were collected directly after wheat harvested, and further after the rice was transplanted, the straw samples were collected, cleaned, soaked in clear water 50 times or rinsed for 3 min, and oven dried at 80 °C to a constant weight. The samples were then cooled to room temperature for dry quality measurement. Straw samples with a length of 10 cm, no nodes, and relatively complete size were intercepted for the examination of the mechanical properties and microscopic morphology. Finally, the straw was crushed through 100 mesh sieve and packaged in self-sealing bags for component detection [28].
2.4. Experimental Parameters, Measurement, and Analysis Method
Tillage was conducted by Kubota M1004 (Osaka, Japan) halberd plow and ACGO1204 rotary cultivator. The degradation time was designated as the sampling time. A wheat strain called Qianmai 088 was farmed by the Institute of Agricultural Resources and Environment of the Provincial Academy of Agricultural Sciences, Nanjing, China, used in this study. The average plant height of the wheat was 70.58 cm.
The decomposition rate of straw termed as the weight loss or degradation rate, was calculated by using Equation (1) [29]. The total mass was measured for a group of 20 samples and repeated for three groups. The mechanical properties of the wheat stalks were tested with a texture analyzer and compressive, shear, and bending forces were determined (Figure 5). The samples were tested five times and the abortive results were eliminated to get the optimized mean value. The compressive strength [30], three-point bending strength [31], and shear strength [32] were calculated with Equations (2)–(4), respectively.
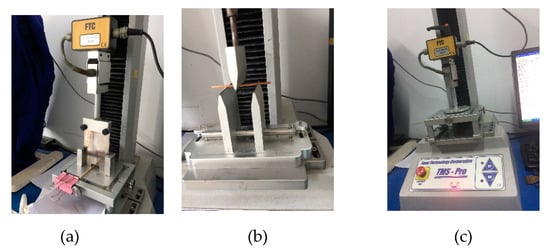
Figure 5.
Wheat stalk shearing, bending, and compression. Note: (a)-shear test, (b)- bending test, (c)-compressive test.
Here, Dr is the decomposition rate (%), m is the initial quality of the straw (g), mx is the xth straw quality after decomposition (g), P is the compressive strength (MPa), F is the maximum destructive force (N), L is the sample length or span (mm), B is the width of the compacted sample (mm), R is the bending strength (MPa), h is the thickness (mm), τ is the shear strength (MPa), Fmax is the maximum failure shear force (N), and A is the cross-section area of the damaged area (mm2).
The surface micro-structure of the wheat stalk was determined by OLS 4100 laser confocal microscopy. The radial length, axial length, X-direction two-point line roughness (Rax), and Y-direction two-point line roughness (Ray) were determined by microscope observation. The corresponding direction, numerical values, and angle range are shown in Figure 6. The principle of straw selection is to observe straw with 5.0 times the visual acuity of normal people and select those without obvious cracks and damage. Before observation, the stalk was cut into halves in the axial direction with an artistic knife, flattened at both ends, and observed with a microscope at 20× magnification. The stalk samples in a single subfield were observed more than five times. After the three lost or failed results were eliminated, the best two times were selected, and samples marked with obvious pits were found.
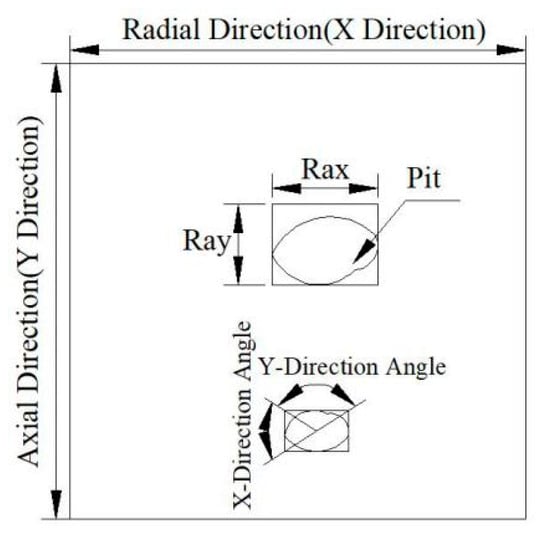
Figure 6.
Micro-surface of a wheat stalk.
The experimental data of the mechanical properties were analyzed with Origin 9.0 (OriginLab Corporation, Northampton, Massachusetts, USA) and Excel 2019 of WPS (Kingsoft Office Corporation, Beijing, China). The microscope images were processed by LEXT-OLS4100 software attached to the OLS4100 laser confocal microscope. The statistical data of decomposition rate and mechanical properties were analyzed with SPSS 24.0. Furthermore, one-way and two-way ANOVA were constructed by LSD method. One-way ANOVA was used to analyze the variations in wheat straw over time, while two-way ANOVA was used to estimate how the mean of a quantitative variable changes according to the levels of two categorical variables (time and tillage method).
3. Results
3.1. Changes in the Wheat Straw Decomposition Rate over Time with Different Tillage
Figure 7 shows the changes in the wheat straw decomposition rate over time with different tillages. Figure 7A, in plowed subfields, the decomposition rate increased linearly for days 0–90 from 20.37 to 45.57% in subfield 1 and from 11.67 to 49.65% in subfield 3. Figure 7B, in the dry rotary tilled subfields, the decomposition rate also increased from 16.73 to 42.28% in subfield 5 for days 0–30 and fluctuated between 42% and 53% for days 30–90 with a slight rise from 42.28 to 52.81%. The decomposition rate also increased from 25.29 to 51.68% in subfield 7 for days 0–30 and fluctuated between 43% and 53% for days 30–90 with a slight decrease from 52.68 to 45.86%. Figure 7C, in the wet rotary tilled field, the decomposition rate in subfield 9 increased from 16.42 to 54.08% for days 0–30 and fluctuated between 45% and 50% for days 30–90 with a slight rise from 54.08 to 47.17%.
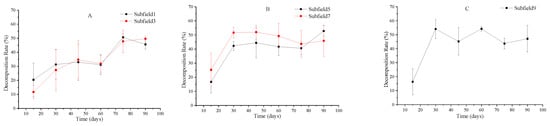
Figure 7.
Changes in the wheat straw decomposition rate over time with different tillages. Note: (A)—Plowing; (B)—Dry rotary; (C)—Wet Rotary.
Conclusively, we can say that, irrespective of tillage methods, the degradation rate of straw gradually increased with the change of returning time, and then fluctuated within a certain range. The difference is that the degradation rate of straw tends to be stable after 75 days under plowing, and after 30 days under dry and water rotations.
3.2. Changes in the Wheat Straw Shear Strength over Time with Different Tillages
Figure 8 shows the changes in shear strength of the wheat straw over time with different tillages. Figure 8A shows that, in the plowed subfields, the shear strength decreased from 40.04 MPa in subfields 1 and 3 to 9.84 and 9.15 MPa, respectively, for days 0–15. These values then decreased slightly to 4.68 and 7.08 MPa, respectively, for days 15–90. Figure 8B details how, in the dry rotary tilled subfields, the shear strength decreased from 40.04 MPa in subfields 5 and 7 to 10.58 and 8.67 MPa, respectively, for days 0–15. These values then decreased slightly to 7.30 and 7.32 MPa, respectively, for days 15–90. Figure 8C describes how, for the wet rotary tilled field, the shear strength decreased from 40.04 MPa to 17.38 MPa for days 0–15 and decreased gradually to 4.71 MPa for days 15–90.
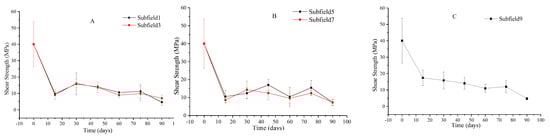
Figure 8.
Changes in the shear strength over time with different tillages. Note: (A)—Plowing; (B)—Dry rotary; (C)—Wet Rotary.
Concisely, we can say that in all tillage methods, the shear strength of the wheat straw was similar to the different tillages for days 0–90 and showed an obvious two-stage trend: a rapid decrease for days 0–15 and a fluctuating and slow decrease for days 15–90.
3.3. Changes in the Wheat Straw Bending Strength over Time with Different Tillages
Figure 9 shows the changes in the bending strength of the wheat straw over time with different tillages. Figure 9A shows that, in the plowed subfields, the bending strength decreased from 141.47 MPa in subfields 1 and 3 to 90.39 and 70.98 MPa, respectively, for days 0–15. These values then decreased slightly to 38.47 and 53.25 MPa, respectively, for days 15–90. Figure 9B demonstrates how, in the dry rotary tilled subfields, the bending strength decreased from 141.47 MPa in subfields 5 and 7 to 59.75 and 54.68 MPa, respectively, for days 0–15. These values then decreased slightly to 53.36 and 52.07 MPa, respectively, for days 15–90. Figure 9C shows that, in the wet rotary tilled field, the bending strength decreased rapidly from 141.47 MPa in subfield 9 to 84.52 MPa for days 0–15 and then decreased slightly to 48.53 MPa for days 15–90.
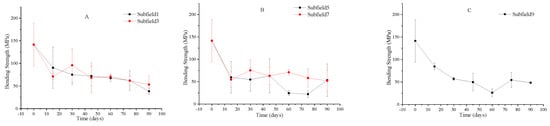
Figure 9.
Changes in the bending strength over time with different tillages. Note: (A)—Plowing; (B)—Dry rotary; (C)—Wet Rotary.
Briefly, under all tillage methods, the trend of bending strength with the different tillages was similar for days 0–90 and showed an obvious two-stage trend: a rapid decline for days 0–15 followed by a fluctuating and slow decrease for days 15–90, but the final bending strength with the plowing and dry rotary tillage methods were different for days 0–90.
3.4. Changes in the Wheat Straw Compressive Strength over Time with Different Tillages
Figure 10 shows the changes in the compressive strength of the wheat straw over time with different tillages. Figure 10A shows how, in the plowed subfields, the compressive strength decreased from 0.87 MPa in subfields 1 to 0.26 for days 0–15, then the values increased 88.09 MPa for 15–45 days, and it decreased to 16.65 during 45–75 days and increased to 55.98 MPa; the compressive strength decreased from 0.87 MPa in subfields 3 to 0.26 MPa for days 0–75. However, these values increased to 0.26 and 0.58 MPa for days 75–90, respectively. Figure 10B shows that, in the dry rotary tilled subfields, the compressive strength decreased linearly from 0.87 MPa in subfields 5 to 0.16 for days 0–75. However, these values increased to 0.16 and 0.54 MPa, respectively, for days 75–90. the compressive strength decreased linearly from 0.87 MPa in subfields 7 to 0.21 MPa, for days 0–60. However, these values increased to 0.49 MPa for days 75–90. Figure 10C demonstrates how, in the wet rotary tilled field, the compressive strength of wheat straw decreased linearly from 0.87 MPa to 0.2 MPa in subfield 9 for days 0–75. However, it increased to 0.42 MPa for days 75–90.
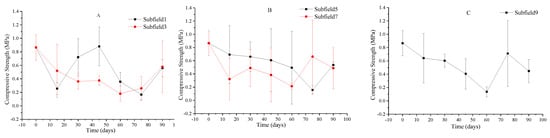
Figure 10.
Changes in the compressive strength over time with different tillages. Note: (A)—Plowing; (B)—Dry rotary; (C)—Wet Rotary.
To sum up the results we can say that, no matter what tillage methods, the trend of compressive strength with the different tillages was similar for days 0–90 and showed an obvious two-stage trend: a linear decrease for days 0–75 and an increase for days 75–90, but the final bending strength with the plowing and dry rotary tillage methods were different for days 0–90.
3.5. One Way ANOVA of the Wheat Straw over Time
Returning time is one of the most important indicators that affect straw degradation. In this paper, the 1-way ANOVA was carried out for the distribution of quality degradation rate and mechanical strength of straw in different tillage methods. It can be seen from the Table 1 that, under different tillage methods, the degradation rate of straw in different time has p < 0.05, and the change of the degradation rate of straw in different time periods has significant difference, among which the difference is very significant in fields 3, 5 and 9; under different tillage methods, the shear strength of straw in different time has p < 0.05. The difference of straw shear strength is very significant in different time periods. Under different tillage methods, the bending strength of straw in different time periods has p < 0.05, and the bending strength of straw in different time periods has significant difference, in which, p < 0.05 in nine fields, thus, the bending strength of straw is extremely significant. Under different tillage methods, for the compression strength of straw p < 0.05 in subfield 1, the compressive strength of straw is very significant, but in subfields 3, 5, 7, 9, for the compressive strength of straw p > 0.05, the compressive strength of straw is not significant at different times.

Table 1.
One way ANOVA of the wheat straw over time.
Succinctly, in addition to the compressive strength of straw returned to the field corresponding to 3, 5, 7 and 9 fields, the degradation rate, shear strength and compressive strength of straw change significantly with time under different tillage methods, which shows that the time of returning to the field has a great impact on the quality degradation, shearing strength and bending strength of straw.
3.6. Two Way ANVOA of the Wheat Straw under Different Tillage and Time
In this paper, time and tillage methods of 2-way ANVOA are shown in Table 2 below. It can be seen from the table that in terms of time alone, all of them have p < 0.05, indicating that the change of straw degradation rate and mechanical strength is significant in the field returning time, which is consistent with the variance analysis of single factor. In terms of tillage method alone, except for subfields 3, 7, 9, the p value of the degradation rate is < 0.05, indicating that the change of straw quality degradation is significant in the field returning time. All of them have p > 0.05, indicating that the change of straw quality degradation is significant in the field returning time There was no significant difference in the degradation rate and mechanical properties of straw in terms of the means of cultivation. Regarding the interaction between cultivation and returning time, except for the degradation rate (for which p < 0.05 corresponding to 3, 7, 9 subfields), which indicated that the quality degradation of straw in terms of tillage was significant, the rest of the treatments were tested at p > 0.05, which showed that the degradation rate and mechanical properties of straw in terms of tillage were not significant.
Table 2.
Two-way ANOVA of the wheat straw over time.
To sum up, no matter what kind of tillage method, the quality degradation and mechanical properties of straw changed significantly when returning to the field; only subfields 3, 7, 9 had significant difference when returning to the field from farming alone, which indicated that the quality degradation of straw changed greatly when returning to the field for a long time, and had little effect on the mechanical properties.
3.7. Microstructural Changes of the Stalk with Different Tillage and Time
3.7.1. Original Micro-Structure of Wheat Stalk
Figure 11 shows the micro-Structure of a wheat stalk that was not returned to the field and magnified 20× with an OLS 4100 laser confocal microscope. The radial and axial lengths of the largest pits (black box) of the wheat straw were 25.69 and 22.62 µm respectively, and the linear roughness’s Rax and Ray at the largest pits were 4.51 and 0.84 µm, respectively. Except for the axial breakage of the straw caused by artificial cutting, the external surface was relatively complete, the grain was clear, and there were no large pits on the surface. This indicated that the straw had not been damaged by decomposition.
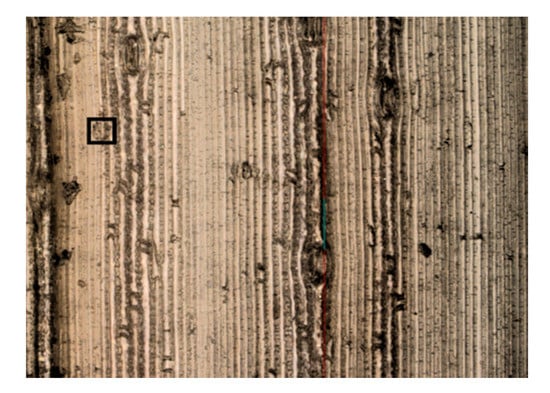
Figure 11.
Original micro-structure of the wheat stalk.
3.7.2. Micro-Structure of the Wheat Stalk over Time with Plowing Tillage
The wheat straw returned to subfield 1 with plowing tillage was taken as an example. Figure 12a–f shows the micro-structure of the straw sampled 2–7 times at a magnification of 20×. The sample met the selection criteria described in step 4 of Section 2.3.2. The specific measurement position is indicated by the black box.
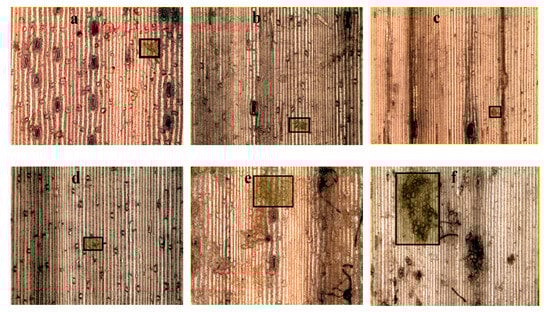
Figure 12.
Measurement site of the wheat stalk at different times with plowing tillage. Note: (a–f)—2, 3, 4, 5, 6, 7 samplings with plowing tillage.
Figure 13 shows the changes in the wheat straw micro-structure over time when returned to a plowed field. Figure 13a shows that the radial and axial lengths of the largest pit on the wheat stalk fluctuated from 30 µm to 60 µm for days 0–45: from 31.92 and 33.32 µm to 143.71 and 247.96 µm, respectively. Figure 13 b shows that Rax fluctuated around 3 µm for days 0–30 rose from 2.92 µm to 6.89 µm for days 30–60, and finally fluctuated between 6.40 and 6.89 µm for days 60–90. Ray slightly increased for days 0–90, but Rax was always greater than Ray.
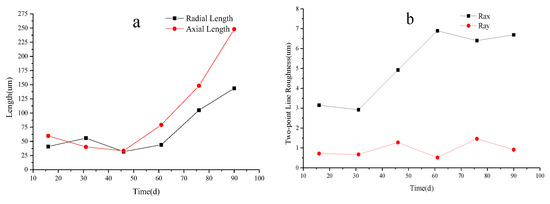
Figure 13.
Micro-structure of the wheat stalk over time with plowing tillage. Note: (a) Changing of radial and axial length over time with plowing tillage, (b) Changing of Rax and Ray over time with plowing tillage.
Conclusively, the Radial Length and Axial Length of the wheat straw fluctuated at a lower value and continually increased. This showed that the pits became larger, and the potential break point may happen; the Rax and Ray initially increased and fluctuated at a certain higher value, this showed that the roughness became larger, the fiber was destroyed and became smooth.
3.7.3. Micro-Structure of the Wheat Stalk over Time with Dry Rotary Tillage
The wheat straw returned from subfield 5 with dry rotary tillage was taken as an example. Figure 14a–f shows the measurement location (black box) of the 2nd to 7th samplings.
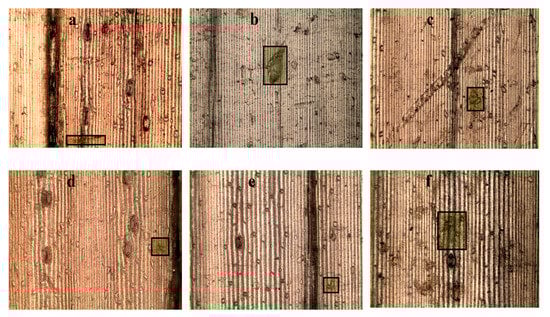
Figure 14.
Measurement site of the wheat stalk over time with dry rotary tillage. Note: (a–f)—2, 3, 4, 5, 6, 7 samplings with dry rotary tillage.
Figure 15 shows the changes in the wheat straw micro-structure over time with dry rotary tillage. Figure 15a shows that the radial length of the largest pit on the stalk decreased linearly from 112.68 µm to 36.66 µm for days 0–75 and then increased rapidly to 85.13 µm for days 75–90. The axial length of the largest pit on the stalk increased rapidly from 39.56 µm to 101.84 µm for days 0–30, decreased linearly to 32.02 µm for days 30–60, and increased rapidly to 117.38 µm for days 60–90. Figure 15b shows that Rax increased slowly from 3.37 µm to 3.94 µm for days 0–45 and then to 6.60 µm for days 45–60. It then decreased to 3.12 µm for days 60–90 before rising slightly to 3.90 µm. Ray fluctuated between 0.47, 2.35, and 0.69 µm for days 0–45 and then increased to 6.61 µm for days 45–60 days. For days 60–90, Ray fluctuated between 6.61, 0.53, and 0.55 µm. Rax was always greater than Ray for days 0–90.
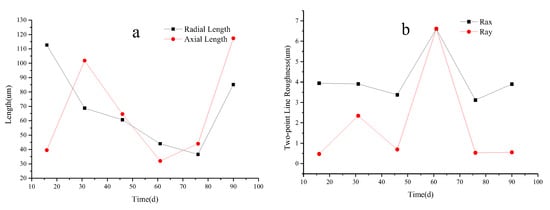
Figure 15.
Micro-structure of the wheat stalk over time with dry rotary tillage. Note: (a) Changing of radial and axial length over time with dry rotary tillage, (b) Changing of Rax and Ray over time with dry rotary tillage.
Concisely, the changing trend of the micro-structure parameters showed different trend in plowing and dry rotary tillage. The changing of data was not consistently increased or decreased, which showed that changing of the pits was not relative to the returning time and tillages.
3.7.4. Micro-Structure of the Wheat Stalk over Time with Wet Rotary Tillage
The wheat straw returned to the paddy field 9 with wet rotary tillage was taken as an example. Figure 16a–f shows the measurement position (black box) of the 2nd to 7th samplings.
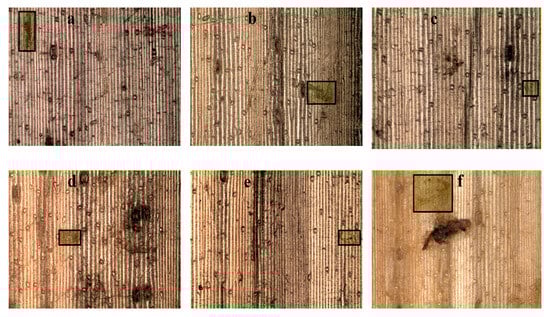
Figure 16.
Measurement site of the wheat stalk over time with wet rotary tillage. Note: (a–f)—2, 3, 4, 5, 6, 7 sampling with dry rotary tillage.
Figure 17 shows the change in the wheat straw micro-structure over time. Figure 17a shows that the radial length of the largest pit on the stalk increased slowly from 40 µm to 70 µm for days 0–75 and increased rapidly from 68.13 µm to 135.26 µm for days 75–90. The axial length of the largest pit decreased from 141.935 µm to 52.16 µm for days 0–30 and then fluctuated around 50 µm for days 30–75 before increasing from 41.43 µm to 102.95 µm for days 75–90. Figure 17b shows that Rax fluctuated from 2.58 µm to 4.07 µm for days 0–75 and rose from 3.48 µm to 6.60 µm for days 75–90. Ray fluctuated from 0.58 µm to 1.35 µm for days 0–75 and rose from 0.58 µm to 2.61 µm for days 75–90. Rax was always larger than Ray for days 0–90.
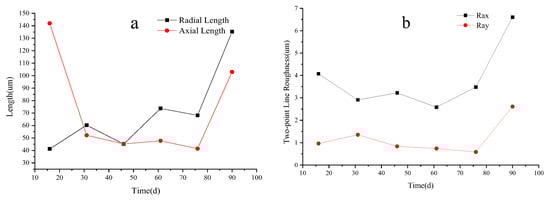
Figure 17.
Micro-structure of a wheat stalk over time with wet rotary tillage. Note: (a) Changing of radial and axial length over time with wet rotary tillage, (b) Changing of Rax and Ray over time with wet rotary tillage.
From the data above, we can conclude that the changing trend of the pit indexes was different in plowing, dry rotary, and wet rotary. These changing trends depicted that the changing of the pit is not relatively connected with returning time and tillages.
4. Discussion
4.1. Analysis of the Straw Decomposing Rate over Time in Different Tillages
The mechanical properties of the wheat stalk affected by the soil compaction and solidification, while the micro-structure affected the changes in the mechanical properties [16]. This study examined the changes in the wheat straw decomposition rate, mechanical properties, and micro-structure with different tillages over time when straw was returned to the field. The results explained the effect of wheat straw decomposition with the short-term total return to the field and the potential effects of the straw properties on crop harvesting machinery, soil tillage, and soil compaction and solidification [33].
Moreover, under all tillage methods, the decomposition rate gradually increased over time, and then fluctuated within a certain higher range. The reason for this might be that the nutrients in wheat straw may degrade over time; the protein and easy decomposing leaves were applied by the microorganism in the paddy soil, and the decomposing rate will increase gradually. When the easily decomposing leaves had completely finished degrading, the rest of the stalk was stiff and did not decompose easily, resulting in fluctuated decomposing values at a higher range. From the data measured during the experimental time, the maximum decomposition rate of the returned wheat straw reached 50.65%, 52.81%, and 54.08% with plowing, dry rotary, and wet rotary tillages, respectively, over 90 days. The decomposition rate of 50% is slightly higher than that of previous research results [34]. The decomposition rate increases slowly with plowing and dry rotary tillage methods. This may be because the straw was buried in the immersed soil of the paddy field, which was not only eroded by water [35] but also immersed and roasted during the rice cultivation process. The straw degradation process is more complex than that of a simulated experiment from other researches, and the level of degradation was always higher than that of aerobic, anaerobic, or both fermentation processes. Note that the wheat straw was buried in the paddy field with no decomposing agent added. At present, research on straw returning has been focused on dryland [29], which is easy to implement. In contrast, research on changes to the decomposition rate of straw returned to paddy subfields are mostly confined to a laboratory simulation. The experimental conditions are mild and controllable, and the experimental implementation is relatively easy [10]. The present study considered the full amount of wheat straw returned with plowing, dry rotary tillage, and wet rotary tillage; the field experiment was real, and the tillage modes considered are mainstream. Moreover, no decomposing agent was added to the returned straw, and no new biological bacteria were introduced, so the original microbial ecological balance was not destroyed [24]. This experiment provides relatively factual results and generally did not adversely affect the original farmland ecosystem. In addition, it was easy to implement and promote.
4.2. Analysis of the Straw Mechanical Properties over Time in Different Tillages
The shear, bending, and compressive strengths of the returned wheat straw showed a two-stage trend. The main reason for this may be that the wheat straw was fragmented when initially returned to the field (days 0–15). The fresh wheat straw with high moisture content was completely immersed in water and degraded not only by microorganism corrosion [10] but also by water erosion. The shear and bending strengths thus decreased rapidly. The shear and bending strengths of the returned straw fluctuated and decreased slightly for days 15–90. This may be because of the integrity of straw, water erosion, and microbial decomposition. The soft tissue degraded and weakened, which compromised the integrity of the straw fibers and led to a slow decline in the shear and bending strengths. The compressive strength decreased for days 0–75. Water erosion and microorganisms acted on the returned wheat straw, and the compromised soft tissue [36] and dry quality of the straw reduced the compressive strength. The compressive strength increased for days 75–90. This is probably because the straw became empty vascular bundles and lost the compressive buffer of soft tissue [37]. When wheat straw was not returned to the field, the shear and bending strengths were relatively high, which shows that it has strong shear and bending properties when harvested. This will impact the tool life and energy consumption of harvesting machinery [30]. When straw is returned to the field, the shear and bending properties of the straw will cause resistance to the machine and increase the power consumption of tillage [38]. Returned wheat straw and soil mix to varying degrees. The bending and shear resistance of the wheat straw make it maintain a certain shape [39]. In soil, straw plays a role similar to that of steel in reinforced concrete. Incorporating wheat straw in the soil reduces water erosion and the flow of soil particles and strengthens soil solidification. The compressive strength of the stalk mainly affects soil compaction because the tubular structure induces compressive deformation and deformation recovery [40]. Therefore, the shear, bending, and compressive strengths of the wheat stalk have different effects on the soil solidification stability and compaction when straw is returned to the field [33].
4.3. Analysis of the Reasonable Data of Decomposing and Mechanical Properties Based on the Mesh Bag Method
In this study, the mesh bag method was used to easily collect the wheat stalk samples. However, compared with the greenhouse experiment, the net bag method showed a relatively real field environment. Furthermore, the data of degradation rate and mechanical properties obtained through the net bag method have the potential to illustrate the degradation effect of mechanical crushing’s of straw returning to field. So, we explained the wheat decomposition, the difference between the real returning wheat in the soil and that of the mesh bag method, and their physical parameters like length, integrity, etc. Additionally, the degrading of straw may also link with the quantity and type of microorganism in the paddy field. The length of the straw became smaller and was destroyed by harvesting, plowing, and rotary machines. The straw will be completely mixed and the fungus could absorb nutrients from the returning straw. The physical parameters were the influencing factors in terms of accelerating decomposition. Therefore, compared with the field experiment, if the degradation rate of straw is higher and the value of mechanical strength drops fast when using the mesh bag method, we can conclude that the mechanical straw crushing and returning to the field achieved better degradation results.
4.4. Analysis of One-Way and Two-Way ANOVA
A single factor analysis of variance (ANOVA) was run to study the changes in straw degradation rate and mechanical properties with time. With significant effects (p < 0.05) as indicated by ANOVA results, the time of returning to the field had a great influence on straw degradation and mechanical properties. This shows that with the extension of returning time, straw in the soil can be in close contact with soil microorganisms, and straw can be continuously decomposed. Furthermore, the variance analysis of two factors of straw degradation rate and mechanical properties with time showed that the straw degradation rate of subfields 3, 7, 9 was p < 0.05, which indicated that the straw degradation rate was affected by the tillage method, returning time and the interaction between them. The difference between subfields 3, 7, 9, and 1, 5 was that subfields 3, 7, 9 carry out continuous and incessant straw returning compare to subfields 1 and 5. The continuous returning may have a cumulative effect on the degradation of straw. However, according to the two-factor analysis of variance under different methods, the interaction between tillage methods and time is not significant. The reason for this may be that there is no direct contact between the net bag method and tillages, and the influence of tillages on straw degradation mainly comes from the redistribution of the soil microorganism; straw itself is anisotropic material and the change of mechanical strength of straw is greatly affected by itself. Therefore, when evaluating the degradation performance of straw, the change of mechanical properties of straw cannot be used as the evaluation standard.
4.5. Analysis of Micro-Structure
The radial and axial lengths of the largest pit on the wheat stalk did not increase or decrease regularly over time, but were greater than the lengths before the wheat straw was returned to the field. This indicates that returned straw decomposed to a certain extent, and changed its micro-structure. This may be due to water erosion [35], microbial action [41], and other comprehensive effects, but the micro-structure did not show a regular trend. Rax and Ray did not show a regular trend with time, and the observed positions of Rax and Ray were not necessarily larger than those of the non-returned wheat straw. This may be related to the location and pit size of the selected straw; the soft tissue was weak at the largest pit owing to water erosion, so Rax and Ray were relatively small. However, Rax was always greater than Ray for different tillages. This is mainly due to the composition of the straw [37]. Straw fibers do not degrade easily, but the parts connected with straw fibers degrade relatively easily. This is why Rax was larger than Ray. This is also consistent with previous research results [36]. In summary, the radial length, axial length, Rax, and Ray of the largest pit in the wheat straw micro-structure cannot explain the degree of degradation, but the largest pit can indicate the presence of degradation. Rax was higher than Ray, which indicates that the straw fiber connections degrade more easily than the straw fiber. The pit size and changes to Rax and Ray may affect the mechanical properties of the wheat stalk. Overall, the changing of the pits in the returning straw may not be relative to returning time. These parameters (radial and axial length, Rax and Ray) are not sufficient to evaluate the effects of straw returning.
5. Conclusions
This study examined the effects of different tillage methods on the short-term fluxes of straw mechanics and micro-structure under full straw return to field. Findings depicted that, under different tillage methods for 0–90 days, the mass of the wheat straw decreased rapidly and the decomposition rate increased quickly over time. Furthermore, the decomposing rate was comparatively found higher in plowing than dry and wet tillage. Additionally, the mechanical strength of the wheat stalk decreased rapidly, while the bending and compressive strength showed a two-stage changing trend for all tillages during 0–90 days. These changing properties showed that the straw mechanics would be destroyed, and the straw morphology would be complete. Moreover, if the straw is not accumulated in a single season, it would degrade rapidly in next season, irrespective of tillage methods. Moreover, the changing of the wheat straw micro-structure was different under similar conditions, which showed that there is no uniform changing trend by the test methods of the wheat stalk micro-structure. Therefore, it might not be reasonable to study the micro-structure of straw to evaluate the degradation of straw.
Conclusively, we could say that the tillage methods have significant impact on the straw degradation rate in continuous returnings, but non-significant impact on alternate returnings and the mechanical strength change of straw. This showed that tillage methods might not be the direct factors affecting straw morphology. Based on the findings of this study we recommend that experimental methods need to be improved in the future.
Author Contributions
Conceptualization, X.W., Q.D., S.Y., and Y.W.; methodology, X.W., Q.D., S.Y., and Y.W.; software, Y.W.; validation, X.W., Y.W., A.A., Y.S., M.R.O.O., S.Y., Q.D., and G.S.; formal analysis, A.A. and Y.W.; investigation, Y.W.; resources, Y.W.; data curation, X.W., Q.D., and Y.W; writing—original draft preparation, Y.W; writing—review and editing, A.A., and Y.S.; visualization, A.A.; supervision, X.W., Q.D., G.S., and Y.W.; project administration, X.W.; funding acquisition, X.W.
Funding
This research was funded by the Jiangsu Agricultural Science and Technology Innovation Fund of Jiangsu Provincial Department of Finance, grant number CX (17)1002.
Acknowledgments
We acknowledge all equipment supported by Jiangsu Academy of Agricultural Sciences. Teacher Gu Dongxiang was very friendly to me and helped me figure out problems during parameter measuring.
Conflicts of Interest
The authors declare no conflict of interest.
References
- Liu, Z.P.; He, R.Y. Analysis on mechanized production mode of rice and wheat rotation area in Jiangsu Province. J. Chin. Agric. Mech. 2017, 38, 112–116, (In Chinese with English Abstract). [Google Scholar]
- Ping, Y.H. Research on crop straw storage and transportation system in Jiangsu. J. Chin. Agric. Mech. 2014, 35, 326–330, (In Chinese with English Abstract). [Google Scholar]
- Lin, B.; He, J. Is biomass power a good choice for governments in China? Renew. Sustain. Energy Rev. 2017, 73, 1218–1230. [Google Scholar] [CrossRef]
- Chang, Z.Z.; Chen, X.H.; Yang, S.J.; Wang, D.J.; Shi, Z.L.; Zhang, S.M. A review on technique for rice and wheat straws returning and utilization. Jiangsu J. Agric. Sci. 2014, 30, 909–914, (In Chinese with English Abstract). [Google Scholar]
- Li, X.S.; Wu, N.; Liu, L.; Feng, Y.P.; Xu, X.; Han, H.F.; Ning, T.Y.; Li, Z.J. Effects of different straw recycling and tillage methods on soil respiration and microbial activity. Chin. J. Appl. Ecol. 2015, 26, 1765–1771, (In Chinese with English Abstract). [Google Scholar]
- Zhang, X.; Xin, X.; Zhu, A.; Yang, W.; Zhang, J.; Ding, S.; Mu, L.; Shao, L. Linking macro aggregation to soil microbial community and organic carbon accumulation under different tillage and residue managements. Soil Tillage Res. 2018, 178, 99–107. [Google Scholar] [CrossRef]
- Li, Y.Z.; Xiao, G.B.; Xiao, X.J.; Zhong, Y.J.; Chen, M.; Xia, G.L.; Huang, Q.R. Effects of fertilization and tillage patterns on the dynamic of soil profile moisture content and corn yield in red soil under seasonal drought conditions. Res. Soil Water Conserv. 2014, 21, 78–83, (In Chinese with English Abstract). [Google Scholar]
- Wang, S.L.; Wang, H.; Li, J.; Lv, W.; Chen, N.N.; Li, J. Effects of long-term straw mulching on soil organic carbon, nitrogen and moisture and spring maize yield on rain-fed croplands under different patterns of soil tillage practice. Chin. J. Appl. Ecol. 2016, 27, 1530–1540, (In Chinese with English Abstract). [Google Scholar]
- Tan, Y.; Wu, D.; Bol, R.; Wu, W.; Meng, F. Conservation farming practices in winter wheat–summer maize cropping reduce GHG emissions and maintain high yields. Agric. Ecosyst. Environ. 2019, 272, 266–275. [Google Scholar] [CrossRef]
- Wang, Z.J.; Wang, Z.Y.; Si, A.L.; Zhang, Z.; Wu, J.; Wang, L.L. Effect of synchronously burying and returning straw and biogas slurry to soil on straw decomposition. Trans. Chin. Soc. Agric. Mach. 2017, 48, 271–277, (In Chinese with English Abstract). [Google Scholar]
- Li, R.; Ruan, X.; Bai, Y.; Ma, T.; Liu, C. Effect of wheat-maize straw return on the fate of nitrate in groundwater in the Huaihe River Basin, China. Sci. Total Environ. 2017, 592, 78–85. [Google Scholar] [CrossRef] [PubMed]
- Fang, H.; Zhang, Q.; Chandio, F.A.; Guo, J.; Sattar, A.; Arslan, C.; Ji, C. Effect of straw length and rotavator kinematic parameter on soil and straw movement by a rotary blade. Eng. Agric. Environ. Food 2016, 9, 235–241. [Google Scholar] [CrossRef]
- Tian, Y.S.; Yao, Z.L.; Ouyang, S.P.; Zhao, L.X.; Meng, H.B.; Hou, S.L. Physical and chemical characterization of biomass crushed straw. Trans. Chin. Soc. Agric. Mach. 2011, 42, 124–128, 145, (In Chinese with English Abstract). [Google Scholar]
- Dong, W.; Liu, E.; Wang, J.; Yan, C.; Li, J.; Zhang, Y. Impact of tillage management on the short- and long-term soil carbon dioxide emissions in the dryland of Loess Plateau in China. Geoderma 2017, 307, 38–45. [Google Scholar] [CrossRef]
- Xu, J.; Han, H.; Ning, T.; Li, Z.; Lal, R. Long-term effects of tillage and straw management on soil organic carbon, crop yield, and yield stability in a wheat-maize system. Field Crop. Res. 2019, 233, 33–40. [Google Scholar] [CrossRef]
- Liu, Q.T.; Qu, Y.G.; Qing, S.L.; Wang, W.Z. Study progress on mechanics properties of crop stalks. Trans. Chin. Soc. Agric. Mach. 2007, 38, 172–176, (In Chinese with English Abstract). [Google Scholar]
- Chen, Z.G.; Wang, D.F.; Li, L.Q.; Shan, R.X. Experiment on tensile and shearing characteristics of rind of corn stalk. Trans. Chin. Soc. Agric. Eng. 2012, 28, 59–65, (In Chinese with English Abstract). [Google Scholar]
- Cao, W.C.; Xue, Y.F.; Zhou, J.G. Study on shearing properties of tea shoot. J. Zhejiang Agric. Univ. 1995, 21, 11–16, (In Chinese with English Abstract). [Google Scholar]
- Wang, R.; Jiao, Q.Y.; Wei, D.Q. Determination of macromechanic parameters of grapes and tomatoes. Trans. Chin. Soc. Agric. Eng. 2004, 20, 54–57, (In Chinese with English Abstract). [Google Scholar]
- Kronbergs, E. Mechanical strength testing of stalk materials and compacting energy evaluation. Ind. Crop. Prod. 2000, 11, 211–216. [Google Scholar] [CrossRef]
- Nan, X.X.; Tian, X.X.; Zhang, L.; You, D.H.; Wu, Y.H.; Cao, Y.X. Decomposition characteristics of maize and wheat straw and their effects on soil carbon and nitrogen contents. Plant Nutr. Fertil. Sci. 2010, 16, 626–633, (In Chinese with English Abstract). [Google Scholar]
- Memon, M.; Guo, J.; Tagar, A.; Perveen, N.; Ji, C.; Memon, S.; Memon, N. The effects of tillage and straw incorporation on soil organic carbon status, rice crop productivity, and sustainability in the rice-wheat cropping system of Eastern China. Sustainability 2018, 10, 961. [Google Scholar] [CrossRef]
- Yang, H.; Yang, B.; Dai, Y.; Xu, M.; Koide, R.T.; Wang, X.; Liu, J.; Bian, X. Soil nitrogen retention is increased by ditch-buried straw return in a rice-wheat rotation system. Eur. J. Agron. 2015, 69, 52–58. [Google Scholar] [CrossRef]
- Chen, Z.; Wang, H.; Liu, X.; Zhao, X.; Lu, D.; Zhou, J.; Li, C. Changes in soil microbial community and organic carbon fractions under short-term straw return in a rice–wheat cropping system. Soil Tillage Res. 2017, 165, 121–127. [Google Scholar] [CrossRef]
- Chen, J.; Zheng, M.-J.; Pang, D.-W.; Yin, Y.-P.; Han, M.-M.; Li, Y.-X.; Luo, Y.-L.; Xu, X.; Li, Y.; Wang, Z.-L. Straw return and appropriate tillage method improve grain yield and nitrogen efficiency of winter wheat. J. Integr. Agric. 2017, 16, 1708–1719. [Google Scholar] [CrossRef]
- Fang, Z.C.; Liu, Y.T.; Ding, W.M.; Chen, Y.L.; Qin, K. Effect of microbial spraying on wheat and rice straw returning to ditch. Trans. Chin. Soc. Agric. Eng. 2015, 31, 187–194, (In Chinese with English Abstract). [Google Scholar]
- Chen, K.J.; Ji, F.F.; Xu, J.Q. Experiment on pelationships among physiological maturity, features of beef muscle fiber and beef tenderness. Trans. Chin. Soc. Agric. Mach. 2018, 49, 375–381, (In Chinese with English Abstract). [Google Scholar]
- Sun, Y.; Chu, X.D.; Qu, J.B.; Liu, J.M.; Wang, Y.P. Effect of different pretreatments of corn straw on seedling bowl preparation. J. Northeast Agric. Univ. 2017, 48, 79–87, (In Chinese with English Abstract). [Google Scholar]
- Gong, Z.P.; Deng, N.Z.; Song, Q.L.; Li, Z.T. Decomposing characteristics of maize straw returning in Songnen Plain in long-time located experiment. Trans. Chin. Soc. Agric. Eng. 2018, 34, 139–145, (In Chinese with English Abstract). [Google Scholar]
- Sun, L.; Zhao, H.J.; Li, S.L. Compression and shear properties of wheat stalk. Acta Univ. Agric. Boreali-occidentalis 1998, 26, 111–114, (In Chinese with English Abstract). [Google Scholar]
- Zhang, K.F.; Li, H.; He, Y.J.; Wang, W.Z.; Yu, Y.C. Experimental study on mechanical properties of soybean straw. Soybean Sci. 2016, 35, 306–309, (In Chinese with English Abstract). [Google Scholar]
- Chen, J.; Zhang, L.H.; Tan, T. Study on shearing properties of soybean straw. J. Hunan Agric. Univ. (Nat. Sci.) 2017, 43, 98–102, (In Chinese with English Abstract). [Google Scholar]
- Bai, Y.H.; Zha, X.; Zha, R.B.; Zhang, J.; Dai, J.M.; Wang, L.Y.; Liu, C.; Fan, Z.H. Effects of straw mulching on soil erosion benefits and runoff shear force under simulated rainfall. J. Soil Water Conserv. 2017, 31, 94–99, (In Chinese with English Abstract). [Google Scholar]
- Wang, J.; Zhang, L.; Pang, H.C.; Zhang, J.T. Returning granulated straw for accelerating decomposition rate and improving soil fertility. Trans. Chin. Soc. Agric. Eng. 2017, 33, 177–183, (In Chinese with English Abstract). [Google Scholar]
- Guo, W.J.; Huang, G.B.; Wang, F.E. Research progress on mechanics of crop growth. J. Gansu Agric. Univ. 2005, 40, 555–559, (In Chinese with English Abstract). [Google Scholar]
- Gao, M.X.; Guo, K.Q.; Yang, Z.P.; Li, X.S. Study on mechanical properties of corn stalk. Trans. Chin. Soc. Agric. Mach. 2003, 34, 47–49, 52, (In Chinese with English Abstract). [Google Scholar]
- Guo, Q.; Zhang, X.L.; Xu, Y.F.; Li, P.P.; Chen, C. Micro-structure and shear mechanical properties of eggplant rattan straw. Jiangsu Agric. Sci. 2018, 46, 189–192, (In Chinese with English Abstract). [Google Scholar]
- Nasseri, A. Energy use and economic analysis for wheat production by conservation tillage along with sprinkler irrigation. Sci. Total Environ. 2019, 648, 450–459. [Google Scholar] [CrossRef]
- Liu, Q.T.; Qu, Y.G.; Yuan, N.X. Bending load induced failure forms of sugarcane stalks. Trans. Chin. Soc. Agric. Eng. 2004, 38, 6–9, (In Chinese with English Abstract). [Google Scholar]
- Liang, L.; Guo, Y.M. Correlation study of biomechanical properties and morphological characteristics of crop stalks. Trans. Chin. Soc. Agric. Eng. 2008, 24, 1–6, (In Chinese with English Abstract). [Google Scholar]
- Wang, Z.J.; Wang, Z.Y.; Zhang, Z.; Lin, G.Y.; Liu, Z.; Cui, F. Effect of biochar on decomposition characteristics of corn Stover presoaked with Digestate in soil. Trans. Chin. Soc. Agric. Mach. 2018, 49, 279–285, (In Chinese with English Abstract). [Google Scholar]
© 2020 by the authors. Licensee MDPI, Basel, Switzerland. This article is an open access article distributed under the terms and conditions of the Creative Commons Attribution (CC BY) license (http://creativecommons.org/licenses/by/4.0/).