Article

Soybean Fertilized by P-Phases from Bagasse-Based Materials: P-Extraction Procedures, Diffusive Gradients in Thin Films (DGT), and X-ray Diffraction Analysis (XRD)

by
Hannes Herzel
1,*,†,
Vitalij Dombinov
2,*,†,
Christian Vogel
1,
Sabine Willbold
3,
Gabriel Vettorazzi Levandowski
4,
Martin Meiller
5,
Felix Müller
6,
Joachim Werner Zang
7,
Warde Antonieta da Fonseca-Zang
7,
Nicolai David Jablonowski
2,
Silvia Diane Schrey
2 and
Christian Adam
1
1
Bundesanstalt für Materialforschung und-prüfung (BAM), Division 4.4 Thermochemical Residues Treatment and Resource Recovery, Unter den Eichen 87, 12205 Berlin, Germany
2
Institute of Bio- and Geosciences, IBG-2: Plant Sciences, Forschungszentrum Jülich GmbH, 52428 Jülich, Germany
3
Central Institute for Engineering, Electronics and Analytics, Analytics (ZEA-3), Forschungszentrum Jülich GmbH, 52425 Jülich, Germany
4
Escola de Agronomia, Universidade Federal de Goiás (UFG), CEP 74.690-900 Goiânia, Brazil
5
Fraunhofer UMSICHT, Energy Technology, 92237 Sulzbach-Rosenberg, Germany
6
TU Clausthal (CUTEC), 38678 Clausthal-Zellerfeld, Germany
7
Instituto Federal de Goiás (IFG), CEP 74.690-900 Goiânia, Brazil
*
Authors to whom correspondence should be addressed.
Both authors contributed equally.
Agronomy 2020, 10(6), 895; https://doi.org/10.3390/agronomy10060895
Submission received: 1 May 2020 / Revised: 17 June 2020 / Accepted: 20 June 2020 / Published: 23 June 2020
(This article belongs to the Section Soil and Plant Nutrition)

Abstract

:
The Brazilian sugarcane industry produced around 173 million tons (Mt) of bagasse in 2018. Bagasse is a by-product of juice extraction for ethanol and sugar production and is combusted in order to generate power, producing up to 10 Mt of ash per year. This ash contains various concentrations of plant nutrients, which allow the ash to be used as a crop fertilizer. However, the concentration and extractability of phosphorus (P), an essential plant nutrient, are low in bagasse ash. To increase the P content, we co-gasified and co-combusted bagasse with P-rich chicken manure. The resulting ash was thermochemically post-treated with alkali additives (Na2SO4 and K2SO4) to increase the availability of P to plants. We aimed to: (i) investigate the effect of thermochemical post-treatment of co-gasification residue and co-combustion ash on P availability to soybeans, (ii) explore the potential of chemical extraction methods (citric acid, neutral ammonium citrate, formic acid, and Mehlich-I) and diffusive gradients in thin films (DGT) to predict the availability of P to soybeans, and (iii) identify the responsible P-phases using X-ray diffraction. We evaluated P availability to soybeans growing in Brazilian Oxisol soil in two independent greenhouse pot experiments. The positive effect of thermochemical treatment on P availability from gasification residue was confirmed through the observation of increased P uptake and biomass in soybean plants. These findings were confirmed by chemical extraction methods and DGT. The gasification residue contained whitlockite as its main P-bearing phase. Thermochemical post-treatment converted whitlockite into highly soluble CaNaPO4. In contrast, co-combustion ash already contained highly soluble Ca(Na,K)PO4 as its main P-bearing phase, making thermochemical post-treatment unnecessary for increasing P availability. In conclusion, increased extractability and availability of P for soybeans were closely connected to the formation of calcium alkali phosphate. Our findings indicate that this combined methodology allows for the prediction of P-fertilization effects of ash.

1. Introduction

In 2018, the Brazilian sugarcane industry produced around 173 million tons (Mt) of bagasse. Bagasse, the fibrous plant material remaining after sugarcane juice extraction [1], is usually directly combusted to generate the energy required in sugar mills [2], with any excess energy supplied to the local power grid [2,3]. Bagasse combustion produces up to 10 Mt of ash annually (calculation based on [1,2,4]).
The ash is used as a liming agent or fertilizer for various crops [5,6,7,8], as it is alkaline and contains mineral nutrients, including phosphorus (P) and potassium (K), at various concentrations. Plant availability of K from biomass ash was reported to be comparable to that from potassium chloride (KCl) [9,10], but highly dependent on soil properties, including clay content and acidity [9]. In contrast, P availability depends on multiple factors, such as type of combusted biomass, co-combustion with other fuel sources, combustion technology, operational conditions of the combustion process, soil acidity and plant species [11,12,13,14]. Ferreira et al. [5] reported increased concentration and extractability of P in bagasse ash after co-combustion with nutrient-rich bovine sub-products, such as fat, bone and blood.
These findings motivated us to ask whether P concentration and availability from bagasse ash could be increased by co-combusting and co-gasifying the bagasse with chicken manure, an organic fertilizer [15] abundant in Brazil [4]. Manure is applied to soils as a disposal practice, which poses environmental risks due to the high solubility of P in the animal waste [16]. Solubility of P from nutrient-rich biomass in water is known to decrease greatly after thermal processing [17,18,19]. Thermochemical treatment of the resulting residue and ash from co-gasification and co-combustion has been found to increase P availability in a process originally developed for the treatment of sewage sludge ash [20,21,22]. This thermochemical process was performed using sodium and potassium additives (e.g., Na2SO4 and K2SO4) at temperatures between 900–1000 °C [23].
Various methods have been published for extracting P from biomass ash and products from thermochemical treatments. These extraction methods have been shown to predict the plant-available P [19,24]. In particular, extractions of P from ash using neutral ammonium citrate (NAC), citric acid (CA), or formic acid (FA) have been shown to correlate with fertilizer performance [19]. To the best of our knowledge, bagasse-based fertilizers have not previously been tested with these extraction methods.
Extraction of P with Mehlich-I solution is a standard method to measure plant-available P in Brazilian Oxisol soil [25]. In the current study, this method was compared with the novel diffusive gradients in thin films (DGT) technique to predict P availability for plants from co-gasification residue, co-combustion ash and their respective thermochemical products in Oxisol. The DGT technique was reported to predict P availability for plants from organic matter and conventional fertilizers [17,26,27,28] as well as from sewage sludge-based fertilizers [29,30]. For DGT, fertilizer is mixed with soil and incubated for several days prior to analysis of the DGT binding layer, which mimics root absorption of P. Therefore, DGT analysis correlates better with plant P uptake compared to common standard extraction tests used with conventional and recycling P-fertilizers [29,30].
The availability of P-fertilizers is connected to their crystalline P-phase composition [24,31]. Crystalline P-phases are usually determined by X-ray diffraction analysis (XRD). Such XRD data from mono-thermal treatment of bagasse or chicken manure are available from previous studies [18,32,33,34,35,36]. The P-phases in chicken manure ash seem to vary depending on combustion process conditions, and can commonly consist of apatite, various pyrophosphates and Ca2NaKPO4 with KMg(PO3)3, CaKPO4 and whitlockite appearing rarely [18,32,33,34]. In bagasse ash, only calcium phosphates were reported [35,36]. All these P-phases can be converted into calcium alkali phosphates such as CaNaPO4, CaKPO4, or Ca13Mg5Na18(PO4)18 by thermochemical treatment [21,23,37]. Calcium alkali phosphates are described as poorly water-soluble but highly plant-available [21,22].
In this study, bagasse was either co-gasified or co-combusted with chicken manure to increase the concentration of P in the products. Subsequently, the products were thermochemically treated to determine whether this process increased plant-available P. All products were assayed for P-fertilizing potential using soybeans (Glycine max (L.) Merr.) under controlled greenhouse conditions. Soybean was used as the model crop because it is one of most cultivated crops in Brazil [4,38]. Furthermore, soybeans are frequently cultivated between sugarcane rotations to restore soil fertility via symbiotic nitrogen fixation [39,40].
The objectives of this study were to: (i) investigate the effect of thermochemical post-treatment of co-gasification residue and co-combustion ash on P availability to soybeans, (ii) explore the potential of various chemical extraction methods (CA, NAC, FA, and Mehlich-I) and DGT to predict the availability of P to soybeans, as well as (iii) identify P-phases with XRD with different availabilities of P. We hypothesized that thermochemical post-treatments of co-gasification residue and co-gasification ash increase the availability of P for soybeans due to the conversion of less plant-available P from crystalline P-phases such as whitlockite into more available P from calcium alkali phosphates.

2. Materials and Methods

2.1. P-Fertilizer Preparation

In the present study, the fertilizers were all prepared using previously pelletized bagasse (Usina Nova Gália Ltda., Paraúna, Goiás, Brazil) and chicken manure (Jürgen Abeler GmbH and Co. KG, Nordwalde, Germany). In a first step, mixtures of bagasse pellets and chicken manure pellets were thermally converted by co-gasification or co-combustion (Figure 1). Based on Herzel et al. [23], ash and residue from both co-combustion and co-gasification were thermochemically post-treated in order to transform the existing P-phases into highly plant-available calcium alkali phosphates.
The co-combustion treatment was carried out in a grate furnace (HDG Compact 100, HDG Bavaria GmbH, Massing, Germany) with 100 kW thermal output. The retention time on the grate was around 45 minutes (min.) and the temperature profile in the fire bed spanned from 400 up to 800 °C under oxidizing conditions (λ = 2.2). This co-combustion ash, named ASH, was produced from mixtures of bagasse pellets and chicken manure pellets at a ratio of 60/40 wt.%.
The co-gasification treatment was carried out in a circulating fluidized bed gasifier (ArtFuel-Gasifier, T & M Engineering, Bad Frankenhausen, Germany, modified by TU CUTEC, Clausthal-Zellerfeld, Germany) at 827 °C under reducing conditions (λ = 0.4) [41]. Due to technical reasons, the fraction of chicken manure was decreased substantially relative to that used in the combustion treatment. It was observed in pre-investigations that during the gasification process there is an accumulation of P in the main gasification residue, whereas a bottom ash of low P-content separates out. Consequently, the co-gasification residue is P-enriched [41,42]. In order to produce comparable total P-contents from combustion ash and gasification residue, a mixture of 85 wt.% bagasse pellets and 15 wt.% chicken manure pellets was gasified. The resulting co-gasification residue is named GR.
GR and ASH were then thermochemically post-treated sequentially (Figure 1). The ASH sample had to be mixed with 23 wt.% milled chicken manure as a carbon source to achieve the reducing atmosphere required for the thermochemical process [23,37]. No carbon source was added for GR as it contained 36 wt.% loss on ignition (LOI) (Table 1), which is characteristic for gasification residues [43].
GR and ASH (including 23 wt.% chicken manure) were mixed with alkali additives: once with sodium sulfate (products of thermochemical treatment named ASH+Na and GR+Na) and once with a mixture of sodium and potassium sulfate (products of thermochemical treatment named ASH+Na/K and GR+Na/K). Mixing ratios are displayed in Table A1. The mixtures were treated in corundum crucibles with lids at 1000 °C for 30 min. in a stationary furnace (LH 15/14, Nabertherm GmbH, Lilienthal, Germany). The potassium contents in GR+Na/K and ASH+Na/K were adjusted to a weight ratio K/P = 2.2 by addition of the potassium sulfate to meet the common K to P ratio of soybean fertilizers (weight ratio K/P = 2) [44].
All ashes and thermochemical products were pulverized (≤250 µm) and used as P-fertilizers for soybeans in greenhouse pot experiments, as well as conventional P extraction tests, crystalline phase analysis, i.e. XRD, and, in case of GR, used for liquid 31P nuclear magnetic resonance (NMR) analyses and soil tests (Mehlich-I and DGT) (Figure 1).

2.2. Greenhouse Pot Experiments

Two independent and randomized greenhouse pot experiments were conducted at Forschungszentrum Jülich, IBG-2: Plant Sciences, Germany (location: 50°54′36″N, 6°24′49″E), to investigate the effects of thermochemical treatments on P-availability from bagasse-based ashes for soybeans (Glycine max (L.), Merr. var. RGT Shouna). Soybeans received 16 h light day−1 in the form of natural and artificial light (≥400 μmol s−1 m−2, SON-T AGRO 400, Phillips) regulated by an automated light system. Air temperature and CO2 averaged around 25/20 °C (day/night) and 400 ppm and humidity was kept constant at 50–60% (day/night).
Soybean seeds were pre-germinated on moist filter paper in the dark for 3 days (d). Seedlings with comparable root lengths were then transplanted into nutrient-poor substrate (0.05 wt.% N, 0.01 wt.% P, and 1.32 wt.% K), which consisted of sand [45] and Null-Erde (Balster Einheitserdewerk, Fröndenberg, Germany) in a ratio of 1:1 by volume. In the stage of fully expanded unifoliate leaves, the roots were washed and plantlets with comparable root length, height and leaf area were inoculated with atmospheric N2-fixing Bradyrhizobium japonicum (NPPL HI Stick, BASF SE, Ludwigshafen, Germany) and transplanted into pots containing 1300 g, i.e., 1 L, of air dried Oxisol (0.10 wt.% N, 0.04 wt.% P, and 0.07 wt.% K, Brazilian Federal University of Goiás, Goiânia, Brazil).
Prior to transplanting, the Oxisol received either no additional P (negative control, named No-P) or 100 mg P kg−1 Oxisol from homogeneously incorporated fertilizers described in Table 1. The dosage of 100 mg P kg−1 Oxisol was equivalent to 90 kg P2O5 ha−1 based on a planting density of 3 × 10⁵ soybeans ha−1. The concentration of K in No-P, GR, GR+Na, ASH, and ASH+Na was adjusted to the K supply of the variants GR+Na/K and ASH+Na/K, respectively. To avoid K- and N-deficiency, all fertilization treatments, including the No-P control, received equivalent amounts of 56.5 kg K ha−1 (68 kg ha−1 of K2O) in the form of K2SO4 and 7 kg ha−1 of N in the form of ammonium nitrate (NH4NO3). These are the recommended amounts for soybeans growing in central western Brazil [44], where the soil originated.
Unfertilized Oxisol contained 3.3 mg P kg−1 Oxisol extractable with Mehlich-I solution; and the pH ranged around 5.36 ± 0.05. The Oxisol mineral composition was around 38.8 wt.% clay, 16.8 wt.% silt, and 44.5 wt.% sand. The maximum water holding capacity of the soil (WHCmax) was 54 wt.% (54 g water/100 g soil). In both experiments, the water holding capacity was kept around 38% to avoid leaching of minerals and was monitored by weighing the pots weekly.

2.2.1. GR-Based P-Fertilizer (First Experiment)

The first experiment was performed in the period from March to May, 2018, and investigated the availability of P from GR and its thermochemical products to soybeans. Each treatment, i.e., No-P, GR, GR+Na, and GR+Na/K, was tested with four biological replicates (plants) that grew for 59 d in Oxisol. In total, the soybeans received 8683 mmol m−2 light irradiance. The plants were harvested and total dry biomass, biomass partitioning to the roots, uptake of P and residual P in Oxisol were evaluated (Figure 1).

2.2.2. ASH-Based P-Fertilizer (Second Experiment)

The second experiment was performed from June to July, 2018, and investigated the effect of ASH and its thermochemical products on growth of soybeans. Each treatment, i.e., No-P, ASH, ASH+Na, and ASH+Na/K, was tested with five biological replicates (plants), which grew for 41 d in Oxisol. Due to faster growth of fertilized plants than observed in the first experiment, the growing period was shorter, which limited our non-invasive leaf area measurements in the “ScreenHouse” platform. The leaf areas were measured every 7 d to gain insight into plant growth dynamics. Soybeans were irradiated with 7797 mmol m−2 light in total. Analyses of total dry biomasses of plants, biomass partitioning to the roots, and shoot growth dynamics were performed (Figure 1), whereas chemical biomass and soil analyses were dispensed of, because the shoot growth and biomass data of ASH, ASH+Na, and ASH+Na/K-fertilized soybeans were not statistically different.

2.3. Sample Preparation and Analysis

2.3.1. Non-Invasive Measurements

In the second experiment, the shoot area of soybeans was captured in the “ScreenHouse” platform, described in Nakhforoosh et al. [46] and Scharr et al. [47], once per week starting 7 d after transplanting. In brief, the soybeans were imaged from four sides, i.e., 0, 90, 180 and 270° (Point Gray Grasshopper2, 5 MP color camera, FLIR Integrated Imaging Solutions Inc., Richmond, BC, Canada) at a 45° angle and the sum of the four pictures represented the projected shoot area of soybeans. The final images were taken one day before harvest, i.e., 40 d after transplanting. True leaf areas were measured after harvesting the plants (L-3100, Li-cor, Lincoln, NE, USA) and correlated highly with projected leaf areas of the plants (R2 = 0.98, Appendix A Figure A1).

2.3.2. Harvest

Around 250 g of soil were sampled from each pot. Plants were harvested and separated into roots, stems and leaves. This allowed analysis of the dry matter (DM) of the total plant (TPDM) from shoot and root organs, as well as biomass partitioning in response to different P-fertilization forms. In this study, we focused on biomass partitioning to the roots expressed as root mass fraction (RMF) (Equation (1)), as plants are known to increase the root length density to acquire limited P [48]. Biomass and soil samples were dried at 65 °C and 30 °C, respectively until they reached a constant weight.
RMF   ( g   g 1   TPDM ) = 100 × DM Root   ( g ) DM TPDM   ( g )
In the first experiment, soils from all replicates of a treatment were mixed and homogenized. These were ground in a vibrating tungsten-carbide cup mill (Siebtechnik GmbH, Mühlheim/Ruhr, Germany) and used for pH measurements, extraction of P (Mehlich-I), and for DGTharvest measurements.

2.3.3. Chemical Analysis of P for Calculation of P Uptake

The dried biomasses from the first experiment were ground (Retsch Mixer Mill MM 400, Retsch GmbH, Haan, Germany) for chemical analysis of P. In the second experiment, P was not measured in the biomass of soybean plants because leaf area, total dry matter and biomass partitioning to the roots of ASH, ASH+Na, and ASH+Na/K-fertilized plants did not statistically differ. Fifty grams of biomass were digested with 2.0 mL of HNO3 and 1.0 mL of H2O2 in triplicate in a microwave (Mars 5, Prg. Pflanzen160 X-Press, Kamp-Lintfort, Germany). Afterwards, the samples were diluted with ultrapure water (Milli-Q Reference, Merck, Darmstadt, Germany) to a total volume of 14.0 mL. Before measuring P in inductively coupled plasma optical emission spectrometry (iCAP 6500, Fisher Scientific, Schwerte, Germany), subsamples were diluted to a ratio of 1: 20. The standard deviations were 5 to 10%.
The estimation of P uptake was based on the calculation reported by Thind et al. [7], and was modified through inclusion of the second harvest, as fertilization started with pre-cultivated soybeans. The uptakes of P were based on total amounts of P in the biomass of soybeans harvested at the time of fertilization began (Pfertilization beginning) and after 59 d growth (Pfinal harvest) in Oxisol (see Equation (2)).
ΔP uptake (mmol) = Pfinal harvest (mmol) − Pfertilization beginning (mmol)

2.3.4. Determination of pH Value and LOI

The pH value for all soils and fertilizer samples (Figure 1) were determined in 0.01 M CaCl2 solution (soil: solution ratio: 1: 2.5 w/v). For determination of LOI (Figure 1), 0.5 g of fertilizer was thermally treated at 550 °C for 12 h under an oxidizing atmosphere in a stationary furnace (LH 15/14, Nabertherm GmbH, Lilienthal, Germany).

2.3.5. Chemical Extraction of Soils

Mixed and homogenized soil samples fertilized with GR, GR+Na, and GR+Na/K and the negative control ‘No-P’ were extracted in duplicate using aqua regia [49] and Mehlich-I (diluted HCl/H2SO4 solution, 1: 4 w/v, 5 min [50]) after harvest (Figure 1). The P concentrations of all soil extracts were analyzed using inductively coupled plasma mass spectrometry (Thermo iCAP Q, Thermo Fisher, Dreieich, Germany).

2.3.6. Chemical Extraction of Fertilizers

The P-fertilizers were extracted (Figure 1) with 2% CA (fertilizer: solution ratio 1:100 w/v, 30 min), NAC (fertilizer: solution ratio 1:100 w/v, 60 min at 65 °C), and 2% FA (1:100 w/v, 30 min) carried out according to the EU regulation No. 2003/2003 [51] in duplicate. For extractions, 0.1 ± 0.01 g of fertilizer was weighed and mixed with 4.0 mL of concentrated nitric acid (HNO3), 1.5 mL perchloric acid (HClO4), and 1.0 mL hydrofluoric acid (HF) and subsequently digested in a microwave (mikroPrepA, MLS GmbH, Leutkirch, Germany). Excess HF was complexed with 5.0 mL of cold, saturated boric acid (HBO3). The P concentrations from these chemical extraction tests and total digests of fertilizers were analyzed using inductively coupled plasma optical emission spectrometry (Thermo iCAP 7400, Dreieich, Germany).

2.3.7. DGT Experiments with Soils and Fertilizers

The DGT device consists of a binding layer, a diffusion gel and a filter (to protect the gel) assembled in a plastic holder. The dissolved and labile P fraction of the soils and fertilizer from moist fertilizer/soil mixtures diffuses through the filter and the diffusion gel and is then adsorbed on a P selective binding layer. Two different types of experiments were carried out using the DGT method (Figure 1). DGTincubation experiments were conducted in duplicate with a mixture of fertilizers and original Oxisol soil analogous to the greenhouse pot experiments. DGTharvest were carried out in duplicate with mixed and homogenized soil samples from the greenhouse pot experiments after harvest. The procedure used in the DGT experiments was the same as described in Vogel et al. [30]. The only difference was that the adjusted water content for DGT application, which was in our experiment, was below WHCmax. 50% WHC was enough to achieve a glistering liquid paste which was due to the characteristics of Oxisol soil. The P concentrations from these extracts were analyzed by inductively coupled plasma mass spectrometry (Thermo iCAP Q Thermo Fisher, Dreieich, Germany).

2.3.8. Crystalline Phase Analysis of Fertilizers by XRD

Powder XRD measurements of the fertilizer samples (Figure 1) were performed in Bragg-Brentano geometry over a 20 range from 5° to 80°, with a step size of 0.02° (D8 Advance, Bruker AXS, Germany). The diffraction patterns were collected using Cu Kα1/Kα21 = 1.54056 Å/λ2 = 1.54443 Å) radiation. The diffraction patterns were recorded with a Lynxeye detector and evaluated using the Match! Software (version 3.6) (Crystal Impact GbR, Bonn, Germany).

2.3.9. Identification and Quantification of P-Species with Liquid 31P-NMR

31P NMR analyses were performed to identify organic P-species in GR-based fertilizers (Figure 1), as GR contained 36 wt.% LOI (Table 1). The term P-species describes how the P occurs in GR and its thermochemical products (e.g., monoester, diester, ortho-, pyro-, and polyphosphate).
Prior to NMR analysis, samples were extracted with 0.25 M NaOH and 0.05 M ethylenediaminetetraacetic acid (EDTA) and centrifuged [52]. The supernatant was frozen and lyophilized. A total of 200 mg of freeze-dried solids were dissolved in in a mixture of NaOD and D2O at pH 13. Methylenediphosphonic acid was added as internal reference [53]. Solution 31P-NMR spectra were obtained using a Bruker Avance III 600 MHz spectrometer (Bruker Biospin, Rheinstetten, Germany) equipped with a Prodigy-cryoprobe.

2.4. Statistics

Total dry biomasses, root mass fractions and P uptakes in the first experiment (four biological replicates) and estimated leaf areas, total dry biomasses and root mass fractions in the second experiment (five biological replicates) were subjected to homogeneity of variance analyses (Bartlett’s test, RStudio, 1.2.1335, package multcomp), descriptive statistics, Pearson chi-square test for normality analyses before a one-way ANOVA and Pearson’s product-moment correlation analyses (RStudio, package agricolae) were performed. The means of replicates per fertilization treatment were compared by Tukey’s honest significance test. The significance was determined at p < 0.05, and different letters in the figures and tables indicate significant differences between the means. “Estimated and true leaf areas” and “P uptakes and total dry matters from shoot and root organs” were subjected to Pearson’s product-moment correlation analyses. The figures were generated by using RStudio 1.2.1335, gg-plot, (TPDM, RMF, P uptake and estimated leaf areas) and origin 2018 G (extractable P in CA, FA and NAC as well as linear regressions of P uptake and TPDM with P from Mehlich-I, DGTincubation and DGTharvst). The values show means ± standard error of means.

3. Results

3.1. Gasification Residue and Its Thermochemical Products

3.1.1. Chemical Extraction and P-Phase Analysis

In general, the thermochemical treatment leads to decreasing mass fractions of P and other elements due to dilution by the alkali additives. At the same time, the mass fractions of Na and K increase (Table 1). In the case of GR-based fertilizers, the decrease of element mass fractions by thermochemical treatment is less pronounced, as the LOI of GR decreases from 36 wt.% to 8 wt.% during the thermochemical treatment (Table 1).
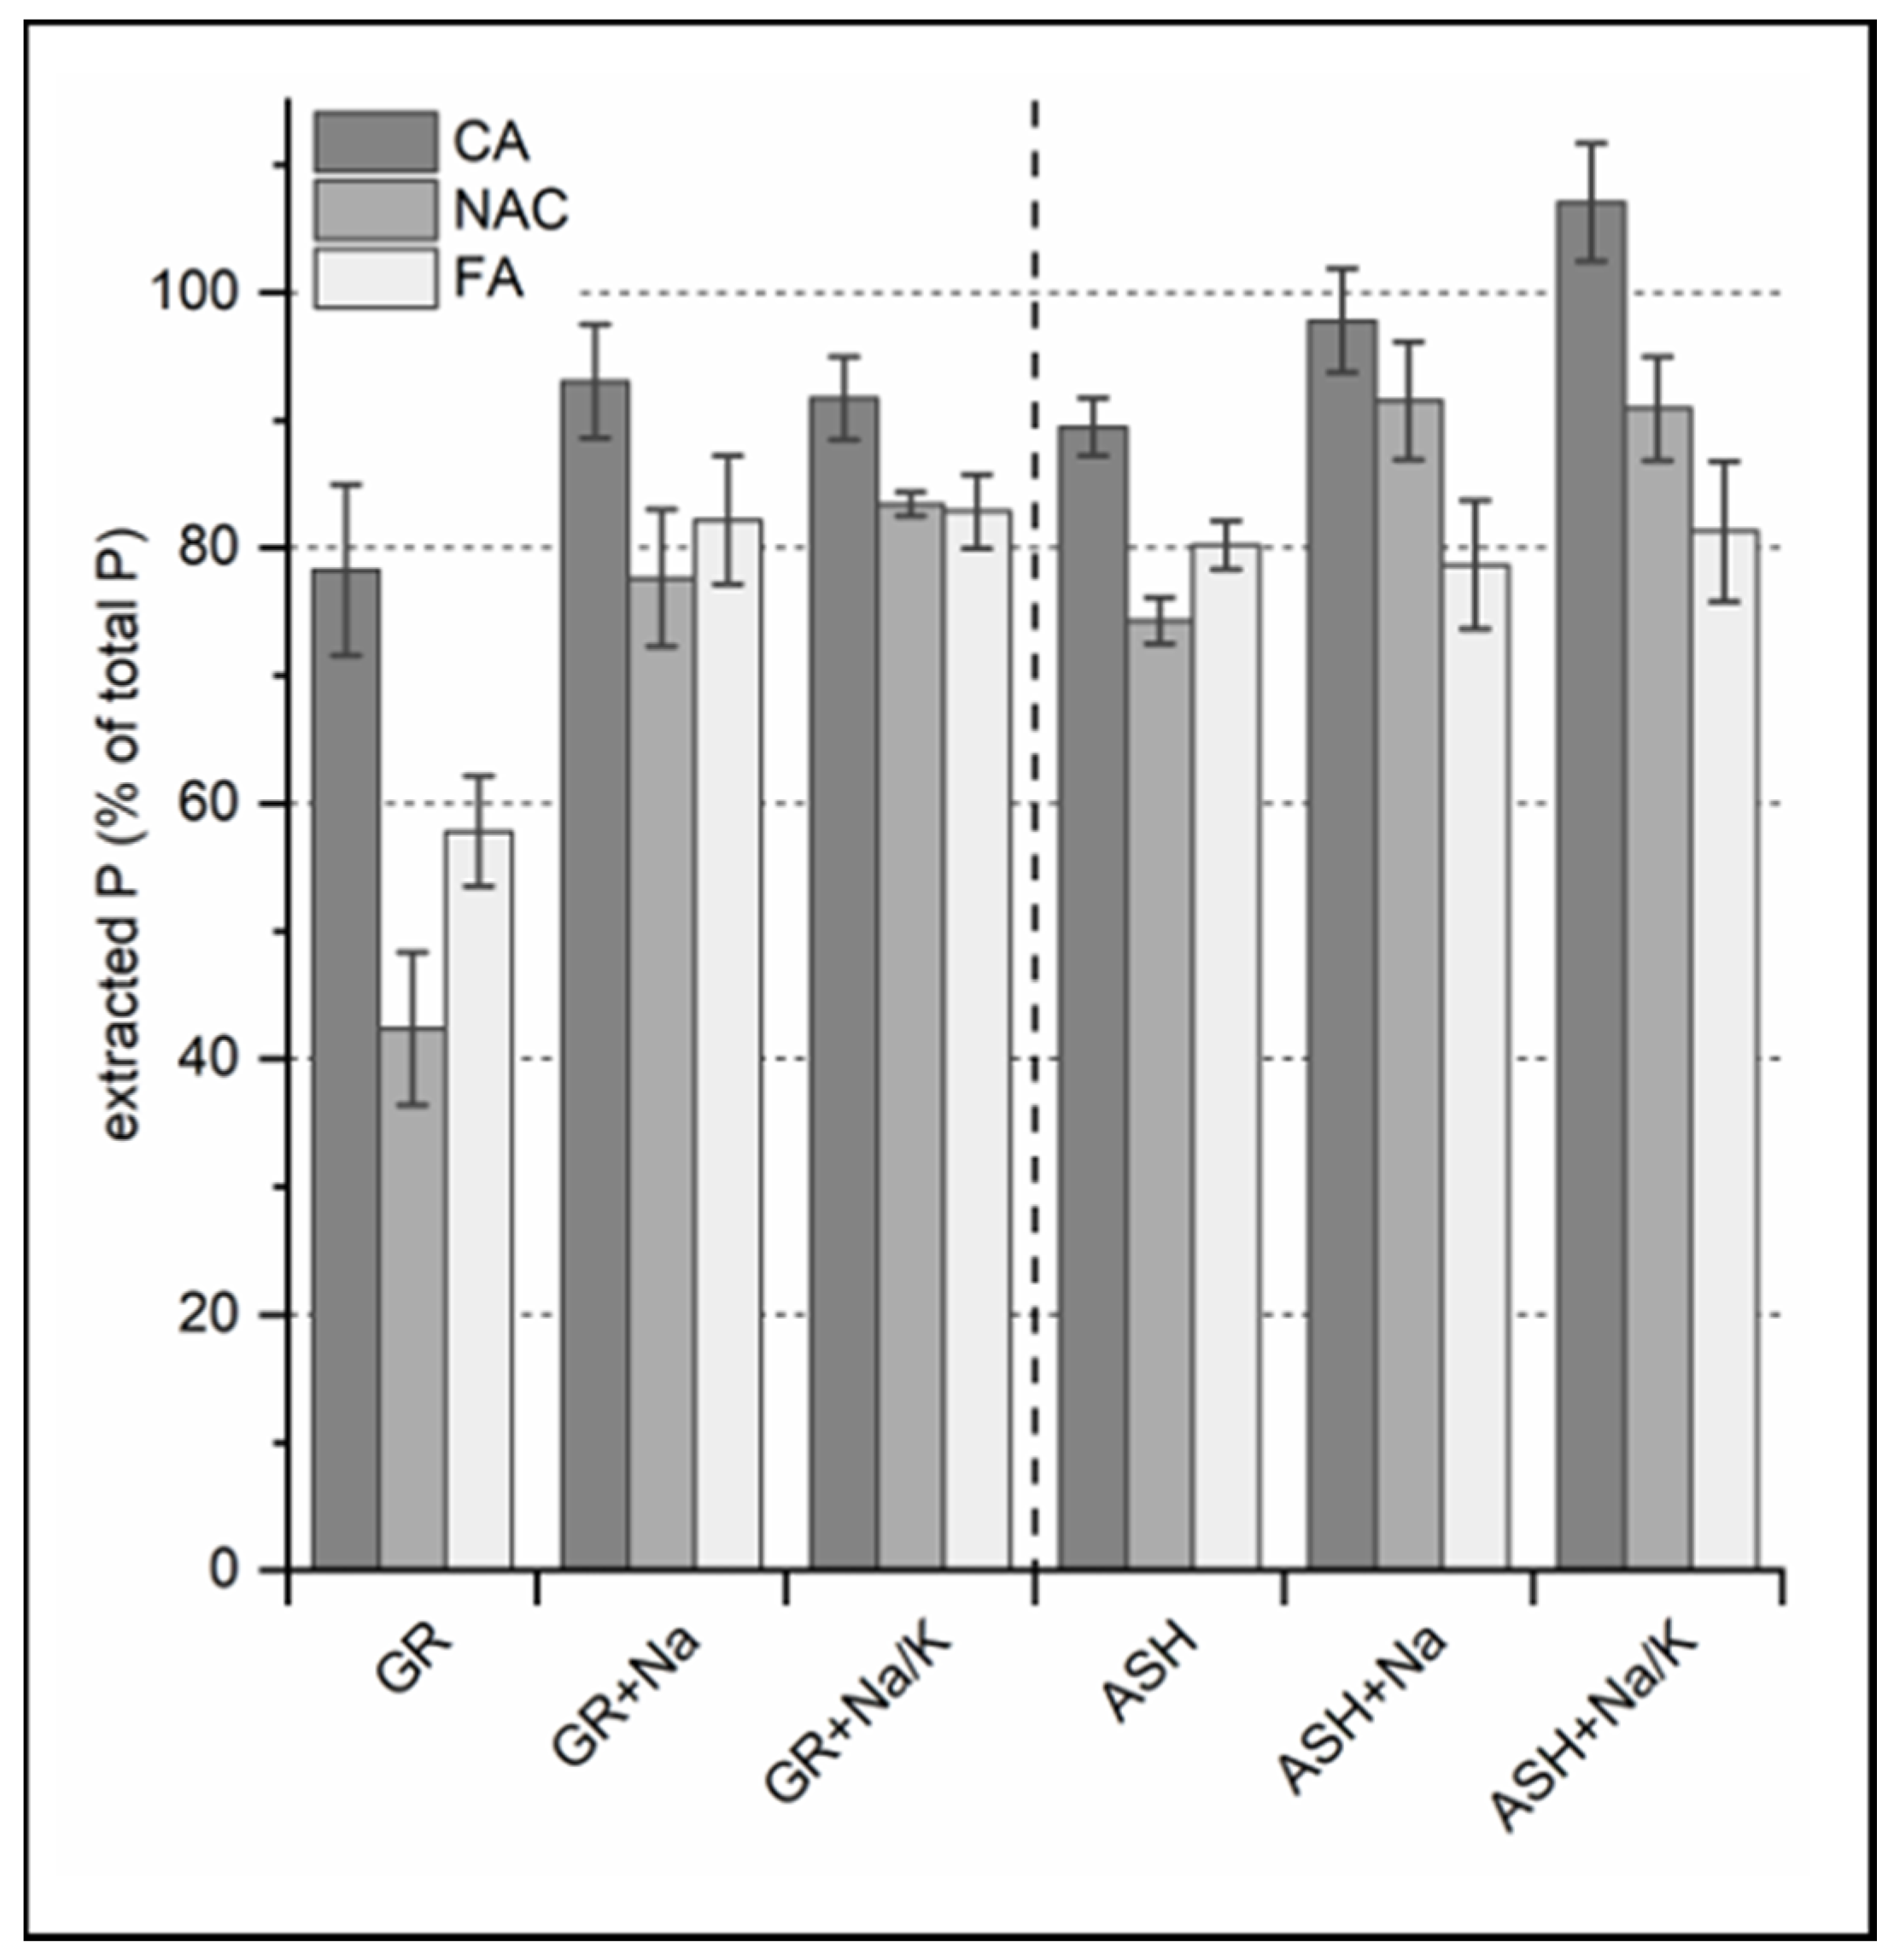
The extractable P increased from 40% in NAC and 60% in FA to around 80% of total P in both NAC and FA due to thermochemical treatment of GR with Na2SO4 and Na2SO4/K2SO4 (Figure 2). Contrary to the extractions in NAC and FA, the extractable P in CA was already 80% in GR and increased to 90% of total P in GR+Na and GR+Na/K (Figure 2).
Sections of diffraction patterns are depicted in Figure A2. All samples contained an amorphous phase visible as an increased background intensity between 20° and 38° 2 theta (Figure A2), which complicated the identification of the structural phases of P. Reflexes in these diffraction pattern could be correlated with crystalline phases. A more detailed description of phases that do not contain P is available in Table A2. These phases are not further considered, as they are not relevant for P-fertilization.
Whitlockite (Ca9M(PO4)7, where M is most commonly Ca, Fe, and/or Mg) was detected as the main crystalline P-phase and CaK2P2O7 as minor crystalline P-phase in GR by XRD analyses. In GR+Na and GR+Na/K products, whitlockite remained present in minor amounts (Table 2). The crystalline phase CaNaPO4 was most abundant in thermochemical GR+Na and GR+Na/K products, which was due to the reaction of the P-phases with Na2SO4 under reducing conditions. However, no K-containing crystalline P-phase was detected in the sample GR+Na/K, although K2SO4 was added as an additive.
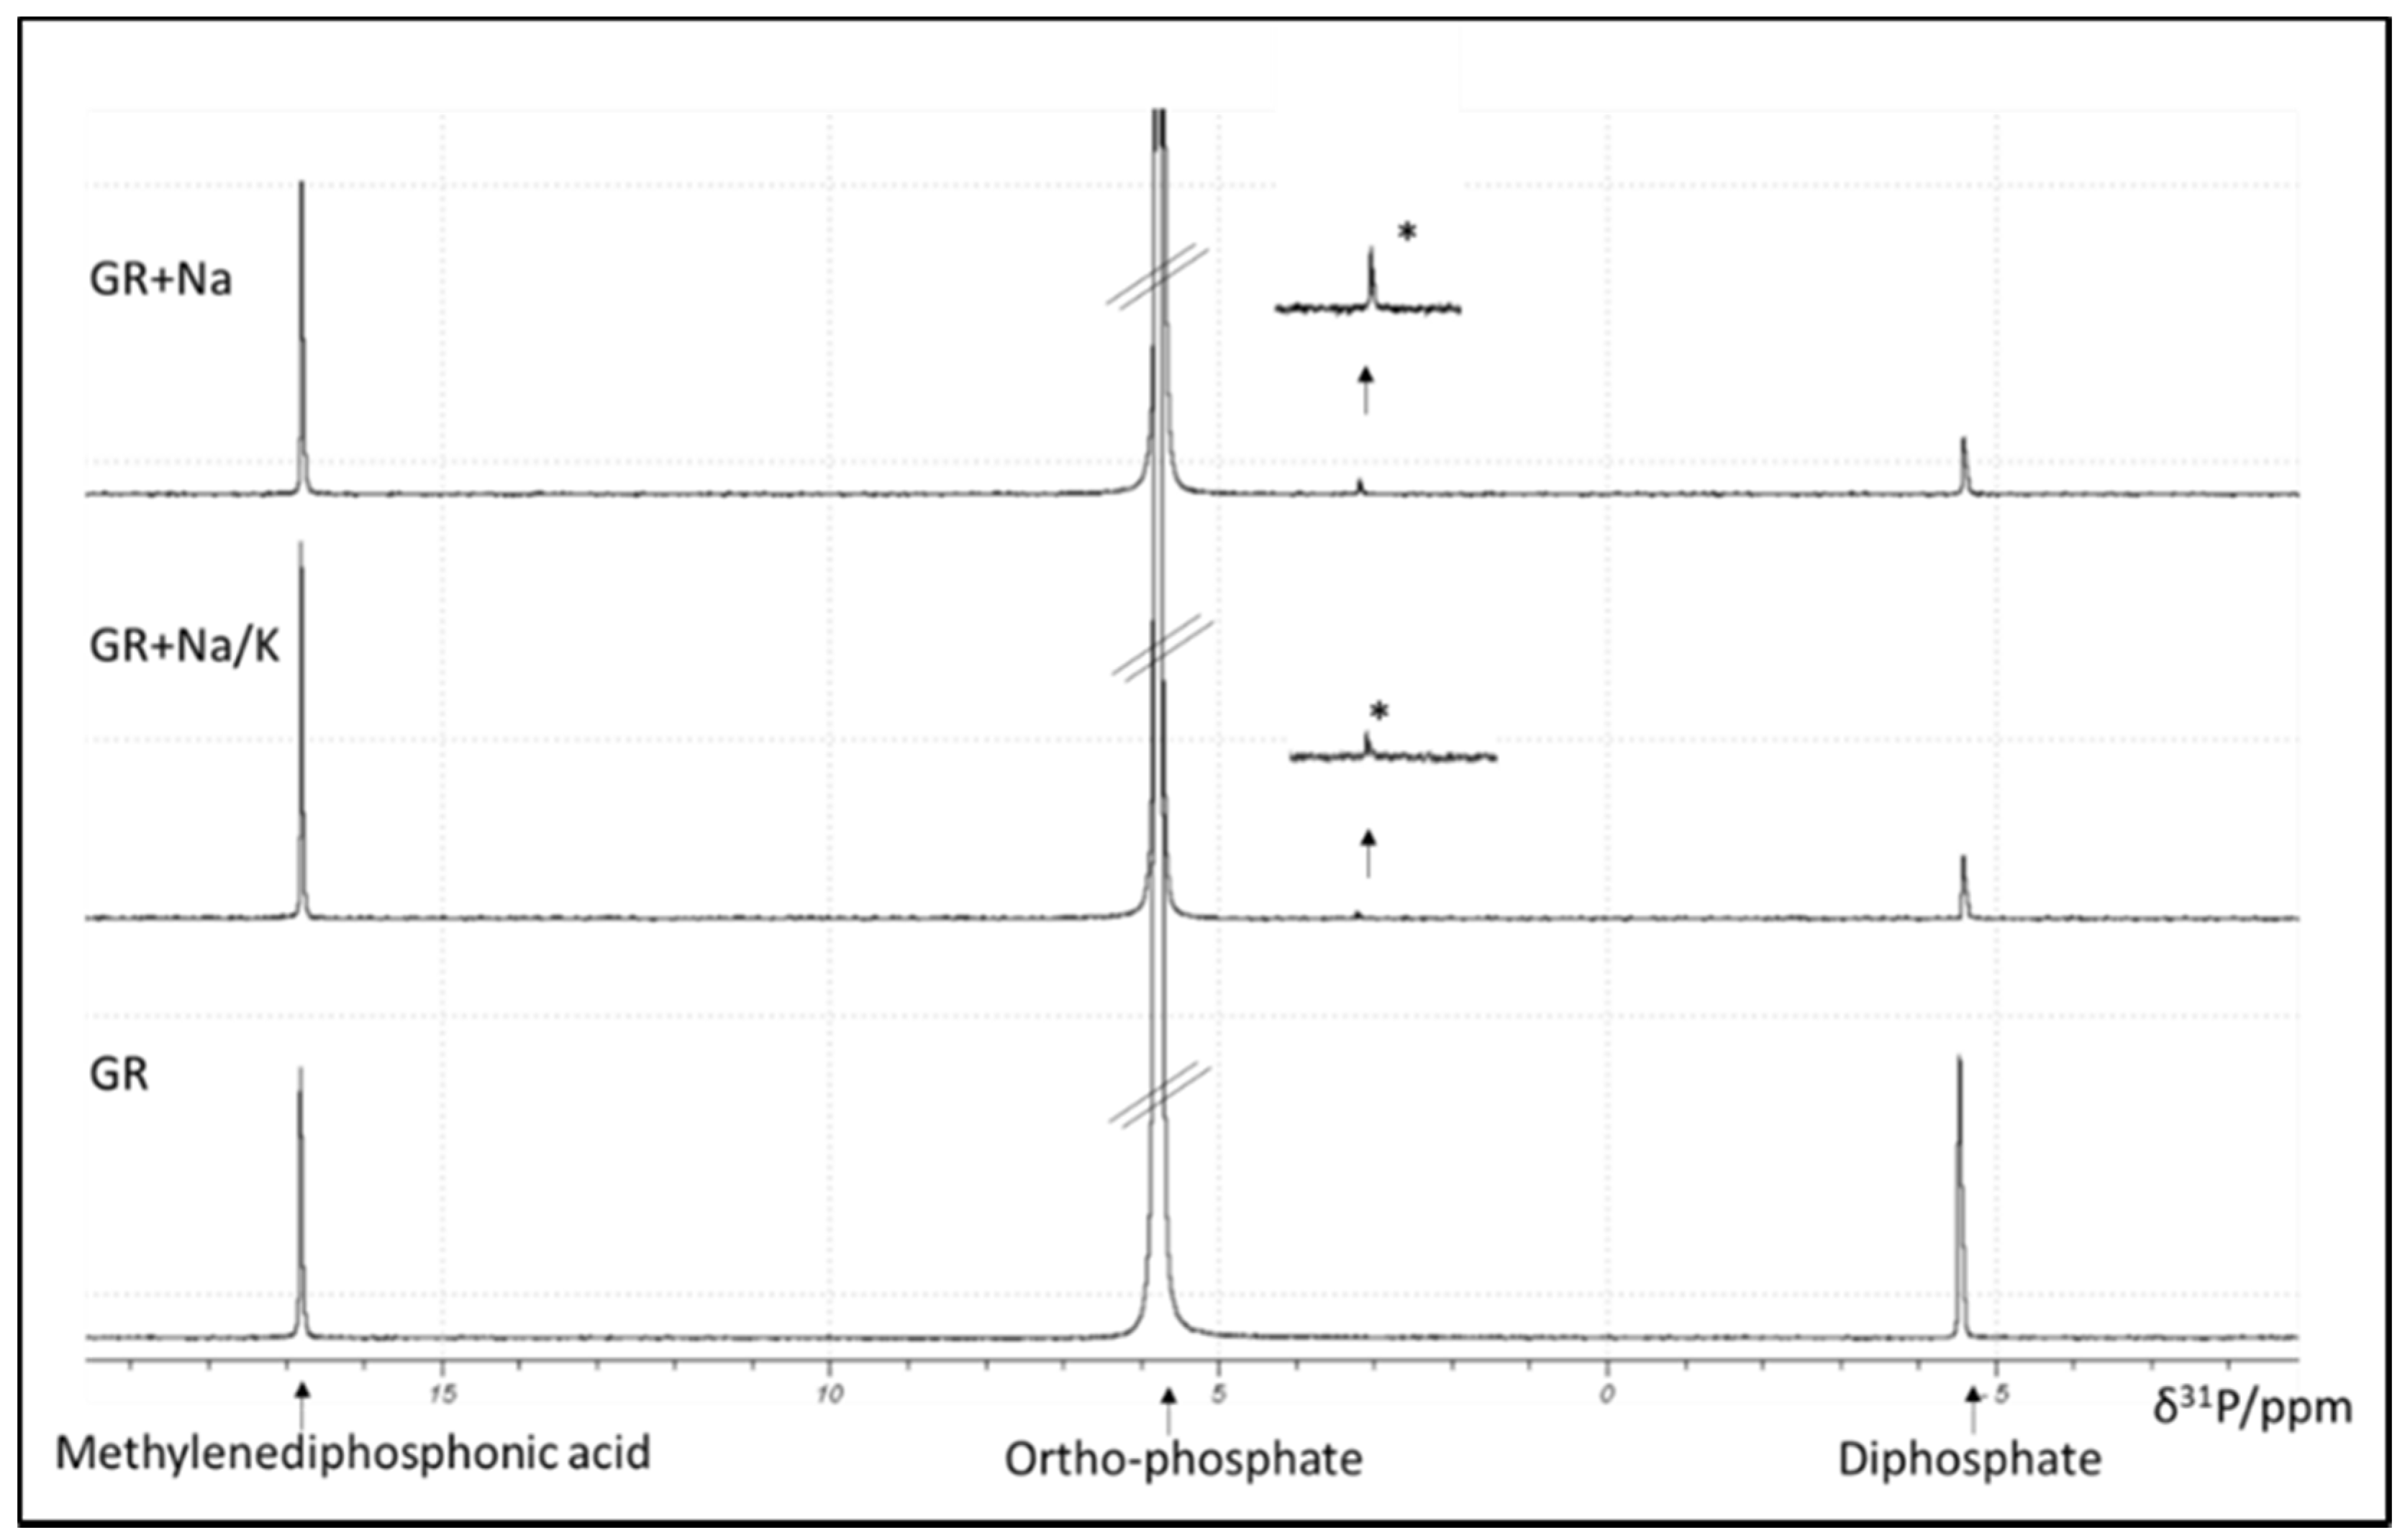
GR contained 36 wt.% LOI, which promoted us to conduct liquid 31P NMR analyses to identify organic P. However, no organic P species were detected in either GR, GR+Na, or GR+Na/K. In these fertilizers only Ortho-P and Pyro-P were identified (Figure A3).

3.1.2. P-Fertilization Effects

The fertilizations of Oxisol soil with GR, GR+Na, and GR+Na/K increased the pH levels from 5.4 (negative control treatment, No-P) to around 5.7 (Table A3).
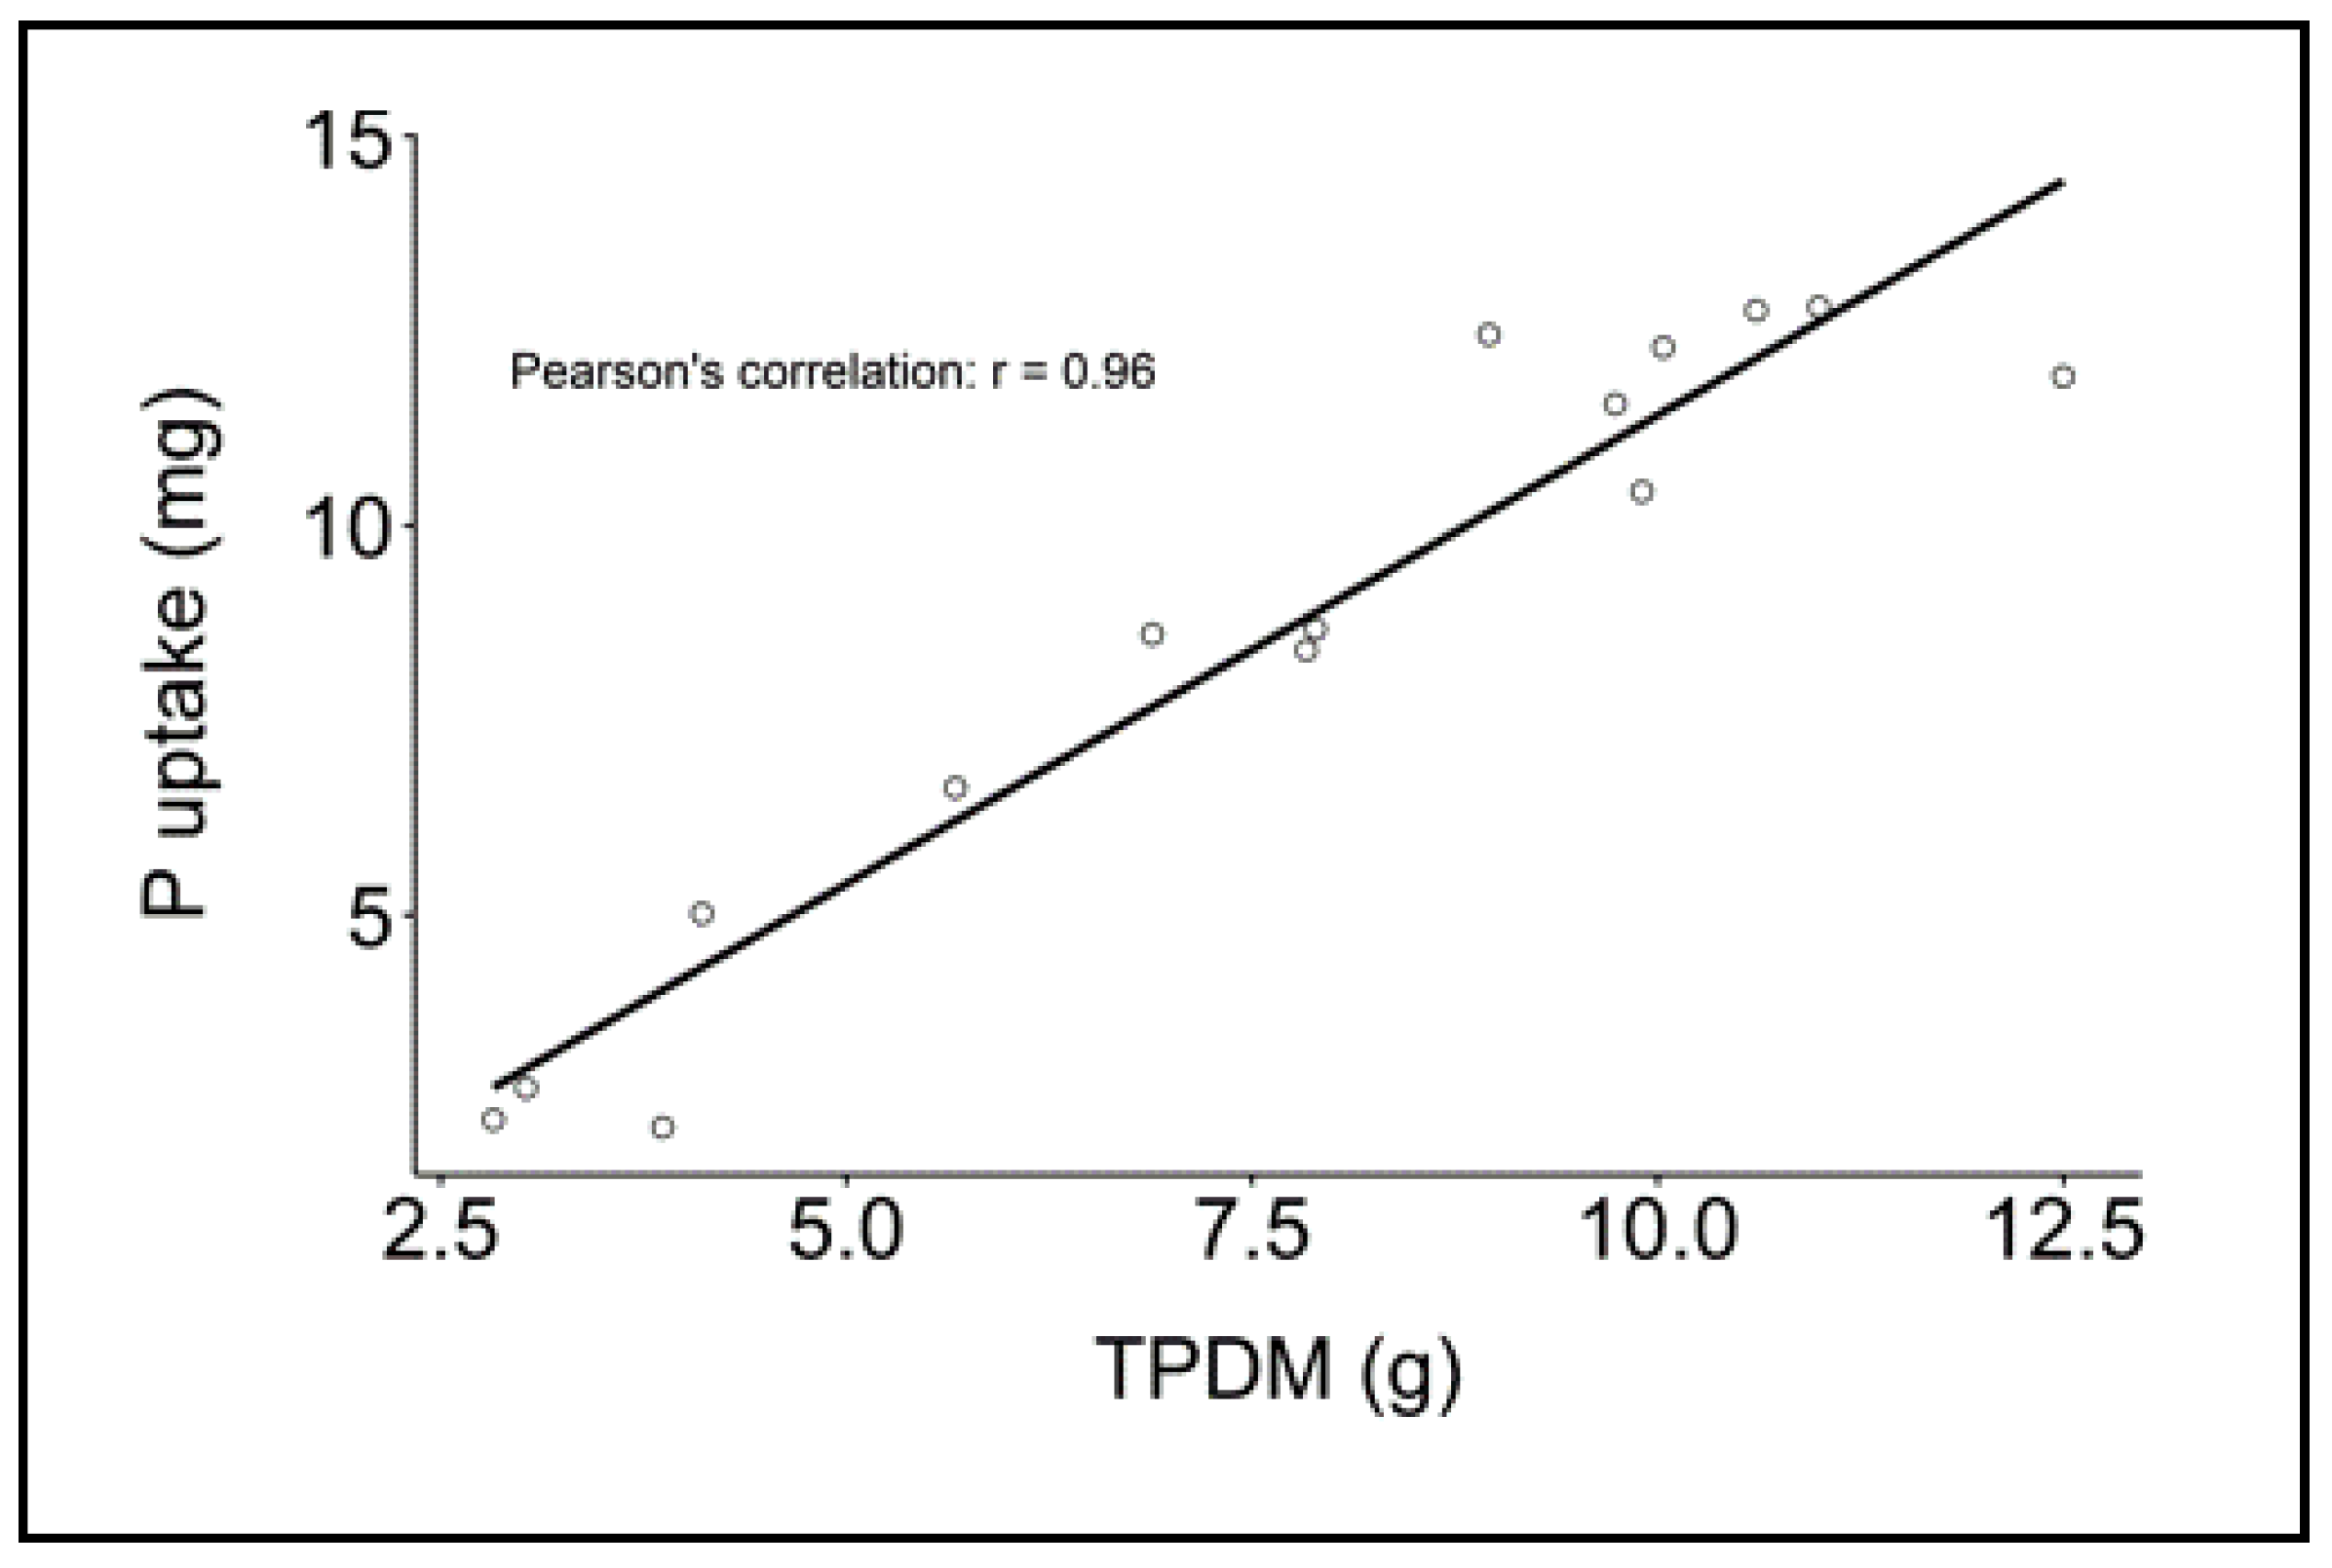
Compared to negative control plants (No-P), fertilizations with GR and its thermochemical products improved the shoot growth (Figure 3A) and significantly increased the total plant dry matter of soybeans as compared to unfertilized plants (Figure 3B). Total dry biomass from shoot and root organs was highly correlated with the uptake of P (R2 = 0.96, Figure A4) and both significantly increased for GR+Na and GR+Na/K fertilization compared to GR fertilization (Figure 3B,C). Biomass partitioning to the roots decreased following fertilization with GR and its thermochemical products. However, compared to negative control plants, this was statistically supported only for fertilization with GR+Na (Figure 3D).

3.1.3. Correlations of Soil Tests (Mehlich-I and DGT) to P Uptake by Soybeans

DGTincubation (Figure 3E) can predict the availability of P from GR, GR+Na, and GR+Na/K to soybeans under lab conditions, whereas DGTharvest (Figure 3F) and the standard extraction methods for P in Oxisol soil, i.e., Mehlich-I [25], represent residual P in the soil after plant growth experiments. The measured concentrations of adsorbed P by DGTharvest (2 to 20 µg P L−1) was lower compared to DGTincubation (11 to 63 µg P L−1) (Table A3).
Extractable P in soil and the results of greenhouse pot experiments, i.e. P uptake by plants (Figure 3E–G) and total plant dry matter from shoot and root organs (Figure A5), were correlated. In general, the linear regressions showed lower correlations of Mehlich-I and DGT to the P uptake by soybeans (R2 > 0.64) (Figure 3E–G) compared to the total plant dry matter (R2 > 0.87) (Figure A5), albeit the correlation trends were the same. However, the highest correlations were found for P uptake by soybeans with DGTharvest (R2 = 0.89), followed by DGTincubation (R2 = 0.84), and Mehlich-I solution (R2 = 0.64) (Figure 3E–G). The correlation coefficients of P from DGTharvest, DGTincubation and from Mehlich-I extractions with total plant dry matter were 0.96, 0.92, and 0.87, respectively (Figure A5).

3.2. Combustion Ash and Its Thermochemical Products

3.2.1. Chemical Extraction and P-Phase Analysis

The extractable P increased from around 80% in NAC and 90% in CA to around 90% and 100% of total P due to thermochemical treatments with Na2SO4 and Na2SO4/K2SO4, respectively (Figure 2). Contrary to the extractions in NAC and CA, the extractable P in FA remained at around 80% even after thermochemical treatments with Na2SO4 and Na2SO4/K2SO4 (Figure 2).
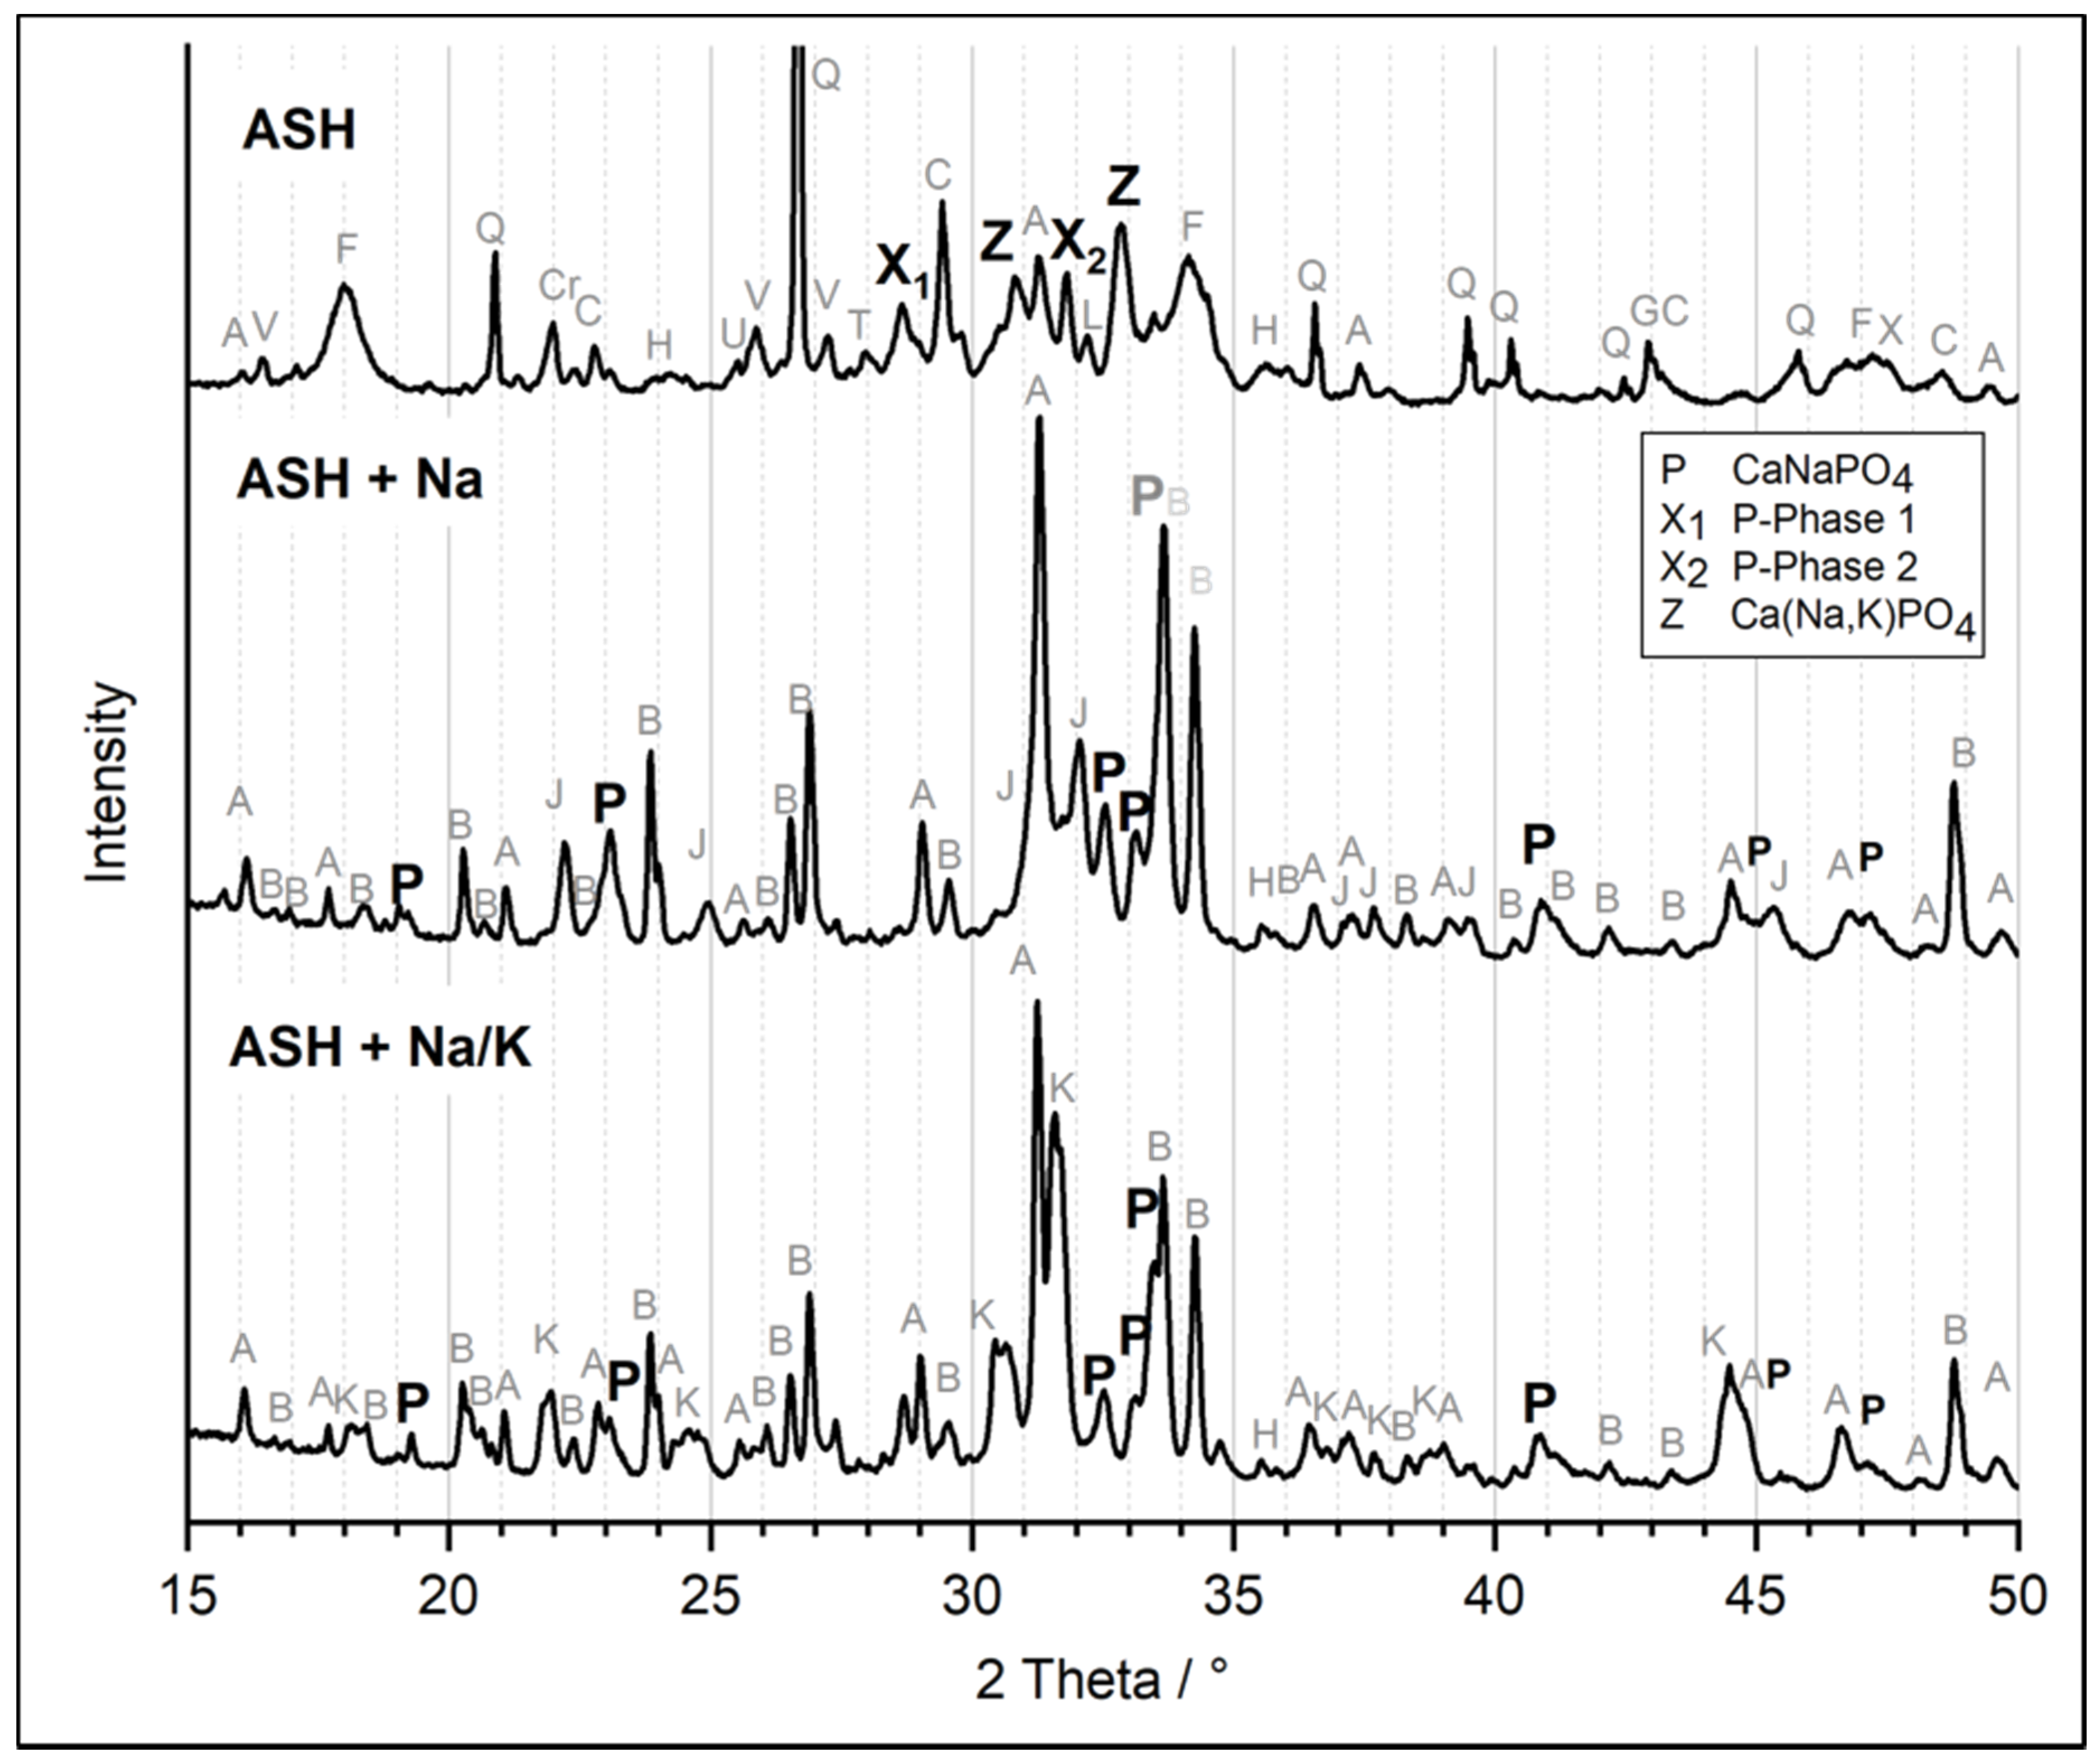
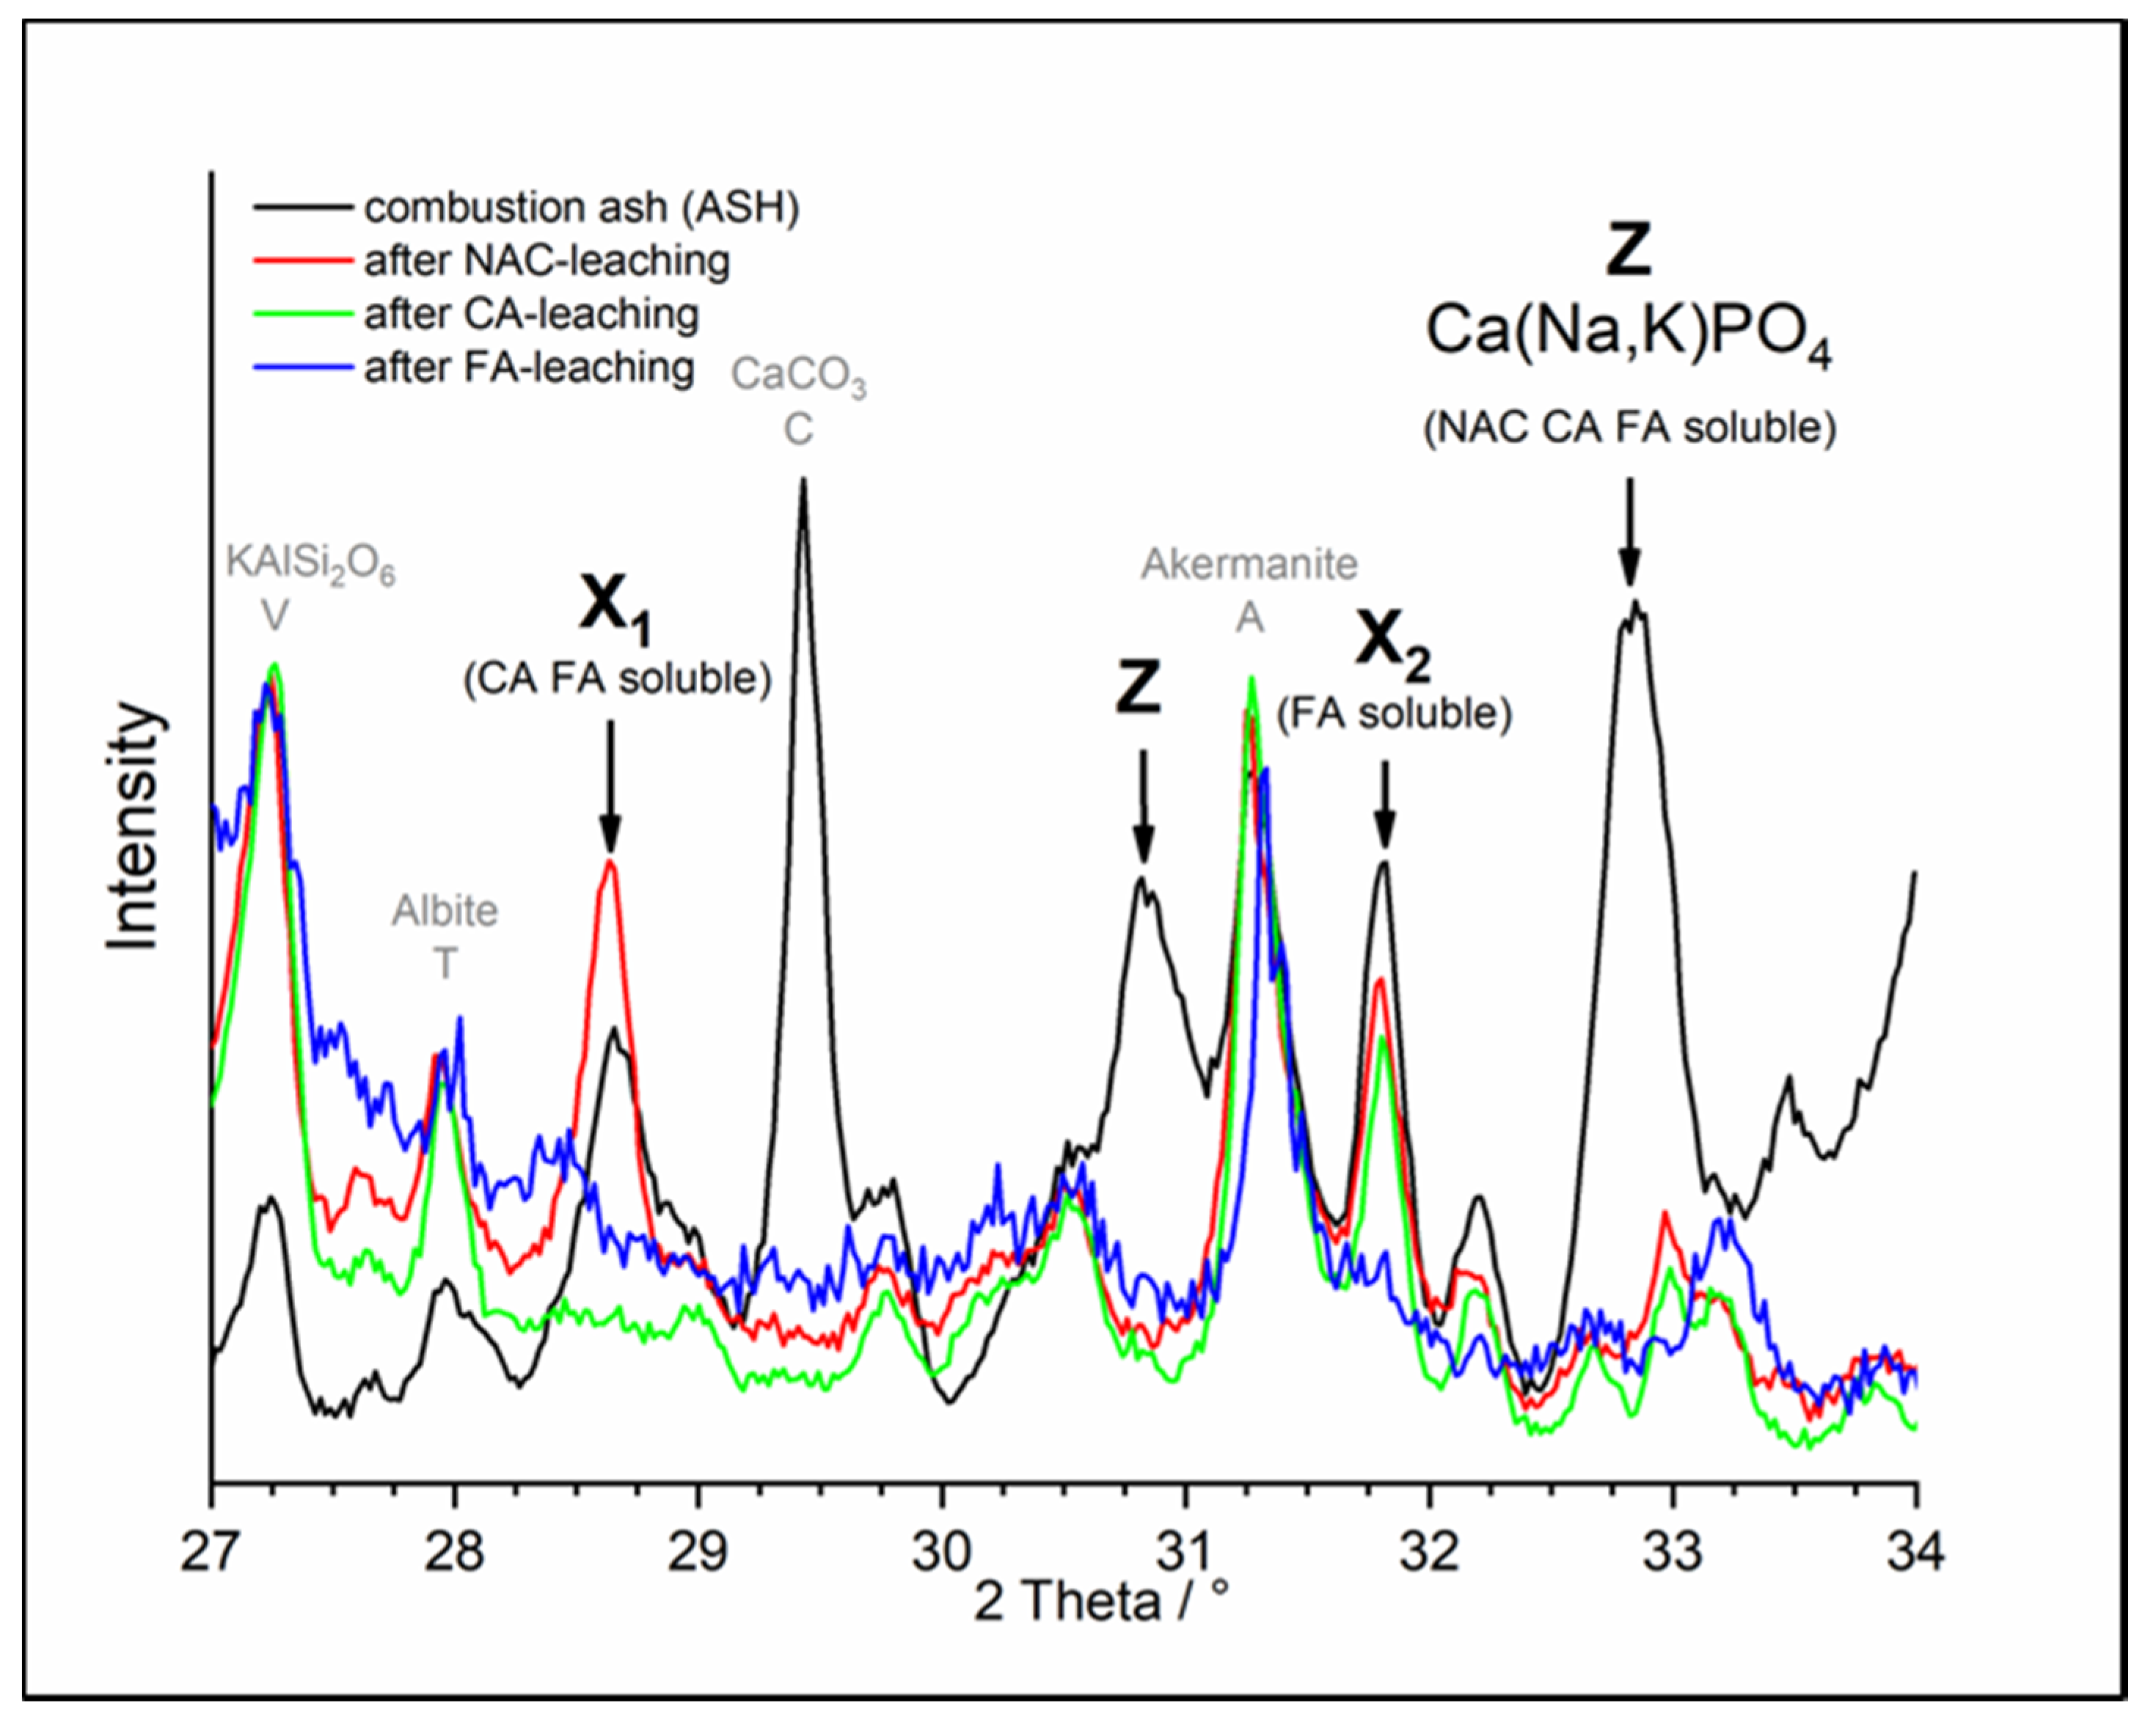
Identification of crystalline P-phases was difficult because four common P-bearing phases, such as apatite, whitlockite, AlPO4, and pyrophosphates, could not be identified by XRD in ASH (Figure A6). In order to identify the possible P-bearing crystalline phases, the ash was extracted with NAC, FA, or CA accompanied by XRD investigations before and after extraction (Figure A7).
Calcium alkali phosphate was related to reflexes, which disappear after leaching with NAC, FA, and CA (Figure A7). The composition was approximately Ca2NaK(PO4)2 according to data base entry (International Centre for Diffraction Data Powder diffraction file entry 00-051-0579). A reflex shift in the diffractogram pattern indicated that this phase contained more K than Na. Therefore, this crystalline P-phase was named with the general formula CaNaxK1-xPO4 (x < 0.5) or Ca(Na,K)PO4.
Two further reflexes could not be associated with any known P-phase according to the data base. It is noticeable that these reflexes were shifted towards reflexes of known whitlockite phases. One reflex disappeared after leaching with CA as well as with FA (phase X1), whereas the other one disappeared after leaching with FA (phase X2) (Figure A7). However, these two P-phases in ASH were not clearly identified and are named ‘undefined P-phases’ in the following. Thermochemical treatments of ASH with Na2SO4 and Na2SO4/K2SO4 transformed all detected crystalline P-phases to CaNaPO4, while Ca(Na,K)PO4 and the ‘undefined P-phases’ disappeared (Table 2).

3.2.2. P-Fertilization Effects of ASH-Based Fertilizers

To investigate the shoot growth dynamics of soybeans receiving no-P, ASH, ASH+Na, and ASH+Na/K, non-invasive measurements of leaf area were taken. The availability of P caused deviations in leaf area. From 21 d after transplant until the end of the experiment, soybean growth without any P-fertilization was statistically shown to have the lowest estimated leaf area (no observed changes in the area of 100 cm2; Figure 4B). Although the leaf areas of soybeans of all three ash treatments enlarged significantly over time, there were no statistically significant differences between the fertilization treatments (Figure 4B). Over the course of 35 d of growth, i.e., from first to last measurement, soybeans receiving P from ASH, ASH+Na, and ASH+Na/K increased the estimated leaf areas 6.8-, 8.1-, and 8.5-fold, respectively. Estimated leaf area (Figure 4B) and final shoot development (Figure 4A) were reflected in the total dry biomass of soybeans after 41 d growth, i.e. No-P control soybeans accumulated significantly less total dry biomass from shoot and root organs than ASH, ASH+Na, and ASH+Na/K fertilized plants (Figure 4C). This was supported by biomass partitioning to the roots, as control soybeans partitioned significantly more biomass to the roots than plants fertilized by ASH and its thermochemical products (Figure 4D). However, while the estimated leaf area and total dry biomass accumulation seemed to depend on fertilization treatment, it did so without any statistical support (Figure 4B,C). The trend of higher availability of P from ASH+Na and ASH+Na/K than from ASH alone affected biomass partitioning to the roots. Plants receiving P from ASH+Na and ASH+Na/K tended to partition less biomass to the roots than plants fertilized by ASH alone (Figure 4D).
The soil pH levels were 5.3 in negative control treatment (No-P) and around 6 in ASH, ASH+Na, and ASH+Na/K fertilized soils (data not shown). No DGT analysis, Mehlich-I extraction, and measurement of P uptake were conducted with ASH and its thermochemical products because no significant differences in plant growth analyses were detected (Figure 4A–D).

4. Discussion

4.1. Gasification Residue (GR) and Its Thermochemical Products

4.1.1. Effect of Thermochemical Treatment on Plant Growth

The positive fertilization effects of GR, GR+Na, and GR+Na/K were detected by improved shoot growth, significantly increased total plant dry matter from shoot and root organs, and uptake of P compared to control plants (Figure 3A–C). However, only fertilization with GR+Na significantly decreased the biomass partitioning to the roots (Figure 3D), indicating higher P-fertilization performance compared to GR and GR+Na/K, as plants growing under nutrient deficient conditions invest their resources to increase the root density [48] and to increase the surface area of exchange between the roots and the rhizosphere [55]. Here, we did not consider the influence of differences in K and nitrogen (N) availability, as these nutrients were provided in excess. Compared to unfertilized plants, the improved growth of soybeans with bagasse or bagasse-based ash fertilizers is in agreement with previous studies on lettuce and cucumber [56], corn [6], sugarcane [57], wheat [7,8], and bean and Chinese kale [58].
The positive effects of thermochemical treatments on plant P availability from GR-based products to soybeans growing in acidic Oxisol soil (Figure 3A–C) are in agreement with previous studies reporting significant increases of P availability from sewage sludge ash-based products to maize growing in sandy soil [20], in nutrient-poor subsoil [21] and in sandy soil/quartz sand and loamy sand/quartz sand blends [22]. The increased availability of P derived from thermochemical treatment is further supported by extraction analyses in varying solutions (Figure 2).

4.1.2. Extraction Methods and Crystalline Phase Composition

Fertilization performance, which was determined by total dry biomass of soybean plants and P uptake, depended strongly on the extractable P (Figure 2) and the crystalline P-phase composition of GR, and its thermochemical products, GR+Na and GR+Na/K (Table 2). The extractable P of GR correlates with the extractable P of its main P-bearing crystalline phase whitlockite. Ando [54] investigated synthetized whitlockites and found extractable P in CA and NAC comparable to that found in GR. In contrast to whitlockite, P from the minor pyrophosphate compound CaK2P2O7 is completely extractable in NAC and CA [18]. The impact of CaK2P2O7 on the overall extractable P of GR was negligible due to its low concentration.
The extraction of P from GR varied depending on the extractant, with extractable P lowest in NAC, medium in FA and highest in CA (Figure 2). The extraction of P with NAC, FA and CA depends on pH and the extraction mechanism. NAC extracts the lowest amount of P (Figure 2), as it acts solely as a complexing agent [59]. Contrary to NAC, FA has low complexing ability but acts through decreasing pH, whereas CA combines the mechanisms of both FA and NAC as it is a weak acid and strong metal-complexing agent [59]. These findings suggest that the extraction and solubilization of P by soybeans from whitlockite and other less prominent phosphates in GR require both characteristics of the extraction solutions, i.e. acidification of GR particles and complexing of P bearing ions.
The thermochemical treatment of GR with Na2SO4 (GR+Na) and Na2SO4/K2SO4 (GR+Na/K) transformed whitlockite and CaK2P2O7 into CaNaPO4 (Table 2) is in agreement with previous studies [21,37]. Even though P from CaNaPO4 was reported to be completely extractable in CA [60], NAC [23] and FA [19], we found that extractable P ranged from 80 to 90% (Figure 2) due to incomplete transformation of whitlockite into CaNaPO4 in GR+Na and GR+Na/K (Table 2). This was caused by incomplete reaction between GR and the added alkali sulfates, observed as residual Na2SO4 and K3Na(SO4)2 remaining in GR+Na and GR+Na/K (Figure A2 and Table A2). This transformation can most likely be improved by changing the solid/atmosphere ratio in the crucible trials, or the addition of a reducing agent, e.g., chicken manure, and should be investigated in future studies.

4.1.3. Soil Tests

To test if the fertilizer performance of P derived from GR and its thermochemical products using soybeans could be predicted from DGTincubation, we correlated the DGT extractable P from soil with total plant dry matter yield and P uptake. DGTharvest and Mehlich-I measurements were performed and compared to the P-fertilization effect of GR, GR+Na, and GR-Na/K before and after (residual P) plant growth.
Results of DGTincubation (Figure 3E) and DGTharvest (Figure 3F) showed realistic trends [30] but should be treated with caution due to the low number of data points and replicates. The high relative standard deviations of up to 55% observed for DGTharvest (Table A3) were most likely due to the low P-concentration ranges in the samples. Similar variance can also be found in the studies of Six et al. [27] and Vogel et al. [30].
The fertilization effects predicted from DGTincubation correlated well with P uptake (R2 = 0.89, Figure 3E). This method might be closer to the conditions in the field as DGT mimics the uptake of P by roots, unlike traditional extractions in solution. Correlation coefficients around R2 = 0.90 were reported by Vogel et al. [30] and Duboc et al. [29], which support our findings despite low replicate numbers and only four data points.
The correlation coefficient R2 = 0.89 from DGTharvest compared to R2 = 0.64 from Mehlich-I extraction (Figure 3F,G) led us to conclude that the DGTharvest method better predicts the plant availability of P remaining in acidic Oxisol than the extraction with Mehlich-I solution, even if DGTharvest has higher variance. Mehlich-I extraction is the most common procedure used to quantify extractable P in Oxisol soil in Brazil [25], but our results suggest that application of alternative methods such as DGT might improve prediction of available P and should be tested in Brazil under field conditions.

4.2. Different Phase Composition between GR and ASH

To scrutinize the positive effect of the thermochemical treatment on plant P availability, we further compared the thermal conversion products from gasification (GR) with products from combustion (ASH).
The P-phases differed among the various products, even though thermal co-processing of bagasse pellets and chicken manure was used in the production of both GR and ASH (Table 2). This indicates that either the gasification or combustion process conditions or the different ratios of bagasse pellets to chicken manure affect the P-phase formation.
The reaction temperature and chemical composition of GR and ASH were most likely less relevant for different phase formations, as both processes reached maximum temperatures of around 800 °C and the weight ratios of K/P (1.1 in GR and 1.3 in ASH) are adequate to form Ca(Na,K)PO4 [34]. The different ratios between bagasse pellets and chicken manure in GR (85:15 by weight) and in ASH (60:40 by weight) had no effect on the formation of P-phase, because the combustion of bagasse pellets and chicken manure in the ratio of 80:20 formed the same P-phases as ASH with 60 wt.% bagasse pellets and 40 wt.% chicken manure (data not shown). According to Christel et al. [17] and Bergfeldt et al. [18], processing conditions may affect the formation of P-phases in gasification residues and ashes. During co-combustion in the grate furnace, the contact time between ash particles from different origins was considerable, facilitating the formation of complex crystalline phases, such as Ca(Na,K)PO4, Ca2MgSi2O7, (Na,Ca)(Si,Al)4O8, NaAlSi2O6, and KAlSi2O6 (Figure A6). Compared to the grate furnace, the contact time between particles in a fluidized bed process is short, so the formation of complex crystalline phases in the co-gasification residue was limited. Consequently, only crystalline phases of simple chemical compositions, such as Ca9M(PO4)7, CaK2P2O7, SiO2, CaCO3, and KCl, occurred in GR (Figure A2).
Bogush et al. [34] detected Ca(Na,K)PO4 in chicken manure ash remaining after the combustion process. We conclude comparable P extractability from ASH and its thermochemical products is related to Ca(Na,K)PO4 and CaNaPO4 (Table 2), as the two phases belong to the same phase system. Whitlockite is more stable than Ca(Na,K)PO4 [19], which was reflected by lower extractability of P in CA, FA, and NAC from GR than from ASH (Figure 2).

4.3. Thermochemical Treatment of ASH

In the second greenhouse pot experiment, soybeans receiving P from ASH+Na and ASH+Na/K accumulated more total dry biomass than ASH fertilized plants, albeit without any statistical support (Figure 4C). Increased biomass accumulation is related to P availability, demonstrated by the linear correlation in GR-, GR+Na-, and GR+Na/K-fertilized soybean plants (R2 = 0.96; Figure A4). Higher availability of P from ASH+Na and ASH+Na/K than from ASH was in accordance with the crystalline P-phases (Table 2) and CA and NAC extractable P (Figure 2). The lower extractability and availability of P from ASH to soybeans was probably due to the presence of two ‘undefined P-phases’ which were less soluble than CaNaPO4 (Table 2). Thus, fertilization of plants with ASH, providing highly soluble Ca(Na,K)PO4 (Table 2), resulted in leaf areas comparable to those of soybeans fertilized with ASH+Na and ASH+Na/K during the first three weeks of growth (Figure 4B). We suggest that the lower availability of P from the “undefined P-phases” (Table 2) limited the leaf area development of soybeans in the later growth phases (Figure 4).
Soybeans, and plants in general, secrete a range of organic acids [61,62] that can acidify the rhizosphere and/or complex metal ions promoting P solubilization [63,64,65]. This activity can depend on the local soil conditions. Also, adaptations of root system architecture to specific soil conditions are instrumental in increasing P uptake [61,65]. These mechanisms may further affect how efficiently soybeans obtain P from GR, ASH, root mass fraction (RMF) and their thermochemical products. Thus, the P-fertilization performance of the products needs to be further investigated in long-term experiments which take species-specific plant traits into account.

5. Conclusions

We tested thermal co-conversion products of sugarcane bagasse- and chicken manure as P-fertilizer for soybeans. Thermochemical treatments increased the availability of P from the bagasse-based products to soybeans compared to untreated ashes, due to the formation of crystalline calcium sodium phosphate.
The identification of the crystalline P-phases allowed us to predict the amount of extractable P and, thus, the fertilization performance of bagasse-based gasification residues, ashes and their thermochemical products to soybeans growing in acidic Oxisol. However, the efficiency of thermochemical post-treatment is negligible if calcium alkali phosphates are already present in co-combusted bagasse/chicken manure ash prior to the thermochemical treatment.
Furthermore, the DGT approach was highly correlated with soybean P uptake and total plant biomass accumulation, suggesting it as a more reliable predictor of plant-available P than extraction in Mehlich-I solution. This should be further studied under field conditions.

6. Outlook

Thermochemical post-treatments increased plant availability of P from GR- and ASH-based products and further analyses should now identify the effects of chicken manure in bagasse-based products and processing effects on P-phases. In addition, further understanding the role of extractable P and its availability to soybeans and other plants, primarily sugarcane, can help make progress in the closing of nutrient cycles. To conclusively estimate the availability of P from bagasse-based ashes, more detailed plant experiments are crucial, since plant roots and associated microorganisms actively modify the rhizosphere environment to mobilize P. When discussing ash-based fertilizers for application in agricultural contexts, experiments under field conditions using locally relevant agricultural practices are particularly indispensable, since biotic and abiotic factors may influence the availability of P to plants. Furthermore, studies under field conditions are needed to confirm superiority of novel DGT methods over the commonly used standard methods of Mehlich-I, calcium acetate lactate (CAL), and Olsen.

Author Contributions

The conceptualization and methodology of the study was realized and approved by H.H., V.D., S.D.S., and C.A.; principal investigation, formal data analysis and visualization, H.H. and V.D.; additional investigation, C.V., S.W., G.V.L., M.M., and F.M.; the original draft was written by H.H., V.D., S.D.S., and C.A.; all authors reviewed, edited and approved the final manuscript; main resources for the experiments were provided by J.W.Z., W.A.d.F.-Z., M.M., and F.M.; funding acquisition, J.W.Z., W.A.d.F.-Z., N.D.J., and C.A. All authors have read and agreed to the published version of the manuscript.

Funding

The research was conducted in the framework of the project ASHES and funded by the German Federal Ministry of Education and Research (BMBF, grand number 031A288). C.V. thanks the German Research Foundation (VO 1794/4-1) for financial support.

Acknowledgments

We appreciate the help of Marlene Müller, Edelgard Schölgens and Lucy Harrison. The authors also wish to thank Christopher DeLong, Steven Dean Calahan, and Sarah Kenyon for critically reading and editing the manuscript.

Conflicts of Interest

The authors declare no conflict of interest.

Appendix A

Table A1. Weights of materials in g for thermochemical post-treatment.
GRASHChicken ManureNa2SO4K2SO4
GR+Na30000750
GR+Na/K300006025
ASH+Na0300901350
ASH+Na/K03009011045
Figure A1. Correlation of projected shoot area measured in the “ScreenHouse” platform and true leaf areas measured after the harvest (Li-3100, Li-cor, Lincoln, NE, USA). Only projected shoot areas and true leaf areas of soybeans that fit in the “ScreenHouse” platform 40 d after transplanting, i.e., 13 plants were correlated to calculate the calibration curve for transformation the data from px2 to cm2.
Agronomy 10 00895 g0a1

Appendix A.1. Description of Phases Which Contain No P

Appendix A.1.1. GR-Based Fertilizers

GR was produced by gasification at 827 °C in a reducing atmosphere. However, gasification was an incomplete thermal conversion, indicated also by LOI 36 wt.% (Table 1). Therefore, phases could be detected which are not normally stable at 827 °C. For example, KCl “labelled as Cl” has a melting point below 800 °C [66] and was still present in the sample. The presence of KCl and CaCO3 “C” are in agreement with the analysis of biochar (gasification at 500 °C) of chicken manure by Bergfeldt et al. [18]. Apparently, the formation of both phases is not influenced by co-gasification with bagasse. Only SiO2 as quartz “Q” could be detected (Figure A2 and Table A2).
The thermochemical post-treatment with alkali additives at 1000 °C in a reducing atmosphere reduced the LOI to below 10% and transformed the crystalline phases. Magnetite “M” identified in gasification residue was oxidized to hematite “H” because samples were cooled down in air (Figure A2, Table A2). The use of sodium and potassium sulfates as additives supports the formation of anhydrate (CaSO4) “An”. SiO2 reacts on the one hand with CaCO3 and Mg-phases to Akermanite (Ca2MgSi2O7) “A” and on the other hand, it reacts with additives Na2SO4 und K2SO4 to form phases according to the nepheline-group ((Na,K)AlSiO4) “E”. Additionally, the K-endmember Kalsilite (KAlSiO4) ‘K’ was detected, in case K2SO4 was an additive in GR+Na/K.

Appendix A.1.2. ASH-Based Fertilizers

ASH contains the same main phases as in GR. These are quartz “Q” and calcite “C”. Additionally, they contain free lime “F”, periclase MgO “G”, hematite “H” and further silicate phases Albite (Na,Ca)(Si,Al)4O8 ‘T’, NaAlSi2O6 ‘U’, and Leucite KAlSi2O6 ‘V’ (Figure A6, Table A2). The thermochemical post-treatment with alkali sulfates leads to the transformation of two silicate phases Akermanite “A” and Ca4Na4Si6O18 “B” (Figure A6 and Table A2). One alkali sulfate phase was formed by additive excess. This is NaKSO4 in sample Ash+Na and K3Na(SO4)2 in sample Ash+Na/K (Table A2).
Figure A2. Diffraction pattern for GR and its thermochemical treated products with Na2SO4 (GR+Na) and Na2SO4/K2SO4 (GR+Na/K). Phosphate phases (bold): P—CaNaPO4, W—Whitlockite type, Y—CaK2P2O7; Other phases: A—Akermanite Ca2MgSi2O7, An—Anhydrate CaSO4, C—Calcite CaCO3, Cl—KCl, E—Nepheline type (K,Na)AlSiO4, H—Hematite Fe2O3, K—K3Na(SO4)2, L—Kalsilite KAlSiO4 (a Nepheline type), M—Magnetite Fe3O4, N—Na2SO4, Q—Quartz SiO2.
Agronomy 10 00895 g0a2
Table A2. Identified mineral phases for GR-based and ASH-based fertilizers according to diffraction data. Meaning of symbols: ‘-’ not present Agronomy 10 00895 i001 low Agronomy 10 00895 i002 medium Agronomy 10 00895 i003 high amount. This quantification is a crude semi-quantification with comparison of reflex intensity and chemical composition.
Quartz SiO2Sylvin KClCalcite CaCO3Akermanite Ca2MgSi2O7Nepheline (K,Na)AlSiO4Kalsilite KAlSiO4Na2SO4K3Na(SO4)2Anhydrate CaSO4Magnetite Fe3O4Hematite Fe2O3
QClCAELNKAnMH
GR Agronomy 10 00895 i003 Agronomy 10 00895 i001 Agronomy 10 00895 i002------ Agronomy 10 00895 i002-
GR + Na--- Agronomy 10 00895 i001 Agronomy 10 00895 i003- Agronomy 10 00895 i003 Agronomy 10 00895 i001 Agronomy 10 00895 i002- Agronomy 10 00895 i002
GR + Na/K--- Agronomy 10 00895 i001 Agronomy 10 00895 i001 Agronomy 10 00895 i003 Agronomy 10 00895 i002 Agronomy 10 00895 i003 Agronomy 10 00895 i002- Agronomy 10 00895 i002
Quartz SiO2Cristob. SiO2Calcite CaCO3Akermanite Ca2MgSi2O7Free lime Ca(OH)2Na4Ca4Si6O18KNaSO4K3Na(SO4)2Periclase MgOFurther silicatesHematite Fe2O3
QCrCAFBJKGT/U/VH
ASH Agronomy 10 00895 i002 Agronomy 10 00895 i001 Agronomy 10 00895 i001 Agronomy 10 00895 i001 Agronomy 10 00895 i002--- Agronomy 10 00895 i001 Agronomy 10 00895 i001 Agronomy 10 00895 i001
ASH + Na--- Agronomy 10 00895 i003- Agronomy 10 00895 i003 Agronomy 10 00895 i002--- Agronomy 10 00895 i001
ASH + Na/K--- Agronomy 10 00895 i003- Agronomy 10 00895 i003- Agronomy 10 00895 i002-- Agronomy 10 00895 i001
Figure A3. 1D 31P NMR spectra and enlarged insets of GR, GR + Na, and GR + Na/K recorded in a mixture of 30% NaOD and D2O on a Bruker Avance III 600 MHz with 31P frequency of 242.81 MHz (24K scans, aq = 0,67 s; d1 = 1 s). The spectra were referenced to methylenediphosphonic acid at 16.8 ppm. The signal marked with * is not assigned.
Agronomy 10 00895 g0a3
Figure A4. Correlation of TPDM and P uptake from GR, GR+Na, and GR+Na/K (first experiment).
Agronomy 10 00895 g0a4
Figure A5. Linear correlation of TPDM vs. soil extraction methods Mehlich-I (A), DGTharvest (B), and DGTincubation (C). All values are means ± standard error of means (TPDM: four biological replicates, and Mehlich-1, DGTharvest and DGTincubation: duplicate measurements).
Agronomy 10 00895 g0a5
Table A3. pH, aqua regia, Mehlich-I, and DGTharvest from the soils after harvest. DGTincubation of the fertilizers/Oxisol soil-mixture after 2 weeks incubation. The values represent means ± standard deviations (duplicate measurements).
Used FertilizerpHAqua Regia [mg/kg]Mehlich-I [mg/kg]DGTharvest [µg/l]DGTincubation [µg/l]
No P5.4447 ± 32.3 ± 0.52.5 ± 2.1 11.7 ± 6.1
GR5.8521 ± 158.1 ± < 0.18.6 ± 2.4 19.0 ± 4.2
GR+Na5.7530 ± 78.1 ± 0.119.4 ± 7.8 62.4 ± 16.5
GR+Na/K5.7529 ± 397.4 ± 0.613.2 ± 7.343.6 ± 7.6
Figure A6. Diffraction pattern for ASH and its thermochemical treated products with Na2SO4 (ASH+Na) and Na2SO4/K2SO4 (ASH+Na/K). Phosphate phases (bold): P—CaNaPO4, X1—CA-/FA-soluble P-phase, X2—FA-soluble P-phase, Z—Ca(Na,K)PO4; Other phases: A—Akermanite Ca2MgSi2O7, B—Na4Ca4Si6O18; C—Calcite CaCO3, Cr—Cristobalite SiO2, F—free lime Ca(OH)2, G—MgO, H—Hematite Fe2O3, J—KNaSO4, K—K3Na(SO4)2, Q—Quartz SiO2, T—Albite (Na,Ca)(Si,Al)4O8, U—NaAlSi2O6, V—Leucite KAlSi2O6.
Agronomy 10 00895 g0a6
Figure A7. Section of diffraction pattern for original material ASH (black), leached after NAC (red), after CA (green), and after FA (blue).
Agronomy 10 00895 g0a7

References

  1. Almazan, O.; Gonzalez, L.; Galvez, L. The sugar cane, its by-products and co-products. In Proceedings of the AMAS, Réduit, Mauritius, 17–18 November 1998; pp. 13–25. [Google Scholar]
  2. Rocha, G.J.d.M.; Nascimento, V.M.; Gonçalves, A.R.; Silva, V.F.N.; Martín, C. Influence of mixed sugarcane bagasse samples evaluated by elemental and physical–chemical composition. Ind. Crops Prod. 2015, 64, 52–58. [Google Scholar] [CrossRef]
  3. Ochoa George, P.A.; Eras, J.J.C.; Gutierrez, A.S.; Hens, L.; Vandecasteele, C. Residue from Sugarcane Juice Filtration (Filter Cake): Energy Use at the Sugar Factory. Waste Biomass Valorization 2010, 1, 407–413. [Google Scholar] [CrossRef]
  4. FAOSTAT. Available online: http://www.fao.org/faostat/en/#compare (accessed on 3 March 2020).
  5. Ferreira, E.P.d.B.; Fageriae, N.K.; Didonet, A.D. Chemical properties of an oxisol under organic management as influenced by application of sugarcane bagasse ash. Revista Ciência Agronômica 2012, 43, 228–236. [Google Scholar] [CrossRef]
  6. Pita, V.; Vasconcelos, E.; Cabral, F.; Ribeiro, H.M. Effect of ash from sugarcane bagasse and wood co-combustion on corn growth and soil properties. Arch. Agron. Soil Sci. 2012, 58, S206–S212. [Google Scholar] [CrossRef]
  7. Thind, H.S.; Singh, Y.; Sharma, S.; Singh, V.; Sran, H.S.; Singh, B. Phosphorus fertilizing potential of bagasse ash and rice husk ash in wheat–rice system on alkaline loamy sand soil. J. Agric. Sci. 2017, 155, 465–474. [Google Scholar] [CrossRef]
  8. Gonfa, A.; Bedadi, B.; Argaw, A. Effect of bagasse ash and filter cake amendments on wheat (Triticum turgidum L.var. durum) yield and yield components in nitisol. Int. J. Recycl. Org. Waste Agric. 2018, 7, 231–240. [Google Scholar] [CrossRef] [Green Version]
  9. Li, X.; Rubæk, G.H.; Sørensen, P. Availability of potassium in biomass combustion ashes and gasification biochars after application to soils with variable pH and clay content. Arch. Agron. Soil Sci. 2017, 64, 1119–1130. [Google Scholar] [CrossRef]
  10. Tran, Q.T.; Maeda, M.; Oshita, K.; Takaoka, M.; Saito, K. Phosphorus and potassium availability from cattle manure ash in relation to their extractability and grass tetany hazard. Soil Sci. Plant Nutr. 2018, 64, 415–422. [Google Scholar] [CrossRef]
  11. Demeyer, A.; Voundi Nkana, J.C.; Verloo, M.G. Characteristics of wood ash and influence on soil properties and nutrient uptake: An overview. Bioresour. Technol. 2001, 77, 287–295. [Google Scholar] [CrossRef]
  12. Freire, M.; Lopes, H.; Tarelho, L.A.C. Critical aspects of biomass ashes utilization in soils: Composition, leachability, PAH and PCDD/F. Waste Manag. 2015, 46, 304–315. [Google Scholar] [CrossRef] [Green Version]
  13. Schiemenz, K.; Eichler-Löbermann, B. Biomass ashes and their phosphorus fertilizing effect on different crops. Nutr. Cycl. Agroecosyst. 2010, 87, 471–482. [Google Scholar] [CrossRef] [Green Version]
  14. Müller-Stöver, D.S.; Jakobsen, I.; Grønlund, M.; Rolsted, M.M.M.; Magid, J.; Hauggaard-Nielsen, H.; Goss, M. Phosphorus bioavailability in ash from straw and sewage sludge processed by low-temperature biomass gasification. Soil Use Manag. 2018, 34, 9–17. [Google Scholar] [CrossRef]
  15. Basso, C.J.; Muraro, D.S.; Girotto, E.; Silva, D.R.O.d.; Silva, A.N.d. Poultry litter and swine compost as nutrients sources in millet. Biosci. J. 2017, 288–296. [Google Scholar] [CrossRef] [Green Version]
  16. Abdala, D.B.; Ghosh, A.K.; da Silva, I.R.; de Novais, R.F.; Alvarez Venegas, V.H. Phosphorus saturation of a tropical soil and related P leaching caused by poultry litter addition. Agric. Ecosyst. Environ. 2012, 162, 15–23. [Google Scholar] [CrossRef]
  17. Christel, W.; Bruun, S.; Magid, J.; Jensen, L.S. Phosphorus availability from the solid fraction of pig slurry is altered by composting or thermal treatment. Bioresour. Technol. 2014, 169, 543–551. [Google Scholar] [CrossRef]
  18. Bergfeldt, B.; Tomasi Morgano, M.; Leibold, H.; Richter, F.; Stapf, D. Recovery of Phosphorus and other Nutrients during Pyrolysis of Chicken Manure. Agriculture 2018, 8, 187. [Google Scholar] [CrossRef] [Green Version]
  19. Kratz, S.; Vogel, C.; Adam, C. Agronomic performance of P recycling fertilizers and methods to predict it: A review. Nutr. Cycl. Agroecosyst. 2019, 115, 1–39. [Google Scholar] [CrossRef]
  20. Severin, M.; Breuer, J.; Rex, M.; Stemann, J.; Adam, C.; Van den Weghe, H.; Kücke, M. Phosphate fertiliser value of heat treated sewage sludge ash. Plant Soil Environ. 2014, 60, 555–561. [Google Scholar] [CrossRef]
  21. Steckenmesser, D.; Vogel, C.; Adam, C.; Steffens, D. Effect of various types of thermochemical processing of sewage sludges on phosphorus speciation, solubility, and fertilization performance. Waste Manag. 2017, 62, 194–203. [Google Scholar] [CrossRef]
  22. Vogel, C.; Rivard, C.; Wilken, V.; Muskolus, A.; Adam, C. Performance of secondary P-fertilizers in pot experiments analyzed by phosphorus X-ray absorption near-edge structure (XANES) spectroscopy. Ambio 2018, 47, 62–72. [Google Scholar] [CrossRef] [Green Version]
  23. Herzel, H.; Krüger, O.; Hermann, L.; Adam, C. Sewage sludge ash—A promising secondary phosphorus source for fertilizer production. Sci. Total Environ. 2016, 542, 1136–1143. [Google Scholar] [CrossRef]
  24. Brod, E.; Øgaard, A.F.; Haraldsen, T.K.; Krogstad, T. Waste products as alternative phosphorus fertilisers part II: Predicting P fertilisation effects by chemical extraction. Nutr. Cycl. Agroecosys. 2015, 103, 187–199. [Google Scholar] [CrossRef]
  25. Empresa Brasileira de Pesquisa Agropecuária (EMBRAPA). Manual for Methods of Soil Analysis, 2nd ed.; National Service for Soil Survey and Soil Conservation: Rio de Janeiro, Brazil, 1997.
  26. Six, L.; Smolders, E.; Merckx, R. The performance of DGT versus conventional soil phosphorus tests in tropical soils—Maize and rice responses to P application. Plant Soil 2013, 366, 49–66. [Google Scholar] [CrossRef]
  27. Six, L.; Smolders, E.; Merckx, R. Testing phosphorus availability for maize with DGT in weathered soils amended with organic materials. Plant Soil 2014, 376, 177–192. [Google Scholar] [CrossRef]
  28. Hartmann, T.E.; Wollmann, I.; You, Y.; Müller, T. Sensitivity of Three Phosphate Extraction Methods to the Application of Phosphate Species Differing in Immediate Plant Availability. Agronomy 2019, 9, 29. [Google Scholar] [CrossRef] [Green Version]
  29. Duboc, O.; Santner, J.; Golestani Fard, A.; Zehetner, F.; Tacconi, J.; Wenzel, W.W. Predicting phosphorus availability from chemically diverse conventional and recycling fertilizers. Sci. Total Environ. 2017, 599–600, 1160–1170. [Google Scholar] [CrossRef]
  30. Vogel, C.; Sekine, R.; Steckenmesser, D.; Lombi, E.; Steffens, D.; Adam, C. Phosphorus availability of sewage sludge-based fertilizers determined by the diffusive gradients in thin films (DGT) technique. J. Plant Nutr. Soil Sci. 2017, 180, 594–601. [Google Scholar] [CrossRef] [Green Version]
  31. Nanzer, S.; Oberson, A.; Huthwelker, T.; Eggenberger, U.; Frossard, E. The Molecular Environment of Phosphorus in Sewage Sludge Ash: Implications for Bioavailability. J. Environ. Qual. 2014, 43, 1050–1060. [Google Scholar] [CrossRef] [Green Version]
  32. Yusiharni, B.E.; Ziadi, H.; Gilkes, R.J. A laboratory and glasshouse evaluation of chicken litter ash, wood ash, and iron smelting slag as liming agents and P fertilisers. Soil Res. 2007, 45, 374–389. [Google Scholar] [CrossRef]
  33. Staroń, P.; Kowalski, Z.; Staroń, A.; Banach, M. Thermal treatment of waste from the meat industry in high scale rotary kiln. Int. J. Environ. Sci. Technol. 2017, 14, 1157–1168. [Google Scholar] [CrossRef] [Green Version]
  34. Bogush, A.A.; Stegemann, J.A.; Williams, R.; Wood, I.G. Element speciation in UK biomass power plant residues based on composition, mineralogy, microstructure and leaching. Fuel 2018, 211, 712–725. [Google Scholar] [CrossRef]
  35. Schettino, M.A.S.; Holanda, J.N.F. Characterization of Sugarcane Bagasse ash Waste for Its Use in Ceramic Floor Tile. Procedia Mater. Sci. 2015, 8, 190–196. [Google Scholar] [CrossRef] [Green Version]
  36. Govindarajan, D.; Jayalakshmi, G. XRD, FTIR and Microstructure Studies of Calcined Sugarcane Bagasse Ash. Adv. Appl. Sci. Res. 2011, 2, 544–549. [Google Scholar]
  37. Stemann, J.; Peplinski, B.; Adam, C. Thermochemical treatment of sewage sludge ash with sodium salt additives for phosphorus fertilizer production—Analysis of underlying chemical reactions. Waste Manag. 2015, 45, 385–390. [Google Scholar] [CrossRef] [PubMed]
  38. Kuepper, B.; Steinweg, T.; Piotrowski, M. Feed and Livestock in Brazil, China, EU Consume Most Cerrado Soy. Available online: www.chainreactionresearch.com (accessed on 6 March 2020).
  39. Bordonal, R.d.O.; Carvalho, J.L.N.; Lal, R.; de Figueiredo, E.B.; de Oliveira, B.G.; La Scala, N. Sustainability of sugarcane production in Brazil. A review. Agron. Sustain. Dev. 2018, 38, 13. [Google Scholar] [CrossRef] [Green Version]
  40. Withers, P.J.A.; Rodrigues, M.; Soltangheisi, A.; de Carvalho, T.S.; Guilherme, L.R.G.; Benites, V.d.M.; Gatiboni, L.C.; de Sousa, D.M.G.; Nunes, R.d.S.; Rosolem, C.A.; et al. Transitions to sustainable management of phosphorus in Brazilian agriculture. Sci. Rep. 2018, 8, 2537. [Google Scholar] [CrossRef]
  41. Vodegel, S.; Müller, F. BioÖkonomie International: ASHES—Rückführung von Nährstoffen aus Aschen von Thermo-Chemischen Prozessen mit Bagasse bzw. Bagassestroh, Teilprojekt C.; CUTEC: Clausthal-Zellerfeld, Germany, 2019. [Google Scholar]
  42. Pettersson, A.; Åmand, L.-E.; Steenari, B.-M. Leaching of ashes from co-combustion of sewage sludge and wood—Part I: Recovery of phosphorus. Biomass Bioenergy 2008, 32, 224–235. [Google Scholar] [CrossRef] [Green Version]
  43. Pan, H.; Eberhardt, T. Characterization of fly ash from the gasification of wood and assessment for its application as a soil amendment. Bioresources 2011, 6. [Google Scholar] [CrossRef]
  44. FAO. Fertilizer Use by Crop in Brazil; Food and Agriculture Organization of the United Nation: Rome, Italiy, 2004. [Google Scholar]
  45. Nabel, M.; Schrey, S.D.; Poorter, H.; Koller, R.; Nagel, K.A.; Temperton, V.M.; Dietrich, C.C.; Briese, C.; Jablonowski, N.D. Coming Late for Dinner: Localized Digestate Depot Fertilization for Extensive Cultivation of Marginal Soil With Sida hermaphrodita. Front. Plant Sci. 2018, 9, 1095. [Google Scholar] [CrossRef]
  46. Nakhforoosh, A.; Bodewein, T.; Fiorani, F.; Bodner, G. Identification of Water Use Strategies at Early Growth Stages in Durum Wheat from Shoot Phenotyping and Physiological Measurements. Front. Plant Sci. 2016, 7. [Google Scholar] [CrossRef] [Green Version]
  47. Scharr, H.; Briese, C.; Embgenbroich, P.; Fischbach, A.; Fiorani, F.; Müller-Linow, M. Fast High Resolution Volume Carving for 3D Plant Shoot Reconstruction. Front. Plant Sci. 2017, 8, 1680. [Google Scholar] [CrossRef] [PubMed] [Green Version]
  48. Gutiérrez-boem, F.H.; Thomas, G.W. Phosphorus nutrition and water deficits in field-grown soybeans. Plant Soil 1999, 207, 87–96. [Google Scholar] [CrossRef]
  49. DIN EN 16174. Schlamm, behandelter Bioabfall und Boden—Aufschluss von mit Königswasser löslichen Anteilen von Elementen. Deutsches Institut für Normung 2012. [Google Scholar] [CrossRef]
  50. Mehlich, A. Determination of P, Ca, Mg, K, Na, and NH4. Soil Test. Div. 1953, 1–53, 23–89. [Google Scholar]
  51. EU. Regulation (EC) No 2003/2003 of the European Parliament and of the Council of 13 October 2003 Relating to Fertilizers; L304, O.J.o.t.E.U., Ed.; EU: Brussels, Belgium, 2003. [Google Scholar]
  52. Vestergren, J.; Vincent, A.G.; Jansson, M.; Persson, P.; Ilstedt, U.; Gröbner, G.; Giesler, R.; Schleucher, J. High-Resolution Characterization of Organic Phosphorus in Soil Extracts Using 2D 1H–31P NMR Correlation Spectroscopy. Environ. Sci. Technol. 2012, 46, 3950–3956. [Google Scholar] [CrossRef]
  53. Cade-Menun, B.; Liu, C.W. Solution Phosphorus-31 Nuclear Magnetic Resonance Spectroscopy of Soils from 2005 to 2013: A Review of Sample Preparation and Experimental Parameters. Soil Sci. Soc. Am. J. 2014, 78, 19–37. [Google Scholar] [CrossRef] [Green Version]
  54. Ando, J.; Matsuno, S. Ca3(PO4)2-CaNaPO4 System. B Chem. Soc. Jpn. 1968, 41, 342–347. [Google Scholar] [CrossRef] [Green Version]
  55. Zogli, P.; Pingault, L.; Libault, M. Physiological and Molecular Mechanisms and Adaptation Strategies in Soybean (Glycine max) Under Phosphate Deficiency. In Legume Nitrogen Fixation in Soils with Low Phosphorus Availability: Adaptation and Regulatory Implication; Sulieman, S., Tran, L.-S.P., Eds.; Springer International Publishing: Cham, Switzerland, 2017; pp. 219–242. [Google Scholar] [CrossRef]
  56. Lopez, R.; Padilla, E.; Bachmann, S.; Eichler-Löbermann, B. Effects of biomass ashes on plant nutrition in tropical and temperate regions. J. Agric. Rural Dev. Trop. Subtrop. 2009, 110, 49–58. [Google Scholar]
  57. Akkajit, P.; DeSutter, T.; Tongcumpou, C. Short-term effects of sugarcane waste products from ethanol production plant as soil amendments on sugarcane growth and metal stabilization. Environ. Sci. Process. Impacts 2013, 15, 947–954. [Google Scholar] [CrossRef]
  58. Webber, C.L., III; White, P.M., Jr.; Spaunhorst, D.J.; Petrie, E.C. Impact of Sugarcane Bagasse Ash as an Amendment on the Physical Properties, Nutrient Content and Seedling Growth of a Certified Organic Greenhouse Growing Media. J. Agric. Sci. 2017, 9, 1. [Google Scholar] [CrossRef] [Green Version]
  59. Camps-Arbestain, M.; Shen, Q.; Wang, T.; van Twieten, L.; Novak, J. Available nutrients in biochar. In Biochar: A Guide to Analytical Methods; Singh, B., Camps-Arbestain, M., Lehmann, J., Eds.; CSIRO Publishing: Clayton, VIC, Australia, 2017; pp. 109–125. [Google Scholar]
  60. Gunawardane, R.P.; Glasser, F.P. Reaction of chlorapatite, Ca5(PO4)3(Cl,F) with sodium carbonate and silica. J. Mater. Sci. 1979, 14, 2797–2810. [Google Scholar] [CrossRef]
  61. Vance, C.P.; Uhde-Stone, C.; Allan, D.L. Phosphorus acquisition and use: Critical adaptations by plants for securing a nonrenewable resource. New Phytol. 2003, 157, 423–447. [Google Scholar] [CrossRef] [Green Version]
  62. Tawaraya, K.; Horie, R.; Shinano, T.; Wagatsuma, T.; Saito, K.; Oikawa, A. Metabolite profiling of soybean root exudates under phosphorus deficiency. Soil Sci. Plant Nutr. 2014, 60, 679–694. [Google Scholar] [CrossRef]
  63. Haynes, R.J. Soil acidification induced by leguminous crops. Grass Forage Sci. 1983, 38, 1–11. [Google Scholar] [CrossRef]
  64. Hinsinger, P.; Plassard, C.; Tang, C.; Jaillard, B. Origins of root-mediated pH changes in the rhizosphere and their responses to environmental constraints: A review. Plant Soil 2003, 248, 43–59. [Google Scholar] [CrossRef]
  65. Hinsinger, P.; Herrmann, L.; Lesueur, D.; Robin, A.; Trap, J.; Waithaisong, K.; Plassard, C. Impact of roots, microorganisms and microfauna on the fate of soil phosphorus in the rhizosphere. In Annual Plant Reviews Volume 48; Plaxton, W.C., Lambers, H., Eds.; John Wiley & Sons, Ltd.: Hoboken, NJ, USA, 2015; pp. 375–407. [Google Scholar] [CrossRef]
  66. Rowe, J.J.; Morey, G.W.; Zen, C.S. The Quinary Reciprocal Salt System Na, K, Mg, Ca/Cl, SO4—A Review of the Literature with New Data; U.S. Government Printing Office Washington: Washington, DC, USA, 1972.
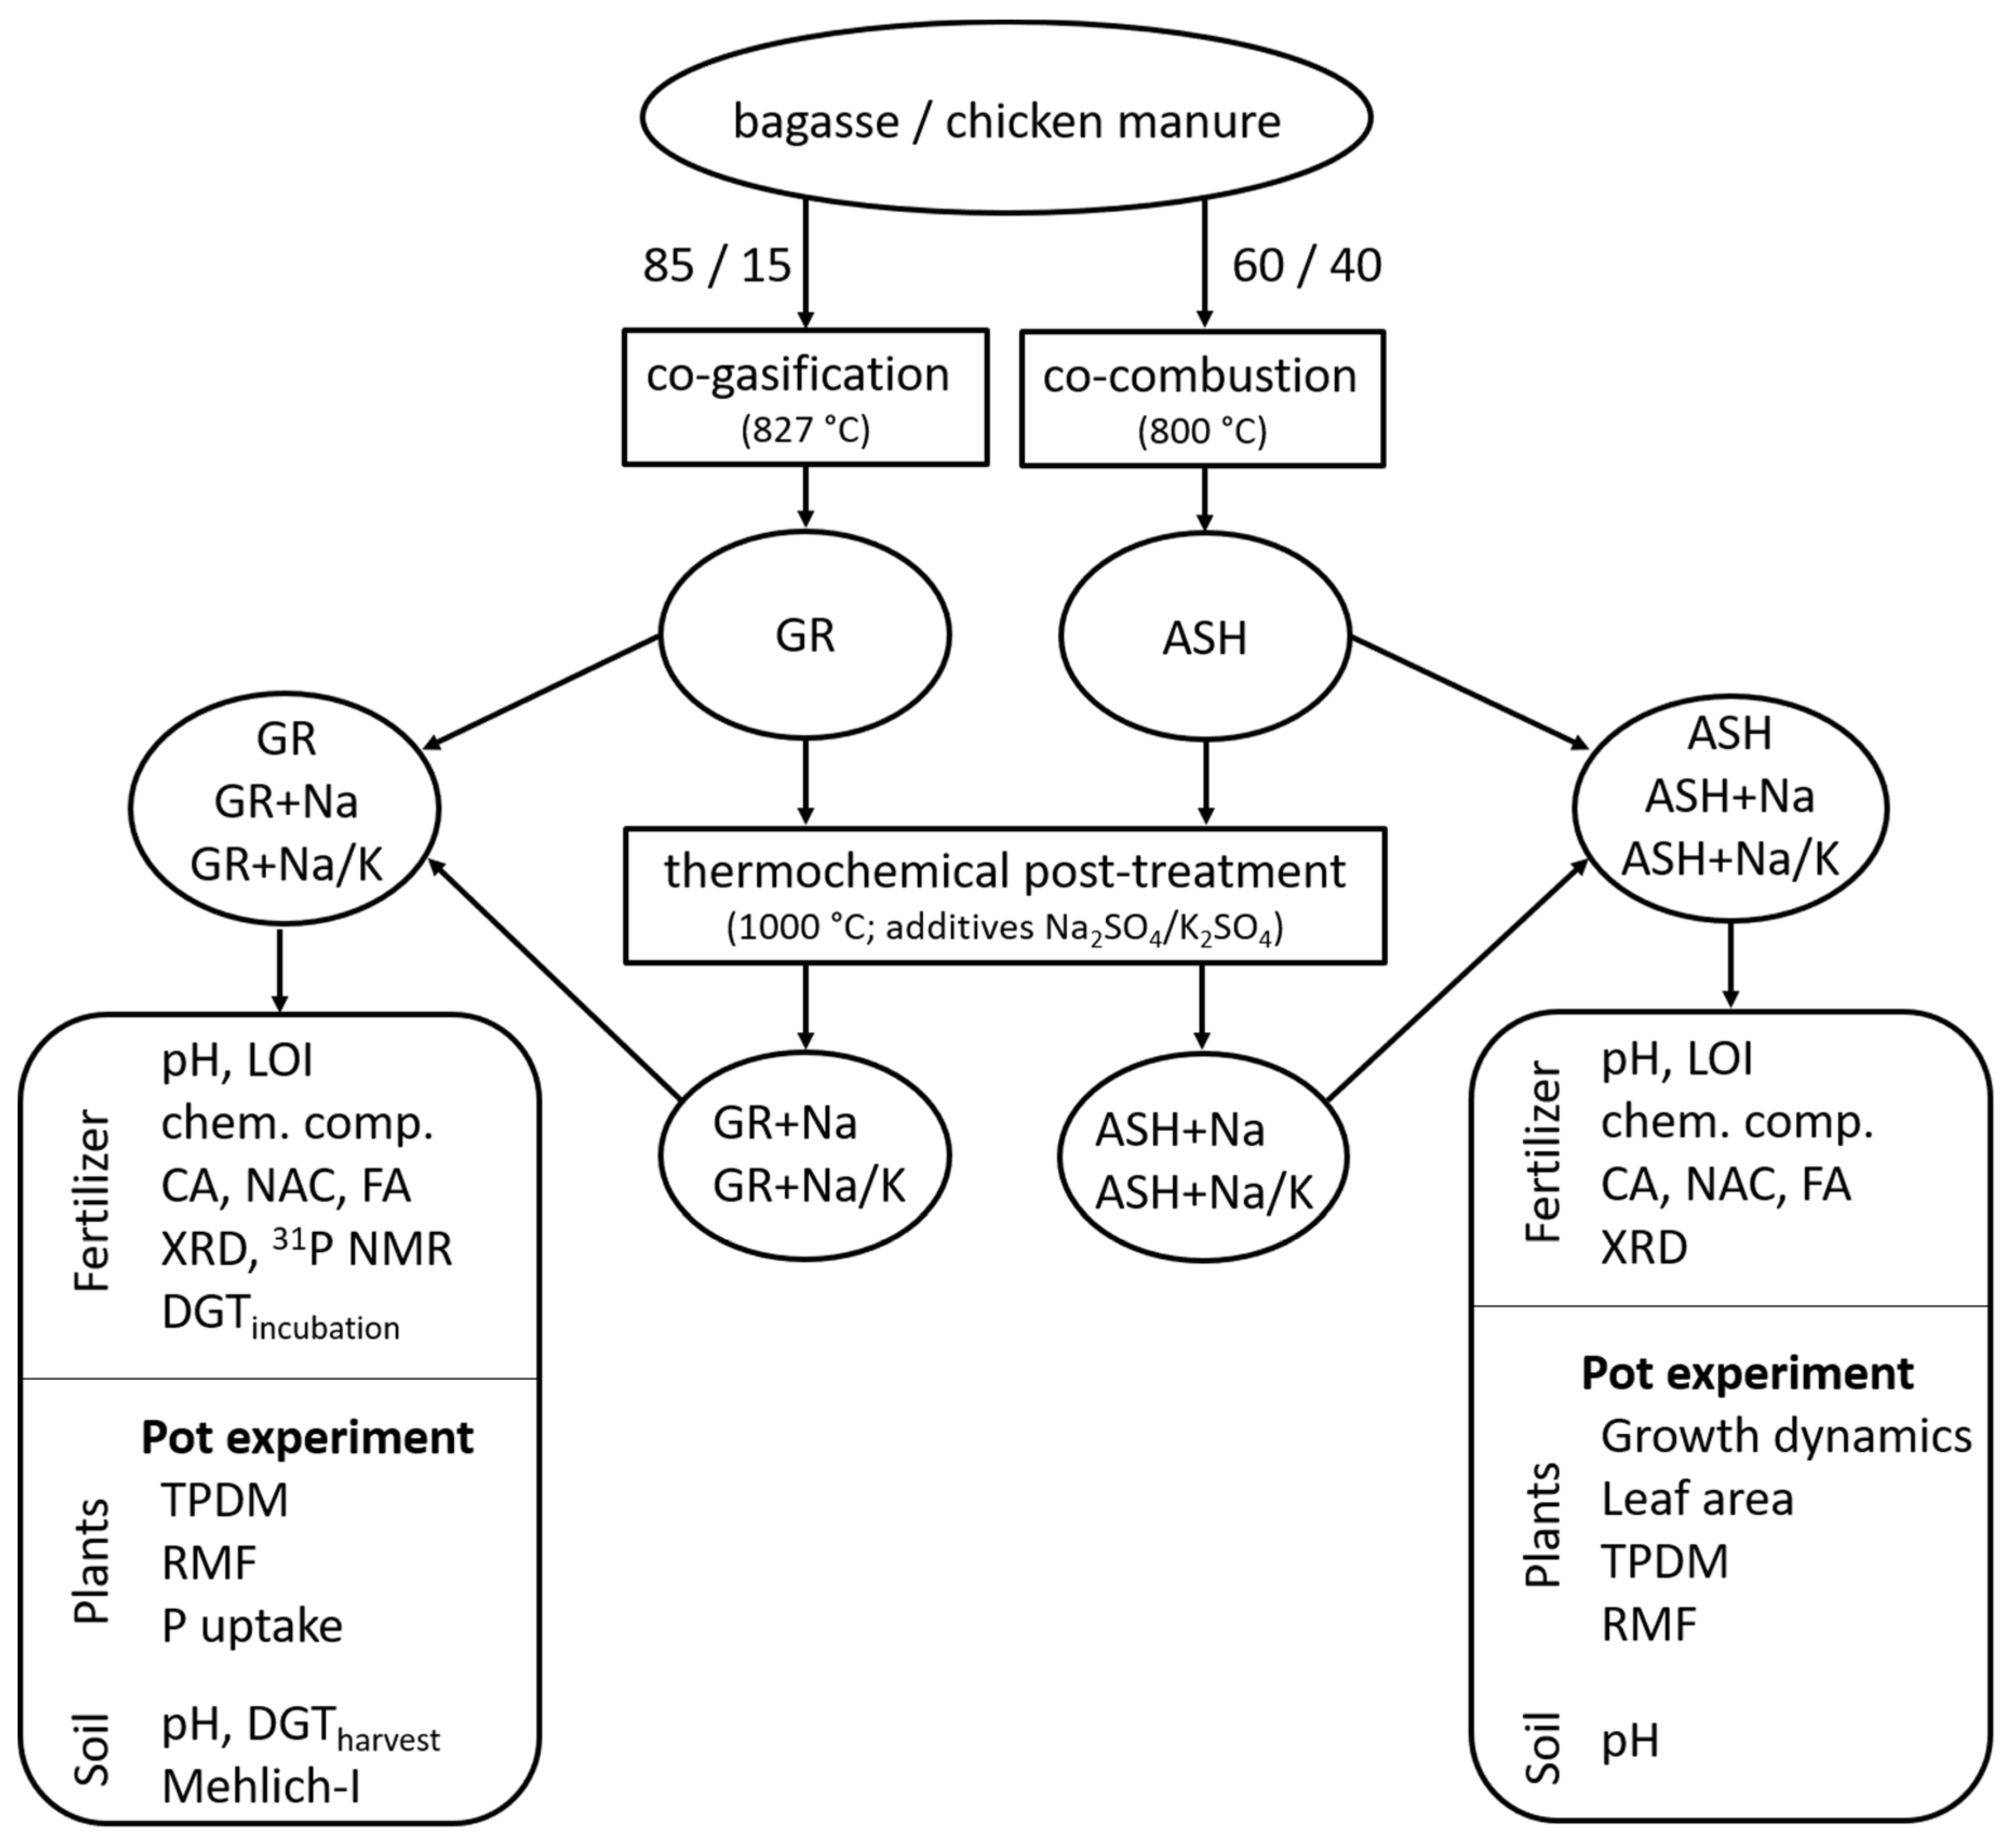
Figure 1. Flowchart for experimental setup. Bagasse was co-gasified and co-combusted with chicken manure in weight ratios of 85:15 and 60:40, respectively. Gasification residue (GR) and ash (ASH) were thermochemically treated with Na2SO4 (GR+Na, ASH+Na) and Na2SO4/K2SO4 (GR+Na/K, ASH+Na/K) at 1000 °C for 30 min. Chemical compositions, pH levels, loss of ignition (LOI), extractions in citric acid (CA), formic acid (FA), neutral ammonium citrate (NAC), as well as crystalline phases identified by X-ray diffraction (XRD) were measured in all materials. Organic phosphorus (P)-species were analyzed in GR, GR+Na, and GR+Na/K by liquid 31P nuclear magnetic resonance (NMR). GR, GR+Na, and GR+Na/K were mixed and incubated with Oxisol soil to apply diffusive gradients in thin films (DGTincubation). All materials were tested as P-fertilizer for soybeans in Oxisol soil under greenhouse conditions. Biomasses of GR, GR+Na, and GR+Na/K fertilized soybeans were analyzed for total plant dry matter (TPDM) from shoot and root organs, biomass partitioning to the roots expressed as root mass fraction (RMF) and P uptake (ΔP uptake (mmol) = Pfinal harvest (mmol) − Pfertilization beginning (mmol)). Extractability of P from the soil was measured by Mehlich-I extraction and DGTharvest. Leaf areas of ASH, ASH+Na, and ASH+Na/K fertilized soybeans were estimated with “ScreenHouse” platform over the growth period. True leaf areas, TPDM, and RMF were measured after the harvest. The pH levels were measured in all Oxisol soils.
Agronomy 10 00895 g001
Figure 2. Fractions of CA-, NAC-, and FA-extractable P related to total P from GR and ASH and their products after thermochemical treatments with Na2SO4 (GR+Na and ASH+Na) and Na2SO4/K2SO4 (GR+Na/K and ASH+Na/K). All values are means ± standard error of means (duplicate measurements).
Agronomy 10 00895 g002
Figure 3. Soybean responses to GR-based P-fertilizers and linear correlations of P uptake by soybean plants vs. soil tests, i.e., DGTincubation, DGTharvest and Mehlich-I. (A) Shoot growths, (B) TPDM, (C) P uptake, (D) RMF 59 d after fertilizer application. (E) P uptake in relation to DGTincubation of the fertilizer/Oxisol soil-mixture after 2 weeks incubation, (F) DGTharvest, and (G) Mehlich-I analyzed after harvest. All values are means ± standard error of means (vertical error bars in BG: four biological replicates, and horizontal error bars in EG: duplicate measurements). Identical letters present no significant difference (Tukey’s test, p < 0.05).
Agronomy 10 00895 g003
Figure 4. Responses of soybean seedlings to ASH-based P-fertilizers. (A) Soybean shoot growth, (B) estimated leaf areas of soybeans during the first 35 d after fertilizer application, (C) TPDM, and (D) RMF 41 d after fertilizer application. Identical letters present no significant difference (Tukey’s test, p < 0.05). All values are means ± standard error of means (five biological replicates). Statistical differences of estimated leaf areas refer to different treatments within the same measuring day.
Agronomy 10 00895 g004
Table 1. pH (0.01M CaCl2), LOI (loss on ignition) at 550 °C and chemical composition for applied P-fertilizers displayed as mean value with standard deviation (n = 2) in wt.%. Gasification residue (GR); ash (ASH).
FertilizerGRGR+NaGR+Na/KASHASH+NaASH+Na/K
pH 11.610.510.612.79.59.3
LOI (550 °C)36.08.08.12.800
Chemical Compositions
Al2.3 ± 0.12.5 ± <0.12.2 ± 0.11.6 ± <0.11.3 ± <0.11.2 ± <0.1
Ca8.8 ± 0.38.8 ± 0.58.3 ± 0.315.2 ± 0.112.4 ± 0.111.8 ± 0.1
Fe3.4 ± 0.13.3 ± <0.13.1 ± 0.12.0 ± 0.11.5 ± <0.11.4 ± <0.1
K3.6 ± 0.14.0 ± 0.16.5 ± 0.35.2 ± 0.14.4 ± 0.16.8 ± 0.1
Mg1.6 ± <0.11.6 ± 0.11.4 ± <0.11.8 ± <0.11.5 ± <0.11.4 ± <0.1
Na0.1 ± <0.12.9 ± 0.12.2 ± 0.10.2 ± <0.13.1 ± 0.12.5 ± <0.1
P3.3 ± 0.13.1 ± 0.22.9 ± <0.14.0 ± <0.13.2 ± <0.13.1 ± 0.1
S0.1 ± <0.15.5 ± <0.15.4 ± 0.10.4 ± <0.14.6 ± 0.15.0 ± 0.1
Si13.0 ± 0.212.4 ± <0.111.6 ± 0.417.0 ± 1.015.8 ± 0.514.9 ± 0.2
Table 2. P-phases related to extractable P in CA and NAC. Overview of P-phases was based on Figure A2 and Figure A6, as well as interpretation from Ando et al. [54], Bergfeldt et al. [18], and Kratz et al. [19]. Meaning of symbols: ‘-’ not present Agronomy 10 00895 i001 low amount, Agronomy 10 00895 i002 high amount, Agronomy 10 00895 i003 only one P-phase identified. This quantification is a rough semi-quantification with comparison of reflex intensity and further information about extractable P and chemical composition. 1 two ‘undefined P-Phases’, extractable in FA and/or CA.
P-Extractability in CA and NAC
LowerHigher
WhitlockiteUndefined 1Pyro-Phosp.Ca(Na,K)PO4CaNaPO4
Ca9M(PO4)7 CaK2P2O7
GR Agronomy 10 00895 i002- Agronomy 10 00895 i001--
GR+Na Agronomy 10 00895 i001--- Agronomy 10 00895 i002
GR+Na/K Agronomy 10 00895 i001--- Agronomy 10 00895 i002
ASH- Agronomy 10 00895 i001- Agronomy 10 00895 i002-
ASH+Na---- Agronomy 10 00895 i003
ASH+Na/K---- Agronomy 10 00895 i003