Article

Assessing Wheat Response to N Fertilization in a Wheat–Maize–Soybean Long-Term Rotation through NUE Measurements

1
Department of Plant Culture, Faculty of Agriculture, University of Agricultural Sciences and Veterinary Medicine, Cluj-Napoca 400372, Romania
2
Agricultural Research Development Station Turda, Turda 401100, Romania
3
Department of Environmental Protection, Faculty of Agriculture, University of Agricultural Sciences and Veterinary Medicine, Cluj-Napoca 400372, Romania
*
Authors to whom correspondence should be addressed.
Agronomy 2020, 10(7), 941; https://doi.org/10.3390/agronomy10070941
Submission received: 20 May 2020 / Revised: 25 June 2020 / Accepted: 26 June 2020 / Published: 30 June 2020
(This article belongs to the Section Innovative Cropping Systems)

Abstract

:
Nitrogen fertilization is indispensable in increasing wheat crop productivity but, in order to achieve maximum profitable production and minimum negative environmental impact, improving nitrogen use efficiency (NUE) should be considered. The aim of this study was to evaluate the nitrogen use efficiency (NUE) in a long-term wheat–maize–soybean rotation system with the final purpose of increasing the overall performance of the wheat cropping system. Research was undertaken at the Agricultural Research Development Station Turda (ARDS Turda), located in Western Transylvania Plain, Romania. The experimental field was carried out at a fixed place during seven wheat vegetation seasons. The plant material consisted of a wheat variety created by the ARDS Turda (Andrada), one variety of maize (Turda 332) and one variety of soybean (Felix). The experiment covered two planting patterns: wheat after maize and wheat after soybean and five levels of nitrogen fertilization (control-unfertilized, fertilization with 0—control plot, 30, 60, 90 and 120 kg N ha−1 y−1). The following indices were assessed: NUE (nitrogen use efficiency), N uptake and PFP (partial factor productivity). The results of the present study suggest that reduced N-fertilization doses could improve N uptake and utilization for both planting patterns.

1. Introduction

Providing higher quantities of food delivered through a sustainable agricultural system is a major challenge, an important and current concern of both agronomic scientists and farmers [1]. Although the transition to more sustainable systems has started, feeding a fast-growing world population remains a challenge with the current production patterns [2].
It is, nowadays, a fact that crop yields must be improved to meet daily food consumption and nutritional requirements [3]. Cereal protein content is dependent on genotype but is also clearly influenced by environmental conditions and agronomic techniques [4]. The availability of water is essential for crop production. The supply of water by artificial means through irrigation has as main objective to offset the effect of drought and ensures that soil moisture is sufficient to meet crop water needs and thus reduce water deficit as a limiting factor in plant growth [5]. Nitrogen (N) holds the most important role in achieving consistently high yields of cereals as well as a high accumulation of proteins in the kernel [6], and, therefore, the use of N fertilizers increases linearly with increasing grain production. The problem associated with N fertilization concerns the excess of nitrogen that is leaking into the environment in reactive forms (nitrate, ammonia and nitrogen oxides). This results in environmental damages such as air pollution and the enhancement of global climate change, water eutrophication and soils acidification.
A key aspect that should be considered when optimizing N fertilization is the evaluation of nitrogen use efficiency (NUE). Various indices are commonly used in agronomic research to assess the efficiency of applied N [7,8], mainly for purposes that emphasize crop response to N. When evaluating a management practice, it is helpful to use more than one NUE indices, allowing for a better understanding and quantification of the crop response to the applied nutrient [9]. Nitrogen use efficiency (NUE), partial factor productivity (PFP), partial nutrient balance (PNB), nitrogen response efficiency (NRE) and nitrogen apparent recovery (RE) are among the most commonly used NUE measurements. NUE indicates the potential for nutrient losses to the environment from cropping systems as managers strive to meet the increasing societal demand for food, fiber and fuel [10]. Zhao et al. [11] pointed out that excessive N fertilization may result in lower NUE. In addition to NUE, nutrient response efficiency (NRE) is an index that reflects the ability of plants to acquire N from the soil and to use it for biomass production [12], while PFP (Partial factor productivity) highlights how productive the cropping system is in comparison to its nutrient input. Dobermann and Cassman [13] highlighted that the global PFP in cereals only needs to increase at a rate of 0.1 to meet cereal demand in 2025. Such rates have been achieved in some developed regions in the past 20 years, and far greater rates of increase have been achieved in several countries [14]. Just enhancing these indicators, one can decide whether the amount of fertilizer applied is justified or not.
A visible strategy for improving NUE proposed by current research is based on the reduction in N fertilizer requirements in cropping systems through the introduction of legume crops either in a rotation [14,15] or intercropping [16].
The potential effect of rotation diversity on crop response to N fertilization is of interest given escalating N fertilizer costs and continuing concerns about the negative impact of N fertilizer production and potential losses on environmental quality [17,18,19].
Although the effect of N fertilizer on crop production has been widely investigated, the direct effect on wheat yield and/or quality in long-/short-term rotation is not well established. Legume–cereal intercropping systems can increase N use efficiency (NUE) and yield thanks to legumes ability to fix N from the atmosphere by biological N fixation [20]. Moreover, the chemical N fertilizer applied to a legume–cereal intercropping system can be efficiently utilized via interspecific N competition [14,21].
Wheat (Triticum aestivum L.) is the most important cereal crop in the world, summing an average harvested area of almost 215 million hectares in the year 2018 [22]. The total harvested area in Romania in the year 2018 was 2109 ha, which delivered a grain yield of 10,130 tones [23]. The efficiency of N application in winter wheat is an important indicator for rational N fertilization. The improvement of NUE can deliver higher wheat yields and better quality grains. In this frame, the aim of our study is to assess the NUE in a long-term wheat–maize–soybean rotation system (7 years) having as a final purpose to increase the overall performance of the wheat cropping system. In order to achieve these objectives, the following data were recorded: grain yield (GY; kg ha−1), crude protein (CP; %), NUE (%), N uptake (kg N ha−1 y−1) and PFP (kg grain kg N−1).

2. Materials and Methods

2.1. Study Site

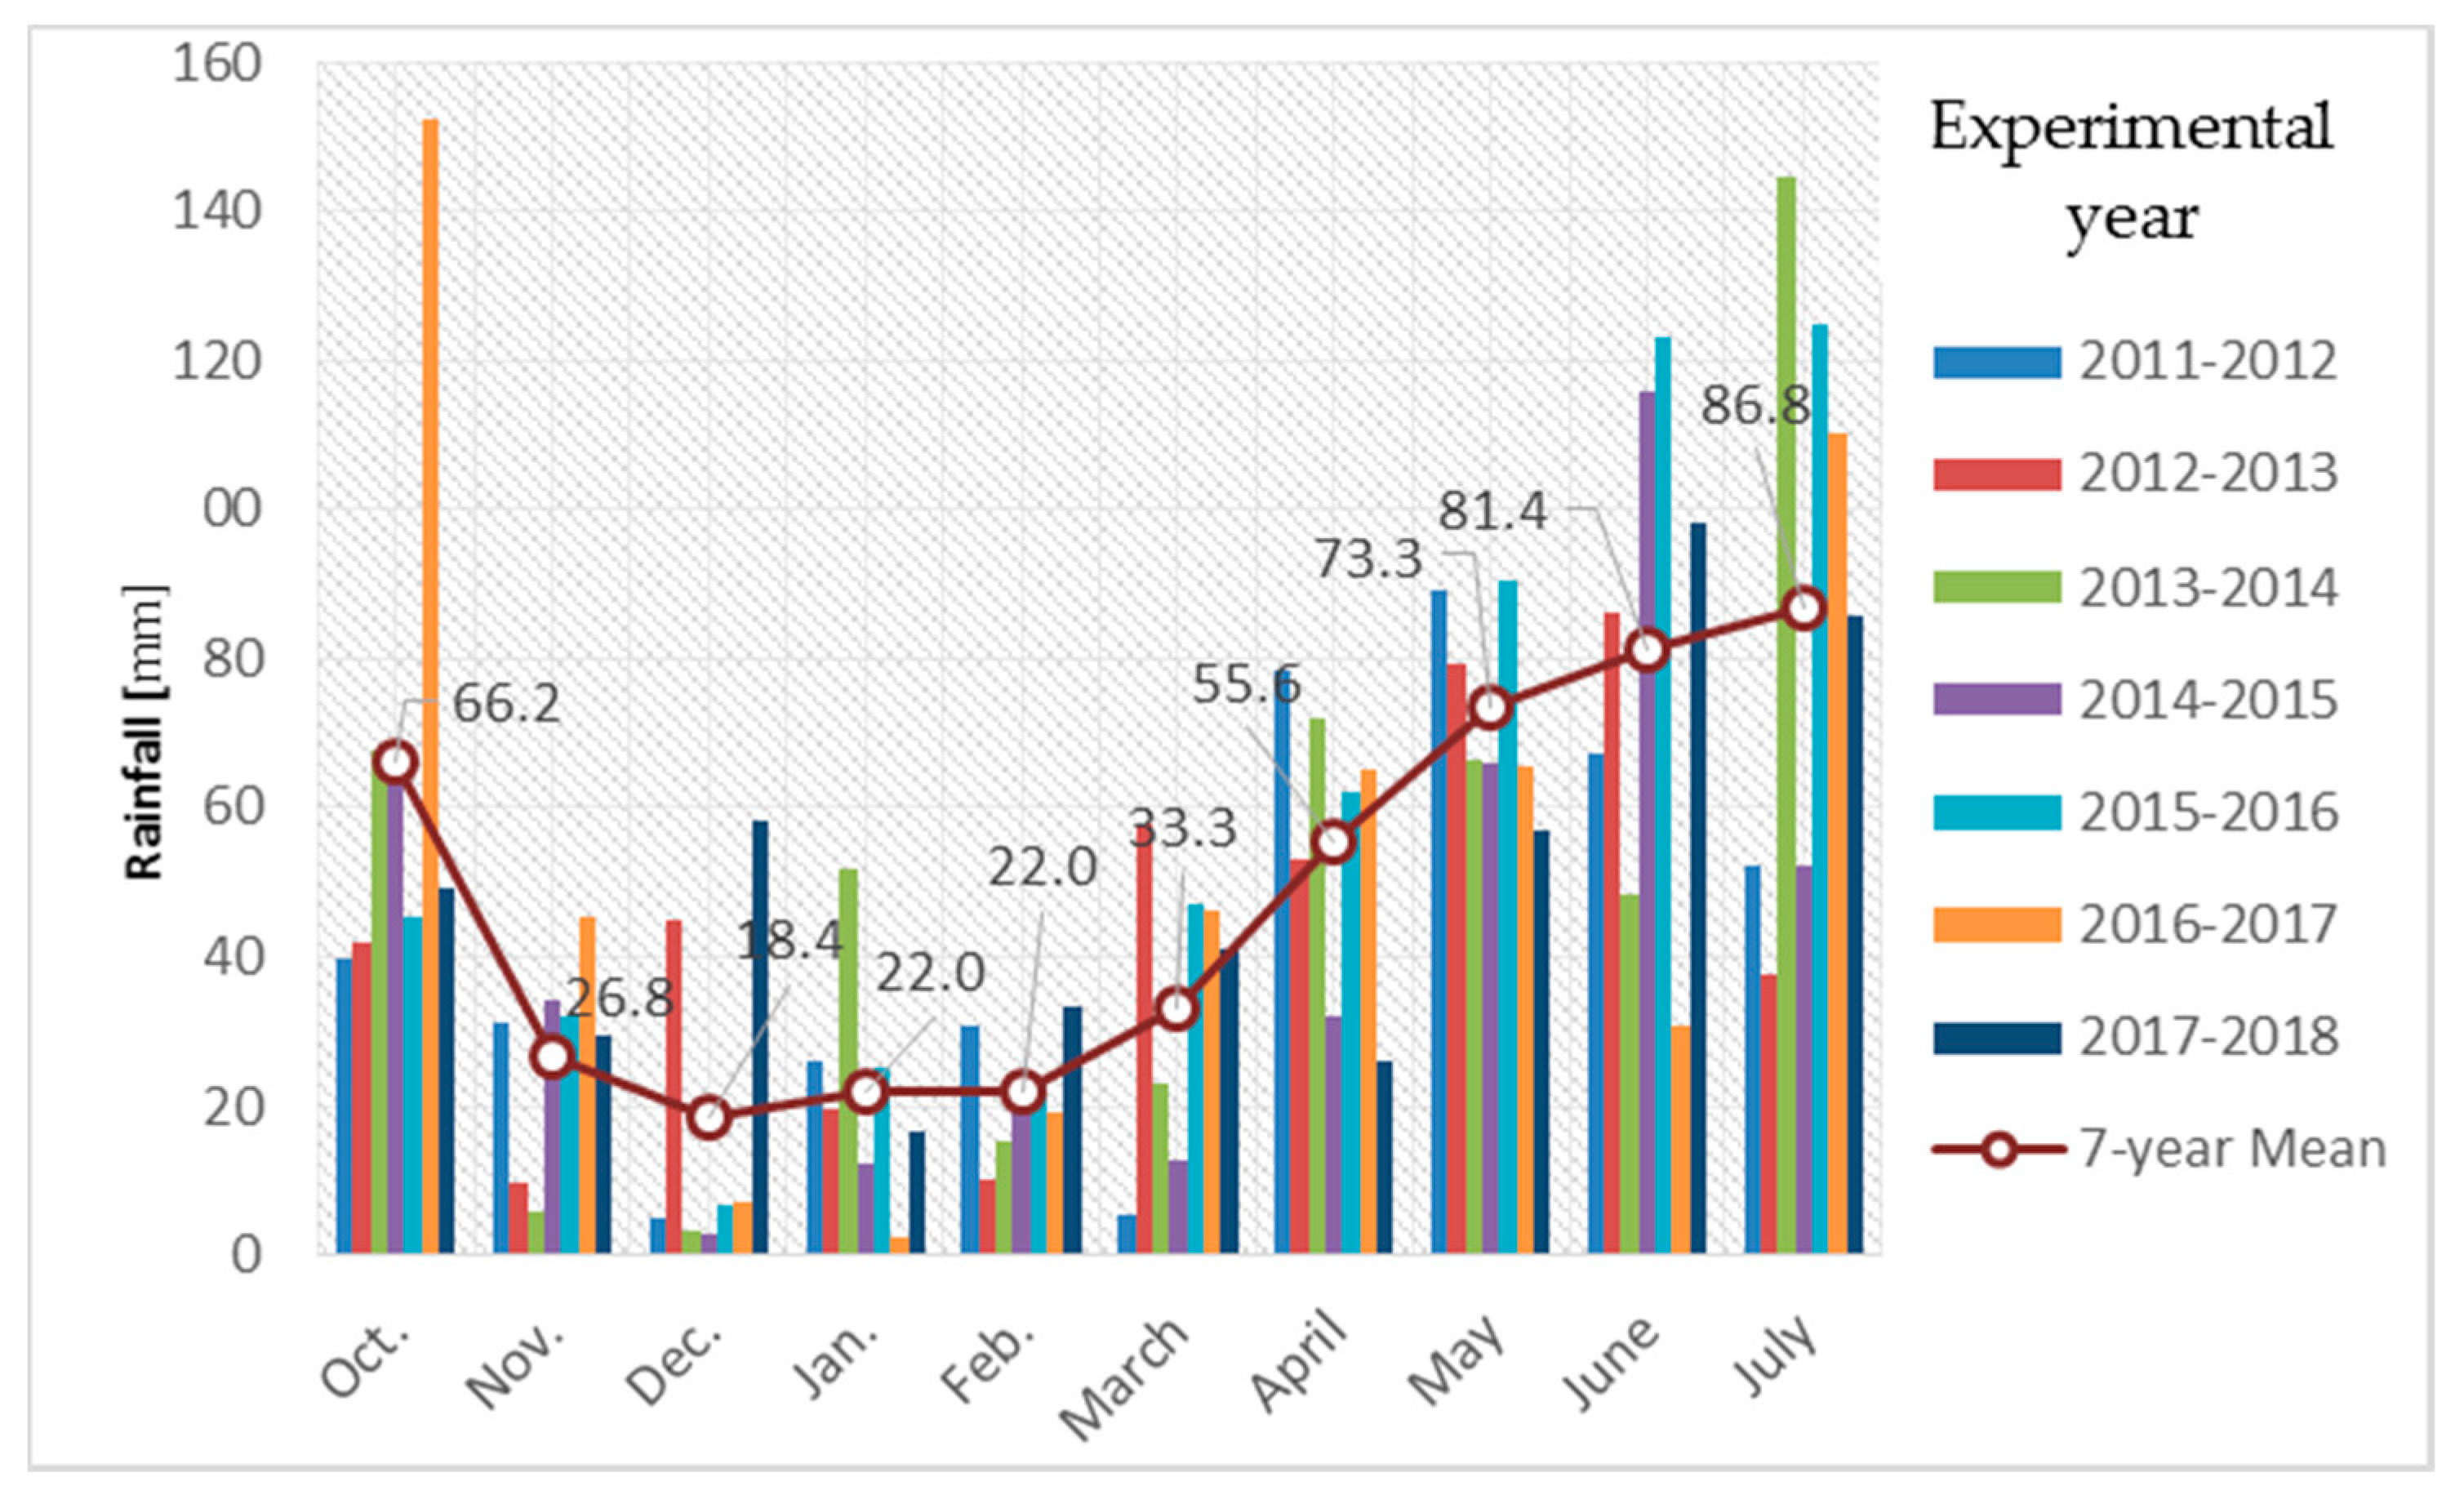
The field research was carried out during seven vegetation seasons (2012–2018) at the ARDS (Agricultural Research Development Station) Turda, located in Cluj County, Nord-Western Romania. The site is characterized by a continental climate with four distinct seasons (after Koppen system). The daily weather data were collected by a fully automated weather station located close to the experimental field. As presented in Figure 1, the vegetation season 2011–2012 recorded the lowest temperatures (7.74 °C) followed by 2016–2017 (7.83 °C). The maximum average temperature recorded during the 7-year experimental trial was reached in the vegetation season 2013–2014 (9.51 °C). The meteorological data highlighted considerable differences in temperature distribution patterns throughout the 7-year experimental trial. The lowest temperatures during the winter period were recorded in the vegetation season 2011–2012. In contrast, the same vegetation season recorded the highest temperatures during the grain filling stage. Significant differences were also observed in the rainfall distribution patterns during the 7-year experimental trial. The wettest highest sum of rainfalls was recorded in the vegetation season 2015–2016 (580.8 mm) followed by 2016–2017 (544.4 mm). The lowest sum of rainfall was reached in the vegetation season 2014–2015 (416.6 mm). In the vegetation season 2014–2015, the highest amount of rainfalls was recorded during the winter period, while, in the vegetation season 2015–2016, rainfall peaked in high proportion during intensive heading–flowering and grain filling stages. The available soil water in the study site during the experimental years ranged between 420 and 550 m3 ha−1 (acquired at soil depths of 0–20 cm). The field capacity for water is 590.6 m3 ha−1.
The dominating soil type was deep alluvial—clay in texture with neutral reaction and a medium humus supply (0–20 cm depth; Table 1). The soil characteristics presented in Table 1 are average from years of research. The pH changed during the experimental years turning into acid (up to 6). In the vegetation season 2015–2016 we adjusted the pH to near neutrality by treatment with CaCO3.

2.2. Experimental Set Up

The experimental field was laid out as a randomized complete block design, with 6 replications. Research covered two planting patterns: wheat after maize (WM) and wheat after soybean (WS) and five levels of nitrogen fertilization (N0—control, N30—fertilized with 30 kg N ha−1 y−1, N60—fertilized with 60 kg N ha−1 y−1, N90—fertilized with 90 kg N ha−1 y−1, N120—fertilized with 120 kg N ha−1 y−1). The plant material consisted of a wheat variety developed by the researchers from ARDS Turda (Andrada), one variety of maize (Turda 332) and one variety of soybean (Felix). This experimental field is in a five-year full rotation: soybeans–wheat–potatoes–corn–wheat. Wheat crops were sown in October–November each year (depending on the meteorological conditions) and fertilized gradually in October and April. The harvest was performed in July from a surface of 16.80 m2. At each harvest, the following parameters were assessed: grain yield (GY; kg ha−1), crude protein (CP;%), nitrogen use efficiency (NUE;%), N uptake (kg N ha−1 yr−1) and partial factor productivity (PFP; kg grain kg N−1).

2.3. Grain Yield and Crude Protein Content

Grain yield (GY, kg ha−1) was harvested at the ripening stage and expressed at 14% moisture. The protein content of wheat grains was assessed through the Kjeldahl method [24].

2.4. Plant N Uptake, Nitrogen Use Efficiency and Partial Factor Productivity

Nitrogen use efficiency was calculated according to the following formula [25]:
NUE (%) = (Nf − Nc)/N supply
where:
Nf—total nitrogen of fertilized crop;
Nc—total nitrogen of control variant (unfertilized);
Nsupply—rate of N fertilizer applied.
N uptake was assessed after [12].
Plant N uptake (kg N ha−1 y−1) = Ntotal (kg N kg−1) × GY (kg ha−1 y−1)/100
where:
GY (kg ha−1 y−1)—wheat grain yield.
Partial factor productivity is a long-term indicator of trends aiming to show how much nutrient is being taken out of the system in relation to how much nutrient is applied. In this research, we applied the formula proposed by Dobermann [26]:
PFP (kg grain kg N−1) = GY/N supply
where:
GY (kg ha−1 y−1)—grain yield;
N supply—rate of N fertilizer applied.

2.5. Statistical Analyses

The impact of treatments on grain yield, protein content, plant N uptake, NUE and PFP were performed with the Statistica vs. 10 (developed by StatSoft in the year 2010), descriptive statistics, t/F-test for single means and Partial Correlations. Effects were accepted as statistically significant if p ≤ 0.05.

3. Results

3.1. Grain Yield and Crude Protein Content

The results indicated that grain yield was greater in WS (5391 kg ha−1 y−1) than WM (4867 kg ha−1 y−1) (p < 0.001; Table 2). Grain yield recorded significant increases as influenced by the five N application rates, the highest productivity being recorded in the experimental plot fertilized with 120 kg ha−1 y−1. Variations in grain yields were recorded among the seven vegetation seasons, with the maximum productivity in the year 2016 (5746 kg ha−1 y−1). Significant interactions were observed between WM/WS X N fertilization (p < 0.01).
Table 2. Grain yield, as affected by planting pattern, nitrogen fertilization and the experimental year. Statistical differences among grain yields within planting pattern, N-fertilization doses and experimental year.
FactorFactor LevelGY (kg ha1 y1)
Planting patternWM4867 a
WS5391 b
N fertilization03565 a
304682 b
6053656 c
905987 c
1206080 c
Experimental year20124465 a
20134657 b
20145667 a
201555307 a
20165746 b
20174899 a
201848419 b
Interaction WM × N fertilization **
Interaction WS × N fertilization **
Note: Effects were accepted as statistically significant if p ≤ 0.05, as follows: **—p < 0.01—significant from statistical point of view (S, confidence 99%). Means followed by different letters indicate differences at p < 0.05. Crude protein (CP) ranged from 11.11% in wheat after maize to 11.24% in wheat after soybean (Table 3). The highest CP was recorded in experimental plots fertilized with 120 kg N−1 y−1. Results show that CP was influenced by planting pattern and N fertilization rates (p < 0.001).
Table 3. Crude protein as affected by planting pattern, nitrogen fertilization and the experimental year. Statistical differences among crude protein within Planting pattern, N-fertilization doses and experimental year.
FactorFactor LevelCP (%)
Planting patternWM11.11 a
WS11.24 b
N fertilization09.31 a
3010.10 b
6011.25 c
9012.22 d
12012.97 e
Experimental year201211.16 a
201311.80 a
201410.65 b
201510.45 b
201612.04 b
201710.92 b
201811.22 b
Note: Effects were accepted as statistically significant if p ≤ 0.05, as follows: Means followed by different letters indicate differences at p < 0.05.

3.2. Plant N Uptake, Nitrogen Use Efficiency (NUE) and Partial Factor Productivity (PFP)

As shown in Table 4, N uptake was highly influenced by the experimental factors. Considering planting pattern, N uptake recorded the highest values in WS (105.66 kg N ha−1 y−1) compared to WM (95.68 kg N ha−1 y−1).
Plant N uptake ranged from 51.93 kg N ha−1 y−1 to 137.57 kg N ha−1 y−1 under the influence of different fertilization rates (Table 4). In N-fertilized plots, plant N uptake increased linearly with the increase in the N rate. The highest increase in N uptake was reached on plots fertilized with 120 kg N ha−1 y−1 (increased with 85.64 kg N ha−1 y−1 compared to control plot, unfertilized). High variations in N uptake were recorded among the seven vegetative seasons analyzed. The highest N uptake was reached in the year 2016 (123.53 kg N ha−1 y−1), while the lowest value was recorded in the year 2012 (87.56 kg N ha−1 y−1).
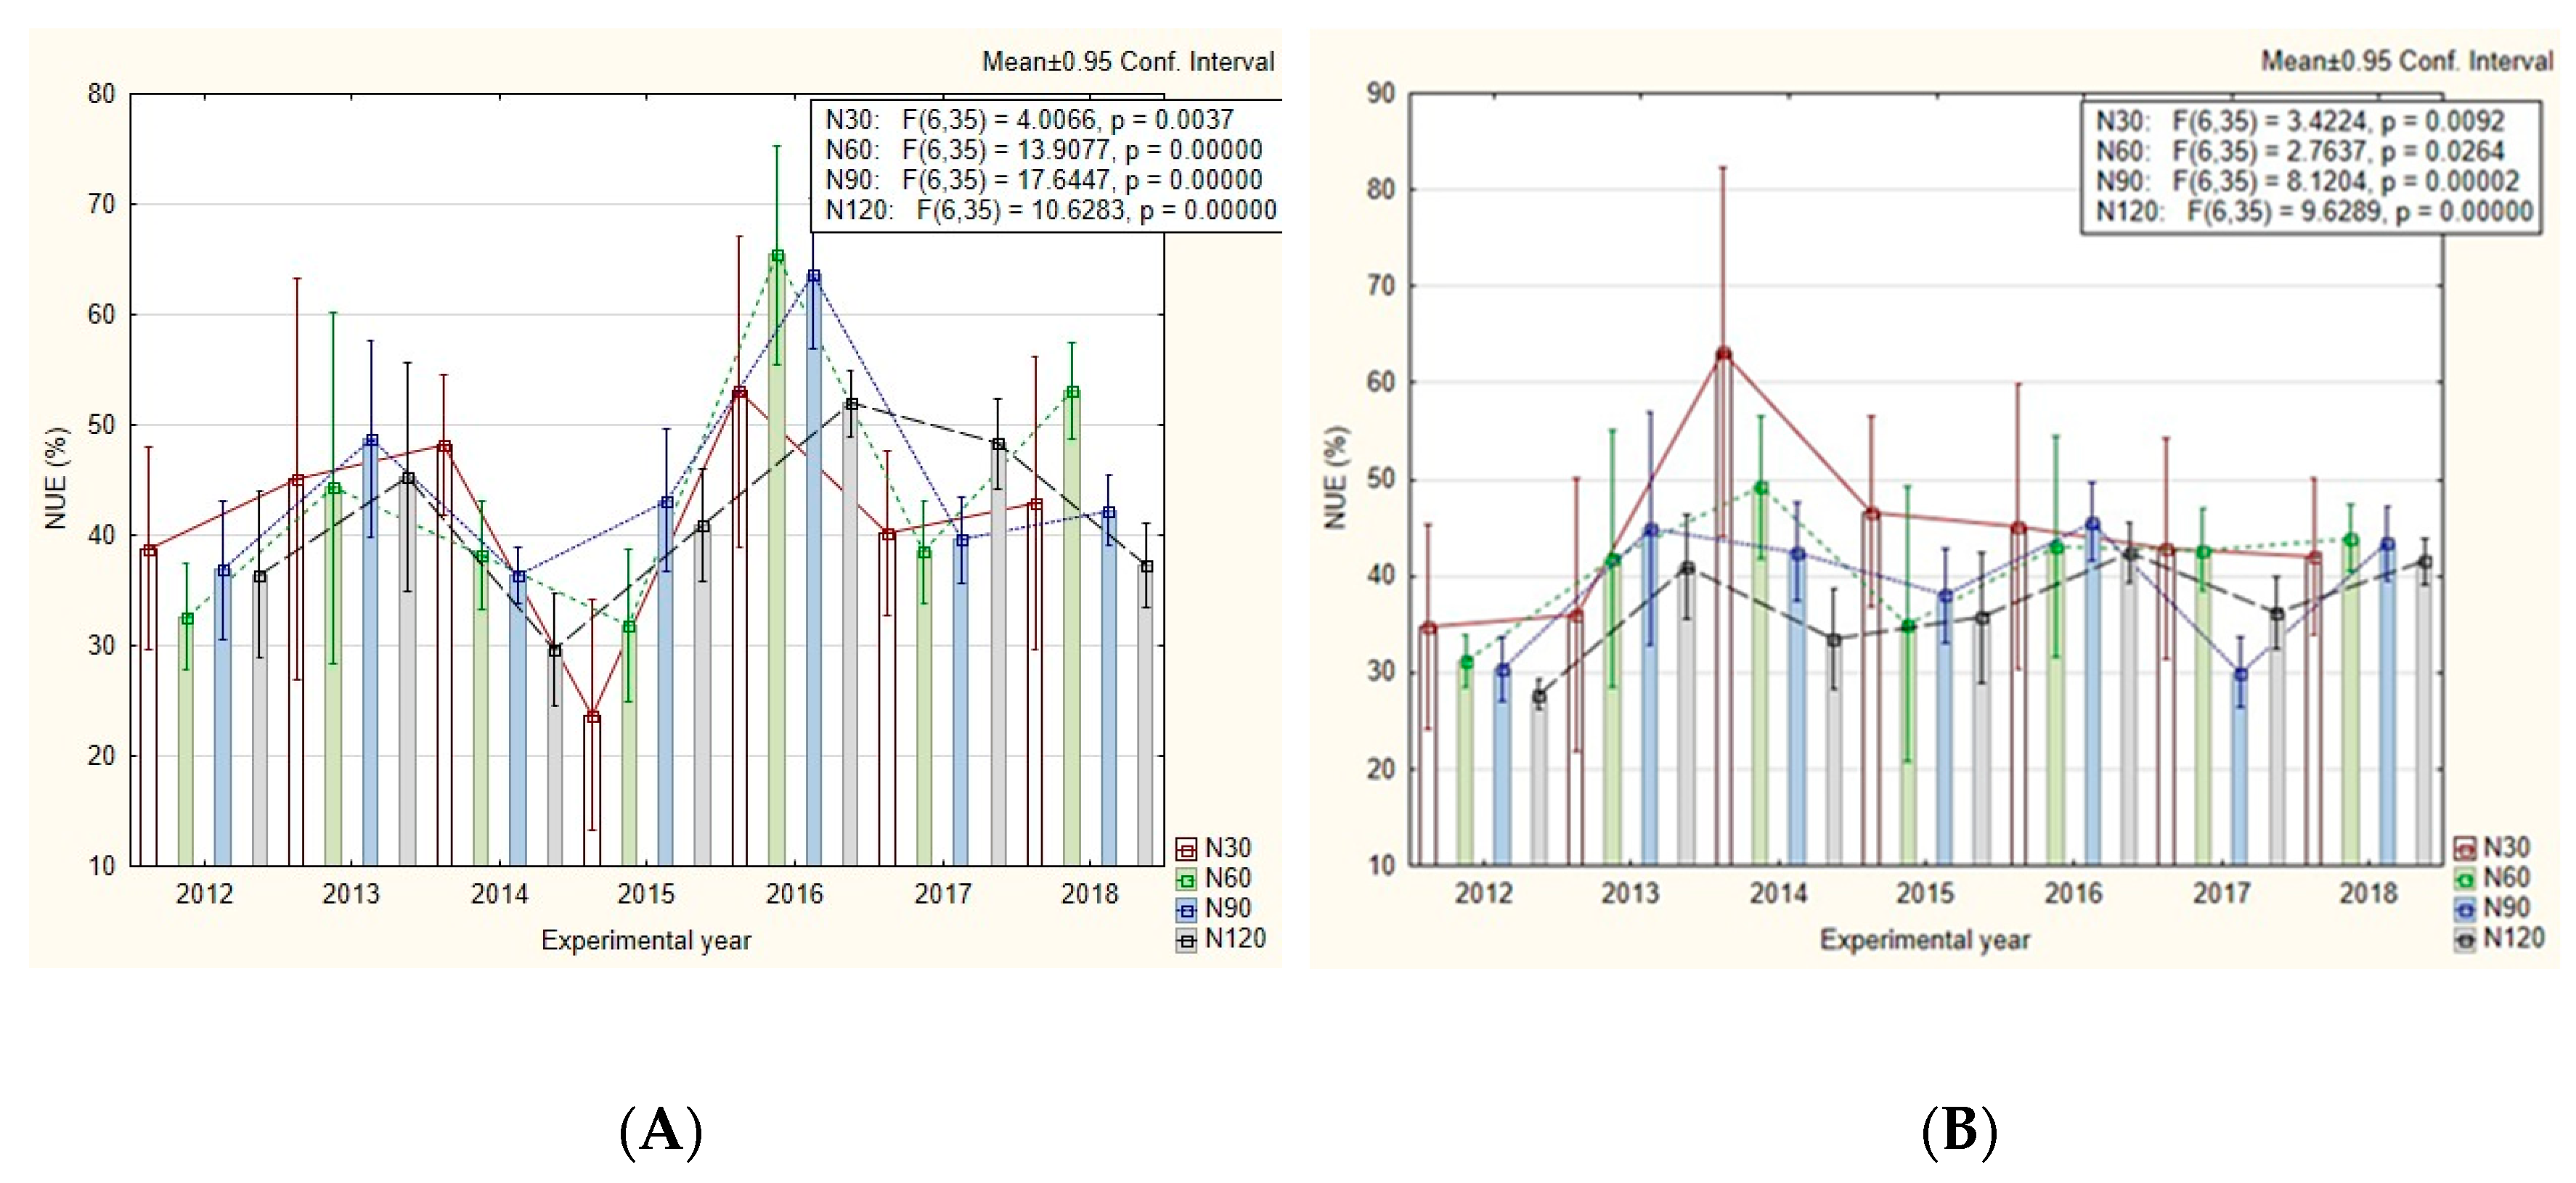
The results show that all NUE indicators recorded significant values as influenced by the experimental factors (Table 4). NUE ranged from 40.38% in WS to 42.72% in WM. In N-fertilized plots, NUE decreased linearly with the increase in the N rate from 43.04% in plots fertilized with 30 kg N ha−1 y−1 up to 39.15% in the plots fertilized with 120 kg N ha−1 y−1. The seven experimental years considered in this study showed a very significant influence on NUE. The highest NUE was reached in the year 2016 (51.30%).
PFP was highly influenced by the experimental factors (Table 4). Considering planting pattern, PFP recorded the highest values in WS (94.24 kg grain kg nutrient−1) compared to WM (85.65 kg grain kg N−1). PFP ranged from 50.40 kg grain kg N−1 to 155.25 kg grain kg N−1 as a result of different N inputs (Table 4). In N-fertilized plots, PFP decreased linearly with increasing N inputs. Thus, the highest increase in PFP was reached on plots fertilized with 30 kg N ha−1 y−1 (increased with 104.85 kg grain kg N−1 compared to plots fertilized with 120 kg N ha−1 y−1). High variations in PFP were recorded among the seven experimental years analyzed. The highest PFP was reached in the year 2014 (102.64 kg grain kg N−1), while the lowest value was recorded in the year 2012 (80.30 kg grain kg N−1).

4. Discussion

Wheat (Triticum aestivum L.) is one of the most important cereal crops in Romania, summing an average harvested area of 2109 ha, which delivered a grain yield of 10,130 tons in the year 2018 [23]. Since wheat cultivation in Romania is predominantly rainfed, rainfalls and air temperatures have a great influence on wheat’s productivity. Our results highlighted significant differences in grain yield among the seven experimental years. The best results were achieved in the year 2016 with an average grain yield of 57,456 kg grain ha−1 y−1 (Table 2). In contrast, the lowest production was recorded in the year 2012 when the mean grain yield was 4465 kg grain ha−1 y−1. These significant differences in grain yield could be explain by the more favorable rainfall and temperatures distribution pattern recorded in the year 2016 during the vegetation season (Figure 1 and Figure 2). Analyzing the climatic factors (temperatures and rainfalls) received during the seven vegetative seasons, we observed that the highest temperatures were recorded in the year 2012, during the grain filling stage (Figure 1), which could impact grain yield. In fact, the year 2012 was the driest year off all the 7 experimental years considered in this study. The lack of rainfall from the end of the year 2011 combined with the lack of water from soil led to a delay in the wheat sprouting stage [27]. Other researchers also pointed out that wheat is mainly sensitive to heat stress during the grain filling stage [28]. Moreover, [29,30], concluded that higher mean and/or extreme temperatures during wheat’s vegetative season not only reduce photosynthesis rate, grain number and weight but also accelerate crop development and leaf senescence rate. Significant differences were recorded also concerning rainfalls’ distribution pattern. In the year 2012, high amounts of rainfalls were recorded during the intensive growing–flowering stage (higher values compared to the other six experimental years and the 7-year mean), which could lead to yield losses. Curtis [31] also pointed out that higher amounts of rainfalls can lead to yield losses through favoring the appearance of diseases and root problems.
Very significant variations in grain protein content were recorded in relation to the planting pattern and N-fertilization doses (Table 3). The highest crude protein content was recorded in the year 2016 (12.04%). As expected, the grain crude protein content increased linearly with increasing N-fertilization doses from 9.31% in control plot—unfertilized up to 12.97% in the plot fertilized with the maximum amount of N (120 kg N ha−1 y−1). Our results are within the range reported in previous studies [27,32,33]. Apart from N rate, timing of N application also impacts protein concentration in wheat grain. The experimental plots from our trial were fertilized gradually in October and April each vegetative season and thus N was available to plants early in the growing season. Wang et al. [34] also pointed out that the availability of N to plants early in the vegetative season stimulates vegetative growth and increases crop yield and protein concentration.
Wheat crop yield is highly influenced by the availability of N, which is frequently regarded as the most important mineral nutrient limiting crop production in many agricultural crops worldwide. Therefore, producers around the world have applied N in excess, thus leading to low nitrogen use efficiency (NUE). Improving NUE has been listed among today’s most critical and daunting research issues [35]. For evaluating the response to N fertilization in a long-term wheat–maize–soybean rotation, we followed the evolution pattern of three agronomic indices commonly used for describing NUE: N uptake, NUE and PFP. Our results show an increase with 9.44% in N uptake in WS compared to WM (Table 4). This may be partially explained by the ability of soybean to provide a higher plant available soil N through symbiotic fixation which could increase the efficiency of N fertilizer. Gaudin et al. [17] also concluded that the inclusion of wheat in WS or WM rotations significantly increased grain yields. As a result of N fertilization, plant N uptake recorded an increase with 62.23% in plots fertilized with 120 kg N ha−1 y−1 compared to the control plot—unfertilized (Table 4). Significant variations in NUE were recorded in relation to the planting pattern, N-fertilization doses and the vegetative season/experimental year (Table 4; Figure 3). NUE decreased linearly with increasing N-fertilization doses. Noureldin et al. [36] reported in a previous study that increased N level reduced NUE.
In our experimental trial, NUE ranged from 39.15% in plots fertilized with 120 kg N ha−1 y−1 to 43.04% in plots fertilized with 30 kg N ha−1 y−1. Our findings are in accordance to those presented by other researchers. Omara et al. [37] reported NUE values for wheat between 33.8% and 36.1%. Raun and Johnson [38] estimated and reported a cereal world NUE of 33%. Compared to our results we can conclude that the efficiency of N-use in our experimental trial is above the world NUE average calculated for wheat. Evans et al. [39] pointed out that if the NUE of a rotation or farming system is >100% there is a risk of mining soil N and reducing the soil N status while if the NUE is low, this indicates that N is not being used by the crop and likely to be lost to the environment, especially if the soil is kept fallow for some time after harvest.
PFP for N is an NUE measurement that includes contributions to crop yield derived from uptake of indigenous soil N, N fertilizer uptake efficiency, and the efficiency with which N acquired by the plant is converted to grain yield [17]. At the global level, PFP for N in cereal production has decreased from of 245 kg grain kg N−1 in 1961/65, to 52 kg kg−1 in 1981/85, and is currently about 44 kg kg−1 [17]. Most frequently, PFP decreases linearly with increasing N-fertilization doses, which is also highlighted through our studies. In our research, PFP ranged from 50.40 kg grain kg nutrient−1 to 155.25 kg grain kg nutrient−1 as a result of different N inputs (Table 4). Very significant variations (p < 0.001) in PFP were recorded in relation to the planting pattern, N-fertilization doses and experimental year (Table 4; Figure 4). The lowest PFP values were recorded in the plots fertilized with the maximum amount of N (120 kg N ha−1 y−1), while the highest PFP values were recorded in the plots fertilized with 30 kg N ha−1 y−1. Our results show that the most productive cropping system (in comparison to its nitrogen application) considering planting pattern is WS.

5. Conclusions

Our findings show that the climatic conditions (temperatures and rainfalls) during the vegetative season seems to play a key role on grain production. A negative correlation was observed between crop yield and temperature during the different growth stages, especially during intensive flowering and grain filling.
Considering the worldwide concerns related to the excess of N fertilization in agricultural crops, the aim of our study was to evaluate the answer of a wheat–maize–soybean rotation crop to different doses of N fertilizer. In order to achieve this, we followed the evolution of different expressions/indices meant to assess the nitrogen use efficiency during seven wheat vegetation seasons. Our findings show that all of the three NUE agronomic indices expressed variations under the influence of planting pattern, N doses and experimental year. Our results are in accordance with previous studies and point out that nitrogen use efficiency indices are negative correlated with the increase in N doses. The PFP results highlight that the most productive cropping system (in comparison to its nitrogen application), considering planting pattern, is WS. The seven experimental years considered in this study showed a very significant influence on NUE. The highest NUE was reached in the year 2016 (51.30%). Following the response of wheat to N fertilization rates, we achieved valuable information regarding the use efficiency of N from mineral fertilizers. These results can be used to optimize nitrogen fertilization in wheat crop and thus ensure a transition to more sustainable wheat cropping systems in N-W Romania.

Author Contributions

Conceptualization, A.M., R.K. and V.D.; methodology, A.M.; software, C.M.; validation, R.V., I.R. and V.D.; formal analysis, C.M.; investigation, R.K. and V.D.; resources, R.K. and V.D.; data curation, C.M.; writing—original draft preparation, A.M.; writing—review and editing, C.M.; visualization, C.M.; supervision, R.K. and R.V. All authors have read and agreed to the published version of the manuscript.

Funding

This research received no external funding.

Acknowledgments

The publication was supported by funds from the National Research Development Projects to finance excellence (PFE)-37/2018–2020 granted by the Romanian Ministry of Research and Innovation.

Conflicts of Interest

The authors declare no conflict of interest.

References

  1. Mălinaș, A.; Rotar, I.; Vidican, R.; Păcurar, F.; Iuga, V.; Mălinaș, C.; Moldovan, C.M. Designing a sustainable temporary grassland system by monitoring the Nitrogen Use Efficiency. Agronomy 2020, 10, 644. [Google Scholar] [CrossRef] [Green Version]
  2. European Commission (E.C.). European Green Deal. Available online: https://ec.europa.eu/info/sites/info/files/european-green-deal-communication_en.pdf (accessed on 26 March 2020).
  3. Ingram, J. Perspective: Look beyond production. Nature 2017, 544, 5–17. [Google Scholar] [CrossRef] [PubMed]
  4. Lestingi, A.; Ventrella, D.; Bovera, F.; De Giorgio, D.; Tateo, A. Effects of tillage and nitrogen fertilization on triticale grain yield, chemical composition and nutritive value. J. Sci. Food Agric. 2010, 90, 2440–2446. [Google Scholar] [CrossRef]
  5. Averbeke, W.V.; Denison, J.; Mnkeni, P.N.S. Smallholder irrigation schemes in South Africa: A review of knowledge generated by the Water Research Commission. Water SA 2011, 37, 797. [Google Scholar] [CrossRef] [Green Version]
  6. Delogu, G.; Cattivelli, L.; Pecchioni, N.; De Falcis, D.; Maggiore, T.; Stanca, A.M. Uptake and agronomic efficiency of nitrogen in winter barley and winter wheat. Eur. J. Agron. 1998, 9, 11–20. [Google Scholar] [CrossRef]
  7. Novoa, R.; Loomis, R.S. Nitrogen and plant production. Plant. Soil. 1981, 58, 177–204. [Google Scholar] [CrossRef]
  8. Cassman, K.G.; Dobermann, A.; Walters, D.T. Agroecosystems, nitrogen-use efficiency, and nitrogen management. Ambio 2002, 31, 132–140. [Google Scholar] [CrossRef]
  9. Dobermann, A. Nitrogen Use Efficiency—State of the Art. Agron. Horti—Faculty Publications. Available online: https://digitalcommons.unl.edu/cgi/viewcontent.cgi?referer=&httpsredir=1&article=1319&context=agronomyfacpub (accessed on 20 March 2020).
  10. Fixen, P.; Brentrup, F.; Bruulsema, T.; Garcia, F.; Norton, R.; Zingore, S. Nutrient/fertilizer use efficiency: Measurement, current situation and trends. In Managing Water and Fertilizer for Sustainable Agricultural Intensification, 1st ed.; Drechsel, P., Heffer, P., Magen, H., Mikkelsen, R., Wichelns, D., Eds.; International Fertilizer Industry Association (IFA); International Water Management Institute (IWMI); International Plant Nutrition Institute (IPNI); International Potash Institute (IPI): Paris, France, 2015. [Google Scholar]
  11. Zhao, R.-F.; Chen, X.-P.; Zhang, F.-S.; Zhang, H.; Schroder, J.; Volker, R. Fertilization and Nitrogen Balance in a Wheat–Maize Rotation System in North China. Agron. J. 2006, 98, 938–945. [Google Scholar] [CrossRef]
  12. Hiremath, A.J.; Ewel, J.J. Ecosystem nutrient use efficiency, productivity, and nutrient accrual in model tropical communities. Ecosystems 2001, 4, 669–682. [Google Scholar] [CrossRef]
  13. Dobermann, A.; Cassman, K.G.; Waters, D.T.; Witt, C. Balancing short- and long-term goals in nutrient management. In Proceedings of the XV International Plant Nutrient Colloquium, Beijing, China, 14–16 September 2005. [Google Scholar]
  14. Peoples, M.B.; Brockwell, J.; Herridge, D.F.; Rochester, I.J.; Alves, B.J.R.; Urquiaga, S.; Boddey, R.M.; Dakora, F.D.; Bhattarai, S.; Maskey, S.L.; et al. The contributions of N-fixing crop legumes to the productivity of agricultural systems. Symbiosis 2009, 48, 1–17. [Google Scholar] [CrossRef]
  15. Alhajj, S.; Luigi Tedone, A.; Verdini, L.; Cazzato, E.; De Mastro, G. Wheat Response to No-Tillage and Nitrogen Fertilization in a Long-Term Faba Bean-Based Rotation. Agron. J. 2019, 9, 50. [Google Scholar]
  16. Bedoussac, L.; Justes, E. The efficiency of a durum wheat-winter pea intercrop to improve yield and wheat grain protein concentration depends on N availability during early growth. Plant. Soil. 2010, 330, 19–35. [Google Scholar] [CrossRef]
  17. Gaudin, A.C.M.; Janovicek, K.; Deen, B.; Hooker, D.C. Wheat improves nitrogen use efficiency of maize and soybean-based cropping systems. Agric. Ecosyst. Environ. 2015, 210, 1–10. [Google Scholar] [CrossRef]
  18. Lebender, U.; Senbayram, M.; Lammel, J.; Kuhlmann, H. Effect of mineral nitrogen fertilizer forms on N O emissions from arable soils in winter wheat production. J. Soil. Sci. Plant Nutr. 2014, 177, 722–732. [Google Scholar] [CrossRef]
  19. Peoples, M.B.; Boyer, E.W.; Goulding, K.W.T.; Heffer, P.; Ochwoh, V.A.; Vanlauwe, B.; Wood, S.; Yagi, K.; Van Cleemput, O. Pathways of nitrogen loss and their impact on human health and the environment. In Agriculture and the Nitrogen Cycle: Assessing the Impacts of Fertilizer Use on Food Production and the Environment; Mosier, A.R., Syers, J.K., Freney, J.R., Eds.; Island Press: Washington, DC, USA, 2004; pp. 53–69. [Google Scholar]
  20. Syswerda, S.P.; Basso, B.; Hamilton, S.K.; Tausig, J.B.; Robertson, G.P. Long-term nitrate loss along an agricultural intensity gradient in the Upper Midwest USA. Agric. Ecosyst. Environ. 2012, 149, 10–19. [Google Scholar] [CrossRef] [Green Version]
  21. Goulding, K.; Jarvis, S.; Whitmore, A. Optimizing nutrient management for farm systems. Philos. Trans. R. Soc. Lond. B Biol. Sci. 2008, 363, 667–680. [Google Scholar] [CrossRef] [Green Version]
  22. Faostat. Available online: http://www.fao.org/faostat/en/#data/QC (accessed on 29 March 2020).
  23. Available online: https://www.madr.ro/culturi-de-camp/cereale/grau.html (accessed on 29 March 2020).
  24. Kjeldahl, J. Neue Methods zur Bestimmung des Stickstoffs in Organischen Korpern. Z. Anal. Chem. 1983, 22, 366–382. [Google Scholar] [CrossRef] [Green Version]
  25. Moll, R.H.; Kamprath, E.J.; Jackson, W.A. Analysis and interpretation of factors which contribute to efficiency of nitrogen utilization. Agron. J. 1982, 74, 562–564. [Google Scholar] [CrossRef]
  26. Dobermann, A. Nutrient use efficiency—measurement and management. In Proceedings of the IFA International Workshop on Fertilizer Best Management Practices, Brussels, Belgium, 7–9 March 2007; pp. 1–28. [Google Scholar]
  27. Suciu, A.; Miclea, R.; Sopterean, L.; Kadar, R.; Haş, I.; Puia, C. Comportarea unor soiuride grâu în diferite condiţii de infecţie cu Fusarium spp. I.N.C.D.A. Fundulea 2014, LXXXII, 61-3-68. [Google Scholar]
  28. Luo, Q. Temperature thresholds and crop production: A review. Clim. Chang. 2011, 1095, 83–98. [Google Scholar] [CrossRef]
  29. Tubiello, F.N.; Soussana, J.-F.; Howden, S.M. Crop and pasture response to climate change. Proc. Natl. Acad. Sci. USA 2007, 104, 19686–19690. [Google Scholar] [CrossRef] [PubMed] [Green Version]
  30. Wheeler, T.R.; Craufurd, P.Q.; Ellis, R.H.; Porter, J.R.; Vara Prasad, P. Temperature variability and the yield of annual crops. Agric. Ecosyst. Environ. 2000, 821, 59–67. [Google Scholar] [CrossRef]
  31. Curtis, B.C. Wheat in the world. In Bread Wheat: Improvement and Production; Curtis, B.C., Rajaram, S., Gómez, H., Eds.; Food and Agriculture Organization of the United Nations: Rome, Italy, 2002; pp. 7–10. [Google Scholar]
  32. Anastasi, U.; Corinzia, S.A.; Cosentino, S.L.; Scordia, D. Performances of Durum Wheat Varieties under Conventional and No-Chemical Input Management. Agronomy 2019, 9, 788. [Google Scholar] [CrossRef] [Green Version]
  33. Quaranta, F.; Amoriello, T.; Aureli, G.; Belocchi, A.; D’Egidio, M.G.; Fornara, M.; Melloni, S.; Desidrio, E. Grain yield, quality and deoxynivalenol (DON) contamination of durum wheat (Triticum durum Desf.): Results of national networks in organic and conventional cropping systems. Ital. J. Agron. 2010, 4, 353–366. [Google Scholar]
  34. Wang, Z.-H.; Xiu, S.L.; Malhi, S. Effects of fertilization and other agronomic measures on nutritional quality of crops. J. Sci. Food Agric. 2008, 88, 7–23. [Google Scholar] [CrossRef]
  35. Thompson, H. Food science deserves a place at the table—US agricultural research chief aims to raise the profile of farming and nutrition science. Nature 2012. Available online: https://www.nature.com/news/food-science-deserves-a-place-at-the-table-1.10963 (accessed on 25 March 2020).
  36. Noureldin, N.A.; Saudy, H.S.; Ashmawy, F.; Saed, H.M. Grain yield response index of bread wheat cultivars as influenced by nitrogen levels. Ann. Agric. Sci. 2013, 58, 147–152. [Google Scholar] [CrossRef]
  37. Omara, P.; Aula, L.; Oyebiyi, F.; Raun, W.R. World Cereal Nitrogen Use Efficiency Trends: Review and Current Knowledge. Agrosyst. Geosci. Environ. 2019, 2, 1–8. [Google Scholar] [CrossRef]
  38. Raun, W.R.; Johnson, G.V. Improving Nitrogen Use Efficiency for Cereal Production. Agron. J. 1999, 91, 357–363. [Google Scholar] [CrossRef] [Green Version]
  39. Evans, A. Nitrogen use efficiency (NUE) and tools for farmer engagement: A good reason for being imprecise. In Proceedings of the 2016 International Nitrogen Initiative Conference, Solutions to Improve Nitrogen Use Efficiency for the World, Melbourne, Australia, 4–8 December 2016. [Google Scholar]
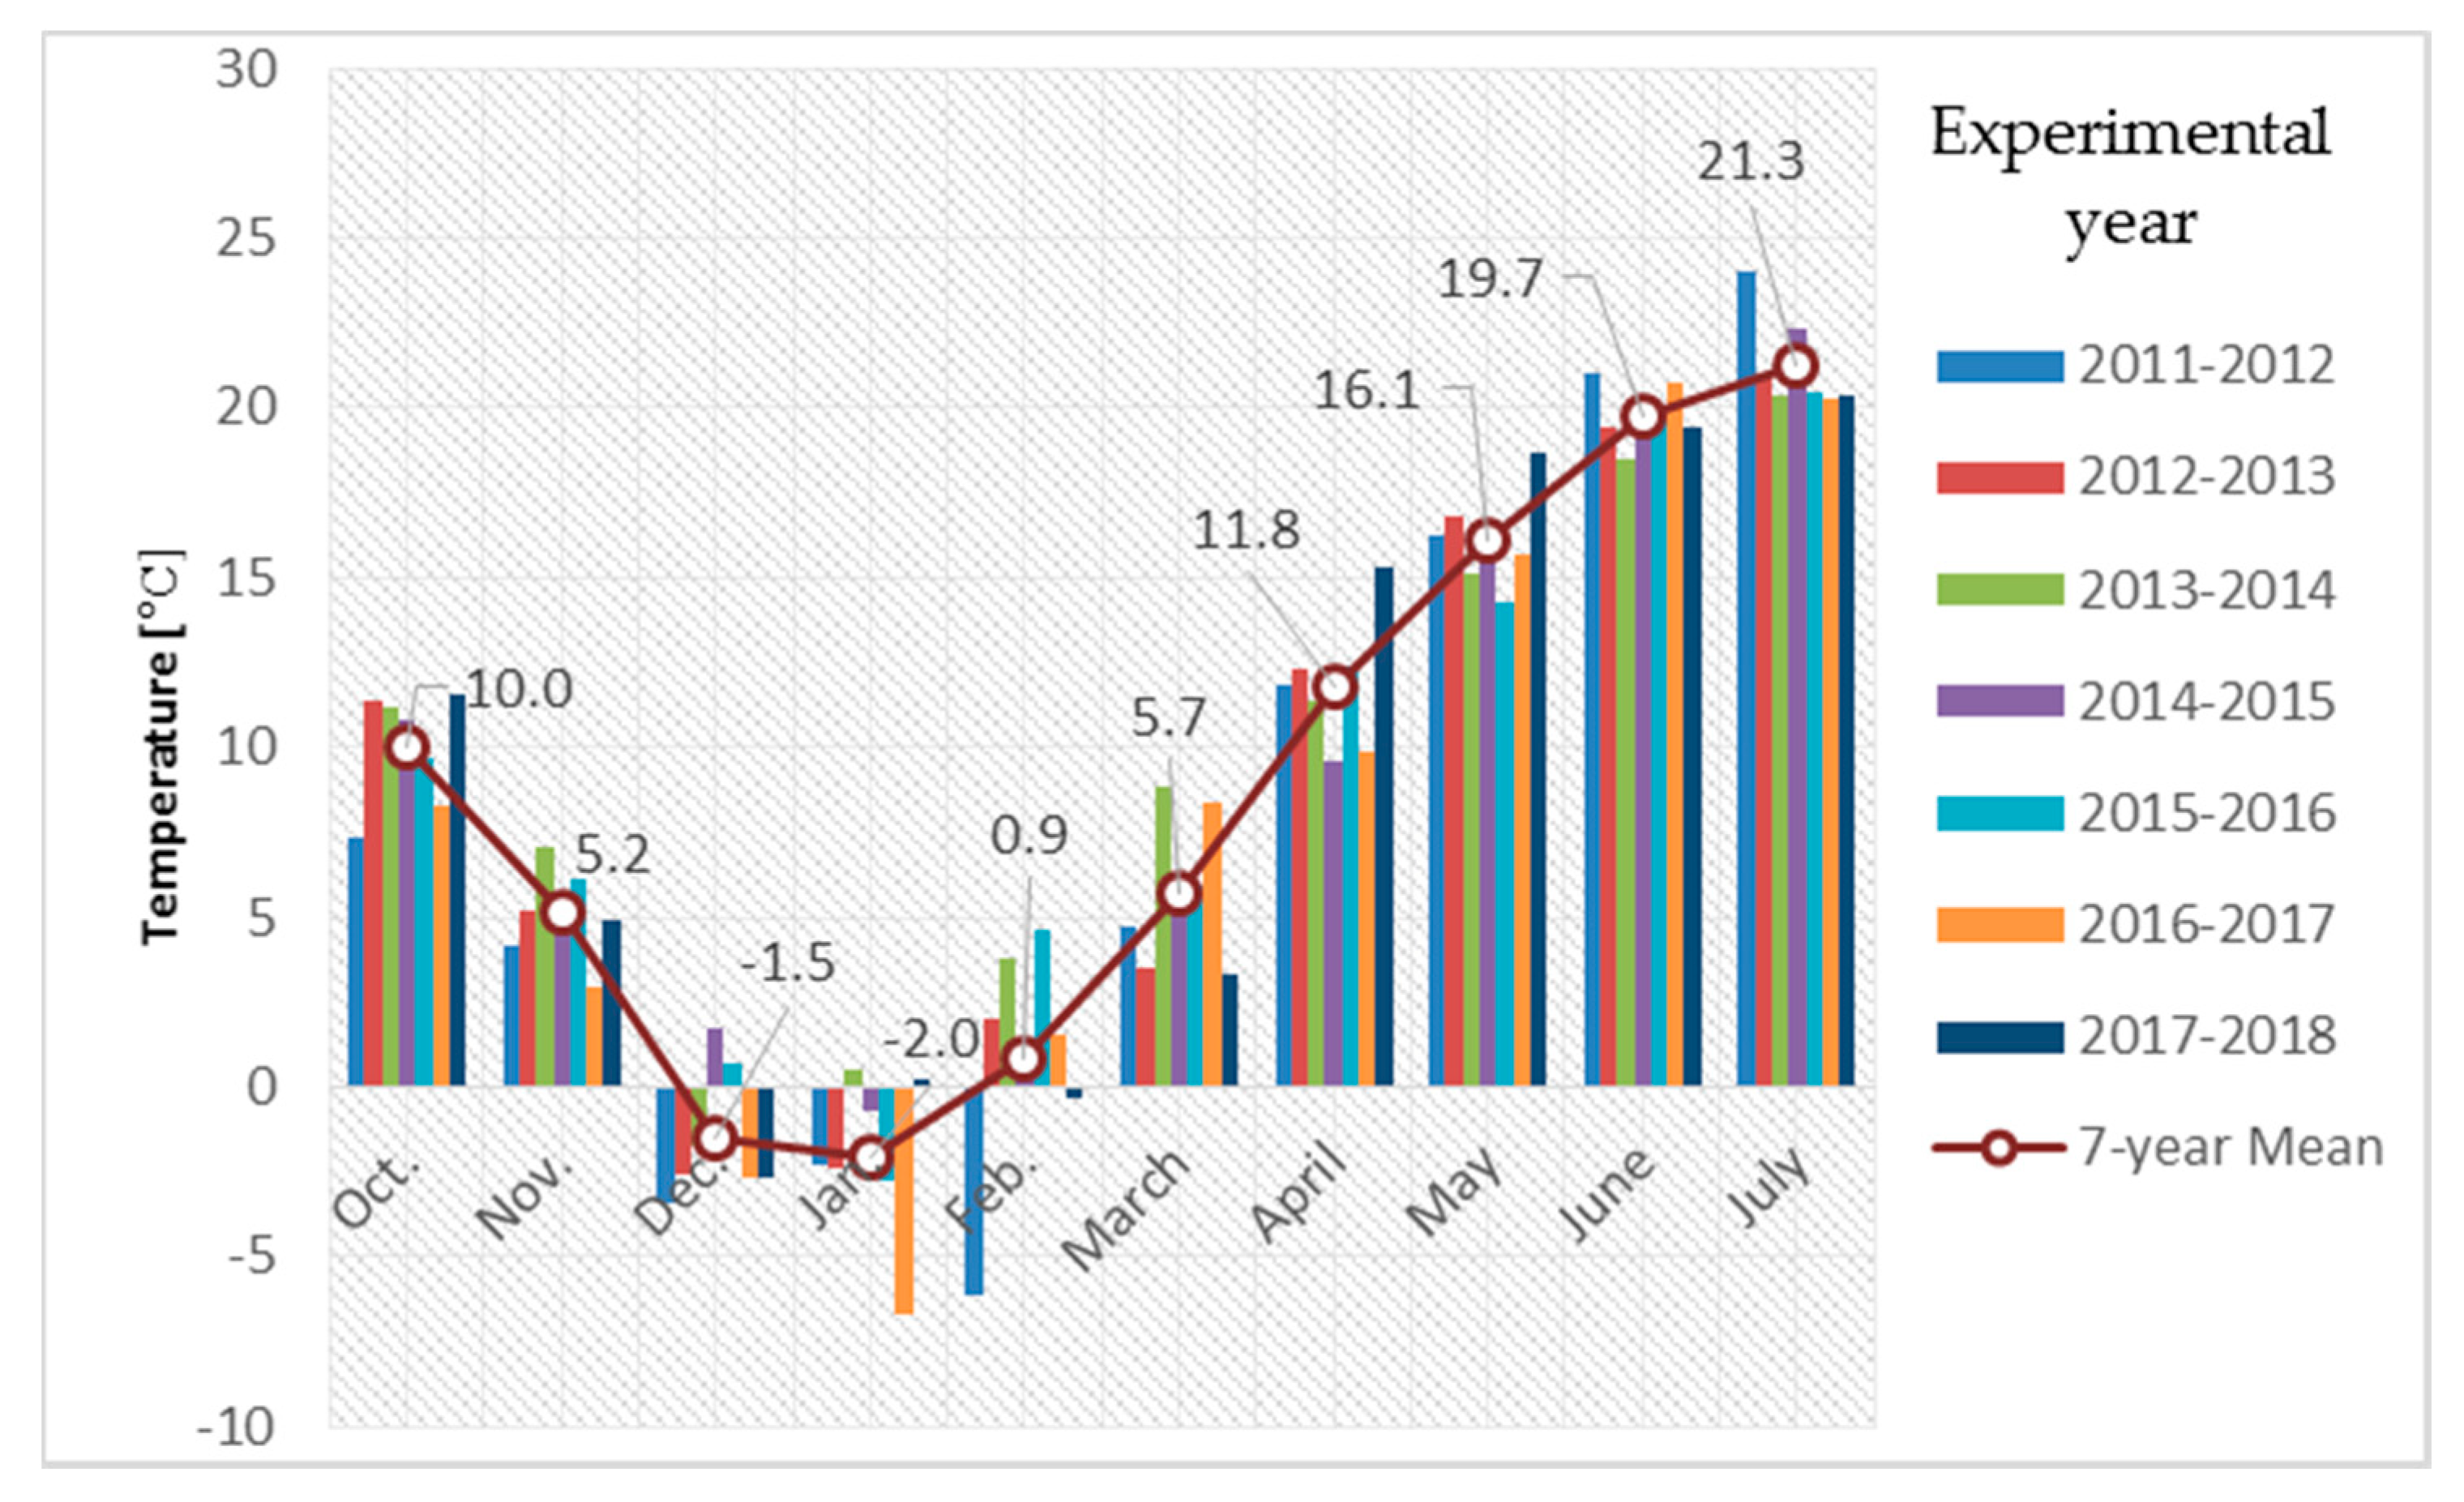
Figure 1. Average monthly air temperatures for the seven vegetation seasons and the 7-year mean.
Agronomy 10 00941 g001
Figure 2. Total monthly rainfall for the seven vegetation seasons and the 7-year mean.
Agronomy 10 00941 g002
Figure 3. NUE as affected by planting pattern (A)—wheat after maize (WM); (B)—wheat after soybean (WS), N fertilization and experimental year.
Agronomy 10 00941 g003
Figure 4. PFP, as affected by planting pattern ((A)—WM; (B)—WS), N fertilization and experimental year.
Agronomy 10 00941 g004
Table 1. Soil characteristics in the experimental site 1.
Agrochemical IndexValue
pH in H2O6.81
Humus (%)3.73
Total nitrogen (Nt; %)0.205
P (ppm)47
K (ppm)320
1 The chemical analysis of the soil were delivered by specialists from the Department of Pedology, University of Agricultural Sciences and Veterinary Medicine from Cluj-Napoca, Romania.
Table 4. Planting pattern, nitrogen fertilization and experimental year influence on N uptake, N use efficiency (NUE) and partial factor productivity (PFP). Statistical differences among N uptake, NUE and PFP within planting pattern, N- fertilization doses and experimental year.
FactorFactor LevelN Uptake (kg N ha1 y1)NUE (%)PFP (kg grain kg N1)
Planting patternWM95.68 a42.73 a85.65 a
WS105.66 b40.38 b94.24 b
N fertilization051.93 a N.F.N.F.
3082.60 b43.04 a155.25 a
60104.90 c42.22 b88.46 b
90126.37 c41.83 c65.69 c
120137.57 c39.15 d50.40 d
Experimental year201287.56 ***33.68 a80.30 a
201399.52 ***43.41 b81.01 b
2014108.34 ***42.61 c102.64 c
2015103.39 ***36.88 d96.83 d
2016123.53 ***51.30 e101.94 e
201787.07 ***39.78 f81.93 f
201895.30 ***43.31 g84.98 g
Note: ***—p < 0.001—highly significant from statistical point of view (HS, confidence 99.9%). N.F.—no fertilization; thus, there were no calculations for these experimental plots. Means followed by different letters indicate differences at p < 0.05.