Article

Genome-Wide Analysis of the Trehalose-6-Phosphate Synthase (TPS) Gene Family and Expression Profiling of ScTPS Genes in Sugarcane

1
Yunnan Key Laboratory of Sugarcane Genetic Improvement, Sugarcane Research Institute, Yunnan Academy of Agricultural Sciences, Kaiyuan 661699, China
2
Sugarcane Research Unit, USDA-ARS, Houma, LA 70360, USA
*
Author to whom correspondence should be addressed.
These authors contributed equally to this work.
Agronomy 2020, 10(7), 969; https://doi.org/10.3390/agronomy10070969
Submission received: 26 May 2020 / Revised: 16 June 2020 / Accepted: 1 July 2020 / Published: 5 July 2020
(This article belongs to the Section Crop Breeding and Genetics)

Abstract

:
The trehalose-6-phosphate synthase (TPS) gene family plays important roles in conferring plant stress resistance, but a comprehensive analysis of the gene family is lacking for sugarcane (Saccharum spp. hybrids). The objective of this study is to document functional classification, evolutionary characterization, and expression profiling of sugarcane TPS gene (ScTPS) family. Nine putative ScTPS genes were identified and assigned to two distinct classes based on gene structure and phylogeny. Phylogenetic analysis showed that 31 TPS genes from Arabidopsis, rice and sugarcane could be divided into five distinct clades, suggesting that there were at least five orthologous groups in monocot and dicot plants. Evolution analysis of TPS genes revealed that TPS family members appeared to have undergone strong negative selection. The strength of the selective pressure differed in most clades, especially Class I TPS genes, experienced significantly stronger negative selection pressure than Class II TPS genes. There were also cis-regulatory elements related to phytohormones and abiotic stresses. Additionally, ScTPS genes were found to exhibit divergent expression in response to simulated drought, salinity, and ABA stresses. Since ScTPS genes function in sugarcane adaptation to environmental stimuli, it might be used as a molecular marker in screening sugarcane germplasm for increased stress resistance.

1. Introduction

Trehalose is a non-reducible disaccharide commonly found in many plant species. It is an energy carrier and an irreplaceable hydrophilic solute that protects cellular proteins and membranes from adverse environmental stresses such as drought, high salinity, and extreme temperatures. A high level of trehalose is thought to help Selaginella lepidophylla (Hook. & Grev.) Spring survive under extreme drought stress [1]. However, in Arabidopsis thaliana (L.) Heynh. and other drought-resistant species, only trace quantities of trehalose are detected despite the presence of numerous gene families that encode enzymes involved in trehalose biosynthesis [2]. Trehalose metabolism is an important target for genetic manipulation to enhance stress tolerance in plants [3].
Trehalose biosynthesis in plants is mainly through the trehalose-6-phosphate synthase (TPS)/trehalose-6-phosphate phosphatase (TPP) pathway, which involves two enzymatic reactions. First, UDP-glucose (UDPG) and glucose 6-phosphate (Glc6P) are catalyzed by TPS to form trehalose-6-phosphate (T6P), and then TPP dephosphorylates T6P to produce trehalose. Trehalose-6-phosphate synthase is the key enzyme for trehalose synthesis as it regulates the levels of T6P, thereby affecting developmental and metabolic processes [4]. The TPS proteins typically have two domains: TPS (Pfam: Glyco-transf-20) and TPP (Pfam: Trehalose-PPase). A plant TPS1 gene was first discovered in A. thaliana [5]. As an increasing number of genomes has been sequenced, more TPS or TPS-like genes have been found in plant species, including Selaginella lepidophylla [6], Nicotiana tabacum L. [7], Oryza sativa L. [8], Glycine max (L.) Merr. [9], Triticum aestivum L. [10], and Solanum tuberosum L. [11]. A study of the TPS gene family in Selaginella lepidophylla demonstrates that SlTPS1 gene is involved in responses to heat and salinity response by enhanced T6P biosynthesis [6]. The overexpression of the AtTPS1 gene is associated with drought tolerance in A. thaliana [12] and overexpression of OsTPS1 significantly increases the tolerance to low temperature, high salinity, and drought in rice [13].
Sugarcane (Saccharum spp. hybrids) is a globally important sugar and energy crop. Relatively high temperature, high humidity, and sufficient light are beneficial to its growth and development. China is the third largest sugar producing country in the world; lately, its sugarcane production area has shifted to more stressful environments in higher altitudes with a lower amount of rainfall and poorer level of soil fertility. This trend also demands a shift in sugarcane breeding emphasis towards stress-resistant varieties [14,15]. Conventional sugarcane breeding program for stress resistant varieties was mainly screening sugarcane materials with great morphological traits, good physiological and biochemical characteristics under stress conditions. For instance, Deren et al. [16] screened for flood-tolerant varieties by a continuous, five-month flood. Hemaprabha et al. [17] assessed the performance of parents for drought resistance under water deficit stress. However, these efforts did not led to commercial successes. One reason is the narrow genetic base and limited resistant gene resources of sugarcane varieties, which are mostly developed by crossing between the noble canes (Saccharum officinarum L.) and the canes of China (S. sinense Roxb.) and India (S. barberi L.). In general, the genes for resistance to environmental stress and disease are mainly derived from wild species of Saccharum, such as S. spontaneum L. and S. robustum Brandes & Jesw. ex Grassl germplasm. The utilization of wild Saccharum species and intergeneric hybridization have been adopted to increase hybrid vigor in sugarcane breeding program. It was reported that Erianthus arundinaceus germplasm was utilized to breed new drought-resistant varieties of sugarcane [18]. However, the traditional selection of resistant varieties is a long-term and risky investment [19]. With the biotechnology development and sugarcane genome sequencing, it is possible to explore more resistance genes or traits to facilitate genetic manipulation via marker-assisted selection [20,21]. Trehalose-6-phosphate (T6P) could act as an signaling molecule in plants regulating plant growth and development [22]. Manipulation of T6P levels by chemical intervention strategy has shown extraordinary effects on crop yield and drought tolerance [23]. Since it has been reported that over-expression of the Grifola frondosa trehalose synthase gene led to high trehalose accumulation and enhanced tolerance to drought [24], a comprehensive analysis is needed for the sugarcane TPS gene (ScTPS) family to enhance yield and stress tolerance in sugarcane.
The objective of this study is to explore functional classification, evolutionary characterization, and expression profiling of the ScTPS family. The study of ScTPS genes may help sugarcane breeders utilize ScTPS marker-assisted selection of stress tolerant sugarcane germplasm and sustain sugarcane production under stressful field conditions.

2. Materials and Methods

2.1. Materials

The study was conducted on a drought tolerant sugarcane genotype YZ05-51 [25]. The genome database of sugarcane cultivar SP80-3280 (txid: 193079) was referred from the National Center for Biotechnology Information (NCBI). The TPS nucleotides and amino acid sequences of Oryza sativa Indica Group (txid: 39946) and Arabidopsis thaliana (L.) Heynh (txid: 3702) were obtained by querying reported TPS gene accession [8,26] from TIGR [27] and the Arabidopsis Information Resource (TAIR), respectively. The accession number of Arabidopsis TPS1-11 mRNA are HM050424–HM050434, and the accession number of rice TPS1-11 mRNA are NM_001334832, NM_101559.2, NM_101560.5, NM_118890.2, NM_001341241.1, NM_202376.3, NM_100521.3, NM_105697.4, NM_102235.2, NM_001333885.1 and NM_127426.3.

2.2. Screening and Classification of TPS Gene Family Members in Sugarcane

Using the acquired amino acid sequences of TPS proteins in Oryza sativa Indica Group and A. thaliana as templates, TBLASTN was used to blast the sugarcane cultivar SP80-3280 whole-genome shotgun contigs (WGS) database (Accession:PRJNA431722) of NCBI to find all available sequences of sugarcane TPS genes. For BLAST searches, protein sequences of queries were used as inputs in the BLASTp tool, and the resulting hits were filtered by E-value (1e−5). Only the longest sequence was retained if several results were found for the same gene. The open reading frames were sought using the Open Reading Frame Finder program. The TPS and TPP domains were further validated by NCBI-CDD [28] and PFAM database [29]. Pseudogenes that overlapped less than 50% of the complete TPS and TPP domains were discarded. The gene structure of all sugarcane TPS gene family members was analyzed using Gene Structure Prediction [30]. BioEdit v7.0 [31] was used to analyze the homology and structural characteristics of all TPS gene family members and to systematically classify and name these TPS gene family members in reference to the rice TPS gene family. All sugarcane TPS protein sequences were analyzed by ExPASy to obtain their basic physical and chemical properties, such as molecular weight (MW), isoelectric point (pI), amino acid composition, instability coefficient, liposolubility index, and total average hydrophilicity. The protein subcellular localization was predicted by CELLO v.2.5 [32].

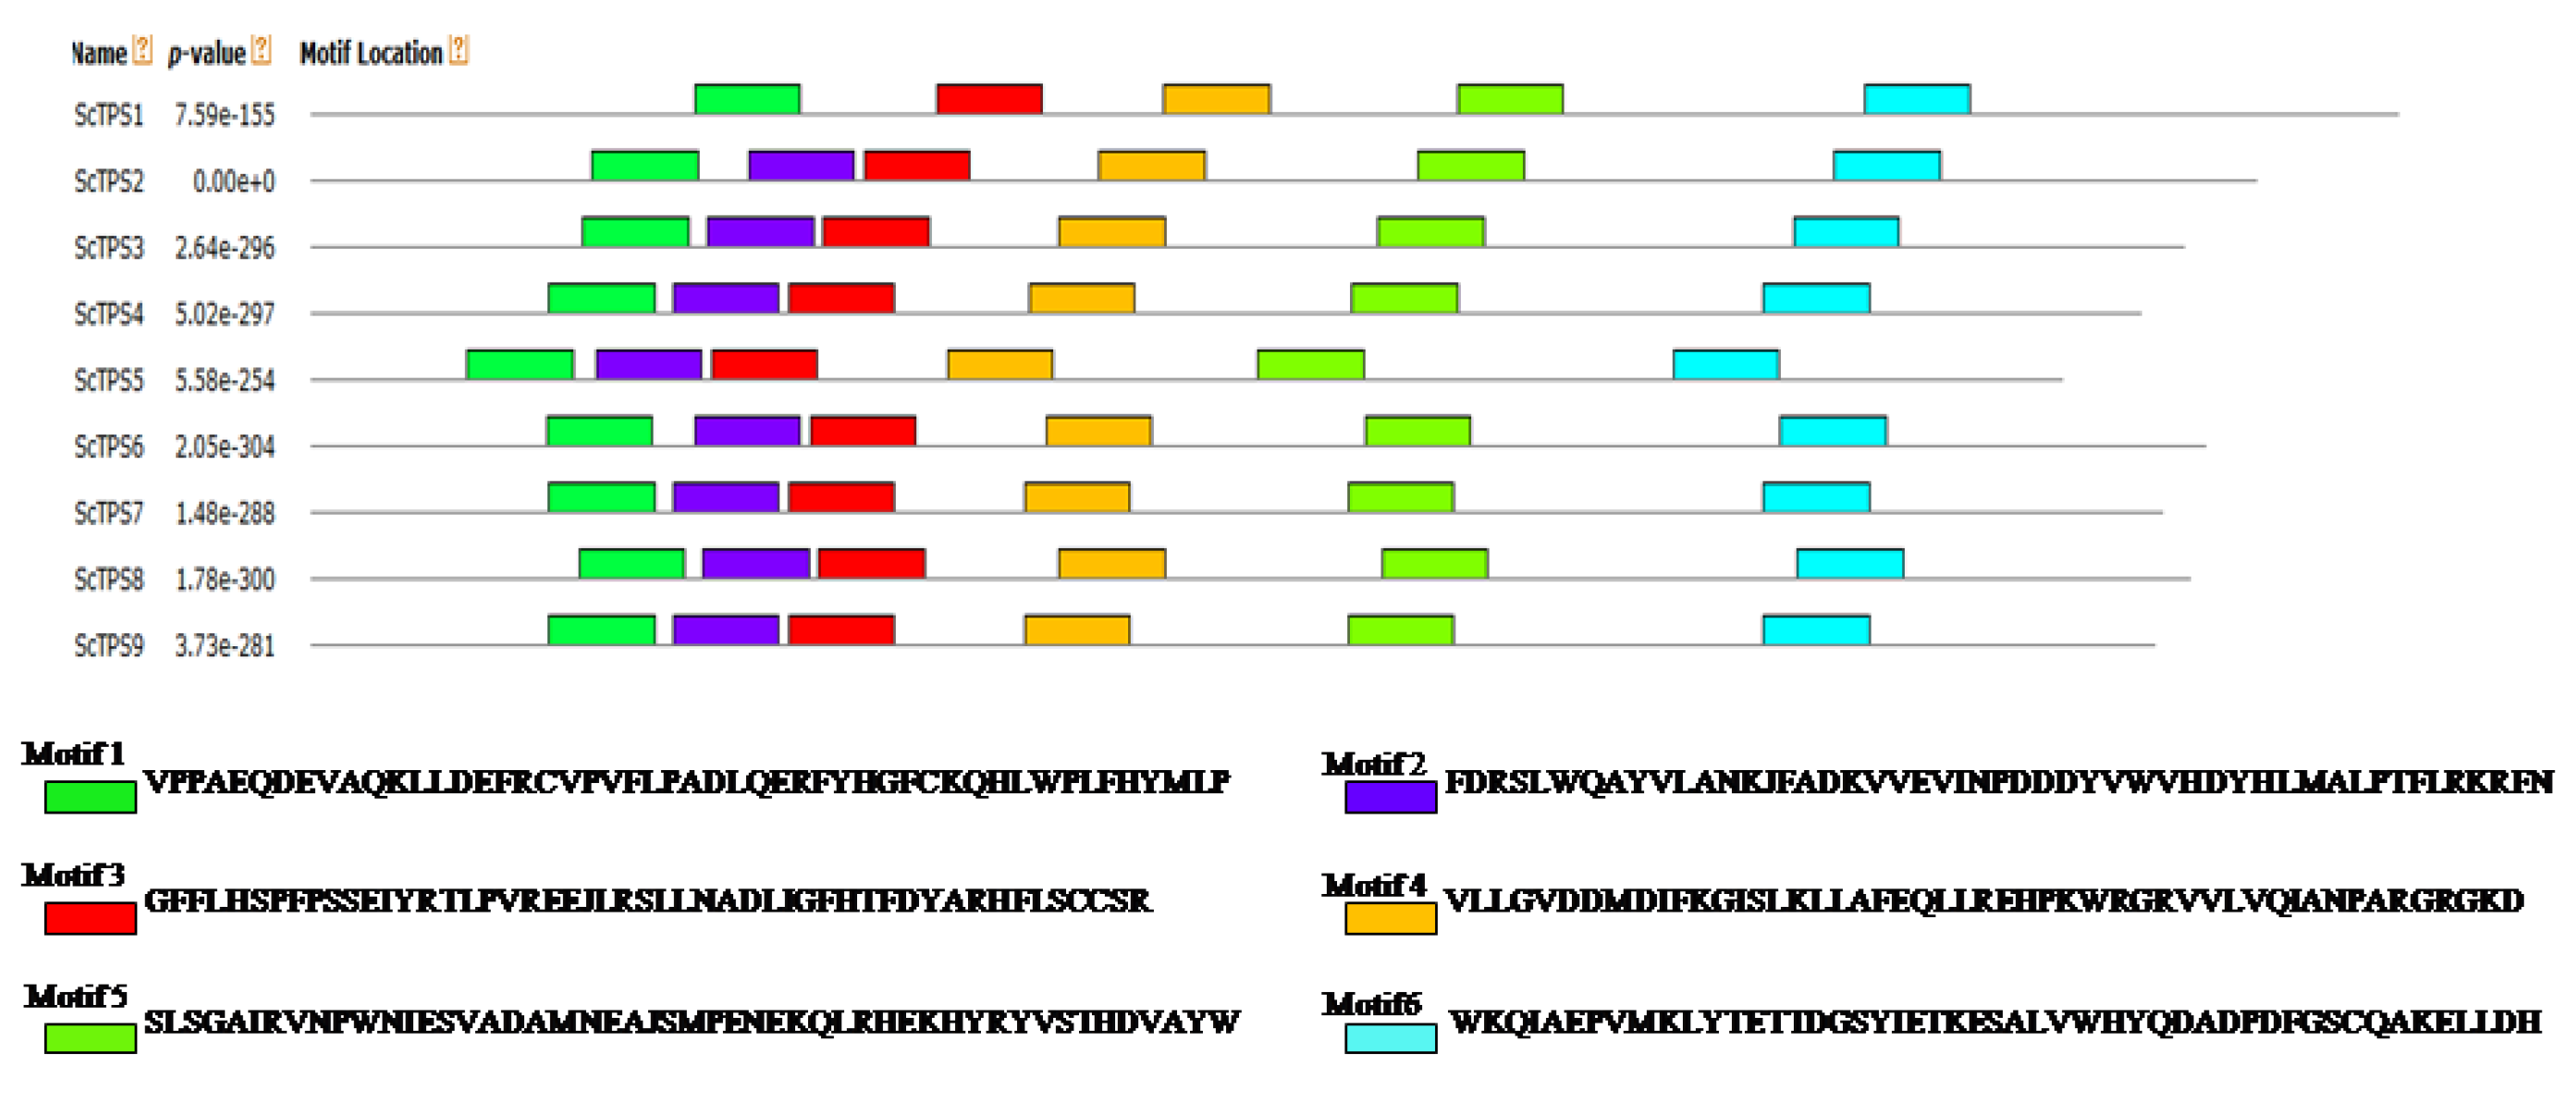
2.3. Motif Analysis of Sugarcane TPS Proteins

The motif structure of sugarcane TPS family members was analyzed by the MEME program (Version 5.1.1), and there were no gaps in the protein sequences from MEME analysis. Letters that appeared in each position constituted a position-specific probability matrix (PSPM), which could be used to judge the possible motifs in the sequence group. In parameter design, the minimum length of a motif sequence was 10, the maximum was 60, and the maximum number of conservative sequence discoveries was six.

2.4. Phylogenetic Analysis of TPS Proteins

Multiple amino acid sequence alignment of selected 31 TPS subfamily members from A. thaliana, O. sativa, and sugarcane was performed using ClusterW. MEGA 7.0 was used to construct a phylogenetic tree using Neighbor-Joining method and repeated 1000 times to obtain a bootstrap value [32].

2.5. Selection Assessment and Testing

The program PAML version 4.9j was used to test the selection pressure by assessing the values of nonsynonymous substitutions (dN), synonymous substitutions (dS) and dN/dS ratio (ω). [33]. The branch model 2 (two ratios) and branch-site model A was used on CodeML module in PAML [34]. The branch model 2, allowing the foreground branch to evolve under a different rate, was compared to null model (model 0: one ratio) assuming that all branches had been evolving at the same rate. Branch-site model A was used to search for positive selection in codon sites, which allowed individual site and different setups of foreground lineages to be tested depending on the gene substitutions. The likelihood ratio test (LRT) was used to evaluate the fit of the alternative model comparing with the null model. The branch with a p value less than 0.05 and a higher ω value for the foreground branch than the background branch was considered as evolving with a significantly faster rate in the foreground branch. The sites under positive selection were further identified using naive empirical Bayes (NEB) method and Bayes empirical Bayes (BEB) method [35].

2.6. Cis-Regulatory Elements Analysis of Sugarcane TPS Gene Families

A 2000-bp upstream sequence of the coding region of each sugarcane TPS gene family was analyzed for the promoter region. The cis-acting elements were analyzed using online data analysis software Plantcare.

2.7. Plant Growth and Treatments

As described previously [36], drought stress, salt stress, and ABA treatments were simulated using PEG-6000, NaCl, or ABA, respectively. Sugarcane seedlings of YZ05-51 were grown hydroponically in Hoagland solution containing 10% (w/v) PEG-6000, 200-mM NaCl, or 30-nM abscisic acid, respectively. Control groups were collected right before treatment, and the exponential groups were collected at 6, 12, 24, and 48 h after the stress treatments were imposed. Two seedlings were mixed into one sample, and three biological replicates were adopted at each condition. Samples were frozen in liquid N2 for further analysis.

2.8. Expression Analysis of ScTPSs

Total RNA was extracted using the Plant Total RNA Rapid Extraction Kit (Tiangen Technology Co., Ltd., Beijing, China), and the RNA was reverse transcribed into cDNA using the TIAN Script II first-chain synthesis kit (Tiangen Technology Co., Ltd.). Gene-specific primer synthesis and DNA sequencing were conducted by Beijing Genome Institute (Shenzhen, China). The specific nucleotide sequences of primers for quantifying every ScTPS expression were used, including q-ScTPS1 (F-5′ TGTGCCAACAAGAACTGACG R-5′ GCTCACAAGGTTCATCCCATC), q-ScTPS2 (F-5′ CGAGAAGGTCGTGGAGGTA R-5′ TGGTATTCAATTCCCAGCAT), q-ScTPS3 (F-5′ TGATGTTGCCTATTGGTCTAAG R-5′ GCTGTAATTGCCACTGTTCG), q-ScTPS4 (F-5′ AAGAGGTTGCGTCACGATAAGC R-5′ TGAAGAGTGCGGCGGTCAT), q-ScTPS5 (F-5′ TCCGAGTTCGTCGGTTGCTC R-5′ CCCTGCTCCACCTTGTGAAGTAA), q-ScTPS6 (F-5′ GTGGTAGTGACGGCTGTGAG R-5′ GCATGGCTTCCTAAAGTGATC), q-ScTPS7 (F-5′ TATGCTCGCCACTTCCTAT R-5′ CCTTTCAGCCACAGATACAG), q-ScTPS8 (F-5′ TTCCTCCACAGCCCGTTCC R-5′ TGTACCTCCTTCACATCCTTTCC) and q-ScTPS9 (F-5′ GACGTTGAGGAAGCGAAAT R-5′ CGTGAGACCTGACATAGCG). Gene expressions were normalized against an internal reference gene GAPDH using primers GAPDH-F (5′ CACGCCACTGAGCA) and GAPDH-R (5′ TCCAGTTCCATGCC). Three biological samples were evaluated and all reactions were performed in triplicate for the analysis of TPS gene expression on every condition. Independent gene expression experiments were repeated three times. The relative expression of ScTPS genes was calculated using the 2−ΔΔc(t) method of Meijerink et al. [37].

2.9. Statistical Analysis

Regarding the data distribution and the homogeneity of variance, the Kruskal–Wallis H test was used to analyze the difference of protein sequence identity in the pairwise comparisons of TPS gene members from A. thaliana, O. sativa and sugarcane at p < 0.05 (SPSS 10.0, Inc., Chicago, IL, USA). The Bonferroni method was further used for multiple comparison when there was statistical difference between groups. In the experiment of reverse transcription polymerase chain reaction analysis, the difference between relative gene expressions was analyzed using one-way ANOVA test, LSD-t method was used for further comparison between two groups at p < 0.05 (SPSS 10.0, Inc., Chicago, IL, USA). The data of each time points were independent by the chi-square test.

3. Results

3.1. Screening TPS Genes for Basic Physic-Chemical Properties of ScTPS Coding Proteins

Nine genes of the TPS family were identified from the sugarcane genome database. According to the homology of TPS proteins related to O. sativa, the nine sugarcane TPS genes were named ScTPS1 to ScTPS9 (Table 1). A protein domain analysis showed that the nine ScTPS gene-coded proteins typically contained two domains: TPS (Pfam: Glyco-transf-20) and TPP (Pfam: Trehalose-PPase). The nine ScTPS proteins had as few as 818 (ScTPS5) to as many as 976 (ScTPS1) amino acids. The molecular weights ranged from 91.05 (ScTPS5) to 108.39 (ScTPS1) kD. The isoelectric points ranged from 5.19 (ScTPS2) to 6.63 (ScTPS5) (Table 1). The ScTPS proteins were hydrophilic (hydrophobicity was <0). Except for ScTPS9, the other eight ScTPS proteins were unstable (instability coefficient > 40). Seven ScTPS proteins were localized in the cytoplasm, ScTPS2 was located in the cell membrane, and ScTPS7 in the nucleus.

3.2. Gene Structures and Protein Domains Analysis of ScTPSs

The nine ScTPS genes could be divided into two subfamilies (I and II) based on gene structures and protein homology (Figure 1). Subfamily I consisted of ScTPS1, with 16 introns. Subfamily II consisted of the other eight ScTPS genes. Except for ScTPS8 with three introns, the other ScTPS genes contained just two introns. Multiple sequence alignment of nine TPS protein sequences showed that the average amino acid sequence identity among nine full-length ScTPS proteins was 53.73%, with the highest identity between ScTPS2 and ScTPS6 (79.16%), and the lowest identity between ScTPS1 and ScTPS3 (32.40%). The average identities of amino acid sequence of TPS and TPP domains were 57.3% and 56.2%, respectively, with 35.30% of the sequences outside the domains. The amino acid identities between Class I (ScTPS1) with Class II (ScTPS2-9) were ranged from 32.40% to 35.27%, while the values were varied from 51.42% to 79.16% within Class II members.
Six motifs (Motifs 1 to 6) are found by motif analysis of ScTPS proteins (Figure 2). Motifs 1-5 are located in the TPS domain and Motif 6 is located in the TPP domain Figure 3. Eight TPS proteins contain all six motifs with a consistent arrangement order. However, ScTPS1 differs from the other proteins as it lacks Motif 2.

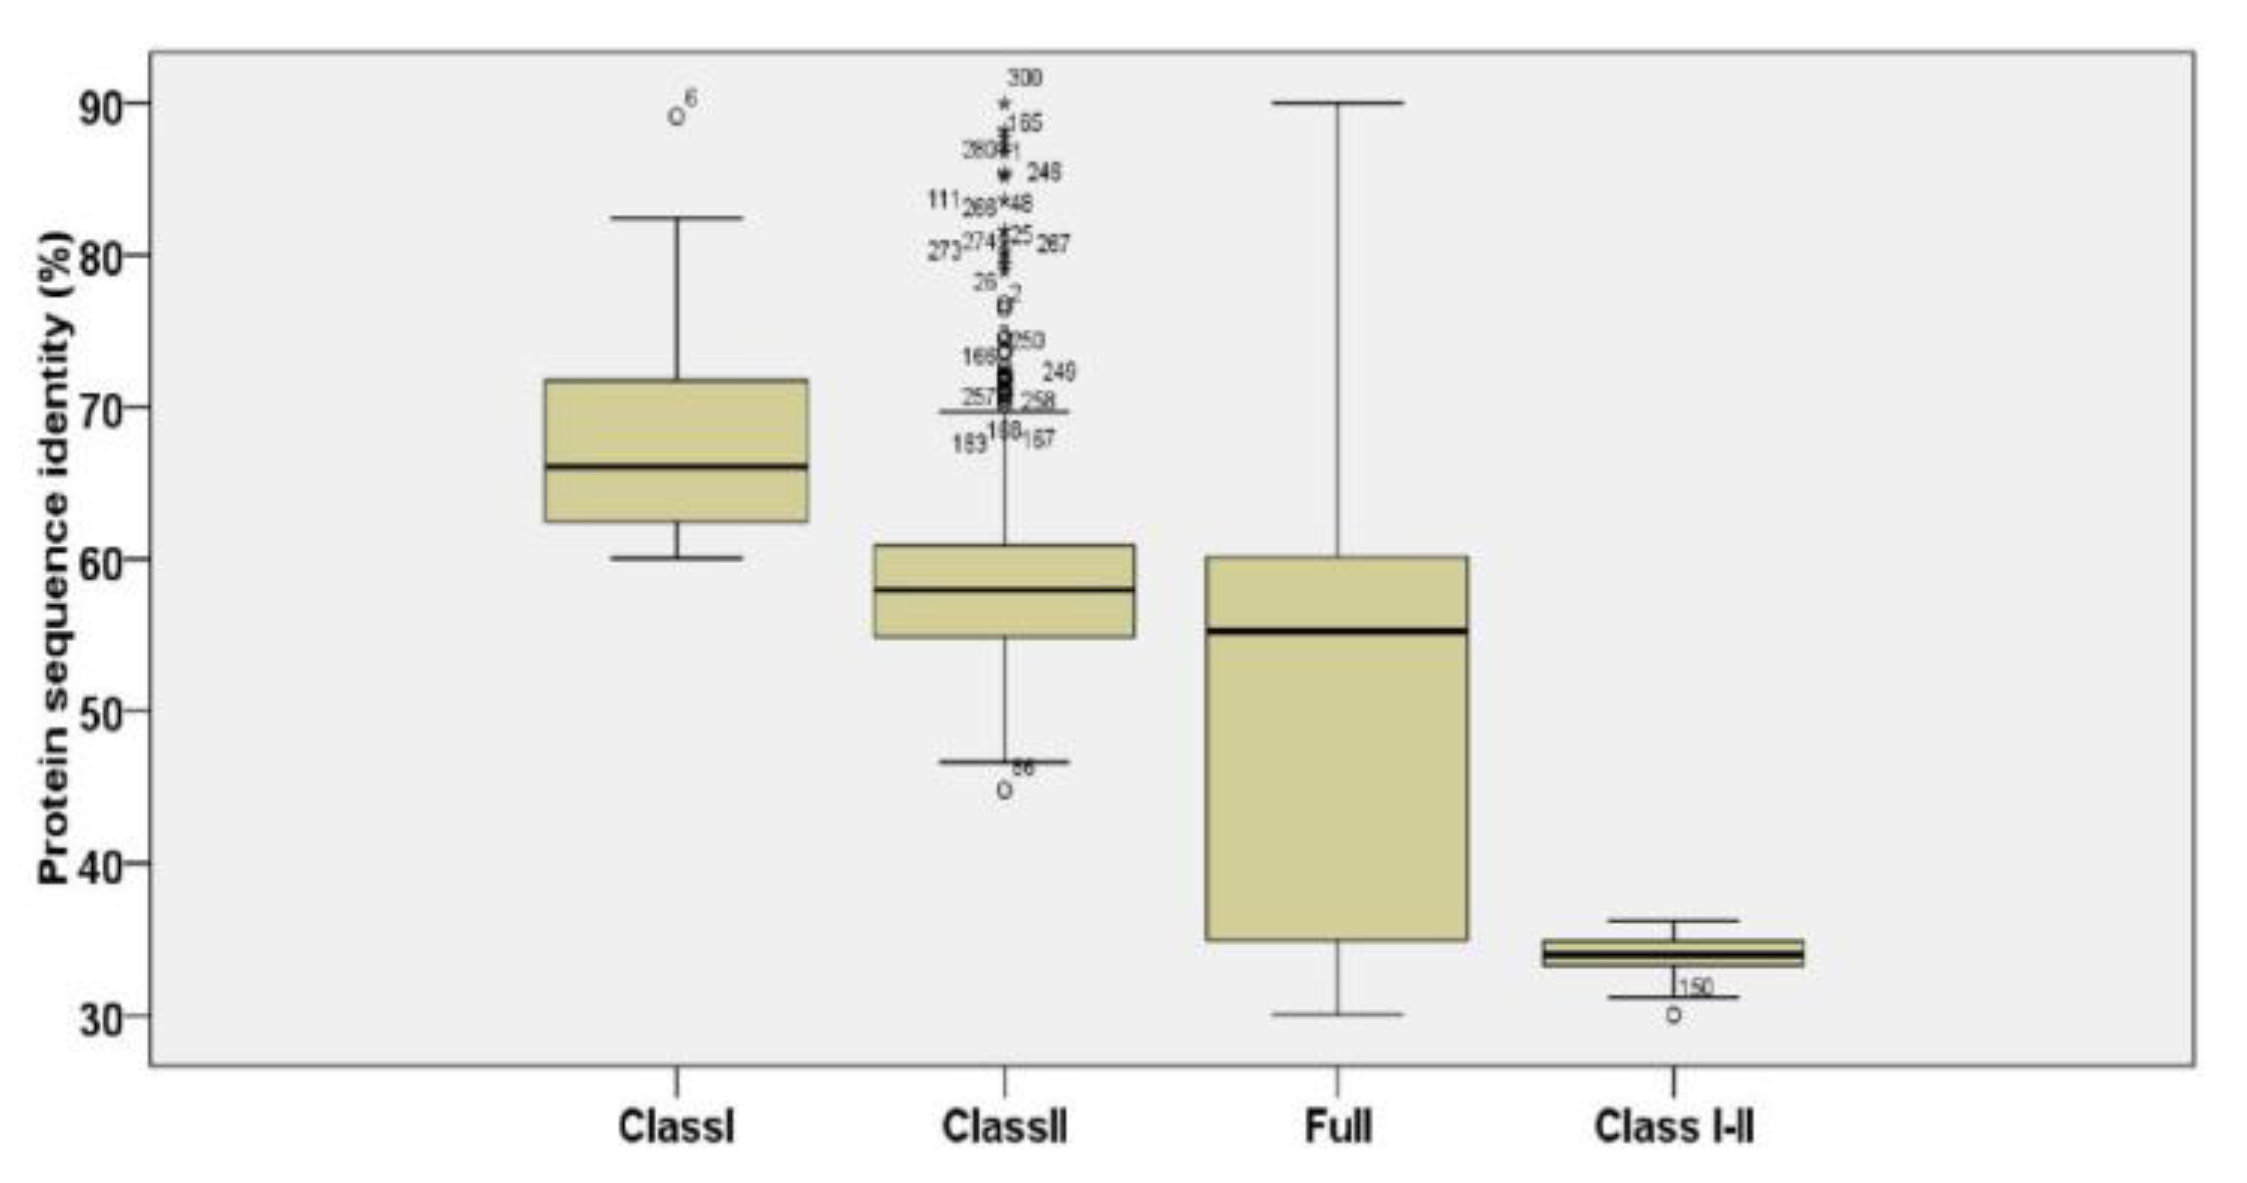
3.3. Evolution Analysis of ScTPS Genes

Pairwise comparisons were analyzed among the 31 full-length TPS protein sequences from Arabidopsis, rice and sugarcane. The result revealed that the protein sequence identities were differed between different groups (Figure 3). The full-length of 31 TPS proteins share 30.03–89.99% identities, while the average pairwise sequence identities were 67.88%, 58.86% and 34.03% in class I, class II and the sequences between the two TPS classes (Class I–II), respectively. Pairwise comparisons in both Class I and Class II TPS proteins groups were significantly higher than that of Class I-II groups (p < 0.0001). It indicated that there was clearly an evolutionary divergence between class I and class II TPS subfamilies.
A phylogenetic tree of 31 TPS genes was further constructed for the characterization of their evolutionary relationships (Figure 4). These TPS genes were divided into two distinct subfamily with 100% bootstrap support, each contained 25 Class II and 6 Class I TPS genes, respectively. In order to analyze orthologous relations in each subfamily, the 25 Class II TPS genes could be further divided into four groups (A, B, C and D) with high bootstrap support. The number of ScTPS genes, OsTPS genes and AtTPS genes in each of groups were A (5, 5, 3), B (2, 2, 3), C (0, 0, 1), D (2, 2, 0) and E (1, 1, 4), respectively. Clades A, B and E all contained at least one TPS gene of the three species, while only AtTPS gene was present in Clade C and no AtTPS genes belonged to Clade D. The six Class I TPS genes could be further assigned to two groups, the three TPS1 genes (AtTPS1, OsTPS1, and ScTPS1) subclade I and three other Arabidopsis Class I TPS genes (AtTPS2, AtTPS3, and AtTPS4) subclade II. The quantity variance of Class I TPS orthologous may indicate that subclade II TPS genes had been lost from the rice and sugarcane genome. There was a consistent evolutionary relation between sugarcane and rice, and the branches identified in the purple line represented the most recent split between monocot and dicot plants. The nodes that divided into purple lines and black lines were designated as the monocot-dicot common ancestors. Therefore, it was presumed that there were at least five orthologous groups in monocot and dicot plants.
Parameter estimates and likelihood ratio tests for the branch models were performed to evaluate the selective pressure on the five clades of TPS genes. The ω value of the one-ratio model (M0) was 0.10310, indicating a strong purifying selection pressure experienced by the TPS gene family (Table 2). Except for Clade A, there were significant diverse negative pressures on the other four clades by comparing M0 with M2. By comparing the values of background ω0 and foreground ω1, it was found that Clades B, C, D and E had clearly experienced stronger purifying selection. The tests also revealed that Class I TPS genes (all in Clade E) were under a stronger purifying selection than Class II TPS genes.
The branch-site model, which had the advantage of considering different branches with different selection pressures, was also applied to identify positive selective sites for five clades of TPS genes (Table 3). A subset of individual codon sites was significant under positive or diversifying selection pressures in Clades A, C, D and E by comparing to the corresponding null model. Estimated proportion of positive selection sites (proportion 2a + proportion 2b) of TPS genes were 2.9%, 7.0%, 4.3% and 32.3% in Clades A, C, D and E, respectively. There are three positive sites identified in both Clades A and C by NEB test at posterior probabilities (p) > 0.95 level. However, only one positive site in Clade A was significant in the BEB test at 0.95 cut-off, which was recommended by PAML [35]. This positively selected site identified in Clade A was 108R according to the references to first sequence of AtTPS1. Only a few positive selection sites were detected, further confirming that TPS genes were mainly affected by negative selection pressure.

3.4. Cis-Regulatory Element Analysis of ScTPS Genes

The promoter regions of the ScTPS gene family are rich in both plant hormone and abiotic stress-related cis-regulatory elements, and also contain an ABA response element (ABRE) (Figure 5). Eight ScTPS genes, except for ScTPS9, contained the methyl jasmonate reaction element (CGTCA-motif and TGACG motif) and salicylic acid response element (as-1). The promoter of four ScTPS genes contain an auxin response element (TGA-motif).
The promoter regions of the TPS gene also contain various cis-acting elements related to environmental and signal molecule responses. Within the promoter region, six ScTPS genes contain light response elements (G-box), seven ScTPS genes contain damage response elements (WRE3), eight ScTPS genes contain stress response elements (STRE), and nine ScTPS genes contain MYB and MYC transcription factor elements related to ABA or drought-induced expression regulation. Thus, the expression of ScTPS genes could be induced by various stresses, which might confer a homeostatic response to maintain normal growth and development under stress.

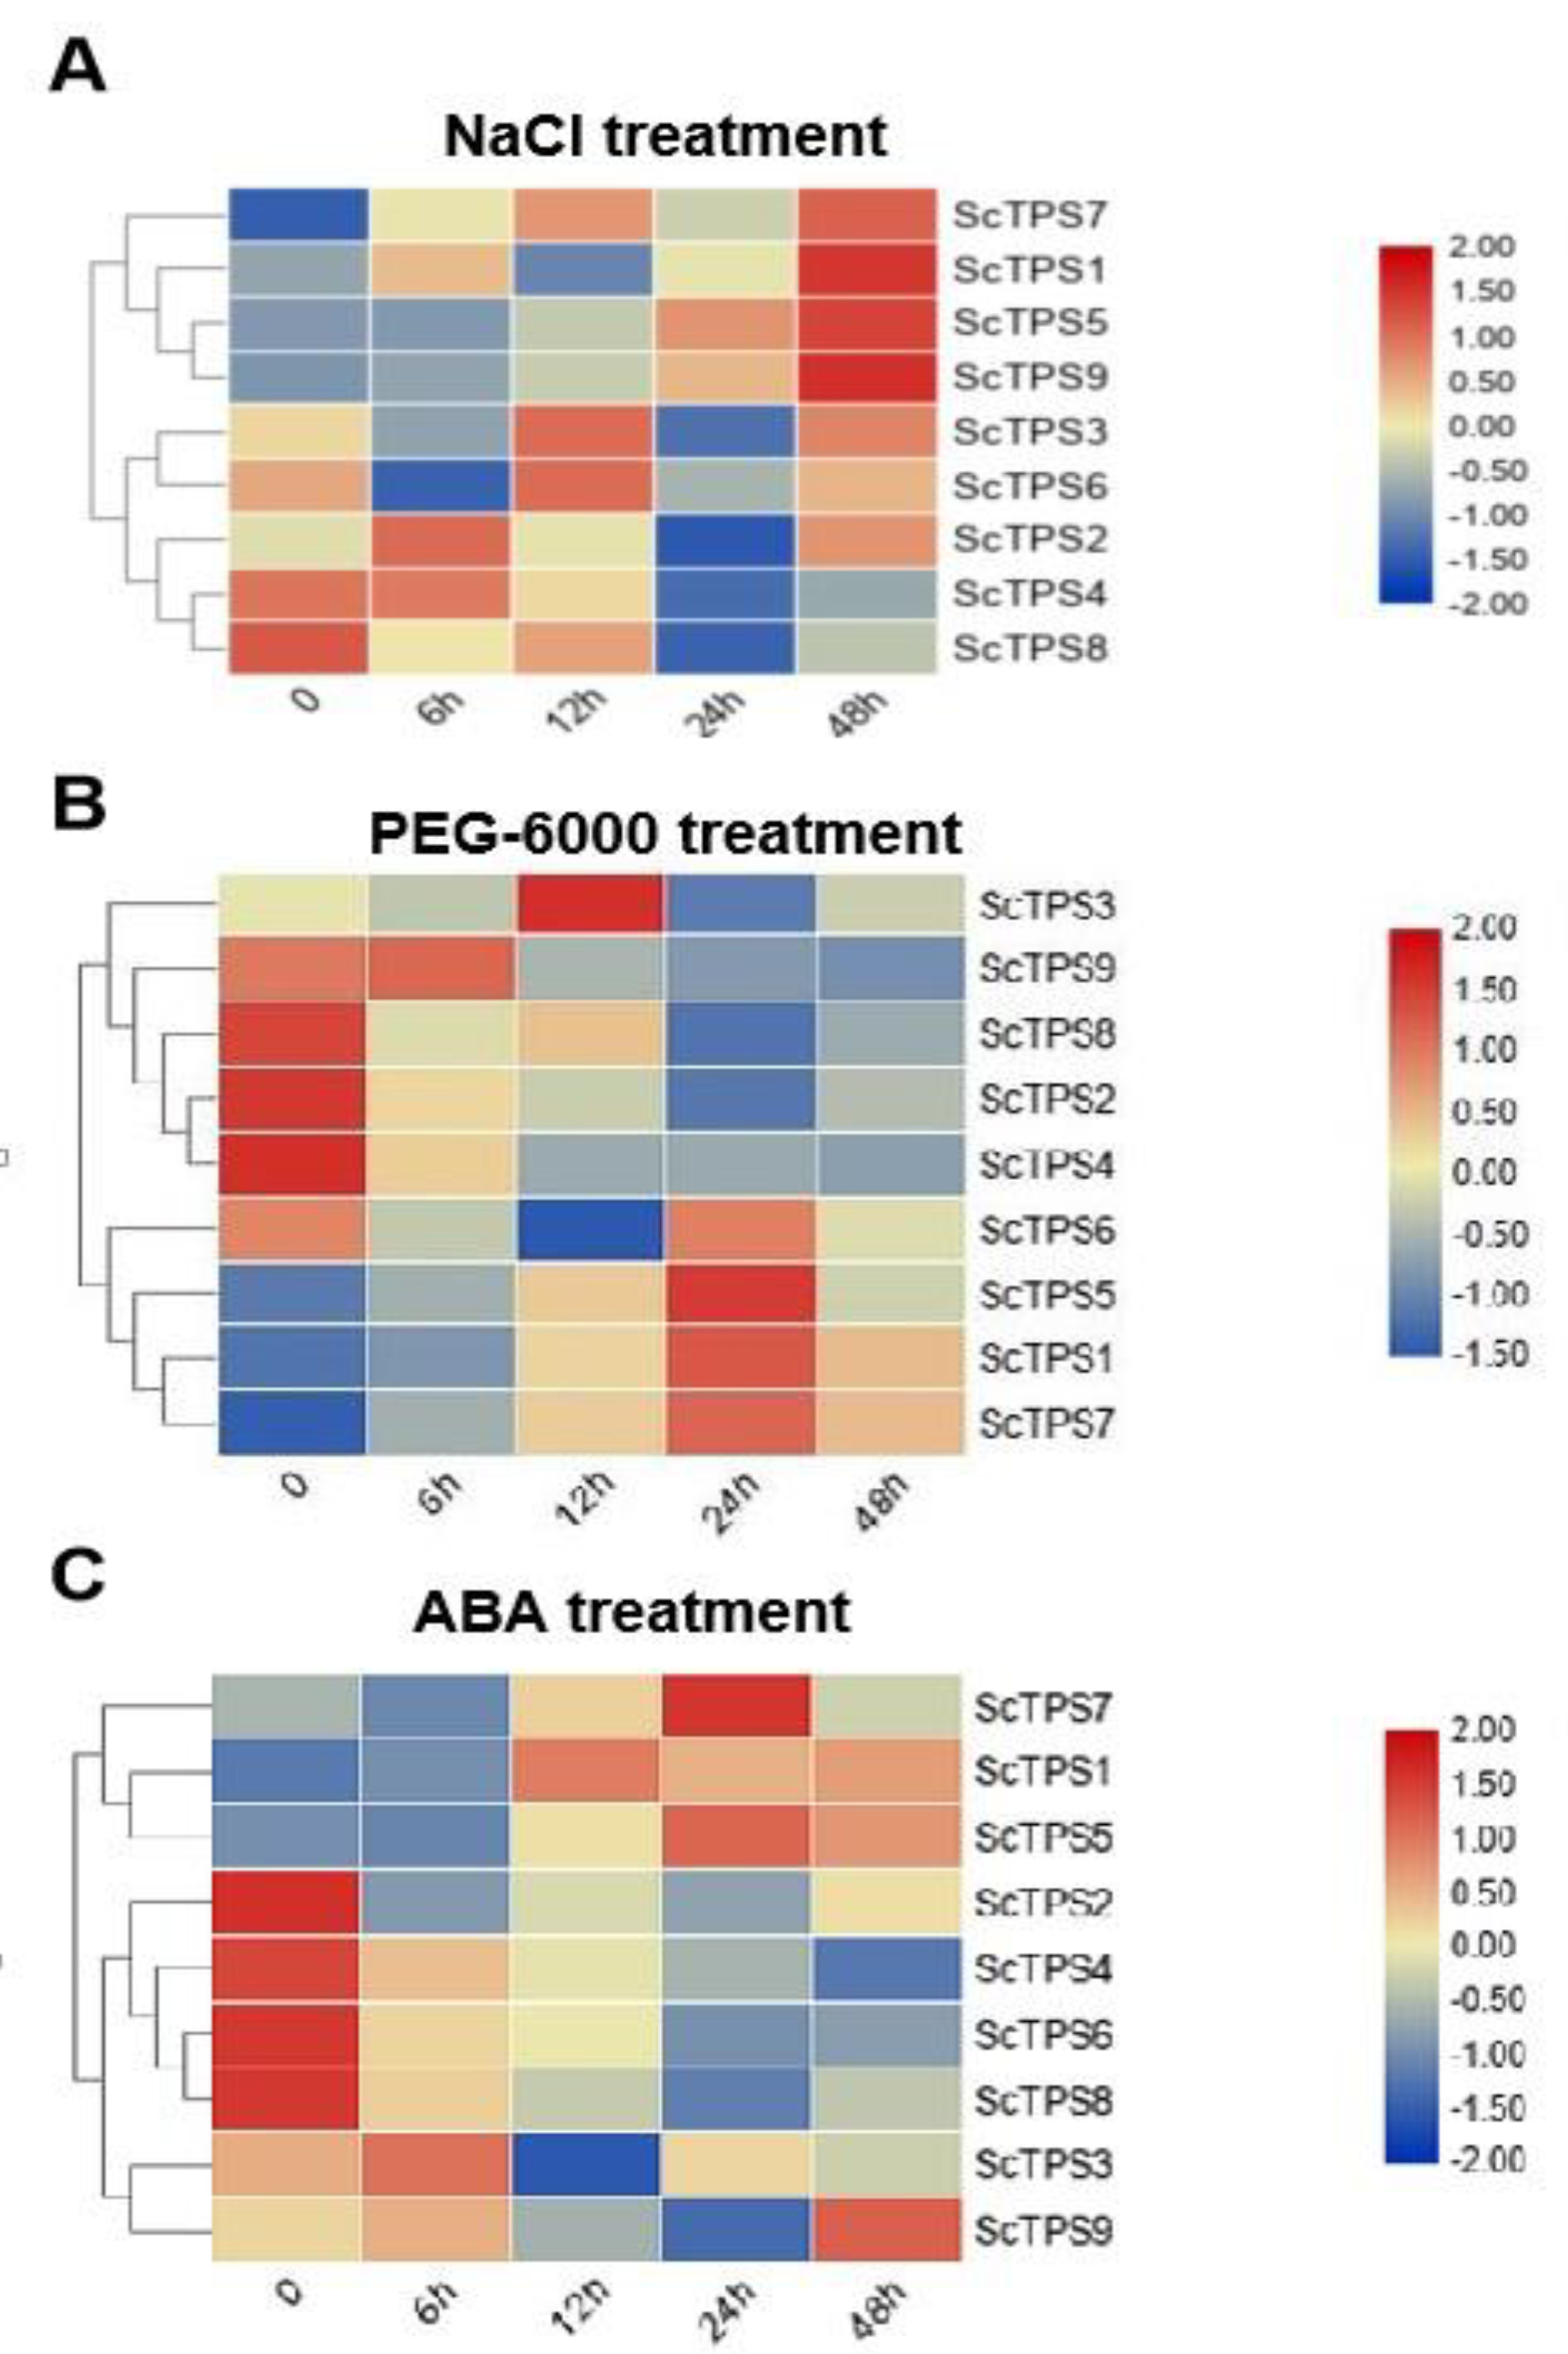
3.5. Analysis of ScTPSs Expression

It was found that ScTPS genes showed differential expression patterns under different treatments (Figure 6). Under salt treatment, ScTPS1, ScTPS5, ScTPS7 and ScTPS9 exhibited strong expression, with the highest expression level observed at 48 h post-treatment. In contrast, ScTPS4 and ScTPS8 were down-regulated with the lowest expression level observed at 24 h post-treatment. PEG-6000 treatment induced a decline in expression levels of most ScTPS genes, while ScTPS1, ScTPS5 and ScTPS7 exhibited obviously increased expressions at 24h post-treatment. Under ABA treatment, ScTPS2, ScTPS4, ScTPS6 and ScTPS8 were clearly down-regulated at both 24 and 48 h post-treatment, whereas the expresion of ScTPS1 and ScTPS5 were induced in response to ABA. Some genes with a closer phylogenetic relationship frequently showed a similar expression pattern in different treatments, although the response to each stressor varied somewhat. For instance, high salt, simulated drought, and ABA treatments all induced the expression of ScTPS1 and ScTPS5, and inhibited the expression of ScTPS2 and ScTPS6.

4. Discussion

We used bioinformatics methods to study the sugarcane TPS gene family in reference to O. sativa and A. thaliana genomes. In this study, nine TPS genes were identified in sugarcane, only ScTPS1 belonged to Class I. The number of introns and the length of genes differ between Class I and Class II subfamilies. This is basically in accordance with previous studies that identified 11 TPS genes in each of the Arabidopsis and rice genomes, which contain four (AtTPS1, AtTPS2, AtTPS3, and AtTPS4) and one (OsTPS1) Class I TPS genes, respectively [8,26]. The amino acid sequences of ScTPS genes are conservative. The conservation of TPS protein sequences may be driven by the spatial conformation of a long N-terminal TPS domain (460–500 amino acids in size) and a C-terminal TPP domain (about 240 amino acids in size). This hypothesis is well supported in the results that the average identities of amino acid sequence of TPS and TPP domains are both much higher than that of the sequences outside domains. The average amino acid identity is much lower between Class I-Class II pairwise comparisons than that within Class II pairwise comparisons, suggesting a clear evolutionary divergence. It is further confirmed by the phylogeny analysis on 31 TPS genes from Arabidopsis, rice, and sugarcane.
The evolutionary fate of sugarcane TPS genes is basically the same with those of rice. Their difference mainly embodies in the subclade D, which contains three OsTPS gene, but only one ScTPS gene. The distribution of orthologous genes in each subclade differs largely between monocot and dicot plants, suggesting the ancestral origin of the genes as divergent evolution after the monocot–eudicot separation. These results are also noted by several previous reports [2,10,38,39,40]. It is noteworthy that four Arabidopsis Class I TPS genes are further divided into two subclades, thus one subclade is likely lost from the rice and sugarcane genome. This feature of the dicots is also found in cassava [38]. More detailed TPS phylogentic analysis is needed to confirm the evolutionary feature of TPS gene. The technologies of accurate genome assemblies and annotations are also imperatively demanded in plant genomics.
The evolution analysis of TPS genes reveals that TPS family members appear to have undergone strong negative selection implying functional conservation of these TPSs. The strength of the selective pressure differs in most Clades, especially Clade E (belong to Class I) that experienced significantly stronger negative selection pressure than most Class II TPS genes. It is generally considered that amino acid sequences with important biological functions are less variable across species due to selection pressure [41,42]. Indeed, it was presumed that only TPS1 gene had TPS enzyme activity, until the discovery that both TPS2 and TPS4 of A. thaliana also had TPS enzyme activity [43]. Plant TPS1 gene is closely related to the growth and stress resistance of plants. Arabidopsis TPS1 was proven to be essential for embryogenic and vegetative growth [44]. Trehalose-6-phosphate, mainly synthesized by TPS synthase 1, is considered as a signaling molecule of carbohydrate status and is linked to the regulation of genes expression related to adverse environmental stresses [45,46]. The TPS class II gene has TPS domain, but has no obvious TPS enzyme activity, and its function is largely unknown. Thus it seems that most Class II gene is under relaxed purifying selection, but a positively selected site was identified in Clade A. This codon site may be functionally important, which may be a force directing the evolution of TPS gene in this Clade.
The distinct differences of expression pattern and function between Class I and Class II TPS genes might be related to wide variation in the exon—intron structures. It is found that certain introns are necessary for alternative splicing of mRNA, which could regulate the structure and function of gene-encoded proteins. Some may enhance the transcription and transport of mRNA, leading distinct tissue-specific patterns and diverse expression levels [47,48]. The loss of introns in Class II seems not to be related to selection pressure according to evolution analysis of ScTPS genes from our study. This could be due to gene mutation and other causations. Further research is needed to explore the introns of TPS genes on evolutionary reasons and their effects to TPS protein functions.
Plant TPS genes encode a key enzyme in trehalose metabolism pathway in response to diverse stressful conditions. The promoter region of ScTPS genes contains many cis-acting elements related to plant hormone and environmental stresses. Expression levels of TPS1 and TPS7 genes in S. tuberosum are significantly improved under high temperature, high salinity, and drought stress, suggesting that TPS genes might be involved in the signal transduction pathway of stress resistance [11]. An important feature of drought and salt stress is the osmotic effect on cells, which leads to ABA accumulation as an adaptive response [49]. The relationship between ScTPS and ABA signaling indicated that ScTPS might play an important role in plants counteracting drought stress.
Due to the protective effect of trehalose on abiotic stresses in plants, many researchers have attempted to introduce bacterial or yeast TPS genes to enhance plant stress tolerance, especially to drought. However, the over-expression of heterologous TPS genes is accompanied usually with abnormal phenotypes. It has been reported that A. thaliana and N. tabacum plants that overexpressed yeast TPS gene both exhibit obvious morphological defects [50,51]. One approach of enhancing stress resistance while avoiding undesirable phenotypic changes is through over-expression of endogenous TPS gene. For example, over-expression of AtTPS1 in A. thaliana [12] and OsTPS1 in O. sativa [13] improve their respective drought tolerance without increasing the frequency of aberrant phenotypes. The mechanism of phenotypic alterations caused by the expression of endogenous or heterologous TPS gene remains unclear. Interestingly, Zhang et al. [24] found that transgenic sugarcane that over-expresses Grifola frondosa trehalose synthase gene has improved drought tolerance without obvious morphological changes and growth inhibition in the field. Recently, Nilson et al. have acquired two sugarcane clones with STPS1 and STPS2 EST sequences that are identical to the ScTPS1 and ScTPS6 genes in this study, respectively [52]. Their results showed that STPS1 expression was up-regulated in drought-tolerant cultivars under water stress, while the expression of STPS2 gene had no significant change under same treatments. In this study, it also found that ScTPS1 gene expression was induced by salt, simulated drought, and ABA, suggesting that sugarcane plants increased trehalose-6-phosphate production to maintain stable intracellular osmotic pressure to mitigate simulated stress. Therefore, it is possible that genetic engineering of endogenous ScTPS1 genes involved in trehalose biosynthesis might confer increased drought tolerance to sugarcane. More research is needed to better understand the molecular regulatory network of ScTPS in sugarcane. Nonetheless, ScTPS marker-assisted selection of stress tolerant sugarcane genotypes might help sustain sugarcane production under stressful field conditions.

Author Contributions

Conceptualization, C.-W.W., Z.-D.W. and X.H.; Methodology and Validation, X.H., Z.-D.W., Z.-Y.L. and Y.-B.P.; Data Curation and Analysis, X.H., Z.-D.W., D.M.B., and Y.-B.P.; Manuscript preparation, X.H., D.M.B., and Y.-B.P.; Funding Acquisition, C.-W.W. and Z.-D.W. All authors have read and agreed to the published version of the manuscript.

Funding

The study was funded by Earmarked Fund for China Agriculture Research System (CARS-170101), Less Developed Regions of the National Natural Science Foundation of China (No.31860405), Central Public-Interest Scientific Institution Basal Research Fund for the Chinese Academy of Tropical Agricultural Sciences (NO. 1630052017020-4), the Applied Basic Research Projects in Yunnan Province (No. 2016FB071), and Applied Basic Research Projects of the Yunnan Academy of Agricultural Sciences (YJM201705). This study was also supported by the High-End Talent Program, Yunnan Provincial Science and Technology Department, and a Non-Funded Cooperative Agreement with the USDA-ARS on Sugarcane Breeding, Varietal Development, and Disease Diagnosis (Accession Number: 428157).

Acknowledgments

Authors are grateful to Z.-Y.L., X.H., J.-Y.L., H.-M.X, J.Z., L.Y, F.-G.Z., Y.Z., L.-P.Z., W.Q. and P.-F.Z. for technical assistance in field planting, management, and sample collection. We thank Perng-Kuang Chang, He-Ping Cao, and Yu-Lin Jia for excellent review comments.

Conflicts of Interest

The authors declare no conflict of interest. The funders had no role in the design of the study; in the collection, analyses, or interpretation of data; in the writing of the manuscript, or in the decision to publish the results.

References

  1. Pampurova, S.; Van Dijck, P. The desiccation tolerant secrets of Selaginella lepidophylla: What we have learned so far? Plant Physiol. Biochem. 2014, 80, 285–290. [Google Scholar] [CrossRef] [PubMed]
  2. Lunn, J.E. Gene families and evolution of trehalose metabolism in plants. Funct. Plant Biol. 2007, 34, 550–563. [Google Scholar] [CrossRef]
  3. Figueroa, C.M.; Lunn, J.E. A tale of two sugars: Trehalose 6-phosphate and sucrose. Plant Physiol. 2016, 172, 7–27. [Google Scholar] [CrossRef] [PubMed] [Green Version]
  4. Lunn, J.E.; Delorge, I.; Figueroa, C.M.; Van Dijck, P.; Stitt, M. Trehalose metabolism in plants. Plant J. 2015, 79, 544–567. [Google Scholar] [CrossRef] [PubMed]
  5. Blázquez, M.A.; Santos, E.; Flores, C.-L.; Martínez, M.; Ángeles, L.; Salinas, J.; Gancedo, C. Isolation and molecular characterization of the Arabidopsis TPS1 gene, encoding trehalose-6-phosphate synthase. Plant J. 1998, 13, 685–689. [Google Scholar]
  6. Zentella, R.; Mascorro-Gallardo, J.O.; Van Dijck, P.; Folch-Mallol, J.; Bonini, B.; Van Vaeck, C.; Gaxiola, R.; Covarrubias, A.A.; Nieto-Sotelo, J.; Thevelein, J.M. A Selaginella lepidophylla trehalose-6-phosphate synthase complements growth and stress-tolerance defects in a yeast tps1 mutant. Plant Physiol. 1999, 119, 1473–1482. [Google Scholar] [CrossRef] [PubMed] [Green Version]
  7. Wang, Y.J.; Hao, Y.J.; Zhang, Z.G.; Chen, T.; Zhang, J.S.; Chen, S.Y. Isolation of trehalose-6-phosphate phosphatase gene from tobacco and its functional analysis in yeast cells. J. Plant Physiol. 2005, 162, 215–223. [Google Scholar] [CrossRef]
  8. Zang, B.; Li, H.; Li, W.; Deng, X.W.; Wang, X. Analysis of trehalose-6-phosphate synthase (TPS) gene family suggests the formation of TPS complexes in rice. Plant Mol. Biol. 2011, 76, 507–522. [Google Scholar] [CrossRef]
  9. Ling, X.; Wang, Z.X.; Bo, H. Genome-wide identification classification and expression of TPS family genes in soybean. Chin. J. Oil Crop Sci. 2014, 36, 160–167. [Google Scholar]
  10. Xie, D.W.; Wang, X.N.; Fu, L.S.; Sun, J.; Zheng, W.; Li, Z.F. Identification of the trehalose-6-phosphate synthase gene family in winter wheat and expression analysis under conditions of freezing stress. J. Genet. 2015, 94, 55–65. [Google Scholar] [CrossRef]
  11. Xu, Y.; Wang, Y.; Mattson, N.; Yang, L.; Jin, Q. Genome-wide analysis of the Solanum tuberosum (potato) trehalose-6-phosphate synthase (TPS) gene family: Evolution and differential expression during development and stress. BMC Genomics 2017, 18, 926. [Google Scholar] [CrossRef]
  12. Avonce, N.; Leyman, B.; Mascorro-Gallardo, J.O.; Van Dijck, P.; Thevelein, J.M.; Iturriaga, G. The Arabidopsis trehalose-6-P synthase AtTPS1 gene is a regulator of glucose, abscisic acid, and stress signaling. Plant Physiol. 2004, 136, 3649–3659. [Google Scholar] [CrossRef] [PubMed] [Green Version]
  13. Li, H.W.; Zang, B.S.; Deng, X.W.; Wang, X.P. Overexpression of the trehalose-6-phosphate synthase gene OsTPS1 enhances abiotic stress tolerance in rice. Planta 2011, 234, 1007–1018. [Google Scholar] [CrossRef]
  14. Patade, V.Y.; Bhargava, S.; Suprasanna, P. Effects of NaCl and iso-osmotic PEG stress on growth, osmolytes accumulation and antioxidant defense in cultured sugarcane cells. Plant Cell Tissue Organ C (PCTOC) 2012, 108, 279–286. [Google Scholar] [CrossRef]
  15. Wu, C.W.; Chen, N.W.; Yang, R.Z.; Zhou, Z.L. Effects of water stress and rewatering on growth, development and related physiological indexes in sugarcane. Sugarcane 1998, 5, 6–12. [Google Scholar]
  16. Deren, C.W.; Snyder, G.H.; Miller, J.D.; Porter, P.S. Screening for and heritability of flood-tolerance in the florida (CP) sugarcane breeding population. Euphytica 1991, 56, 155–160. [Google Scholar] [CrossRef]
  17. Hemaprabha, G.; Nagarajan, R.; Alarmelu, S.; Natarajan, U.S. Parental potential of sugarcane clones for drought resistance breeding. Sugar Tech. 2006, 8, 59–62. [Google Scholar] [CrossRef]
  18. Lao, Z.Z.; Lao, F.Y.; Zhou, Y.H.; Li, Q.W.; Deng, H.H.; Huang, H.N.; Fu, C.; Hu, H.X.; Yang, Y.H.; Chen, X.W. Breeding of drought-tolerant sugarcane lines with E. arundinaceus germplasm. Zuo Wu Xue Bao 2002, 28, 841–846. [Google Scholar]
  19. Wang, L.P.; Jackson, P.A.; Lu, X.; Fan, Y.H.; Foreman, J.W.; Chen, X.K.; Deng, H.H.; Fu, C.; Ma, L.; Aitken, K.S. Evaluation of sugarcane × Saccharum spontaneum progeny for biomass composition and yield components. Crop Sci. 2008, 48, 951–961. [Google Scholar] [CrossRef]
  20. Pan, Y.-B. Development and integration of an SSR-based molecular identity database into sugarcane breeding program. Agronomy 2016, 6, 28. [Google Scholar] [CrossRef] [Green Version]
  21. Wu, J.; Wang, Q.; Xie, J.; Pan, Y.-B.; Zhou, F.; Guo, Y.; Chang, H.; Xu, H.; Zhang, W.; Zhang, C.; et al. SSR marker-assisted management of parental germplasm in sugarcane (Saccharum spp. hybrids) breeding programs. Agronomy 2019, 9, 449. [Google Scholar] [CrossRef] [Green Version]
  22. Paul, M.J.; Oszvald, M.; Jesus, C.; Rajulu, C.; Griffiths, C.A. Increasing crop yield and resilience with trehalose 6-phosphate: Targeting a feast-famine mechanism in cereals for better source-sink optimization. J. Exp. Bot. 2017, 68, 4455–4462. [Google Scholar] [CrossRef] [PubMed] [Green Version]
  23. Smeekens, S. Drought resistance: Spraying for yield. Nat. Plants 2017, 3, 17–23. [Google Scholar] [CrossRef] [PubMed]
  24. Zhang, S.Z.; Yang, B.P.; Feng, C.L.; Chen, R.K.; Luo, J.P.; Cai, W.W.; Liu, F.H. Expression of the Grifola frondosa trehalose synthase gene and improvement of drought-tolerance in sugarcane (Saccharum officinarum L.). J. Integr. Plant Biol. 2006, 48, 453–459. [Google Scholar] [CrossRef]
  25. Zhao, P.F.; Liu, J.Y.; Yang, K.; Xia, H.M.; Wu, C.W.; Chen, X.K.; Zhao, J.; Yang, H.C.; Li, J.; Zan, F.G. Registration of ‘YZ05-51‘ sugarcane. J. Plant Regist. 2015, 9, 172–178. [Google Scholar] [CrossRef]
  26. Yang, H.L.; Liu, Y.J.; Wang, C.L.; Zeng, Q.Y. Molecular evolution of trehalose-6-phosphate synthase (TPS) gene family in Populus, Arabidopsis and rice. PLoS ONE 2012, 7, e42438. [Google Scholar] [CrossRef]
  27. Kawahara, Y.; de la Bastide, M.; Hamilton, J.P.; Kanamori, H.; McCombie, W.R.; Ouyang, S.; Schwartz, D.C.; Tanaka, T.; Wu, J.; Zhou, S.; et al. Improvement of the Oryza sativa Nipponbare reference genome using next generation sequence and optical map data. Rice 2013, 6, 4. [Google Scholar] [CrossRef] [Green Version]
  28. Lu, S.; Wang, J.; Chitsaz, F.; Derbyshire, M.K.; Geer, R.C.; Gonzales, N.R.; Gwadz, M.; Hurwitz, D.I.; Marchler, G.H.; Song, J.S.; et al. CDD/SPARCLE: the conserved domain database in 2020. Nucleic Acids Res. 2020, 48, 265–268. [Google Scholar] [CrossRef] [Green Version]
  29. El-Gebali, S.; Mistry, J.; Bateman, A.; Eddy, S.R.; Luciani, A.; Potter, S.C.; Qureshi, M.; Richardson, L.J.; Salazar, G.A.; Smart, A.; et al. The Pfam protein families database in 2019. Nucleic Acids Res. 2019. [Google Scholar] [CrossRef]
  30. Hu, B.; Jin, J.; Guo, A.Y.; Zhang, H.; Luo, J.; Gao, G. GSDS 2.0: an upgraded gene feature visualization server. Bioinformatics 2015, 31, 1296–1297. [Google Scholar] [CrossRef] [Green Version]
  31. Hall, T.A. BioEdit: a user-friendly biological sequence alignment editor and analysis program for Windows 95/98/NT. Nucleic Acids Symp. Ser. 1999, 41, 95–98. [Google Scholar]
  32. Yu, C.S.; Lin, C.J.; Hwang, J.K. Predicting subcellular localization of proteins for Gram-negative bacteria by support vector machines based on n-peptide compositions. Protein Sci. 1987, 13, 1402–1406. [Google Scholar] [CrossRef] [PubMed] [Green Version]
  33. Yang, Z.; Nielsen, R. Synonymous and nonsynonymous rate variation in nuclear genes of mammals. J. Mol. Evol. 1998, 46, 409–418. [Google Scholar] [CrossRef] [PubMed]
  34. Zhao, Y.; Fu, L.; Li, R.; Wang, L.N.; Yang, Y.; Liu, N.N.; Zhang, C.M.; Wang, Y.; Liu, P. PAML TBB. 4: Phylogenetic analysis by maximum likelihood. Mol. Biol. Evol. 2007, 24, 1586–1591. [Google Scholar]
  35. Yang, Z.; Wong, W.S.; Nielsen, R. Bayes empirical bayes inference of amino acid sites under positive selection. Mol. Biol. Evol. 2005, 22, 1107–1118. [Google Scholar] [CrossRef] [PubMed] [Green Version]
  36. Yamaguchi-Shinozaki, K.; Shinozaki, K. A novel cis-acting element in an Arabidopsis gene is involved in responsiveness to drought, low-temperature, or high-salt stress. Plant Cell 1994, 6, 251–264. [Google Scholar] [PubMed] [Green Version]
  37. Meijerink, J.; Mandigers, C.; Locht, L.V.D.; Tönissen, E.; Goodsaid, F.; Raemaekers, J. A novel method to compensate for different amplification efficiencies between patient DNA samples in quantitative real-time PCR. J. Mol. Diagn. 2001, 3, 55–61. [Google Scholar] [CrossRef] [Green Version]
  38. Han, B.; Fu, L.; Zhang, D.; He, X.; Chen, Q.; Peng, M.; Zhang, J. Interspecies and intraspecies analysis of trehalose contents and the biosynthesis pathway gene family reveals roles of trehalose in osmotic-stress tolerance in cassava. Int. J. Mol. Sci. 2016, 17, 1077. [Google Scholar] [CrossRef]
  39. Henry, C.; Bledsoe, S.W.; Siekman, A.; Kollman, A.; Waters, B.M.; Feil, R.; Stitt, M.; Lagrimini, L.M. The trehalose pathway in maize: Conservation and gene regulation in response to the diurnal cycle and extended darkness. J. Exp. Bot. 2014, 65, 5959–5973. [Google Scholar] [CrossRef] [Green Version]
  40. Matthew, J.P.; Asier, G.U.; Cara, A.G.; Keywan, H.P. The role of trehalose 6-phosphate in crop yield and resilience. Plant Physiol. 2018, 177, 12–23. [Google Scholar]
  41. Kumar, A. Bayesian phylogeny analysis of vertebrate serpins illustrates evolutionary conservation of the intron and indels based six groups classification system from lampreys for~500MY. PeerJ 2015, 3, e1026. [Google Scholar] [CrossRef] [PubMed] [Green Version]
  42. Zhu, Y.; Spitz, M.R.; Amos, C.I.; Lin, J.; Schabath, M.B.; Wu, X. An evolutionary perspective on single-nucleotide polymorphism screening in molecular cancer epidemiology. Cancer Res. 2004, 64, 2251–2257. [Google Scholar] [CrossRef] [PubMed] [Green Version]
  43. Delorge, I.; Figueroa, C.M.; Feil, R.; Lunn, J.E.; Van Dijck, P. Trehalose-6-phosphate synthase 1 is not the only active TPS in Arabidopsis thaliana. Biochem. J. 2015, 466, 283–290. [Google Scholar] [CrossRef] [PubMed]
  44. Van Dijken, A.J.; Schluepmann, H.; Smeekens, S. Arabidopsis Trehalose-6-phosphate synthase 1 is essential for normal vegetative growth and transition to flowering1. Plant Physiol. 2004, 135, 969–977. [Google Scholar] [CrossRef] [Green Version]
  45. O’Hara, L.; Paul, M.J.; Wingler, A. How Do Sugars Regulate Plant Growth and Development? New Insight into the Role of Trehalose-6-Phosphate. Mol. Plant 2013, 6, 261–274. [Google Scholar] [CrossRef] [Green Version]
  46. Yadav, U.P.; Ivakov, A.; Feil, R.; Duan, G.Y.; Walther, D.; Giavalisco, P.; Piques, M.; Carillo, P.; Hubberten, H.-M.; Stitt, M.; et al. The sucrose–trehalose 6-phosphate (Tre6P) nexus: Specificity and mechanisms of sucrose signalling by Tre6P. J. Exp. Bot. 2014, 65, 1051–1068. [Google Scholar] [CrossRef] [PubMed] [Green Version]
  47. Reddy, A.S.N.; Marquez, Y.; Kalyna, M.; Barta, A. Complexity of the alternative splicing landscape in plants. Plant Cell 2013, 25, 3657–3683. [Google Scholar] [CrossRef] [PubMed] [Green Version]
  48. Baek, J.M.; Han, P.; Iandolino, A.; Cook, D.R. Characterization and comparison of intron structure and alternative splicing between Medicago truncatula, Populus trichocarpa, Arabidopsis and rice. Plant Mol. Biol. 2008, 67, 499–510. [Google Scholar] [CrossRef] [PubMed]
  49. Bartels, D.; Sunkar, R. Drought and salt tolerance in plants. Crit. Rev. Plant Sci. 2005, 24, 23–58. [Google Scholar] [CrossRef]
  50. Pilon-Smits, E.A.H.; Terry, N.; Sears, T.; Kim, H.; Zayed, A.; Hwang, S.; Van Dun, K.; Voogd, E.; Verwoerd, T.C.; Krutwagen, R.W.H.H.; et al. Trehalose-producing transgenic tobacco plants show improved growth performance under drought stress. J. Plant Physiol. 1998, 152, 525–532. [Google Scholar] [CrossRef]
  51. Schluepmann, H.; Pellny, T.; Van Dijken, A.; Smeekens, S.; Paul, M. Trehalose 6-phosphate is indispensable for carbohydrate utilization and growth in Arabidopsis thaliana. Proc. Natl. Acad. Sci. USA 2003, 100, 6849–6854. [Google Scholar] [CrossRef] [PubMed] [Green Version]
  52. Junior, N.N.; Nicolau, M.S.; Mantovanini, L.J.; Zingaretti, S.M. Expression analysis of two genes coding for trehalose-6-phosphate synthase (TPS), in sugarcane (Saccharum spp.) under water stress. Am. J. Plant. Sci. 2013, 4, 91–99. [Google Scholar] [CrossRef] [Green Version]
Figure 1. Gene structure of the trehalose-6-phosphate synthase (TPS) gene family (A) and phylogenetic tree (B) based on multiple sequence alignment of TPS protein in sugarcane. Part of nucleotide sequence in ScTPS1 intron is omitted marked with double wave line. The bootstrap value in which the associated taxa clustered together are shown next to the branches.
Agronomy 10 00969 g001
Figure 2. Motif analysis of the trehalose-6-phosphate synthasegene family in sugarcane. The different colored boxes represent different motifs and their positions in each TPS protein sequence.
Agronomy 10 00969 g002
Figure 3. Pairwise protein sequence identity of ScTPS proteins. ClassI, ClassII, Full and Class I-II represent the protein sequence identities in Class I TPS proteins group, Class II TPS proteins group, full TPS proteins group and sequence identities between Class I and Class II TPS proteins. Outliers and extreme outside of the boxplot whiskers (labeled by data number) are shown as circles and asterisks, respectively.
Agronomy 10 00969 g003
Figure 4. Phylogenetic analysis of the trehalose-6-phosphate synthase genes from sugarcane (ScTPS), Arabidopsis (AtTPS), and rice (OsTPS). The tree was constructed by the neighbor-joining method with 1000 bootstrap replicates, and all TPS genes were divided into five clades (Clade AE). The percentage of replicate trees in which the associated taxa clustered together in the bootstrap test are shown next to the branches. The scale bar represents 0.07 units of amino acid substitutions per site.
Agronomy 10 00969 g004
Figure 5. Cis-regulatory elements for the trehalose-6-phosphate synthase (ScTPS) gene family in sugarcane. The length of the bar represents the number of elements from 1 to 9. For reference, bars for cis-regulatory element MYB ScTPS8 and ScTPS7 represent 1 and 9 elements, respectively.
Agronomy 10 00969 g005
Figure 6. Expression pattern of ScTPS genes upon NaCl (A), PEG-6000 (B) and ABA (C) treatments. The stress conditions are salt (200 mM NaCl), 10% (w/v) PEG-6000 treatment and ABA treatment (30 nM). Control samples (setting of zero) are collected before treatment, and were compared with the test samples at 6, 12, 24 and 48 h post-treatment. Color scale represents fold changes (Treatment/Control) normalized log2 transformed data. Red indicates up-regulated and blue indicates down-regulated genes.
Agronomy 10 00969 g006
Table 1. Attributes of the trehalose-6-phosphate synthase (TPS) protein family in sugarcane.
ProteinGene Accession NumberNumber of Amino AcidMW
KD
TPS Domain LocationTPP Domain LocationpIGRAVYInstability IndexSubcellular Location
ScTPS1MN365026976108.4129–594653–8526.23−0.3450.64Cytoplasm
ScTPS2MT406177909101.877–577626–8605.19−0.23354.21Cytomembrane
ScTPS3MT40617887598.673–558607–8425.68−0.32549.24Cytoplasm
ScTPS4MT40617985596.956–546595–8285.87−0.22846.14Cytoplasm
ScTPS5MT40618081891.118–502551–7876.63−0.16554.84Cytoplasm
ScTPS6MT40618188599.455–552601–8355.45−0.26149.28Cytoplasm
ScTPS7MT40618286598.058–544593–8296.09−0.24141.63Nucleus
ScTPS8MT40618387899.066–560609–8435.87−0.245.82Cytoplasm
ScTPS9MT40618486197.557–544593–8276.22−0.19136.98Cytoplasm
MW: molecular weight, GRAVY: Grand average of hydropathicity.
Table 2. Parameter estimates and likelihood ratio tests for the branch models.
Modelp aEstimates of ParameterslnLdf2|ΔlnL|p
M0 (one ratio model)1ω0 = 0.10310−37899.458---
Branch-specific model (Model2: two ratios)
Estimate ω for A2ω0 = 0.10296, ω1 = 0.15313−37899.34910.2180.640
Estimate ω for B2ω0 = 0.10527, ω1 = 0.01488−37890.616117.684<0.001
Estimate ω for C2ω0 = 0.10406, ω1 = 0.05586−37897.18714.5420.033
Estimate ω for D2ω0 = 0.10741, ω1 = 0.00102−37865.102168.712<0.001
Estimate ω for E2ω0 = 0.10346, ω1 = 0.00759−37895.91917.0780.008
a The number of estimated parameters for the ω ratios.
Table 3. Parameter estimates and likelihood ratio tests for the branch-site models.
Modelp aEstimates of ParameterslnLdf2|ΔlnL|pPositively Selected Sites
Site Class 0 1 2a 2b
Branch-sites test for positive selection of Clade A
null3proportion 0.90708 0.09292 0.00000 0.00000
background ω 0.09643 1.00000 0.09643 1.00000
foreground ω 0.09643 1.00000 1.00000 1.00000
−37564.649----
alternative3proportion 0.88351 0.08743 0.02644 0.00262
background ω 0.09624 1.00000 0.09624 1.00000
foreground ω 0.09624 1.00000 19.25885 19.25885
−37557.107115.0840.00013(NEB:p > 0.95)
1(BEB:p > 0.95)
Branch-sites test for positive selection of Clade B
null3proportion 0.90708 0.09292 0.00000 0.00000
background ω 0.09643 1.00000 0.09643 1.00000
foreground ω 0.09643 1.00000 1.00000 1.00000
−37564.649----
alternative3proportion 0.90708 0.09292 0.00000 0.00000
background ω 0.09643 1.00000 0.09643 1.00000
foreground ω 0.09643 1.00000 1.00000 1.00000
−37564.6491-2E-060.9989none
Branch-sites test for positive selection of Clade C
null3proportion 0.81228 0.08171 0.09631 0.00969
background ω 0.09485 1.00000 0.09485 1.00000
foreground ω 0.09485 1.00000 1.00000 1.00000
−37551.627----
alternative3proportion 0.84537 0.08458 0.06368 0.00637
background ω 0.09554 1.00000 0.09554 1.00000
foreground ω 0.09554 1.00000 70.65026 70.65026
−37545.377112.4990.00043(NEB:p > 0.95)
Branch-sites test for positive selection of Clade D
null3proportion 0.88381 0.09033 0.02346 0.00240
background ω 0.09606 1.00000 0.09606 1.00000
foreground ω 0.09606 1.00000 1.00000 1.00000
−37563.772----
alternative3proportion 0.86913 0.08823 0.03871 0.00393
background ω 0.09603 1.00000 0.09603 1.00000
foreground ω 0.09603 1.00000 99.32701 99.32701
−37557.905111.7330.0006none
Branch-sites test for positive selection of Clade E
null3proportion 0.58766 0.06196 0.31697 0.03342
background ω 0.09601 1.00000 0.09601 1.00000
foreground ω 0.09601 1.00000 1.00000 1.00000
−37534.060----
alternative3proportion 0.61213 0.06467 0.29231 0.03088
background ω 0.09664 1.00000 0.09664 1.00000
foreground ω 0.09664 1.00000 34.71583 34.71583
−37531.56314.9940.0254none
a The number of estimated parameters for the ω ratios.

