Article

Assessing Nitrogen Cycling in Corncob Biochar Amended Soil Columns for Application in Agricultural Treatment Systems

by
Joseph R. Sanford
* and
Rebecca A. Larson
Department of Biological Systems Engineering, University of Wisconsin-Madison, 460 Henry Mall, Madison, WI 53706, USA
*
Author to whom correspondence should be addressed.
Agronomy 2020, 10(7), 979; https://doi.org/10.3390/agronomy10070979
Submission received: 3 June 2020 / Revised: 3 July 2020 / Accepted: 6 July 2020 / Published: 8 July 2020

Abstract

:
Biochar soil amendment to agricultural systems can reduce nitrogen (N) leaching; however, application to agricultural nitrogen treatment systems has not been extensively explored. The objective of this study was to assess the impact on N leaching in soils receiving repeated N applications which may be observed in agricultural treatment systems. In this study, 400 °C, 700 °C, and oxidized 700 °C corncob biochar was amended to sandy loam soil columns at 5% (wt/wt) to assess the impacts to N cycling following repeated synthetic N applications. Columns received weekly applications of either organic N (ORG-N), ammonium (NH4+-N), or nitrate (NO3-N) and the N effluent, gaseous emissions, and soil N retention was measured. Biochar produced at 400 °C significantly reduced N leaching compared to control columns by 19% and 15% for ORG-N and NH4+-N, respectively, with application concentrations similar to silage bunker runoff. For NO3-N applications, 700 °C biochar significantly reduced leaching by 25% compared to the controls. The primary mechanism reducing N effluent for biochar amended columns was enhanced soil retention of ORG-N and NO3-N. Biochar surface chemistry analysis measured an increase in oxygenated functional groups and cationic minerals on the biochar surface, which likely enhanced retention through cationic bridging or the development of an organomineral layer on the biochar surface. Results indicated biochar amendment to agricultural treatment systems receiving N runoff may reduce the risk of N leaching.

1. Introduction

Biochar is a carbon (C)-rich byproduct of pyrolysis, in which biomass is heated in the absence of oxygen. Biochar generally has a large surface area, alkaline pH, high water holding capacity, and a high cation exchange capacity [1,2], but properties can vary greatly depending on pyrolysis conditions. Biochar has typically been used as a soil amendment to improve soil nutrient availability, water holding capacity, enhance plant-microbe interactions, reduce nutrient leaching, and sequester carbon [3].
Multiple studies have shown that biochar amendment to agricultural soils can reduce nitrogen (N) leaching [4,5,6,7,8,9,10,11,12] and gaseous emissions [13,14]. Laboratory column studies have found biochar can reduce nitrate (NO3) and ammonium (NH4+) subsurface leaching following synthetic N fertilizer application from 5% to 37% and 15% to 35%, respectively [4,5,6,7,8,9,10]. Additionally, biochar amended soils receiving manure applications in column studies have reported reductions in total N (TN) ranging from 11% to 59% [11,12]. Similar results have been reported in field studies [8,15,16,17,18,19,20,21], highlighting the potential use of biochar to better manage N leaching in agricultural soil systems.
The mechanisms for the reduction in soil N leaching following biochar amendment is not well established. Studies have suggested that biochar amendment may reduce mineralization of ORG-N [22], possibly through ORG-N binding [23], preventing conversion to mobile inorganic N species, which are prone to leaching. However, others have suggested the additional C from biochar can enhance mineralization rates, with increases ranging from 40% to 220% [9,24]. Following mineralization, N leaching may be reduced through NH4+ binding to biochar as a result of the sorption [10,25,26]. Biochar’s ability to bind and immobilize NH4+ may also prevent nitrification, thereby reducing NO3 concentrations and leaching [27]. However, some incubation studies have found biochar may increase nitrification rates [24,28] potentially due to the increase in soil pH. Additionally, multiple field studies have contradicted NH4+ binding as the primary mechanism for reduction in N leaching, as soil extractions have identified NO3 to be the primary inorganic N species in biochar-amended soils [16,18,19,20,29,30]. Laboratory studies have found low NO3 sorption capacities for unprocessed biochar [31,32,33,34]. Thus, NO3 bound to biochar amended soil suggests that biochar properties are altered following soil amendment. Proposed mechanisms for this phenomenon include abiotic and biotic oxidation altering surface functional groups, development of complex organomineral layers, or unconventional hydrogen bonding [29,35,36]. Additionally, biochar has been shown to impact gaseous emissions of nitrous oxide (N2O), which may be related to NO3 binding in the soil, or an increase in soil pH due to biochar buffering capacity [13,14,16,37,38].
While most studies focus efforts on examining impacts of biochar amendment to agricultural cropping systems, there is potential to integrate biochar into agricultural treatment systems. Farmstead runoff from silage bunker pads or feedlots have high N concentrations [39,40,41] posing risks to water quality. Producers often use treatment systems to reduce N losses to surface water, such as vegetative treatment areas, which promote infiltration [42]. However, there is growing evidence that many agricultural treatment systems aimed at reducing runoff losses may not adequately address issues related to groundwater contamination, particularly from NO3 leaching [19,43,44,45]. Biochar may be a suitable amendment to reduce NO3 leaching through these vegetative treatment areas to reduce groundwater impacts. However, more information on the impact of N leaching when biochar is integrated in soil based treatment systems is needed to improve integration strategies.

2. Materials and Methods

The objectives of this study are to assess the impact of repeated N applications on N soil retention, leaching and gaseous emissions from biochar amended soil columns. To better understand these impacts, different N forms were applied to soil columns at varying rates. The N retained in biochar-amended soils, N leached through the columns, and the N2O and ammonia (NH3) emissions were quantified over ten weeks.

2.1. Soil Charracteristics

An engineered soil was obtained from a local landscaping company in Madison, WI, USA. The soil was a sandy loam with 68% sand, 21% silt, and 11% clay [46]. The soil had a pH of 6.3 and a N, phosphorus (P), and potassium (K) content of 0.66, 0.20, and 0.33 g kg−1, respectively.

2.2. Biochar Production and Properites

Corncob biochar was produced by Biochar Options, LLC at a production temperature of 400 °C (BC1) and 700 °C (BC2) for a holding time of one hour under oxygen limiting conditions. Following production, biochar was crushed and sieved through a number ten mesh sieve (pore size 2 mm). Following production, a portion of the 700 °C biochar was then oxidized (BC3), as oxidized biochar has shown enhanced NO3 sorption. Biochar was oxidized by suspending a 2.5% biochar to a liquid solution of 6 mmol g−1 sodium bromide (NaBr) and 50 mmol g−1 sodium hypochlorite (NaClO). The pH was adjusted to 11 using hydrochloric acid (HCl) and agitated for six hours at room temperature [36]. The solution was then filtered, and biochar was washed five times by submerging in deionized water (DI) for 10 min followed by vacuum filtration. BC3 was then sieved through a number ten mesh sieve (pore size 2 mm).
Biochar was characterized for elemental content and pH (Table S1). Carbon, hydrogen (H), and N was determined following ASTM D5373 using a PerkinElmer Elemental Analyzer (PerkinElmer, Waltham, MA). Oxygen content was determined by subtracting C, H, N, ash (via ASTM D1102), and moisture (via ASTM E871). The pH was measured using a 1:20 ratio of biochar to DI suspension and measuring pH with a HACH HQ440d Benchtop Multi Meter.

2.3. Experimental Design

Columns were constructed out of 3.8 cm diameter PVC pipe with a height of 36 cm. A fiberglass screen filter was attached to the bottom of the column. On top of the screen, 100 g of acid washed pea gravel (2>–4 mm) was added. Columns were then packed with 300 g of soil, or for those columns containing biochar treatments, a 5% (wt/wt) biochar to soil mixture, which was incorporated into the entire depth of the soil column. Biochar and soil was mixed in 50 g increments by adding soil and biochar to plastic bottle and inverting several times. Columns were filled by adding 50 g of soil and then compacting with a 125 g weight dropped from a height of 15 cm two times and repeated until 300 g of soil mixture was added. Four column treatments included the control (sandy loam soil), 5% BC1 amended, 5% BC2 amended, and 5% BC3 amended (Table 1). Columns were placed in a climate-controlled room at a temperature of 20 °C and relative humidity of 50%.
Soil columns were grouped into five trials where each group received different N applications (Table 1). Treatment group one consisted of a control and 5% BC1 receiving repeated applications of low ORG-N blend (150 mg ORG-N L−1), similar to concentrations in silage bunker runoff [41]. Treatment group two consisted of control and 5% BC1 receiving repeated high ORG-N applications (2500 mg ORG-N L−1), similar to concentrations in manure [11]. The ORG-N solution in treatment groups one and two were made up of 50% arginine, 40% glycine, and 10% alanine, which are abundant ORG-N forms in manure [47]. Group three consisted of a control and 5% BC1 receiving repeated low NH4+-N applications (50 mg NH4+-N L−1), similar to concentrations in silage bunker runoff [41]. Treatment group four consisted of a control and 5% BC1 receiving repeated high NH4+-N applications (1,250 mg NH4+-N L−1), similar to concentrations in manure [11]. Group five consisted of control, 5% BC1, 5% BC2, and 5% BC3 treatments receiving repeated NO3-N applications (20 mg NO3-N L−1), similar to tile drainage effluent [48]. More treatments were present in group five to identify if production temperature or oxidation impacted NO3 leaching. The NH4+-N and NO3-N solutions were prepared using ammonium chloride (NH4Cl) and sodium nitrate (NaNO3), respectively. Solutions ionic strength was adjusted to be representative of manure, silage bunker runoff, or tile drainage effluent by adding monopotassium phosphate (KH2PO4). Target ionic strengths were estimated by using electrical conductivity values reported for manure (17.00 ms cm−1) [11], silage bunker runoff (1.24 ms cm−1) [41], and tile drainage effluent (0.38 ms cm−1) [48] and applying the Snoeyink and Jenkins [49] relationship to determine ionic strength. The amount of KH2PO4 added to the solution was then determined using Equation (1):
I = 1 2 C i Z i 2
where I is the ionic strength, Ci is the molar concentration (M) of an ion, and Zi is the charge number.
Solutions were applied at a volume of 150 mL or 13.2 cm, which corresponds to a N application rate for groups one, two, three, four, and five of 198, 3306, 66, 1653, and 26 kg N ha−1, respectively (Table 1). Applications occurred once a week (seven days between applications) for ten weeks. During application, columns were allowed to drain completely which typically took between one to two hours. Following EPA guidelines, samples were immediately analyzed for pH and preserved and stored at 4 °C (no longer than 28 days). Samples were analyzed for total phosphorus (TP), total Kjeldahl nitrogen (TKN), ammoniacal nitrogen (TAN), nitrates (NO3+NO2-N), and nitrite (NO2-N) following USEPA approved methodology (Table S2).
A dynamic flow through chamber was used to measure NH3 emissions from the soil. The column walls served as the chamber anchor and a PVC cap with inlet and outlet ports served as the lid. The lid was sealed to the column using rubber stripping and hose clamps. A SKC PCXR4 Universal Sample Pump (SKC, Eighty Four, PA) pumped ambient air into the chamber at a flow rate of 250 mL min−1. Emissions were then recorded every 15 s for 5 min using a MAS 5X gas monitor (Mine Safety Appliances, Cranberry Township, PA). All connection tubing was Teflon to minimize chemical reactions. Measurements were taken 1, 6, 24, and 72 h after weekly applications. Flux of NH3 [50] was determined following Equation (2):
J = Q C e q C i A
where J is the NH3 flux (mg NH3-N m−2 s−1), Q is the dynamic chamber flow rate (m3 s−1), Ceq is the equilibrium concentration (mg NH3 m−3), Ci is the initial NH3 concentration (mg NH3 m−3), and A is the soil surface area (m2). Total loss gas (loss due to chamber or sample lines) was determined to be negligible. Cumulative emissions were determined using fluxes and multiplying by the time between sampling points.
A static chamber was used for N2O emissions following GRACEnet protocol [51]. The column walls served as the anchor and the lid was a PVC cap with a septum installed. The PVC lid was sealed using the same method as the dynamic chamber. Sample collection took place once a week 24 h after nutrient application. Gas was measured by sampling headspace gas at 12-min intervals for 36 min. Glass 5.9 mL Exetainer vials (Labco Limited, Buckinghamshire, UK) were overcharged with 10 mL gas samples. Gas concentrations were measured by gas chromatography with a 15 mCi 63Ni electron capture detector for N2O (Agilent 7890A GC system). Flux of N2O was determined following Equation (3) [51]:
F = S V c A
where F is the N2O flux (mg N2O-N m−2 h−1), Vc is the chamber volume (m3), A is the soil surface area (m2), and S is the slope of change in concentration over time (mg N2O m−2 h−1), which was calculated based on the concentration linear regression. Cumulative emissions were determined using fluxes and multiplying them by the time between sampling points. Using a mass balance approach, any unaccounted influent N (i.e., influent N subtracted by effluent N, retained N, N2O, and NH3) was assumed to be lost as N2 through denitrification.

2.4. Soil and Biochar Analysis

Following ten weeks of nutrient applications, soil was removed from each column. Soil was dried at 50 °C for 48 h [52], ground to pass through a 2mm sieve, and stored at 4 °C until analysis. Soil pH was determined with a HACH HQ440d Benchtop Multi Meter pH probe after diluting soil 1:2.5 by mass with DI [53]. Extractable NO3-N and NH4+-N were determined using a modified KCl extraction method, as past studies have reported standard KCl soil extractions underestimate biochar NO3-N content [30,35,54]. It has been suggested that KCl extractions for biochar amended soils be conducted at higher temperatures (>50 °C) for a long duration to ensure extraction efficiency [35]. Methods outlined in Walsh et al. [55] were followed for inorganic N extractions. Soil samples were suspended with 2 M KCl at a ratio of 1:10 (wt/vol) and placed on a temperature-controlled shaker at 50 °C and 100 rpm for 24 h. Suspensions were then vacuum filtered through 1.5 µm filter paper and collected. The soil was rinsed twice by pouring 25 mL of DI over the biochar and vacuum filtering. Filtrate was preserved and stored at 4 °C (no longer than 28 days) until analyzed for NO3+NO2-N and TAN following EPA approved methods (Table S2). Additionally, soil samples were analyzed for TKN using a copper catalyst digestion method [56].
A portion of biochar was removed from the soil and analyzed for changes in surface functional groups. Fourier-transform infrared spectroscopy (FTIR) spectra were analyzed with a PerkinElmer Spectrum 100 FT-IR Spectrometer (PerkinElmer, Waltham, MA) using potassium bromide (KBr) pellets containing 0.3% of finely ground biochar [57]. Spectra were obtained from 550 to 4000 cm−1 over 100 scans with a resolution of 4 cm−1. To illicit potential nitrogen binding mechanisms X-ray photo-electron spectroscopy (XPS) analyses using a Thermo K-Alpha X-ray Photoelectron Spectrometer (Thermo Scientific, Waltham, MA) was used. Survey spectra were scanned from 1350 to 0 eV binding energy range and recorded with a pass energy of 50 eV over 20 scans. Thermo Avantage version 5.9 was used for peak identification and fitting.

2.5. Data Analysis

Analysis was performed in SAS [58]. Repeated measures (Proc Mixed) using first-order auto-regressive variance-covariance structure was used to determine statistical differences of cumulative effluent nutrient content between treatments. One-way analysis of variance (ANOVA) with Fisher’s least significant difference test (LSD) was conducted to compare influent and effluent nutrient concentrations for each event for water quality parameters and soil N content following applications.

3. Results

3.1. Organic Nitrogen Application (Treatment Groups 1 and 2)

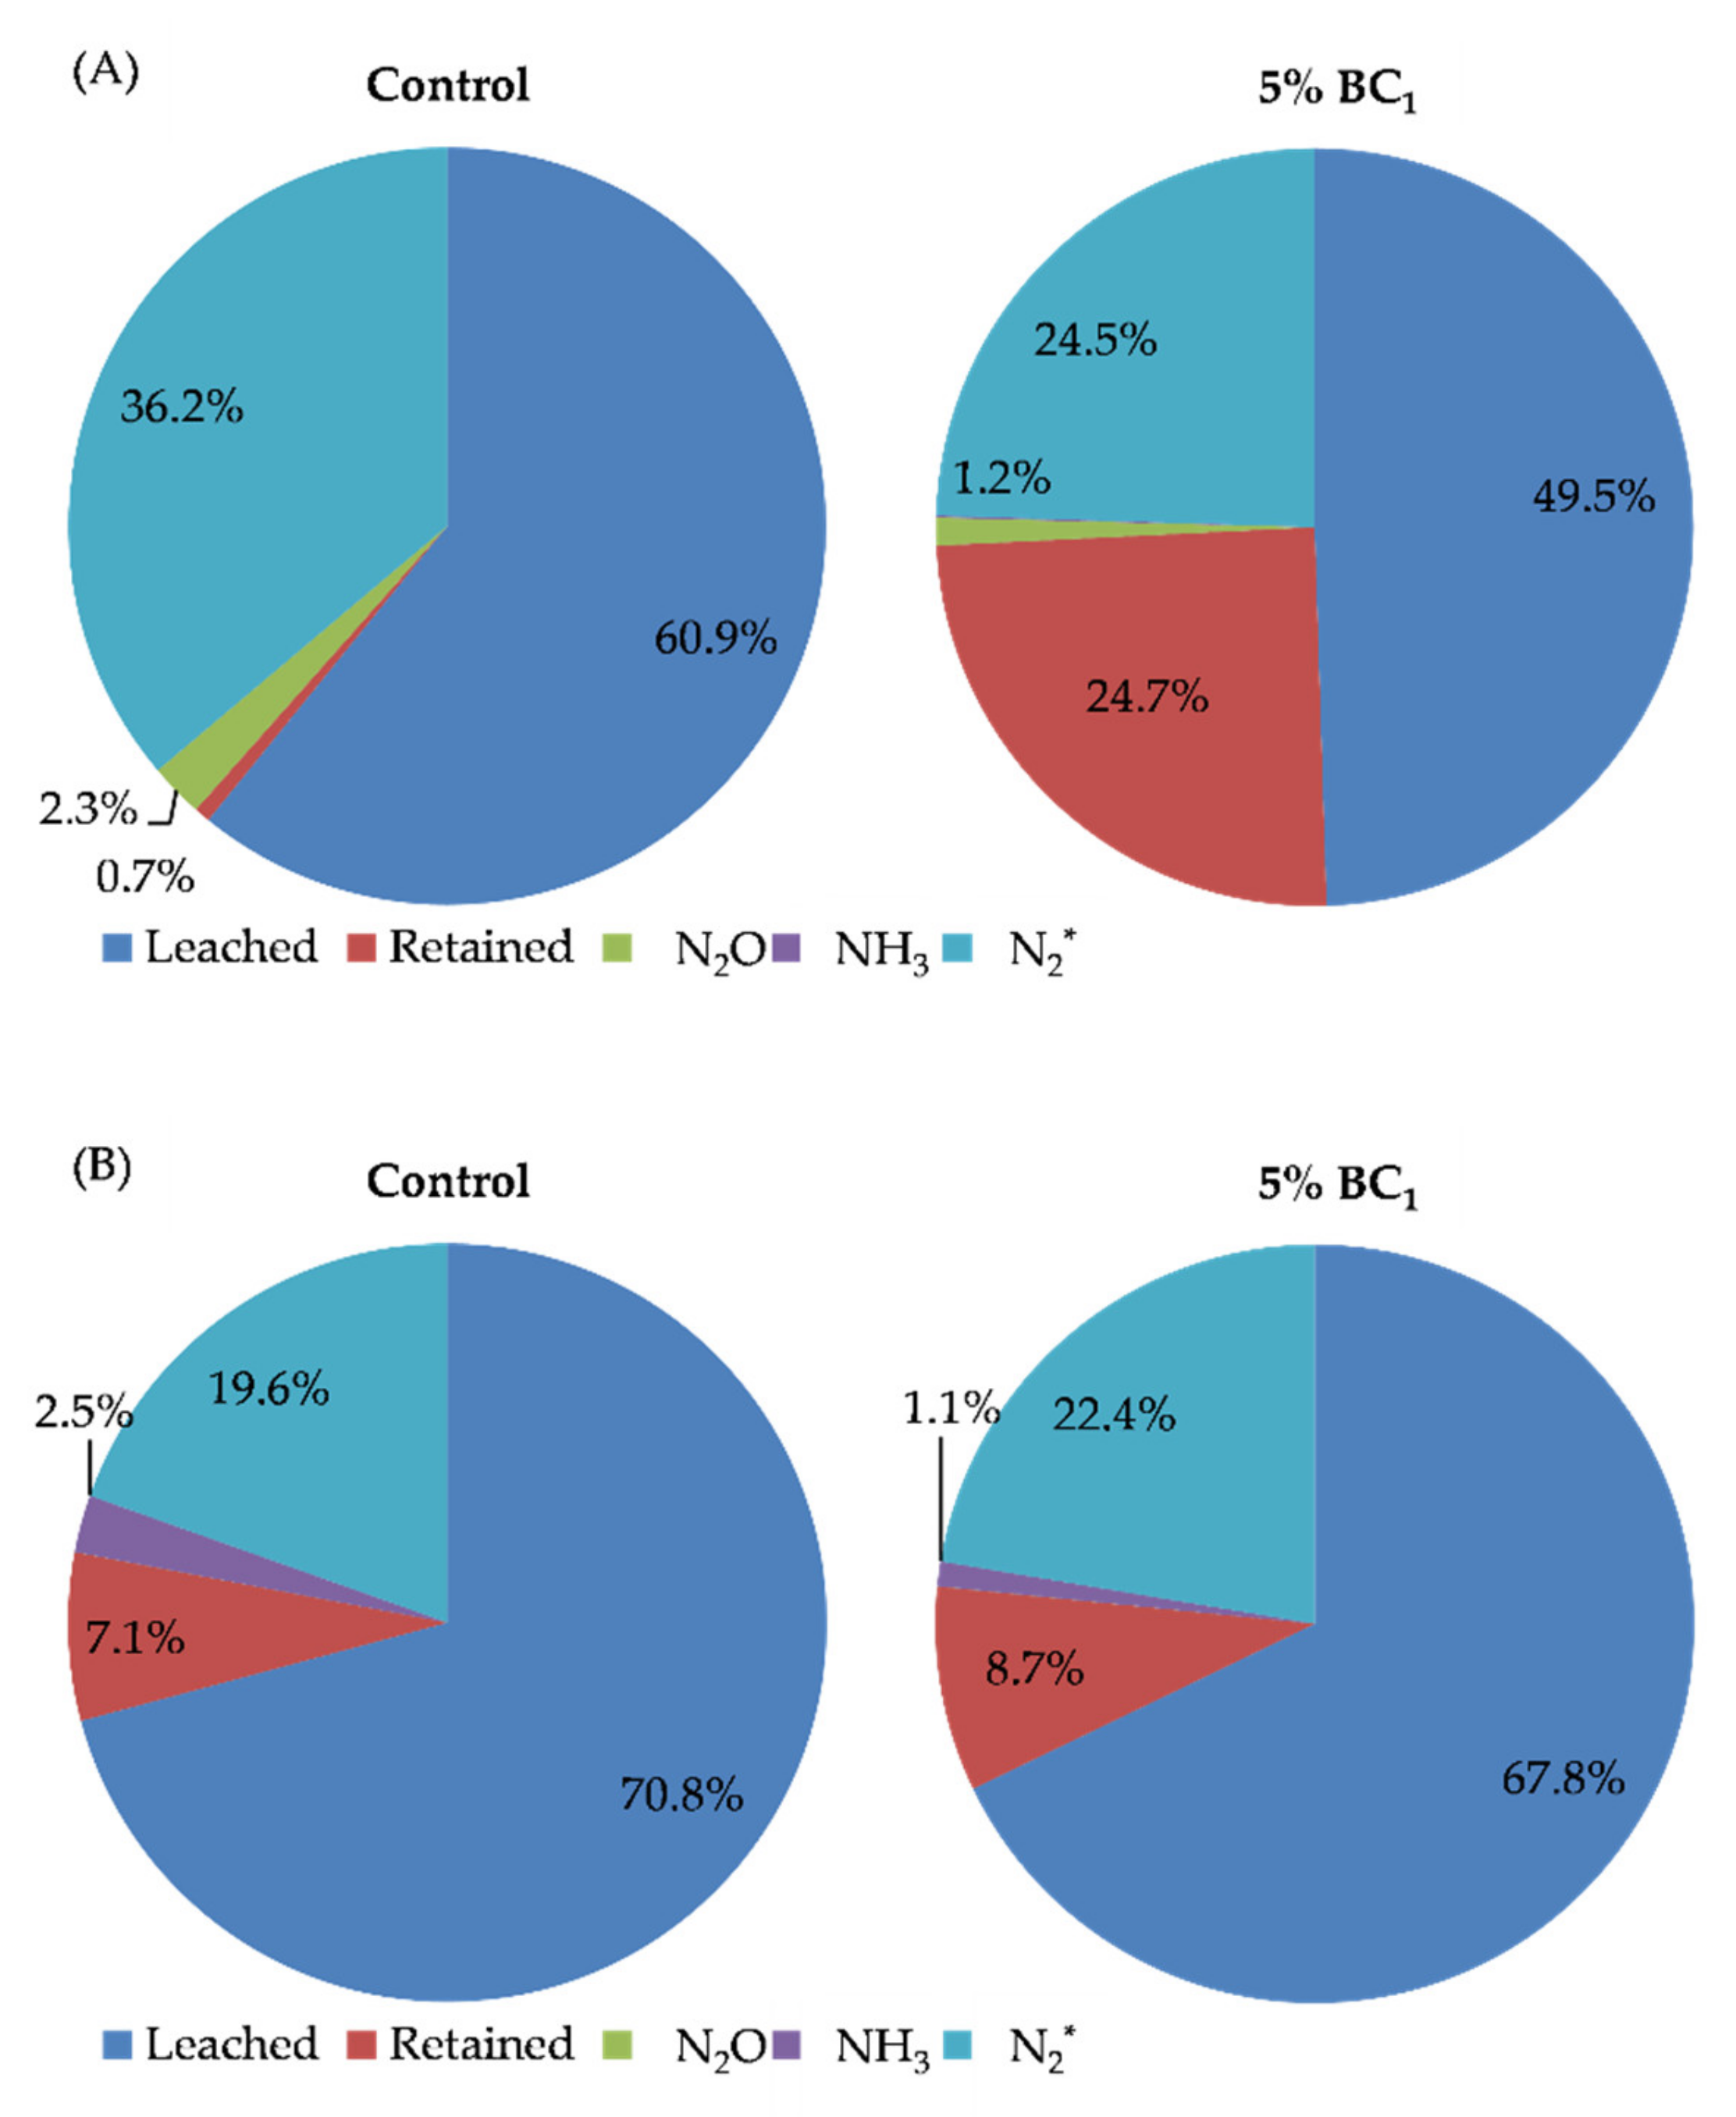
For weekly applications of ORG-N low (treatment group 1), the biochar amended columns significantly reduced cumulative TN leaching by 15.8% and NO3-N leaching by 16.5% compared to the control (Figure 1A and Figure S1A). Most of the leachate was in the form of NO3-N. The reduced leaching was because the biochar amendment significantly increased the TN retained in the soil (Figure 2A) where most of the N retained was ORG-N. The NO3-N bound in the soil/biochar matrix was more than double the control, but was only a small fraction of the overall TN retained (Table 2). Gaseous emission losses of NH3 was negligible, and N2O accounted for 2.3% and 1.2% of the influent TN applied for control and biochar columns (Figure 2A), respectively, and were not statistically different. For the control and biochar-amended columns 36.2% and 24.5% of the total N applied was calculated to be lost as N emissions other than NH3 or N2O (Figure 2A).
For ORG-N high applications (treatment group 2), that were designed to be similar to manure concentrations, there was no significant difference between the two treatments for cumulative TN leaching (Figure 1B). The soil TN increased for both treatments, primarily in the form of NH4+-N and ORG-N, but treatments were not significantly different (Table 2). Emissions of N2O were negligible; however cumulative NH3 emissions accounted for 2.5% and 1.1% of the influent TN for the control and biochar columns, respectively (Figure 2B). Total influent N lost as emissions other than N2O or NH3 for control and biochar columns was 19.6% and 22.4%, respectively (Figure 2B).

3.2. Ammonium Applications (Treatment Groups 3 and 4)

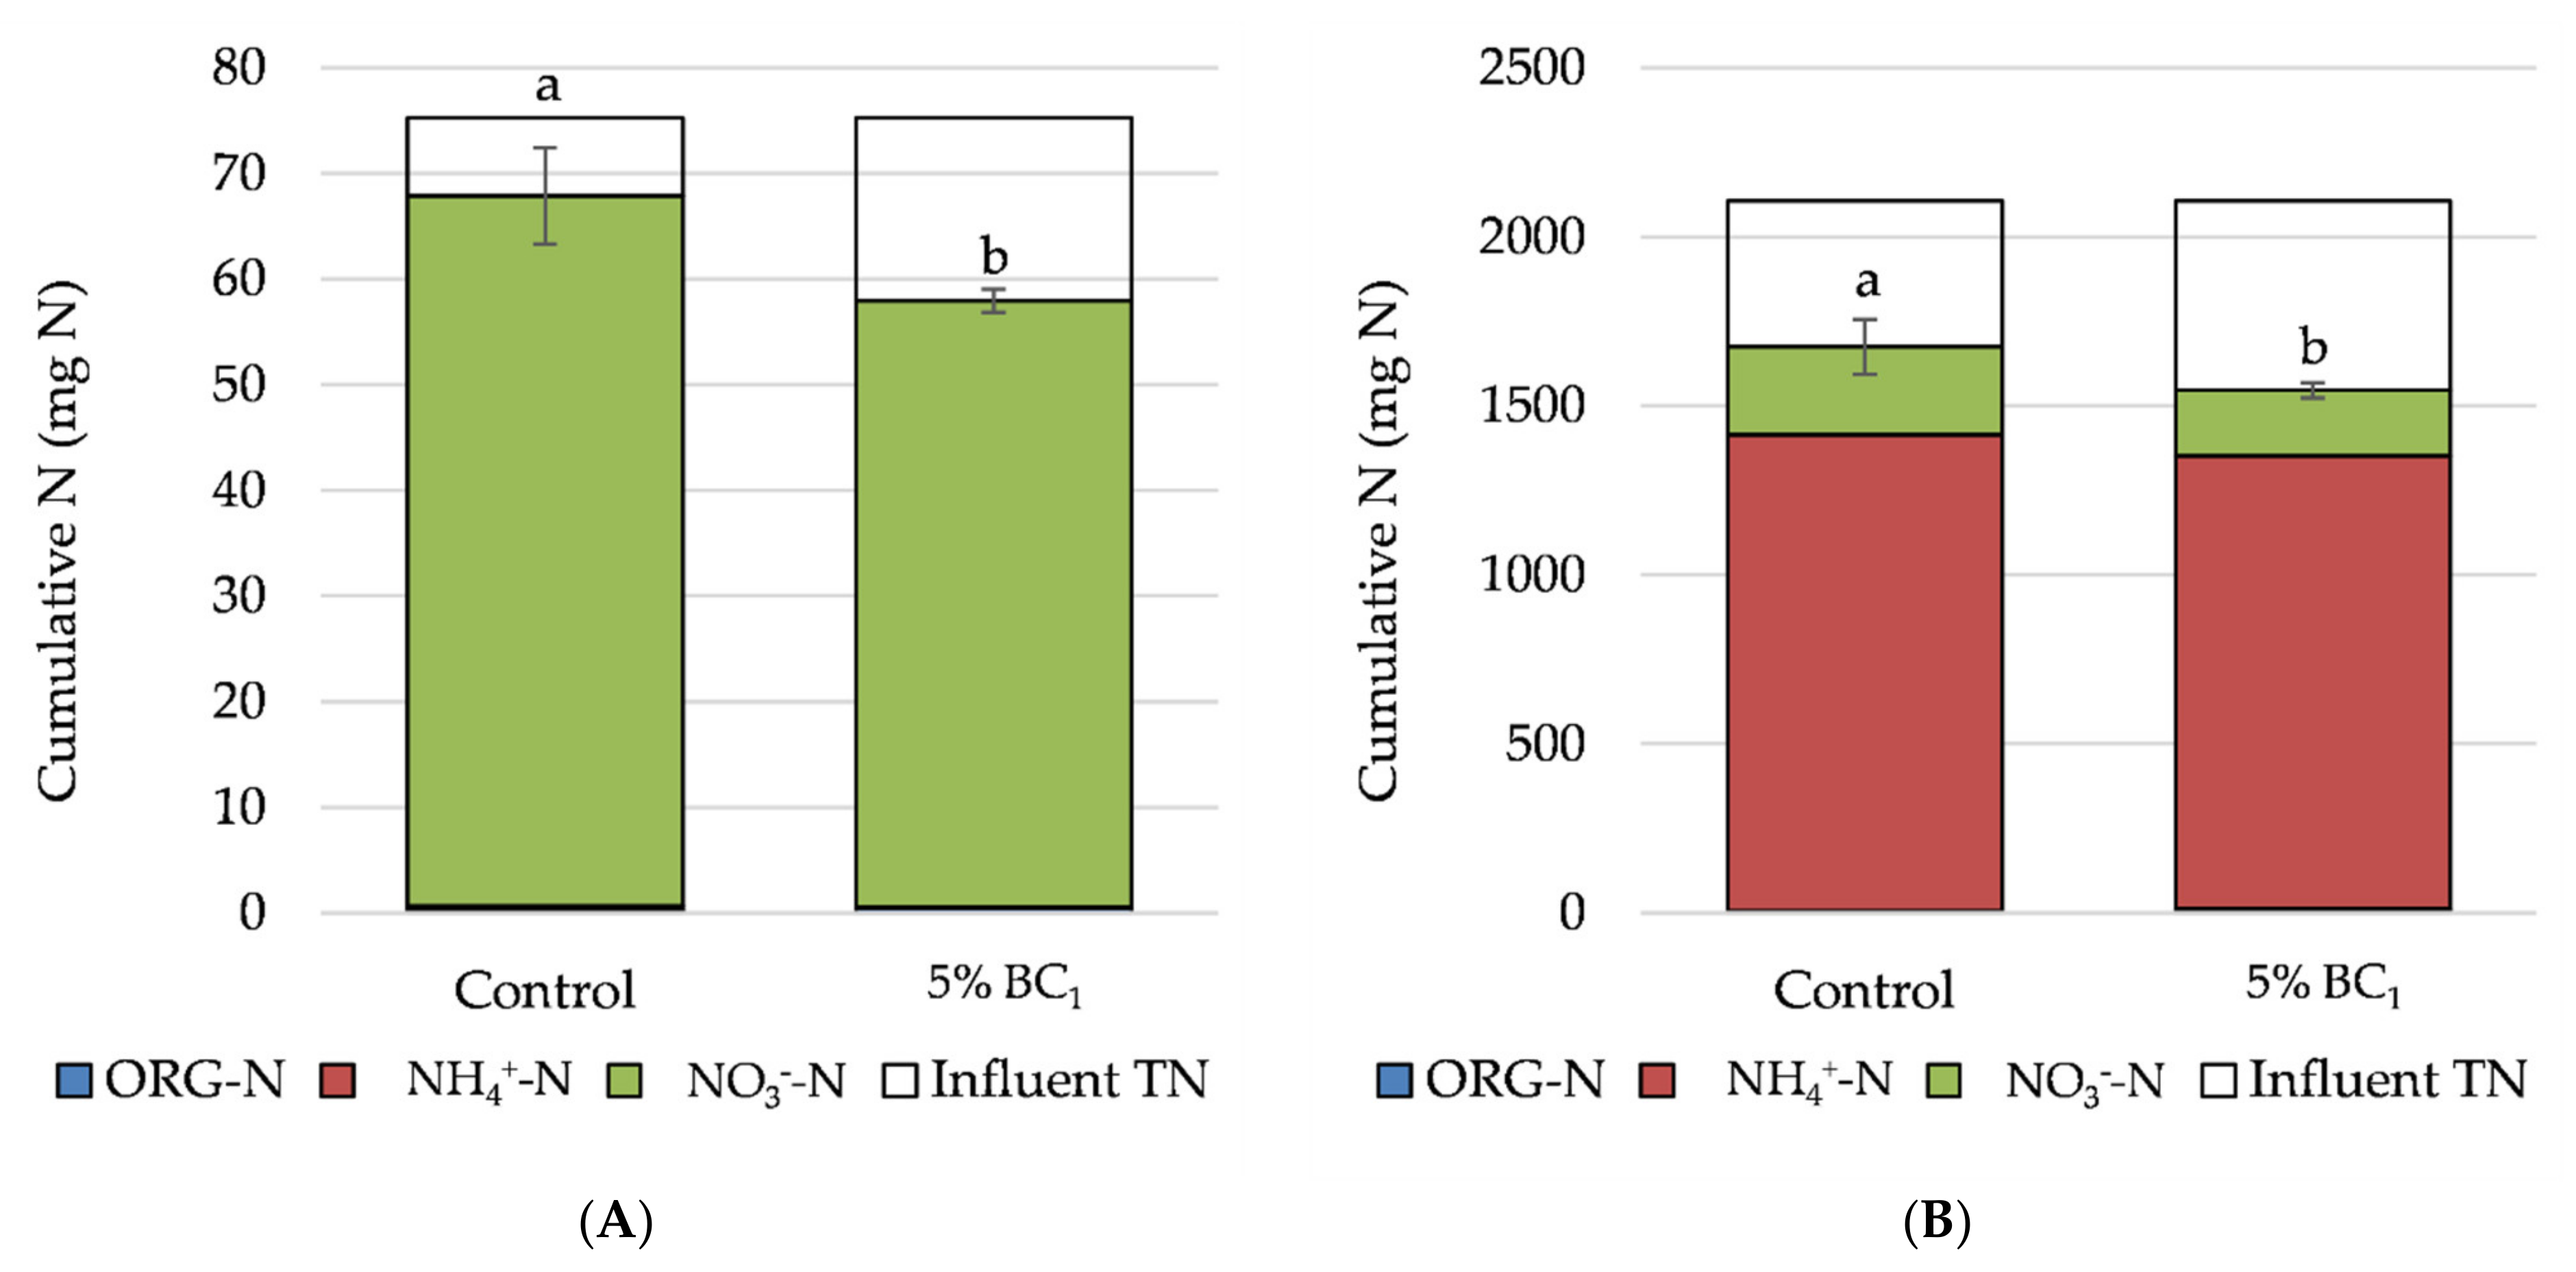
Following weekly applications of NH4+-N low application (treatment group 3), that were designed to be similar to silage bunker runoff N concentrations, cumulative TN in leachate was significantly lower for the biochar amended columns (Figure 3A). Most of the leachate was in the form of NO3-N. Biochar amendment significantly reduced NO3-N leaching by 14.6% compared to the control (Figure S1B). Biochar amendment resulted in a significant increase in soil TN retention (Figure 4A). BC1 amended soils had significantly greater NO3-N retention than the control soil (Table 2). Emissions as N2O accounted for 1.7% and 2.0% of the losses of the influent TN applied for control and biochar columns (Figure 4A). Nitrogen calculated to be lost as emissions other than N2O or NH3 for control and biochar columns was 11.9% and 10.4%, respectively.
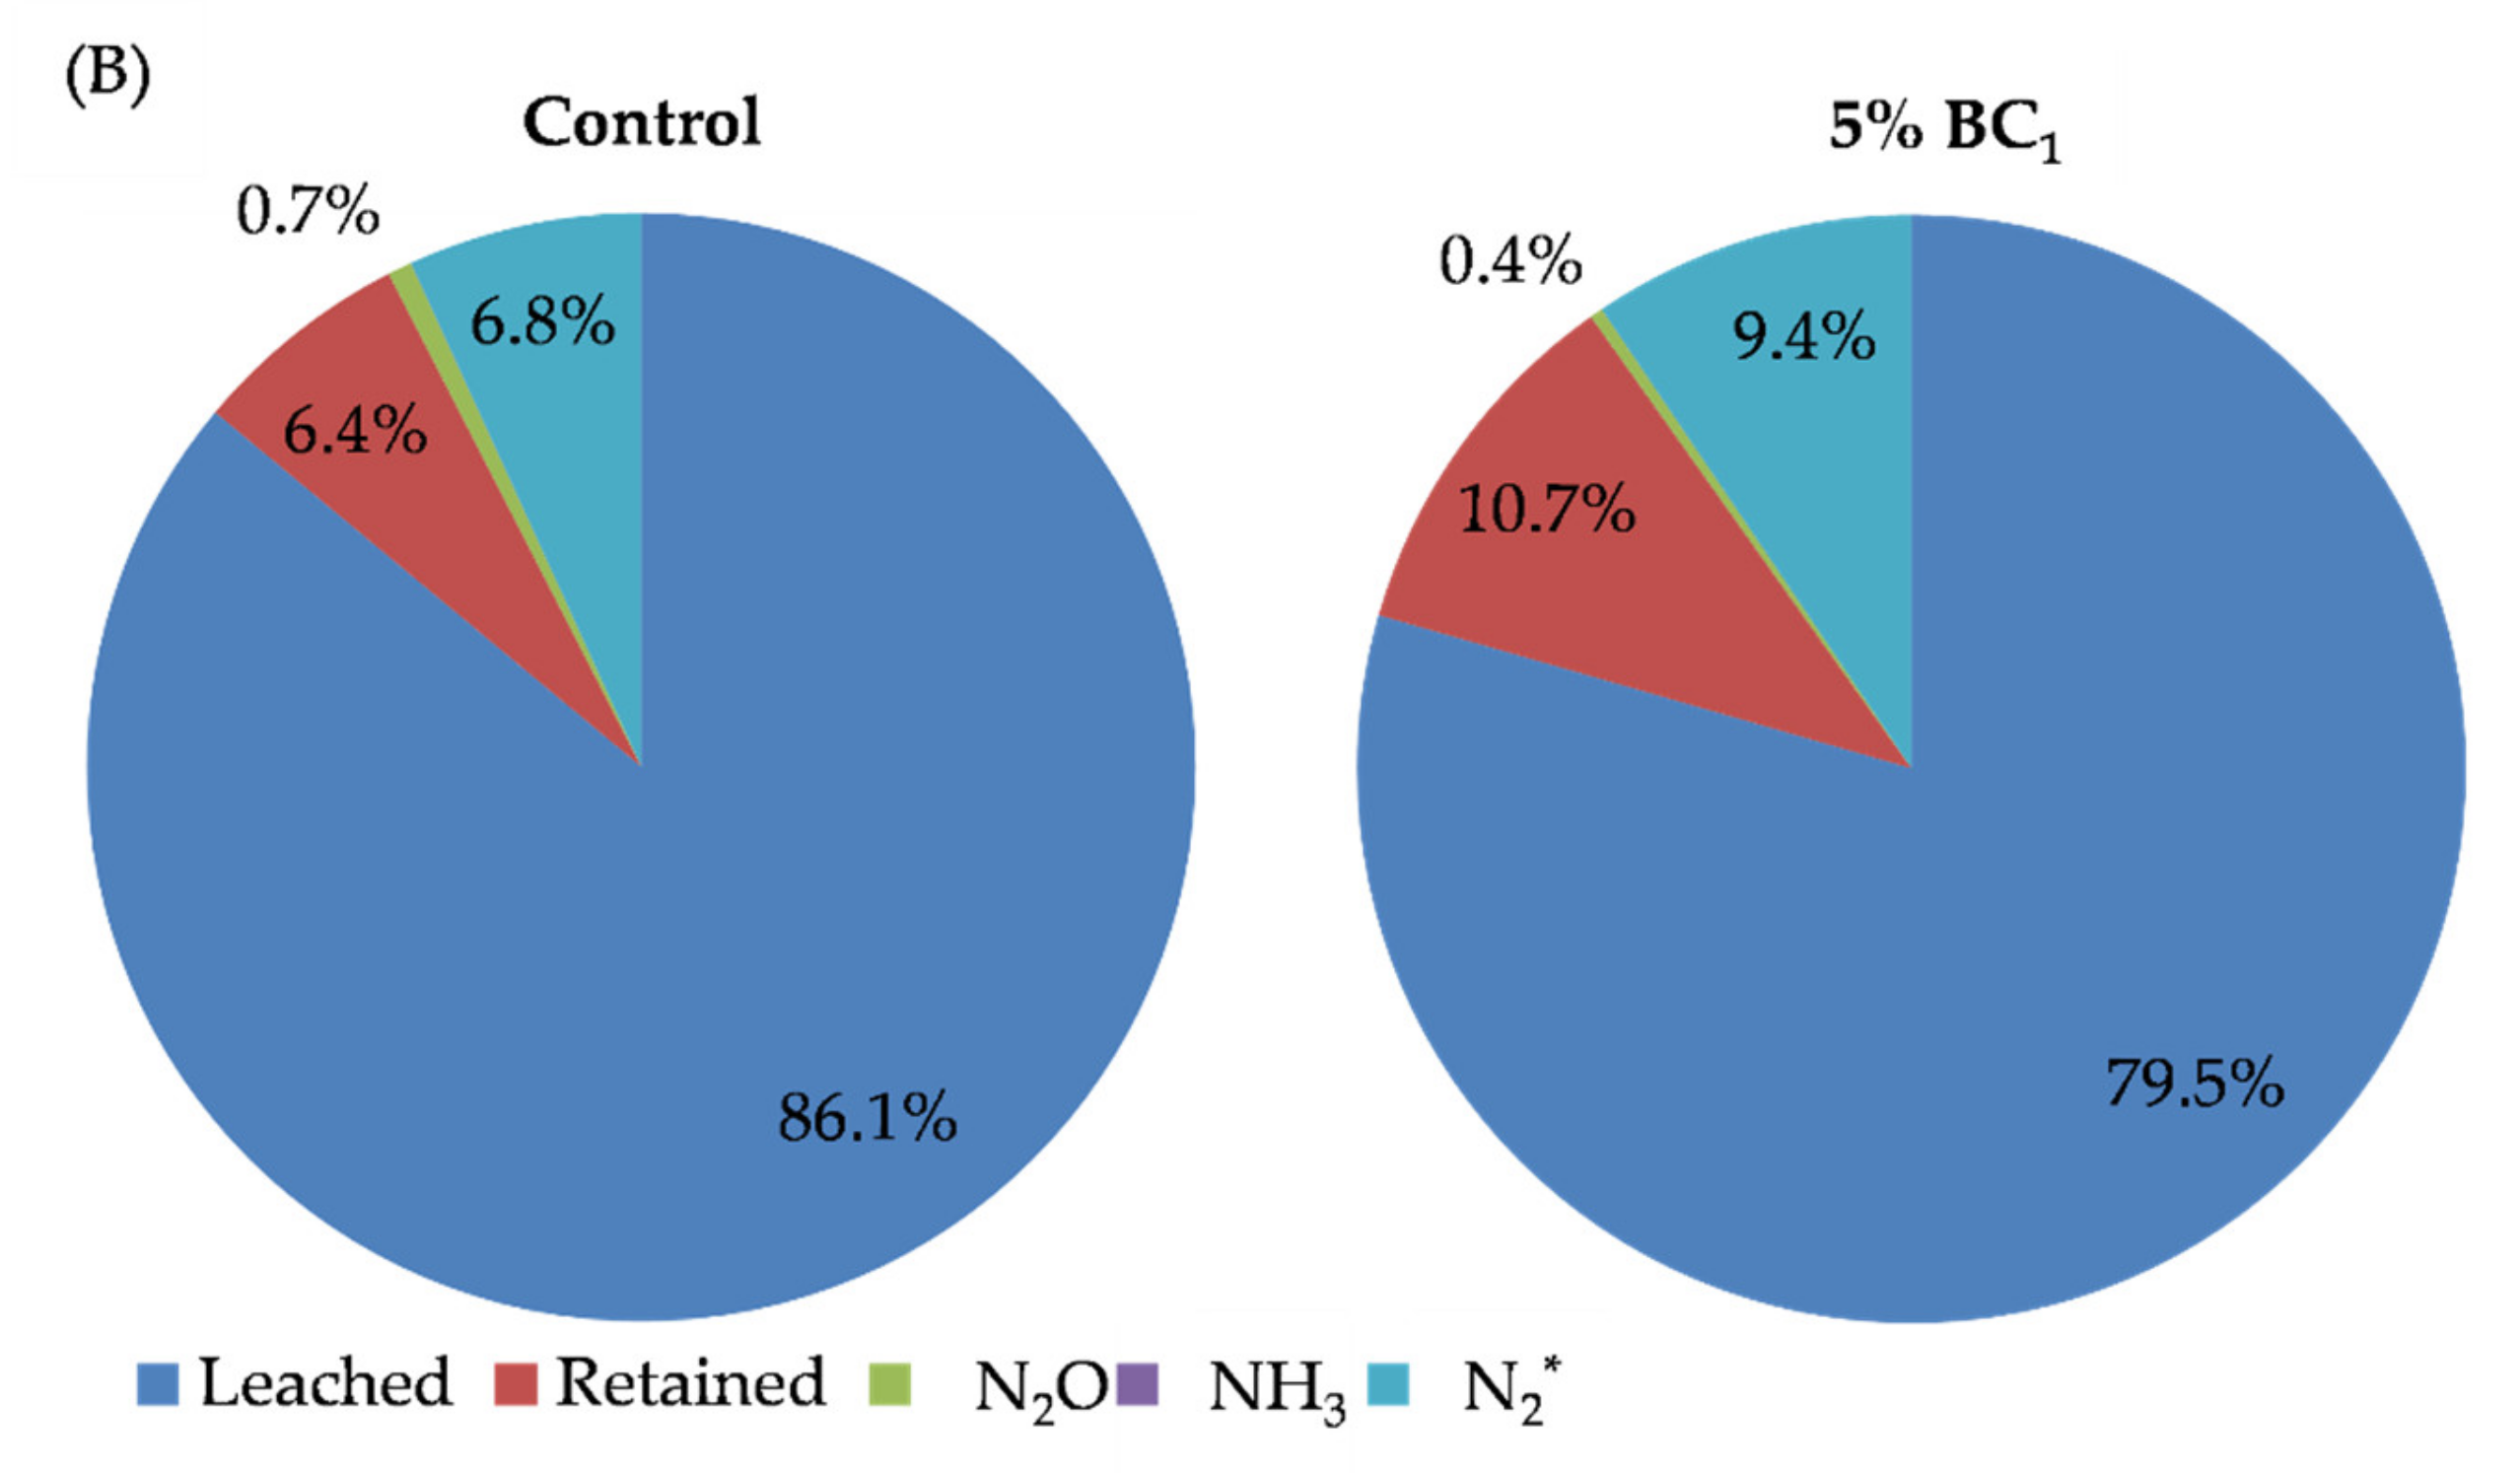
Following NH4+-N high application (treatment group 4), designed to be similar to manure land applications, biochar columns significantly decreased TN leaching compared to the control (Figure 3B). There was not a significant difference between TAN in leachate between treatments. Biochar columns reduced NO3-N leaching significantly by 25% (Figure S1C). Biochar amendment significantly increased the TN retained in the soil compared to the control (Figure 4B). There was not a significant difference in soil NH4+-N retention between treatments, but biochar amended soils significantly increased the retention of NO3-N and reduced the loss of the ORG-N originally contained within the soil (Table 2). Emissions from the columns as NH3 were negligible. N2O emissions accounted for 0.7% and 0.4% of the cumulative influent N for control and biochar columns, respectively. Based on the TN applied to the columns over the study, N lost as emissions other than N2O and NH3 was calculated to be 6.8% and 9.4% for control and biochar columns, respectively.

3.3. Nitrate Application (Treament Group 5)

For columns receiving weekly applications of NO3-N (treatment group 5), BC2 and BC3 reduced the NO3-N leaching by 24.8% and 8.8% compared to the control column, respectively. There was no significant difference between control and BC1 (Figure 5A). The soil NO3-N concentrations significantly increased for BC2 compared to other treatments (Table 2), and the mass retained accounted for the entire difference between N leached through BC2 verses the influent. For BC2, 7.9% of the total influent N applied was lost as N emission other than NH3 and N2O. All biochar treatments significantly reduced N2O emissions compared to control columns, but there was no significant difference between biochar treatments (Figure 5B).

3.4. Changes in Biochar Characteristics

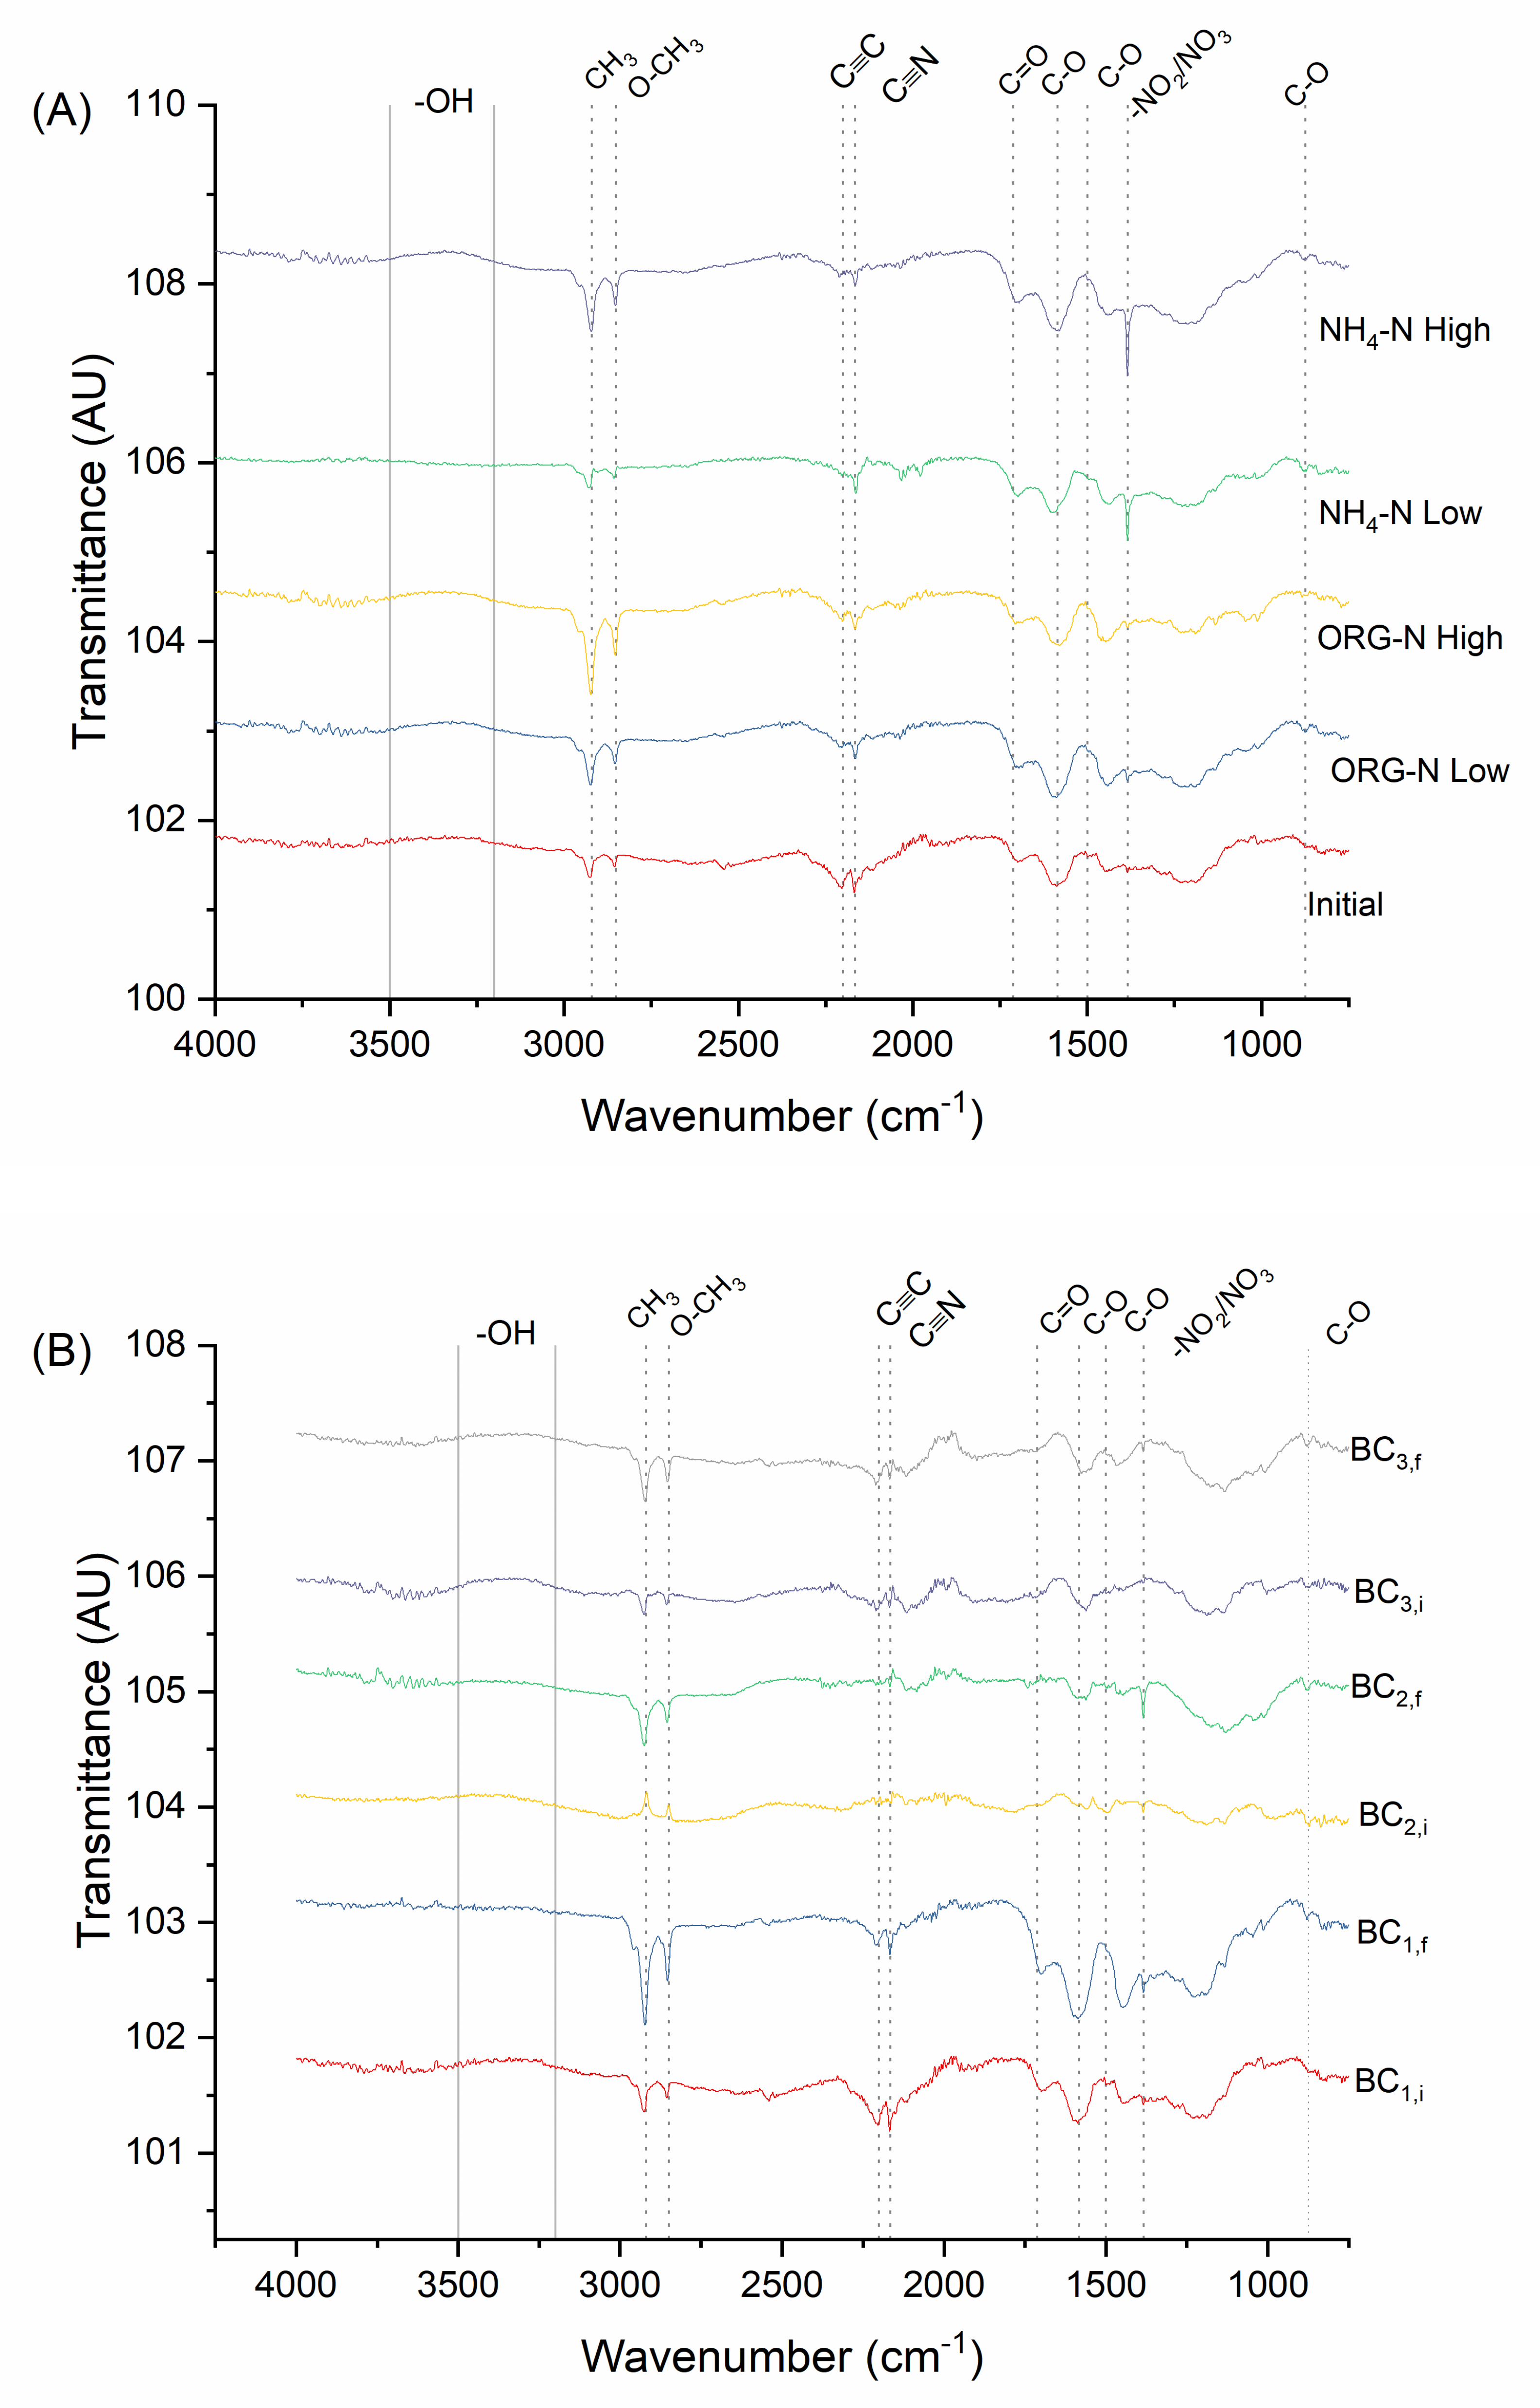
The FTIR spectra measured an increase in oxygenated functional groups on the biochar surface following applications of all N forms (Figure 6). The small shoulder present in all spectra between 3500 and 3200 cm−1 is indicative of hydroxyl bands (-OH) associated with carboxylic acids, alcohols or phenols [29,59,60,61]. Peaks at 2850 cm−1 is indicative of addition of methoxyl (O-CH3) to biochar. Carboxylic groups are represented by 2850, 1712, and 1437 cm−1 [60,62]. Carbonates are represented at 1436 and 875 cm−1 [63]. Carbonyl groups (C=O) are represented at 2150 and 1580 cm−1 [59,61]. Increase in phenolic groups are represented by peak increases at 1262 and 1380 cm−1 [62]. Small peaks at 2165 and 1384 cm−1 indicate N on the biochar. A small peak for triple bonded N at 2165 cm−1 is observed [64]. Nitrite bound to the biochar can be observed at 1384 cm−1 [64,65,66].
The XPS data confirmed chemical changes to biochar following soil amendment and application of N solutions. High resolution C 1s scan found a decrease in C-C and C-H bounds and an increase in oxygenated functional groups (Table 3 and Table S3). Oxygen content was roughly 1.5 times higher for all treatments following soil amendment. Additionally, other major elements including aluminum (Al), calcium (Ca), iron (Fe), magnesium (Mg), silicon (Si), and tin (Sn) were detected on the biochar surface following soil amendment.

4. Discussion

Biochar application (BC1) had a significant reduction on N leaching for all treatments compared to the control, except for the ORG-N high (treatment group 2) and NO3-N application. For BC1 amended columns with ORG- N low application (treatment group 1) TN leaching was reduced by 18.7% compared to control columns. Almost all effluent (greater than 95%) was in the form of NO3-N, resulting in 58.7% and 47.3% of the influent TN leaching through the control and BC1 columns as NO3-N, respectively, suggesting that a majority of the influent N underwent mineralization and/or nitrification. Similarly, in Xu et al. [9], where urea was applied at 250 kg N ha−1 to soil amended with biochar made from corn straw, the cumulative TN leaching was reduced up to 20% by biochar amended soils compared to controls, and more than 90% of the effluent was in the form of NO3-N. At lower application rates of ORG-N, biochar is able to reduce the NO3-N lost as leachate. Weekly TN reduction efficiency averaged 17 ± 5% through the ten weeks where removal performance did not change over time. This suggests that low-temperature biochar amendment could effectively be implemented into agricultural treatment systems receiving regular application doses of ORG-N, similar to silage bunker pad runoff, to reduce N leaching to groundwater sources. When higher ORG-N applications were applied almost all of the leached N remained in the form of ORG-N, where 71.0% and 68.2% of the influent from control and biochar columns was lost as ORG-N in the effluent. In past manure leaching studies reductions in TN leaching up to 60% were measured with additions of biochar [11,12]. In this study, the applications of N at manure concentrations were applied repeatedly, resulting in much higher N applications than other studies. It is hypothesized that this likely reduced the mineralization to inorganic N forms due to an imbalance of the C to N ratio as no additional C sources were applied. This may also suggests that the C added via biochar is not bioavailable in the soil in this timeframe.
At lower NH4+-N application concentrations (treatment group 3) TN leaching was reduced by 14.6% for biochar amended columns compared to control columns. As with the ORG-N applications, a majority of the leachate was in the form of NO3-N (99%), suggesting a majority of the influent N underwent nitrification. Weekly repeated applications of NH4+-N were consistent in TN retention similar to the ORG-N column, where the NH4+-N low columns averaged a 13 ± 5% reduction of TN leaching from the control over the ten weeks of application. For NH4+-N high application rate (treatment group 4), TN leaching was significantly reduced by 8% when biochar was amended to the soil. Unlike the lower application rate, the effluent was a mix of both NH4+-N (84%–87%) and NO3-N (13%–15%), which could be due to the imbalance of C to N in the soil. Other studies that have applied synthetic NH4+-N fertilizers to biochar amended soils at high application rates have found NH4+-N to make up a majority of the effluent TN [67].
In the columns receiving ORG-N and NH4+-N applications (treatment groups 1 through 4), soil N retention is the primary mechanism for reducing N leaching in biochar amended soils. In all cases where N leaching was significantly reduced, the change in TN retained in the soil was significantly higher for those amended with BC1. Many studies have theorized that biochar primarily retains N though binding of NH4+ due to the increased CEC content [28,68]. However, in this study there was no significant difference in soil NH4+-N content between biochar and control columns for any of the applications. Similar results have been observed in field studies performing soil extractions following amendment, which have found that NO3-N was more abundant than NH4+-N [16,18,19,20,29,30]. While there was a significant increase in soil NO3-N between treatments when N leaching was reduced, the binding of NO3-N in the soil did not account for the majority of the difference in leached N between control and biochar columns. The retention of ORG-N within the columns accounted for most of the difference in the N leaching suggesting it is the primary mechanism for leaching reduction. For columns receiving low ORG-N applications (treatment group 1), the BC1 amended columns had a significantly higher change in soil ORG-N following applications, which accounted for most of the difference in N leaching between control and biochar columns. For the columns receiving NH4+-N applications (treatment groups 3 and 4), NO3-N binding played the major role in retaining N within the column, but the biochar columns also retained more of the ORG-N originally in the soil. Thus, biochar may have inhibited some of the soils original ORG-N from undergoing mineralization.
Biochar increased retention of NO3-N in the all columns receiving ORG-N and NH4+-N applications even though biochar has been reported to have a low sorption capacity for NO3-N [31,34]. Biochar is known to undergo changes when aged in soil or composted [29,30]. Biochar properties, such as oxidation, are altered following amendment to soil that results in NO3-N binding. The FTIR spectra in this study measured an increase in peaks related to oxygenated functional groups (Figure 6). The XPS data also measured an increase in oxygenated functional groups on the biochar surface and an increase in positively-charged minerals (particularly Al, Ca, Fe, Mg, Si, and Sn) bound to the biochar surface (Table 2). The increase in minerals and oxygenated functional groups may have resulted in cationic bridging between NO3-N and biochar, as previously suggested [36]. However, changes in oxygenated functional groups and minerals were similar to results observed in Joseph et al. [29], which concluded that the formation of an organomineral layer on biochar surface resulted in the uptake of NO3-N. In that study, the formation of the organomineral layer occurred on biochar that underwent composting after six weeks, thus it is plausible that the formation of organomineral layer in this ten-week study could have occurred. It is likely that both these processes are contributing to the increase in NO3-N retention.
The enhanced retention of ORG-N within the soil columns amended with biochar may be the result of similar mechanisms of NO3-N. Sorption of ORG-N to biochar has not been studied extensively, but studies have identified biochar as being able to bind dissolved organic C. Chun et al. [62] observed that biochar could adsorb organic contaminates and linked the uptake to surface functional groups present on the biochar, with higher content of carboxyl groups increasing uptake. Güereña et al. [17] observed biochar amended soil in a field study had higher dissolved ORG-N content and suggested that the same surface functional mechanism that bound organic contaminates in Chun et al. [62] likely increase biochar uptake of ORG-N.
The reduction in N leaching following applications similar to silage bunker runoff are promising for future implementation into treatment systems. These systems have been reported to result in high leachate concentrations of NO3 [44,45], thus a 16.5% (treatment group 1) or 14.6% (treatment group 3) reduction could have a significant impact on NO3 leaching through treatment systems. However, it is important to note that this study was conducted in a laboratory setting, thus conditions were different than actual field conditions. Climate, soil texture, and influent runoff all could have impacts on treatment performance in the field, thus future studies should further evaluate biochar amendment to these treatment systems receiving N-rich silage bunker runoff.
Based on the findings from the ORG-N and NH4+-N application columns it would be expected that biochar would reduce N leaching when receiving NO3-N. However, BC1 did not significantly reduce leaching compared to control as it did in the other trials. A potential explanation may be due to retention time required for NO3-N binding to biochar exchange sites. Past studies have indicated that significant retention time (>1 hr) is required to bind NO3-N to oxidized biochar [36]. In the ORG-N and NH4+-N columns it is likely that the soils natural exchange sites retained a portion of influent ORG-N and NH4+-N, and between application events N underwent mineralization and nitrification. Therefore, between applications the NO3-N had sufficient time to bind to the biochar exchange sites. When comparing the difference between control and biochar amended columns by week, none of the columns resulted in significant difference in NO3-N leaching between treatments until week two (Figure S1), supporting this theory. However, in the NO3-N application events, because NO3-N is known to be highly mobile in soil, it is possible that the NO3-N was flushed out during application, resulting in little N remaining to undergo binding between application events. However, higher temperature produced biochar, BC2, did result in a significant reduction in N leaching by 24.8% compared to control. Other studies have found that biochar produced at high temperatures can bind NO3-N due to the higher surface area of the biochar [34]. However, other studies have suggested enhancement of functional groups may result in greater binding of high temperature biochar [6,31]. The XPS data measured a greater abundance of oxygenated functional groups of higher temperature biochar (Table S3), which is likely to have increased sorption of NO3-N in BC2 columns. To enhance retention of NO3-N, it was hypothesized that pre-oxidized biochar (BC3) would result in a higher retention [36]. However, similar to Mia et al. [67], BC3 did not result did not significantly enhance the soil retention of NO3-N, suggesting that chemical oxidation prior to soil amendment may not be a substitute to chemical change occurring in the soil, or the dominant process may be the development of an organomineral layer.
There were no significant differences in measured N emissions from columns, with the exception of the NO3-N application, which resulted in lower N2O emissions from soil columns amended with biochar (Figure 5B). This suggest that biochar may aid in mitigating greenhouse gas emissions from agricultural treatment systems. Since BC1 biochar did not result in significant soil retention of NO3-N but did reduce N2O emissions, it is likely that immobilization of NO3-N is not the primary mechanisms for emission reductions. Emissions of N2O are correlated to pH, and biochar may have resulted in buffering the soil to reduce the production of N2O. However, soil pH was not significantly different with biochar amendment in this study (Table S4). Biochar may have impacted microbial communities as suggested in past studies which found increases in microbial gene abundance of nosZ with biochar amendment [13,14].

5. Conclusions

Amendment of biochar to a sandy loam soil significantly reduced the leaching of N when receiving repeated applications with N concentrations similar to farmstead runoff. Soil analysis indicated that biochar impacted N leaching through enhanced soil retention of both ORG-N and NO3-N. Surface chemistry analysis indicated that biochar, following soil amendment, had an increase in oxygenated functional groups and cationic minerals on the biochar surface increasing soil retention of ORG-N and NO3-N through cationic bridging or the development of an organomineral layer on the biochar surface. The repeated application of N over the course of ten weeks did not impact biochar N leaching reduction performance, although it is likely that a maximum reduction potential would be reached. However, to effectively reduce N leaching from direct application of NO3-N, only high temperature production biochars at 700 °C resulted in a significant reduction in N leaching of 24.8%. However, it is important to note that this was a short-term laboratory study, which varies greatly from field conditions. Thus, before widespread implementation, future fields studies are necessary to confirm performance under field conditions. Natural oxidation and development of organomineral layers were more effective in retaining applied NO3-N than those oxidized prior to soil amendment, which may indicate organomineral layer development may be more important or natural oxidation processes are more effective at developing conditions that can bind NO3-N, but more investigation is needed to assess this.

Supplementary Materials

The following are available online at https://www.mdpi.com/2073-4395/10/7/979/s1, Table S1: Biochar production temperature, treatments, elemental content, and pH; Table S2: Water quality analysis parameters, EPA approved method, and detection limits; Table S3: XPS scan of major elements and carbon functional groups on the surface of biochar before and after soil amendment for columns receiving NO3-N low and high application rates; Figure S1: Weekly cumulative NO3-N effluent for (A) ORG-N low, (B) NH4+-N low, and (C) NH4+-N high application; Table S4: Soil pH following application for treatments.

Author Contributions

J.R.S. contributed to the methodology, conceptualization, laboratory analysis, completed the formal analysis and writing of the original draft preparation. R.A.L. contributed to the conceptualization, methodology, writing—review and editing, supervision, project administration, and funding acquisition. All authors have read and agreed to the published version of the manuscript.

Funding

This material is based upon work that is supported by the National Institute of Food and Agriculture, U.S. Department of Agriculture under project numbers 2015-67019-23573 and 2017-67003-26055. Any opinions, findings, conclusions, or recommendations expressed in this publication are those of the author(s) and do not necessarily reflect the view of the U.S. Department of Agriculture.

Acknowledgments

The author gratefully acknowledges the use of facilities and instruments supported by NSF [DMR–1720415] through the University of Wisconsin-Madison Materials Research Science and Engineering Center.

Conflicts of Interest

The authors declare no conflict of interest.

References

  1. Chia, C.; Downie, A.; Munroe, P. Characteristics of biochar: Physical and structural properties. In Biochar for Environmental Management: Science, Technology, and Implementation; Lehmann, J., Joseph, S., Eds.; Routledge: New York, NY, USA, 2015; pp. 89–109. [Google Scholar]
  2. Ippolito, J.A.; Spoka, K.A.; Novak, J.M.; Lentz, R.D.; Cantrell, K.B. Biochar elemental composition and factors influencing nutrient retention. In Biochar for Environmental Management: Science, Technology, and Implementation; Lehmann, J., Joseph, S., Eds.; Routledge: New York, NY, USA, 2015; pp. 139–163. [Google Scholar]
  3. Lehmann, J.; Joseph, S. Biochar for environmental management: An introduction. In Biochar for Environmental Management: Science, Technology, and Implementation; Lehmann, J., Joseph, S., Eds.; Routledge: New York, NY, USA, 2015; pp. 1–14. [Google Scholar]
  4. Ahmed, R.; Li, Y.; Mao, L.; Xu, C.; Lin, W.; Ahmed, S.; Ahmed, W. Biochar Effects on Mineral Nitrogen Leaching, Moisture Content, and Evapotranspiration after 15N Urea Fertilization for Vegetable Crop. Agronomy 2019, 9, 331. [Google Scholar] [CrossRef] [Green Version]
  5. Ding, Y.; Liu, Y.-X.; Wu, W.; Shi, D.; Yang, M.; Zhong, Z.-K. Evaluation of Biochar Effects on Nitrogen Retention and Leaching in Multi-Layered Soil Columns. Water Air Soil Pollut. 2010, 213, 47–55. [Google Scholar] [CrossRef]
  6. Kameyama, K.; Miyamoto, T.; Shiono, T.; Shinogi, Y. Influence of Sugarcane Bagasse-derived Biochar Application on Nitrate Leaching in Calcaric Dark Red Soil. J. Environ. Qual. 2012, 41, 1131–1137. [Google Scholar] [CrossRef] [PubMed]
  7. Li, S.; Zhang, Y.; Yan, W.; Shangguan, Z. Effect of biochar application method on nitrogen leaching and hydraulic conductivity in a silty clay soil. Soil Tillage Res. 2018, 183, 100–108. [Google Scholar] [CrossRef]
  8. Uzoma, K.C.; Inoue, M.; Andry, H.; Zahoor, A.; Nishihara, E. Influence of biochar application on sandy soil hydraulic properties and nutrient retention. J. Food Agric. Environ. 2011, 9, 1137–1143. [Google Scholar]
  9. Xu, N.; Tan, G.; Wang, H.; Gai, X. Effect of biochar additions to soil on nitrogen leaching, microbial biomass and bacterial community structure. Eur. J. Soil Biol. 2016, 74, 1–8. [Google Scholar] [CrossRef]
  10. Yao, Y.; Gao, B.; Zhang, M.; Inyang, M.; Zimmerman, A.R. Effect of biochar amendment on sorption and leaching of nitrate, ammonium, and phosphate in a sandy soil. Chemosphere 2012, 89, 1467–1471. [Google Scholar] [CrossRef]
  11. Bradley, A.; Larson, R.A.; Runge, T. Effect of Wood Biochar in Manure-Applied Sand Columns on Leachate Quality. J. Environ. Qual. 2015, 44, 1720–1728. [Google Scholar] [CrossRef]
  12. Laird, D.A.; Fleming, P.; Wang, B.; Horton, R.; Karlen, D. Biochar impact on nutrient leaching from a Midwestern agricultural soil. Geoderma 2010, 158, 436–442. [Google Scholar] [CrossRef] [Green Version]
  13. Harter, J.; Krause, H.-M.; Schuettler, S.; Ruser, R.; Fromme, M.; Scholten, T.; Kappler, A.; Behrens, S. Linking N2O emissions from biochar-amended soil to the structure and function of the N-cycling microbial community. ISME J. 2013, 8, 660–674. [Google Scholar] [CrossRef]
  14. Harter, J.; Elhadidi, M.; Huson, D.H.; Kappler, A.; Behrens, S. Soil biochar amendment affects the diversity of nosZ transcripts: Implications for N2O formation. Sci. Rep. 2017, 7, 3338. [Google Scholar] [CrossRef] [Green Version]
  15. Bai, S.H.; Reverchon, F.; Xu, C.-Y.; Xu, Z.; Blumfield, T.; Zhao, H.-T.; Van Zwieten, L.; Wallace, H. Wood biochar increases nitrogen retention in field settings mainly through abiotic processes. Soil Biol. Biochem. 2015, 90, 232–240. [Google Scholar] [CrossRef]
  16. Cayuela, M.L.; Sánchez-Monedero, M.A.; Roig, A.; Hanley, K.; Enders, A.; Lehmann, J. Biochar and denitrification in soils: When, how much and why does biochar reduce N2O emissions? Sci. Rep. 2013, 3, srep01732. [Google Scholar] [CrossRef] [Green Version]
  17. Güereña, D.; Lehmann, J.; Hanley, K.; Enders, A.; Hyland, C.; Riha, S. Nitrogen dynamics following field application of biochar in a temperate North American maize-based production system. Plant Soil 2012, 365, 239–254. [Google Scholar] [CrossRef]
  18. Martin, S.L.; Clarke, M.L.; Othman, M.; Ramsden, S.J.; West, H.M. Biochar-mediated reductions in greenhouse gas emissions from soil amended with anaerobic digestates. Biomass Bioenergy 2015, 79, 39–49. [Google Scholar] [CrossRef]
  19. Sanford, J.; Larson, R.A. Treatment of horizontal silage bunker runoff using biochar amended vegetative filter strips. J. Environ. Manag. 2019, 253, 109746. [Google Scholar] [CrossRef]
  20. Van Zwieten, L.; Kimber, S.; Morris, S.; Chan, K.Y.; Downie, A.; Rust, J.; Joseph, S.; Cowie, A. Effects of biochar from slow pyrolysis of papermill waste on agronomic performance and soil fertility. Plant Soil 2009, 327, 235–246. [Google Scholar] [CrossRef]
  21. Yadav, V.; Karak, T.; Singh, S.; Singh, A.K.; Khare, P. Benefits of biochar over other organic amendments: Responses for plant productivity (Pelargonium graveolens L.) and nitrogen and phosphorus losses. Ind. Crop. Prod. 2019, 131, 96–105. [Google Scholar] [CrossRef]
  22. Rashti, M.R.; Esfandbod, M.; Phillips, I.R.; Chen, C. Rhizosphere management by biochar and leaching improved plant performance in fresh bauxite residue sand. J. Clean. Prod. 2019, 219, 66–74. [Google Scholar] [CrossRef]
  23. Lin, Y.; Munroe, P.; Joseph, S.; Henderson, R.K.; Ziolkowski, A. Water extractable organic carbon in untreated and chemical treated biochars. Chemosphere 2012, 87, 151–157. [Google Scholar] [CrossRef]
  24. Nelissen, V.; Rütting, T.; Huygens, D.; Staelens, J.; Ruysschaert, G.; Boeckx, P. Maize biochars accelerate short-term soil nitrogen dynamics in a loamy sand soil. Soil Biol. Biochem. 2012, 55, 20–27. [Google Scholar] [CrossRef]
  25. Hale, S.E.; Alling, V.; Martinsen, V.; Mulder, J.; Breedveld, G.D.; Cornélissen, G. The sorption and desorption of phosphate-P, ammonium-N and nitrate-N in cacao shell and corn cob biochars. Chemosphere 2013, 91, 1612–1619. [Google Scholar] [CrossRef]
  26. Takaya, C.; Fletcher, L.; Singh, S.; Anyikude, K.; Ross, A. Phosphate and ammonium sorption capacity of biochar and hydrochar from different wastes. Chemosphere 2016, 145, 518–527. [Google Scholar] [CrossRef]
  27. Wang, T.; Arbestain, M.C.; Hedley, M.; Bishop, P. Chemical and bioassay characterisation of nitrogen availability in biochar produced from dairy manure and biosolids. Org. Geochem. 2012, 51, 45–54. [Google Scholar] [CrossRef]
  28. Taghizadeh-Toosi, A.; Clough, T.J.; Sherlock, R.R.; Condron, L.M. Biochar adsorbed ammonia is bioavailable. Plant Soil 2011, 350, 57–69. [Google Scholar] [CrossRef]
  29. Joseph, S.; Kammann, C.; Shepherd, J.; Conte, P.; Schmidt, H.-P.; Hagemann, N.; Rich, A.M.; Marjo, C.E.; Allen, J.; Munroe, P.; et al. Microstructural and associated chemical changes during the composting of a high temperature biochar: Mechanisms for nitrate, phosphate and other nutrient retention and release. Sci. Total. Environ. 2018, 618, 1210–1223. [Google Scholar] [CrossRef] [Green Version]
  30. Kammann, C.; Schmidt, H.-P.; Messerschmidt, N.; Linsel, S.; Steffens, D.; Müller, C.; Koyro, H.-W.; Conte, P.; Joseph, S.; Stephen, J. Plant growth improvement mediated by nitrate capture in co-composted biochar. Sci. Rep. 2015, 5, 11080. [Google Scholar] [CrossRef] [PubMed]
  31. Dempster, D.N.; Jones, D.L.; Murphy, D.V. Clay and biochar amendments decreased inorganic but not dissolved organic nitrogen leaching in soil. Soil Res. 2012, 50, 216–221. [Google Scholar] [CrossRef]
  32. Hollister, C.C.; Bisogni, J.J.; Lehmann, J. Ammonium, Nitrate, and Phosphate Sorption to and Solute Leaching from Biochars Prepared from Corn Stover (Zea mays L.) and Oak Wood (Quercus spp.). J. Environ. Qual. 2013, 42, 137–144. [Google Scholar] [CrossRef]
  33. Ohe, K.; Nagae, Y.; Nakamura, S.; Baba, Y. Removal of Nitrate Anion by Carbonaceous Materials Prepared from Bamboo and Coconut Shell. J. Chem. Eng. Jpn. 2003, 36, 511–515. [Google Scholar] [CrossRef]
  34. Yang, J.; Li, H.; Zhang, D.; Wu, M.; Pan, B. Limited role of biochars in nitrogen fixation through nitrate adsorption. Sci. Total Environ. 2017, 592, 758–765. [Google Scholar] [CrossRef]
  35. Haider, G.; Steffens, D.; Müller, C.; Kammann, C.I. Standard Extraction Methods May Underestimate Nitrate Stocks Captured by Field-Aged Biochar. J. Environ. Qual. 2016, 45, 1196–1204. [Google Scholar] [CrossRef] [PubMed]
  36. Sanford, J.; Larson, R.A.; Runge, T. Nitrate sorption to biochar following chemical oxidation. Sci. Total Environ. 2019, 669, 938–947. [Google Scholar] [CrossRef] [PubMed]
  37. Niu, Y.; Chen, Z.; Müller, C.; Zaman, M.M.; Kim, D.; Yu, H.; Ding, W. Yield-scaled N 2 O emissions were effectively reduced by biochar amendment of sandy loam soil under maize—Wheat rotation in the North China Plain. Atmos. Environ. 2017, 170, 58–70. [Google Scholar] [CrossRef]
  38. Senbayram, M.; Saygan, E.P.; Chen, R.; Aydemir, S.; Kaya, C.; Wu, D.; Bladogatskaya, E. Effect of biochar origin and soil type on the greenhouse gas emission and the bacterial community structure in N fertilised acidic sandy and alkaline clay soil. Sci. Total Environ. 2019, 660, 69–79. [Google Scholar] [CrossRef]
  39. Arnold, J.; Knapp, J.; Johnson, C. The use of yeasts to reduce the polluting potential of silage effluent. Water Res. 2000, 34, 3699–3708. [Google Scholar] [CrossRef]
  40. Gebrehanna, M.; Gordon, R.J.; Madani, A.; Vanderzaag, A.; Wood, J.D. Silage effluent management: A review. J. Environ. Manag. 2014, 143, 113–122. [Google Scholar] [CrossRef] [PubMed]
  41. Holly, M.A.; Larson, R.A.; Cooley, E.T.; Wunderlin, A.M. Silage storage runoff characterization: Annual nutrient loading rate and first flush analysis of bunker silos. Agric. Ecosyst. Environ. 2018, 264, 85–93. [Google Scholar] [CrossRef]
  42. Bhattarai, R.; Kalita, P.K.; Patel, M.K. Nutrient transport through a Vegetative Filter Strip with subsurface drainage. J. Environ. Manag. 2009, 90, 1868–1876. [Google Scholar] [CrossRef]
  43. Holly, M.A.; Larson, R.A. Treatment of Silage Runoff Using Vegetated Filter Strips. Trans. ASABE 2016, 59, 1645–1650. [Google Scholar] [CrossRef]
  44. Faulkner, J.W.; Zhang, W.; Geohring, L.D.; Steenhuis, T.S. Nutrient transport within three vegetative treatment areas receiving silage bunker runoff. J. Environ. Manag. 2011, 92, 587–595. [Google Scholar] [CrossRef] [PubMed]
  45. Larson, R.A.; Safferman, S.I. Field Application of Farmstead Runoff to Vegetated Filter Strips: Surface and Subsurface Water Quality Assessment. J. Environ. Qual. 2012, 41, 592–603. [Google Scholar] [CrossRef]
  46. Bouyoucos, G.J. Hydrometer method improved for making particle size analysis of soils. Agron. J. 1962, 54, 464–465. [Google Scholar] [CrossRef]
  47. Olk, D.; Fortuna, A.-M.; Honeycutt, C.W. Using Anion Chromatography-Pulsed Amperometry to Measure Amino Compounds in Dairy Manure-Amended Soils. Soil Sci. Soc. Am. J. 2008, 72, 1711–1720. [Google Scholar] [CrossRef]
  48. King, K.; Williams, M.R.; Fausey, N. Effect of crop type and season on nutrient leaching to tile drainage under a corn-soybean rotation. J. Soil Water Conserv. 2016, 71, 56–68. [Google Scholar] [CrossRef]
  49. Snoeyink, V.L.; Jenkins, D. Water Chemistry, 1st ed.; John Wiley & Sons, Inc.: Hoboken, NJ, USA, 1980; ISBN 978-0471051961. [Google Scholar]
  50. Aneja, V.; Blunden, J.; Claiborn, C.; Rogers, H. Dynamic Chamber System to Measure Gaseous Compounds Emissions and Atmospheric-Biospheric Interactions. In Environmental Simulation Chambers: Application to Atmospheric Chemical Processes; Barnes, I., Rudzinski, K., Eds.; Springer: Dordrecht, The Netherlands, 2006; Volume 62, ISBN 978-1-4020-4230-0. [Google Scholar]
  51. Parkin, T.B.; Venterea, R.T. USDA-ARS GRACEnet Project Protocols Chapter 3. Chamber-Based Trace Gas Flux Measurements. In Sampling Protocols; USDA: Washington, DC, USA, 2010; pp. 1–39. [Google Scholar]
  52. Bremner, J.M. Inorganic Forms of Nitrogen. In Methods of Soil Analysis: Part 2 Chemical and Microbiological Properties; American Society of Agronomy, Inc.: Madison, WI, USA, 1965; pp. 1179–1237. [Google Scholar]
  53. Ventura, M.; Sorrenti, G.; Panzacchi, P.; George, E.; Tonon, G. Biochar Reduces Short-Term Nitrate Leaching from A Horizon in an Apple Orchard. J. Environ. Qual. 2013, 42, 76–82. [Google Scholar] [CrossRef]
  54. Hagemann, N.; Kammann, C.I.; Schmidt, H.-P.; Kappler, A.; Behrens, S. Nitrate capture and slow release in biochar amended compost and soil. PLoS ONE 2017, 12, e0171214. [Google Scholar] [CrossRef]
  55. Walsh, J.; Sanford, J.; Larson, R.A. Evaluation of Biochar Nitrate Extraction Methods. Appl. Sci. 2019, 9, 3514. [Google Scholar] [CrossRef] [Green Version]
  56. Bremner, J.M. Total Nitrogen. In Methods for Soil Analysis, Part 2; Norman, A.G., Ed.; American Society of Agronomy: Madison, WI, USA, 1965; pp. 1149–1178. [Google Scholar]
  57. Cheng, C.-H.; Lehmann, J.; Thies, J.E.; Burton, S.D.; Engelhard, M. Oxidation of black carbon by biotic and abiotic processes. Org. Geochem. 2006, 37, 1477–1488. [Google Scholar] [CrossRef]
  58. SAS Base. SAS® 9.4 Procedures Guide: Statistical Procedures, 2nd ed.; SAS Institute Inc.: Cary, NC, USA, 2013. [Google Scholar]
  59. Hina, K.; Bishop, P.; Arbestain, M.C.; Pereira, R.C.; Maciá-Agulló, J.A.; Hindmarsh, J.; Hanly, J.A.; Macias, F.; Hedley, M.J. Producing biochars with enhanced surface activity through alkaline pretreatment of feedstocks. Soil Res. 2010, 48, 606–617. [Google Scholar] [CrossRef]
  60. Sharma, R.; Wooten, J.B.; Baliga, V.L.; Lin, X.; Chan, W.G.; Hajaligol, M.R. Characterization of chars from pyrolysis of lignin. Fuel 2004, 83, 1469–1482. [Google Scholar] [CrossRef]
  61. Wang, S.; Wang, K.; Liu, Q.; Gu, Y.; Luo, Z.; Cen, K.; Fransson, T. Comparison of the pyrolysis behavior of lignins from different tree species. Biotechnol. Adv. 2009, 27, 562–567. [Google Scholar] [CrossRef]
  62. Chun, Y.; Sheng, G.; Chiou, C.T.; Xing, B. Compositions and Sorptive Properties of Crop Residue-Derived Chars. Environ. Sci. Technol. 2004, 38, 4649–4655. [Google Scholar] [CrossRef] [PubMed]
  63. Kloss, S.; Zehetner, F.; Dellantonio, A.; Hamid, R.; Ottner, F.; Liedtke, V.; Schwanninger, M.; Gerzabek, M.H.; Soja, G. Characterization of Slow Pyrolysis Biochars: Effects of Feedstocks and Pyrolysis Temperature on Biochar Properties. J. Environ. Qual. 2012, 41, 990–1000. [Google Scholar] [CrossRef]
  64. Tang, X.; Liu, T.; Li, H.; Yang, D.; Chen, L.; Tang, X. Notably enhanced thermoelectric properties of lamellar polypyrrole by doping with-naphthalene sulfonic acid. RSC Adv. 2017, 7, 20192–20200. [Google Scholar] [CrossRef] [Green Version]
  65. Wang, L.; Feng, S.; Zhao, J.; Zheng, J.; Wang, Z.; Li, L.; Zhu, Z. A facile method to modify carbon nanotubes with nitro/amino groups. Appl. Surf. Sci. 2010, 256, 6060–6064. [Google Scholar] [CrossRef]
  66. Yang, L.; May, P.W.; Yin, L.; Smith, J.; Rosser, K.N. Ultra fine carbon nitride nanocrystals synthesized by laser ablation in liquid solution. J. Nanopart. Res. 2007, 9, 1181–1185. [Google Scholar] [CrossRef]
  67. Mia, S.; Singh, B.; Dijkstra, F.A. Chemically oxidized biochar increases ammonium−15N recovery and phosphorus uptake in a grassland. Biol. Fertil. Soils 2019, 55, 577–588. [Google Scholar] [CrossRef]
  68. Li, S.; Harris, S.; Anandhi, A.; Chen, G. Predicting biochar properties and functions based on feedstock and pyrolysis temperature: A review and data syntheses. J. Clean. Prod. 2019, 215, 890–902. [Google Scholar] [CrossRef]
Figure 1. Cumulative mass of influent and effluent nitrogen (N) (mg N) for control and biochar columns receiving (A) organic nitrogen (ORG-N) low (treatment group 1) and (B) ORG-N high (treatment group 2) application rates. Entire bar (with no fill) represents influent total nitrogen (TN), where entire solid bar represents effluent TN. Individual N species in the effluent are denoted based on color (blue, red, or green). Error bars represent standard deviation of effluent TN between triplicate columns for treatment. Letters signify statistically significant difference between treatments.
Agronomy 10 00979 g001
Figure 2. Nitrogen mass balance for influent TN for columns receiving (A) ORG-N low (treatment group (1) and (B) ORG-N high (treatment group (2) application rates. *Assumed that influent TN unaccounted for in effluent N, retained N, N2O, or NH3 was assumed to be lost as N2.
Agronomy 10 00979 g002
Figure 3. Cumulative mass of influent and effluent N (mg N) for control and biochar columns receiving (A) NH4+-N low (treatment group 3), and (B) NH4+-N high (treatment group 4) application rates. Error bars represent standard deviation of effluent TN between triplicate columns for treatment. Letters signify statistically significant difference between treatments. Note: Entire bar (with no fill) represents total influent TN, where entire solid bar represents TN in effluent. Individual N species in the effluent are denoted based on color (blue, red, green).
Agronomy 10 00979 g003
Figure 4. Nitrogen mass balance for influent N for columns receiving (A) NH4+-N low (treatment group (3) and (B) NH4+-N high (treatment group (4) application rates. * Assumed that influent TN unaccounted for in effluent N, retention N, N2O, or NH3 was assumed to be lost as N2.
Agronomy 10 00979 g004aAgronomy 10 00979 g004b
Figure 5. Cumulative (A) NO3-N leached and (B) N2O emitted from columns receiving NO3-N applications. Different letters signify significant difference (p < 0.05) between control and biochar treatments. Error bars represent standard deviation between treatment triplicates.
Agronomy 10 00979 g005aAgronomy 10 00979 g005b
Figure 6. Fourier-transform infrared spectroscopy (FTIR) spectra of (A) BC1 initial and final for treatments 1 through 4, and (B) BC1, BC2, and BC3 initial and final for treatment group 5.
Agronomy 10 00979 g006
Table 1. Study experimental design setup, weekly application concentrations, weekly application rates, total mass loading, and average column soil bulk density.
Treatment GroupN AppliedConcentration
(mg N L−1)
Rate
(kg N ha−1)
Total
Mass Loading
(mg N)
TreatmentBulk Density
(g cm−3)
1ORG-N
Low
150198225Control1.70 ± 0.01
2.5% BC11.39 ± 0.04
2ORG-N
High
250033063750Control1.71 ± 0.03
2.5% BC11.39 ± 0.03
3NH4+
Low
506675Control1.64 ± 0.08
2.5% BC11.42 ± 0.02
4NH4+
High
125016531875Control1.72 ± 0.05
2.5% BC11.41 ± 0.01
5NO3202630Control1.69 ± 0.03
2.5% BC11.38 ± 0.01
2.5% BC21.39 ± 0.01
2.5% BC31.53 ± 0.11
Table 2. Change in soil N for ORG-N low (treatment group 1), ORG-N high (treatment group 2), NH4+-N low (treatment group 3), NH4+-N high (treatment group 4) and NO3-N (treatment group 5) after 10 weeks of nutrient application. Values are means (standard deviation) of triplicates. Different letters represent significant difference (p = 0.05) between soil N within application group.
Application †TreatmentNH4+-N
(mg N)
NO3N
(mg N)
TKN
(mg N)
ORG-N ‡
(mg N)
TN
(mg N)
ORG-N LowControl10.52 (1.28) a0.91 (1.10) a0.60 (8.41) a−9.91 (7.75) a1.51 (9.50) a
BC110.52 (2.19) a6.76 (1.00) b63.64 (27.00) b53.13 (26.24) b55.21 (26.39) b
ORG-N HighControl180.61 (9.60) a−3.65 (0.07) a294.32 (3.59) a113.70 (6.20) a290.66 (3.54) a
BC1217.15 (17.68) a−4.17 (1.04) a360.04 (46.66) a142.89 (60.80) a326.47 (16.26) a
NH4+-N LowControl2.42 (1.51) a−0.40 (0.71) a0.50 (0.83) a−2.89 (3.09) a0.10 (0.26) a
BC18.92 (3.22) a3.58 (0.27) b8.52 (2.21) b−0.41 (1.08) a12.09 (2.44) b
NH4+-N HighControl150.76 (13.98) a17.54 (5.89) a107.40 (3.09) a−43.36 (11.40) a124.94 (7.95) a
BC1132.51 (6.69) a91.85 (8.47) b116.82 (8.98) a−15.69 (11.70) b208.68 (17.36) b
NO3-NControl1.98 (0.72) a−2.25 (0.12) a−6.99 (4.24) ab−8.96 (3.56) b−9.24 (4.13) a
BC19.98 (3.99) b−2.79 (0.08) a−4.73 (3.79) a−14.71 (5.07) bc−7.52 (3.76) a
BC25.56 (1.45) ab6.73 (0.94) c2.61 (1.55) c−2.95 (3.00) a9.34 (2.04) b
BC37.62 (0.74) b0.26 (0.76) b−11.74 (2.12) b−19.35 (2.69) c−11.48 (1.79) a
Different letters signify significant difference (p < 0.05) between control and biochar treatments for a specific parameter within a treatment group. † Data presented in tables is the change in soil N content or the final soil N content subtracted by the initial soil N content. Negative values indicate that species of N in the soil was converted or lost over the study period. Calculated from ORG-N =TKN – NH4+-N.
Table 3. X-ray photo-electron spectroscopy (XPS) scan of major elements and functional groups on the surface of BC1 before and after soil amendment for columns receiving ORG-N and NH4+-N low and high application rates. Value is mean (standard deviation) from triplicate columns. Significant difference (p = 0.05) between BC1 initial and BC1 final for treatments one through four are denoted with an asterisk (*). Elemental peaks that were not detected are signified by n.d.
Atomic Composition (%)
Element BC1 Initial BC1 after ORG-N Low Application (Treatment Group 1)BC1 after ORG-N High Application (Treatment Group 2)BC1 after NH4+-N Low Application (Treatment Group 3)BC1 after NH4+-N High Application (Treatment Group 4)
C84.79 (1.53)68.13 (1.79) *69.65 (2.17) *72.17 (2.79) *71.12 (3.03) *
C-C/C-H67.25 (0.72)48.83 (0.49) *47.90 (2.19) *49.63 (3.27) *48.03 (2.70) *
C-O/C-OC9.38 (0.43)10.19 (0.66)11.44 (0.78) *10.88 (0.65) *11.58 (0.93) *
C=O3.63 (0.22)4.10 (0.27)4.70 (0.50) *4.45 (0.30) *5.39 (0.79) *
O=C-C2.24 (0.15)2.80 (0.70)3.41 (0.27) *3.46 (0.62) * 2.91 (0.54) *
Shake up1.44 (0.36)1.28 (0.52)1.04 (0.31) 2.53 (0.79) 2.01 (0.14)
Quinone0.86 (0.07)0.94 (0.07)1.16 (0.25)1.21 (0.35)1.19 (0.30)
O13.49 (0.73)20.89 (0.29) *20.95 (1.60) *19.10 (1.82) *19.96 (1.62) *
N1.21 (0.04)1.70 (0.37) *3.15 (0.25) *1.66 (0.28) *1.86 (0.11) *
Pn.d.0.88 (0.19) *1.26 (0.24) *0.21 (0.07) *0.42 (0.03) *
Aln.d.2.11(0.35) *0.99 (0.08) *1.74 (0.29) *1.51 (0.06) *
Can.d.0.63 (0.12) *0.65 (0.07) *0.57 (0.03) *0.66 (0.04) *
Cln.d.n.d.n.d.0.14 (0.04) *0.32 (0.12) *
Fen.d.0.62 (0.20) *0.65 (0.11) *0.40 (0.07) *0.12 (0.01) *
Mg0.11 (0.01)0.41 (0.04) *0.27 (0.05) *0.37 (0.03) *0.51 (0.11) *
Si0.40 (0.01)4.31 (0.74) *2.09 (0.20) *3.35 (0.86) *3.18 (1.13) *
Snn.d.0.32 (0.03) *0.35 (0.05) *0.30 (0.06) *0.33 (0.07) *