Article

Combined Cultivation Pattern Reduces Soil Erosion and Nutrient Loss from Sloping Farmland on Red Soil in Southwestern China

1
Institute of Agricultural Environment and Resources, Yunnan Academy of Agricultural Sciences (YAAS), Kunming 650205, China
2
New Zealand Institute for Plant & Food Research Limited, Private Bag 4704, Christchurch 8140, New Zealand
3
Department of Soil and Physical Sciences, Lincoln University, Lincoln, Christchurch 7647, New Zealand
4
China Meteorological Administration Training Centre, Beijing 100081, China
*
Author to whom correspondence should be addressed.
Agronomy 2020, 10(8), 1071; https://doi.org/10.3390/agronomy10081071
Submission received: 7 June 2020 / Revised: 20 July 2020 / Accepted: 22 July 2020 / Published: 24 July 2020

Abstract

:
Crops are usually planted on sloping land in mountainous areas due to limited suitable land area. This results in serious soil erosion and loss of nitrogen (N) and phosphorus (P) to land degradation and water eutrophication. It is important to adopt appropriate cultivation practices to change this situation. However, few long-term in situ measurements are available to assess the magnitude of effects of combined cultivation patterns on soil erosion and nutrient loss from sloping farmland with red soil, as well to quantify N and P losses through runoff and sediment transport. A field trial with the cash crop (CC) Nicotiana tabacum was carried out under natural rainfall conditions on sloping farmland with red soil in Yunnan, China during 2014–2017. Four cultivation patterns were applied. They included NVF (No fertilizer application + Vertical ridge + Film covered), OVF (Optimizing fertilizer application + Vertical ridge + Film covered), OHF (Optimizing fertilizer application + Horizontal ridge + Film covered), and OHFR (Optimizing fertilizer application + Horizontal ridge + Film removed). The first two treatments belonged to the vertical ridge (VR) group, and the remaining treatments belonged to the horizontal ridge (HR) group. Results indicated the HR group performed significantly better than the VR group, especially the OHFR treatment, in terms of the HR group producing average runoff (177.12–182.27 mm), sediment loss (2673.33–3309.17 kg·ha−1), and nutrient loss of total nitrogen (TN) (7.58–7.93 kg·ha−1), total phosphorus (TP) (1.00–1.09 kg·ha−1) through runoff, TN (3.53–4.72 kg·ha−1), TP (2.59–2.76 kg·ha−1) through sediment. TN was lost mainly through runoff transport, while TP was lost mainly through sediment transport. On average, the HR group decreased runoff, sediment, total N and P loss by 39% to 73% relative to the OVF treatment, whereas NVF treatment increased 3% to 30% of those (p < 0.05). Under four cultivation patterns, total dissolved nitrogen (TDN) was the dominant form, which accounted for 71–77% of TN. The average percentage of NO3-N/TN was about 45–52%, much higher than NH4+-N/TN of around 8–10% in runoff. Total dissolved phosphorus (TDP) made up about 48–59% of TP in runoff. Redundancy analysis (RDA) showed that sediment, runoff, and soil pH were the three key factors controlling nutrient loss. In conclusion, OHFR is recommended because it consistently outperformed other patterns in terms of reducing runoff, sediment, and nutrient losses.

1. Introduction

Large areas of sloping land (5–25°) are distributed throughout the world. For example, sloping lands dominate Southeast Asia, East Asia, and the Himalayan states, covering over 60%, 50%, and 37% of the total land area, respectively [1,2,3]. Hillslope farming by planting cash crop (CC) such as banana and sugarcane is common in mountainous areas. Sloping farmland, as a valuable land resource, plays an important role in hillslope agriculture. With the rapid socio-economic development and living standards improvement, there has been an increasing demand for specialized non-food products such as tobacco, tea, and coffee [4]. As a result, more and more ecologically fragile land such as sloping land has been used for agricultural production [5]. In the Mediterranean area of Italy where the region is 62% hilly and 24% mountainous terrain, durum wheat occupies the largest part of the Mediterranean uplands [6]. In China, approximately 30% of the agricultural fields have a slope of >6° [7]. These worldwide-distributed sloping lands require improved soil managements as they are exposed to the risk of soil erosion and nutrient losses.
Sloping lands are susceptible to soil erosion and nutrient losses resulting from reduced soil infiltration capacity, topographical characteristics, rainfall events, intensive human activity, and unreasonable agricultural management practices. Regardless of climatic zone, runoff is prone to be generated in the rainy seasons through either saturation-excess or infiltration-excess [8]. This usually causes worldwide severe soil degradation and unsustainable production through soil erosion and nutrient losses, which also pollutes the receiving water environment [9]. In a global context, contaminants that come from agricultural sources of nitrogen (N) and phosphorus (P) often contribute to the largest share of non-point source pollution (NPSP) [10,11,12]. Runoff/sediment formation and nutrient losses are usually attributed to rainfall characteristics, soil properties, land use/land cover, and soil tillage [13]. Previous studies have indicated that runoff and soil erosion can be effectively controlled, and soil properties can be greatly improved by selecting appropriate cultivation methods and land cover patterns, such as ridge direction, sediment fences, and mulching [14,15,16]. For example, hedgerows can be used to reduce erosion and runoff by 32–67% and 15–45%, respectively, in the red soil hilly areas in Southeast China [14]. In eastern Scotland, modified sediment fence pinned to a contour fence near the base of a potato field were found to be effective to retain sediment and P [15]. In addition, contour hedges and terrace construction, as an effective way to improve microtopography, has been reported to reduce runoff and soil erosion by dividing the slope length into short ones and reducing the slope gradient [17,18,19,20]. Contour hedges have also been shown to reduce nutrient loss from steep uplands [21,22,23,24]. Contour/Horizontal ridge decreased erosion and nutrient loss by slowing down runoff flow velocity [7]. Crop leaves can intercept rainfall, roots can consolidate the cross-ridge, and cross-ridge can retain rainfall and nutrient by establishing contour lines on sloping cropland, which was beneficial for crop yield [25,26]. However, these practices are usually costly and they have limited application in managing terrace or contour hedges in less-developed mountain agriculture. Surface coverage such as straw mulching and plastic mulching is often used as a conservational measure. Straw mulching increases the roughness of soil surface and alleviates runoff scouring to provide time for water infiltration into soil. Film mulching decreases splashing erosion of raindrop to soil surface [16]. These are popular and indeed effective measures to control erosion and nutrient losses.
However, most studies have focused on a single measure only (e.g., cultivation measures, mulching practices, or fertilizer application management) [14,15,16,27,28]. For example, Zhang et al. [27] compared different tillage practices in controlling erosion in the steep hillslopes of the Sichan Basin, China, and they found that contour ridge tillage was more effective than contour flat tillage in controlling erosion. Liu et al. [16] evaluated the effectiveness of two types of soil surface mulching including straw mulching and film mulching in reducing runoff and nutrient losses in citrus orchards on a sloping land in the Danjiangkou Reservoir area of China, and their results showed that straw mulching was more effective in controlling runoff and nutrient losses. Singh et al. [28] assessed the effect of manure application on the water quality in South Dakota, USA, and they found that N and P losses in the runoff were lower when manure was applied in the upper rather than lower half of a watershed. However, it is poorly understood how the combined cultivation patterns that integrate ridge types, mulching, and fertilizer application affect perennial runoff, sediment loss, and nutrient loss through runoff and sediment transport on sloping lands with red soil. Red soil accounts for about 25% of total areas in China. Red soil is also widely distributed in other parts of the world, such as in South America, Africa, and particularly in Southeast Asia. It is the product of intense weathering under a warm, humid tropical/sub-tropical climate. It usually contains low organic matter, low Cation Exchange Capacity (CEC), low pH, and limited nutrient availability, which makes it vulnerable to soil erosion once vegetation is removed or damaged [29]. Therefore, it is of great importance to identify optimized cultivation patterns for mitigating contaminant losses from sloping farmlands.
In order to achieve the cost-effectiveness of implementing best management practices on red soil, it is important to understand the impact of combined cultivation patterns on red soil erosion and nutrient loss on sloping land and to quantify N and P loss through runoff and sediment transport under natural rainfall conditions with relatively long-term (4 y) in situ observations. The objective was to optimize the cultivation method for planting a cash crop on sloping land for mitigating N and P loss.

2. Materials and Methods

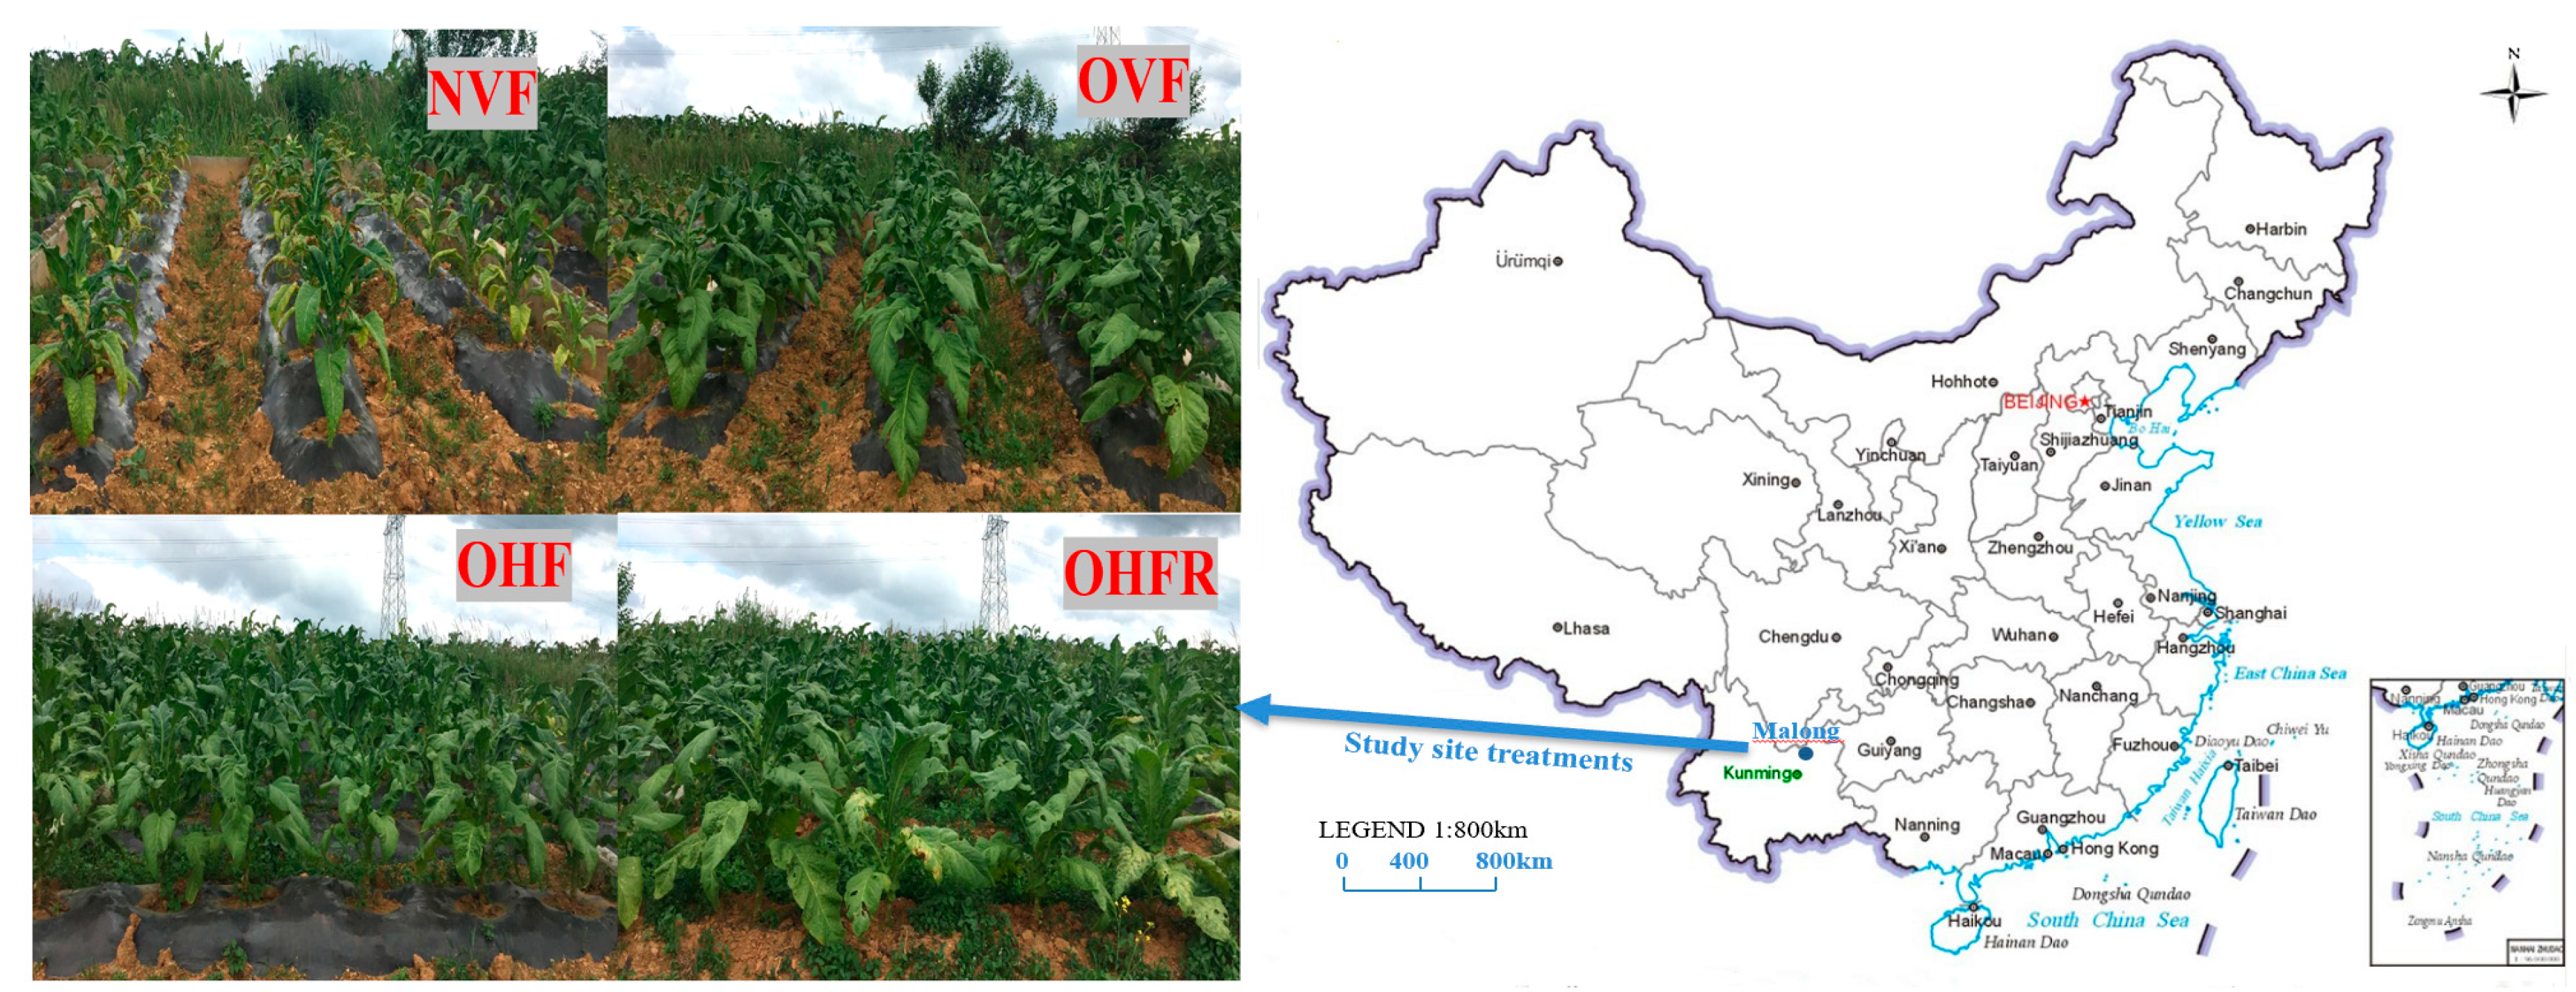
2.1. Study Site Description

The study site was located in Tuanjie village, Malong County of Qujin city of Yunnan Province, China (25°21′17″ N, 103°22′57″ E) (Figure 1). This area is characterized by gentle hillslopes with slope degree ranging from 5° to 15° and a mean elevation of 1885 m. It belongs to subtropical highland climate (Cwb) according to the Köppen–Geiger climate classification [30]. Average annual rainfall is 1002 mm, with >70% falling during May to September. Average temperature is 13.6 °C, and the frost-free period is 247 days according to the data obtained from China Meteorological Administration. The study area is dominated by red soil, which is composed of a simple mixture of kaolinite and iron and aluminum oxide/hydroxide minerals. Composition of clay minerals of red soil varies systematically with latitude, elevation, parent material, and topographic position [29]. Most red soils are distributed in hilly regions and low mountains. The soils are highly weathered, inherently infertile, and generally vulnerable to soil erosion. Therefore, appropriate land use and management practices are crucial to maintaining soil fertility and mitigating contaminant losses to receiving waters. The soil texture varies with depth, being loamy at the surface, clayey at the bottom of the ploughing layer, and sandy at the bottom [29]. The rotation was green manure (Astragalus sinicus L.) and cash crop (Nicotiana tabacum). Soil bulk density was 1.19 g·cm−3, and soil pH was 5.64 at 0–25 cm depth. Organic matter content, total nitrogen, total phosphorus, and total potassium at 0–25 cm depth were 20.18, 1.14, 0.6, and 18.2 g·kg−1, respectively.

2.2. Experimental Design

Four treatments were set up in the same sloping land, facing southeast with a slope of 8.5° (15%) (Figure 1). They included NVF (No fertilizer application + Vertical ridge + Film covered), OVF (Optimizing fertilizer application + Vertical ridge + Film covered), OHF (Optimizing fertilizer application + Horizontal ridge + Film covered), and OHFR (Optimizing fertilizer application + Horizontal ridge + Film removed) (Table 1). Each treatment was replicated three times, resulting in a total of 12 plots. Each plot, with an area of 8 m × 4 m = 32 m2, was separated around by bricks and connected with a runoff/sediment collecting tank (dimension of 2 m × 1 m × 0.75 m) downslope. Runoff/sediment were collected from the entire plot area in rainy seasons (May to September). Cash crop (Nicotiana tabacum) was planted with 12,000 plants · ha−1 with row spacing of 133 cm and plant spacing of 65 cm. Two types of ridges, vertical ridge and horizontal ridge, were developed for planting. For each plot, 36 Nicotiana tabacum seedlings were transplanted (three columns and 12 Nicotiana tabacum seedlings per column for vertical ridge, while six rows and six Nicotiana tabacum seedlings per row for horizontal ridge). Black plastic film was covered on the ridge surface after the Nicotiana tabacum was transplanted. Fertilizers (N-P2O5-K2O) were composed of cow dung (1-0.5-1), compound fertilizer special for Nicotiana tabacum (18-5-22), calcium superphosphate (0-16-0), and potassium nitrate (13.5-0-44.5). Rates of fertilizer application for different treatments are shown in Table 1. The mixed dry granular fertilizers were applied together to each individual plant (hole fertilization), except treatment NVF, which was used as a base fertilizer before Nicotiana tabacum was transplanted. After 45 d (prosperous long-term period), the film was removed for the OHFR treatment. Following the local famers, the experiment started in middle of May and finished in late of September each year.

2.3. Sampling and Measurements

Weather data were recorded in a weather station about 10 km away and obtained from the China Meteorological Administration. Runoff discharge and sediment export were measured from the collection tank at the outlet of each plot following every runoff event throughout the experimental durations.
Surface runoff water of 12 plots were manually recorded for runoff volume and sampled once per regular runoff event or multiple times during a heavy rainfall event, sealed in 500 mL plastic bottles per sample, labeled, frozen immediately at −4 °C, and analyzed within 5–7 d after being collected. The upper water in the runoff pond drained after runoff had been quantified and sampled, and the sediment at the bottom of the tank was collected and weighed. Tanks were cleaned and prepared for next event.
Sink sediments amount from the bottom of tank were collected and oven dried at 105 °C for 24 h, weighted, and recorded for each event, until the final harvest of Nicotiana tabacum in late September. The amount of sediment total nitrogen (TN) and total phosphorus (TP) losses of each plot was calculated by multiplying the sediment weight and TN, TP concentration of sediment, respectively.
Nutrients in runoff samples were measured using the AA3 Flow auto-analyzer. The measurements included concentrations of TN and TP in unfiltered runoff water samples, nitrate nitrogen (NO3-N), ammonium nitrogen (NH4+-N), total dissolved nitrogen (TDN), and total dissolved phosphorus (TDP) concentrations of filtered samples using a 0.45 μm filter membrane. Concentrations of TN, TDN in runoff were determined by alkaline potassium persulfate oxidation-centrifugation and the UV-spectrophotometry method [31]. Concentrations of NH4+-N and NO3-N filtrate was automatically analyzed by AA3 auto-analyzer, through flow injection analysis technology (Bran + Luebbe, Norderstedt, Germany). Concentrations of TP and TDP in runoff were determined by the method of Murphy and Riley [32], after oxidation of the water samples with sulfuric acid (H2SO4) and perchloric acid (HClO4) [33].The TN in sediment was measured by the Kjeldahl method, and TP in sediment was measured by the NaOH melting molybdenum antimony colorimetric method [34].

2.4. Data Analyses

(1)
The annual total nutrient loss Q (kg·ha−1) was calculated by summing up the losses in all runoff events: Q = Σ Ci × Vi/A ×10−2, where Ci is the TN, TDN, NO3-N, NH4+-N, TP, or TDP concentration in the runoff water (mg·L−1); Vi is the volume of runoff discharge (L); i = 1~n (n is the number of runoff events in a year) and A is the area of plots (m2).
(2)
Average reduction rate ARR (%) = (Average Value OVF − Average Value (other trial plots))/Average Value OVF × 100, where OVF is the control treatment. Average reduction rate was used to compare the average 4-y effects of different treatments for controlling runoff, sediment loss, and nutrient loss relative to the control treatment OVF.
(3)
ANOVA was used to assess treatment effects (NVF, OVF, OHF, and OHFR) on runoff depth, sediment loss, nutrient loss by runoff and sediment transport for each runoff event, for each year, and for average reduction rate of entire experimental period from 2014 to 2017. The Tukey test was used to determine if significant differences existed between every two treatments at the 0.05 probability level. Redundancy analysis (RDA) analysis was used to explore impact of factors on N and P loss for different combined cultivation patterns. Statistical analyses were completed with SPSS 17.0 and Canoco 5.0 software.

3. Results

3.1. Runoff and Sediment Loss

Compared with the vertical ridge (VR) group, the horizontal ridge (HR) group produced significantly less runoff and sediment loss each year (p < 0.05) (Figure 2). Four-year average runoff depths were 374, 361, 182, and 177 mm in the NVF, OVF, OHF, and OHFR treatments, respectively. The corresponding 4-y average sediment yields were 13,393, 11030, 3309, and 2673 kg·ha−1, respectively. The OHFR treatment tended to decline runoff and sediment on average by 51% and 73% (Table 2), respectively, while the NVF treatment increased runoff on average by 3% and sediment by 28% with statistical significance compared with the OVF.
Significant differences between VF and HF groups were evident in most years; however, within-group differences were small except for sediment loss in 2015 and 4-y average sediment loss (Figure 2).
This indicated that fertilizer application also influenced sediment yield. Compared with the control treatment OVF, the two HR treatments reduced runoff and sediment loss on average by 50–51% and 65–73% (Table 2), respectively. Within the HR group, the OHFR had the greatest reduction rates for runoff and sediment loss.

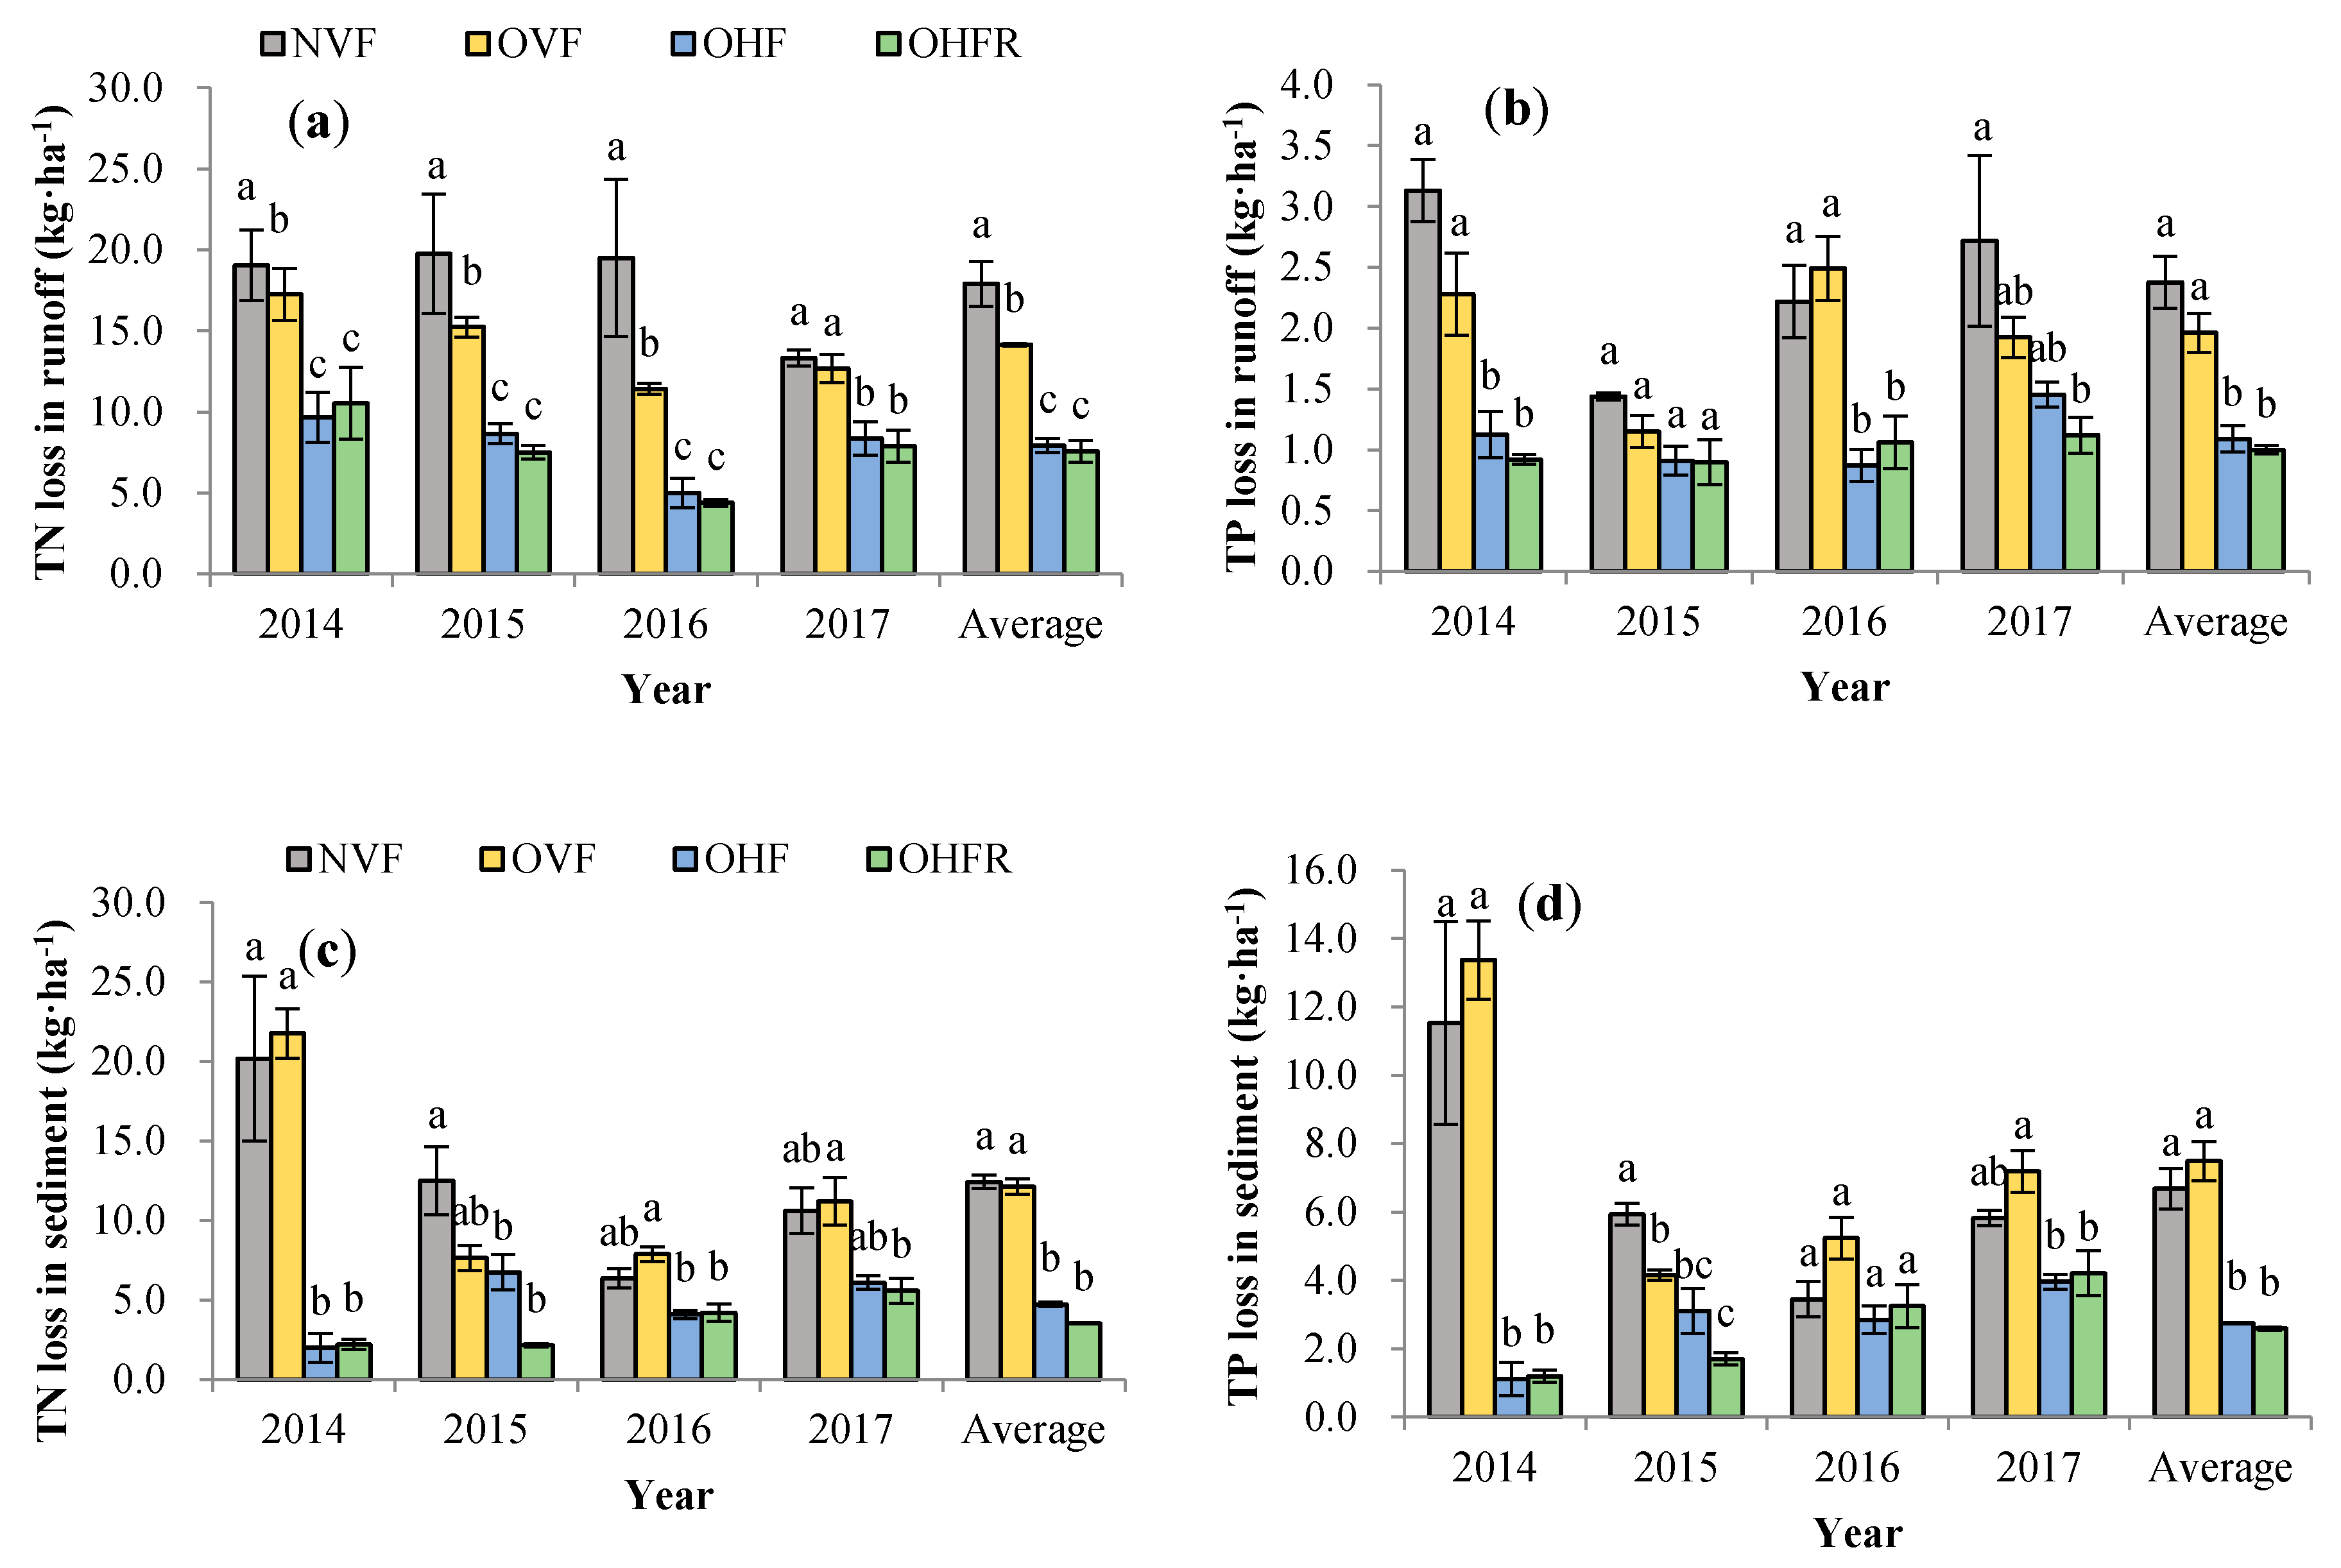
3.2. Total Nitrogen and Phosphorus Loss from Runoff and Sediment

On average, 54–68% of TN was lost mainly through runoff, while 72–79% of TP was lost through sediment (Figure 3a,b). TN loss from both runoff and sediment in the VR group were significantly (p < 0.05) higher than the HR group. Four-year average TN loss from runoff were 17.91, 14.15, 7.93, and 7.58 kg·ha−1 (Figure 3a) in the NVF, OVF, OHF, and OHFR treatments, respectively. The corresponding TN loss in sediment was 12.42, 12.12, 4.72, and 3.53 kg·ha−1 (Figure 3c), respectively. Compared with the control treatment (OVF), NVF significantly (p < 0.05) increased TN loss from runoff by 30%. NVF produced less TN loss from sediment by 9%, relative to TN loss from runoff. The OVF reduction effect of TN losses in runoff was significant (p < 0.05) during for 2014–2017. This indicated that optimizing fertilizer application reduced TN loss from runoff than sediment, and no fertilizer application increased the risk of TN loss from runoff and sediment. Two HR treatments reduced the TN loss significantly (p < 0.05) from both runoff and sediment. There were no significant differences in TN loss between the HR treatments, although the OHFR treatment tended to produce the lowest N loss. Compared with the OVF, the two HR treatments significantly (p < 0.05) reduced TN loss by 43–47% from runoff and 49–64% from sediment transport (Table 2).
Compared with HR treatments, VR treatments had significantly higher TP loss from both runoff and sediment (Figure 3b,d). Four-year average TP loss from runoff was 2.38, 1.96, 1.09, and 1.00 kg·ha−1 (Figure 3b) in NVF, OVF, OHF, and OHFR treatments, respectively. The corresponding TP loss from sediment was 6.68, 7.49, 2.76, and 2.59 kg·ha−1 (Figure 3d), respectively. There were significant differences (p < 0.05) between VR group and HR group of TP loss from runoff for each year, except in 2015. NVF significantly (p < 0.05) increased TP loss from runoff by 26%; however, NVF decreased TP loss by 6% from sediment transport. This implied that no fertilizer application increased TP loss from runoff, while it reduced risk of TP loss from sediment. Compared with the control treatment (OVF), the two HR treatments significantly (p < 0.05) reduced TP loss by 39–44% from runoff and 51–57% from sediment, of which OHFR was the most effective treatment. The OHFR treatment tended to produce the lowest TP loss from both runoff and sediment in most of years, except 2016 TP loss in sediment (Table 2).

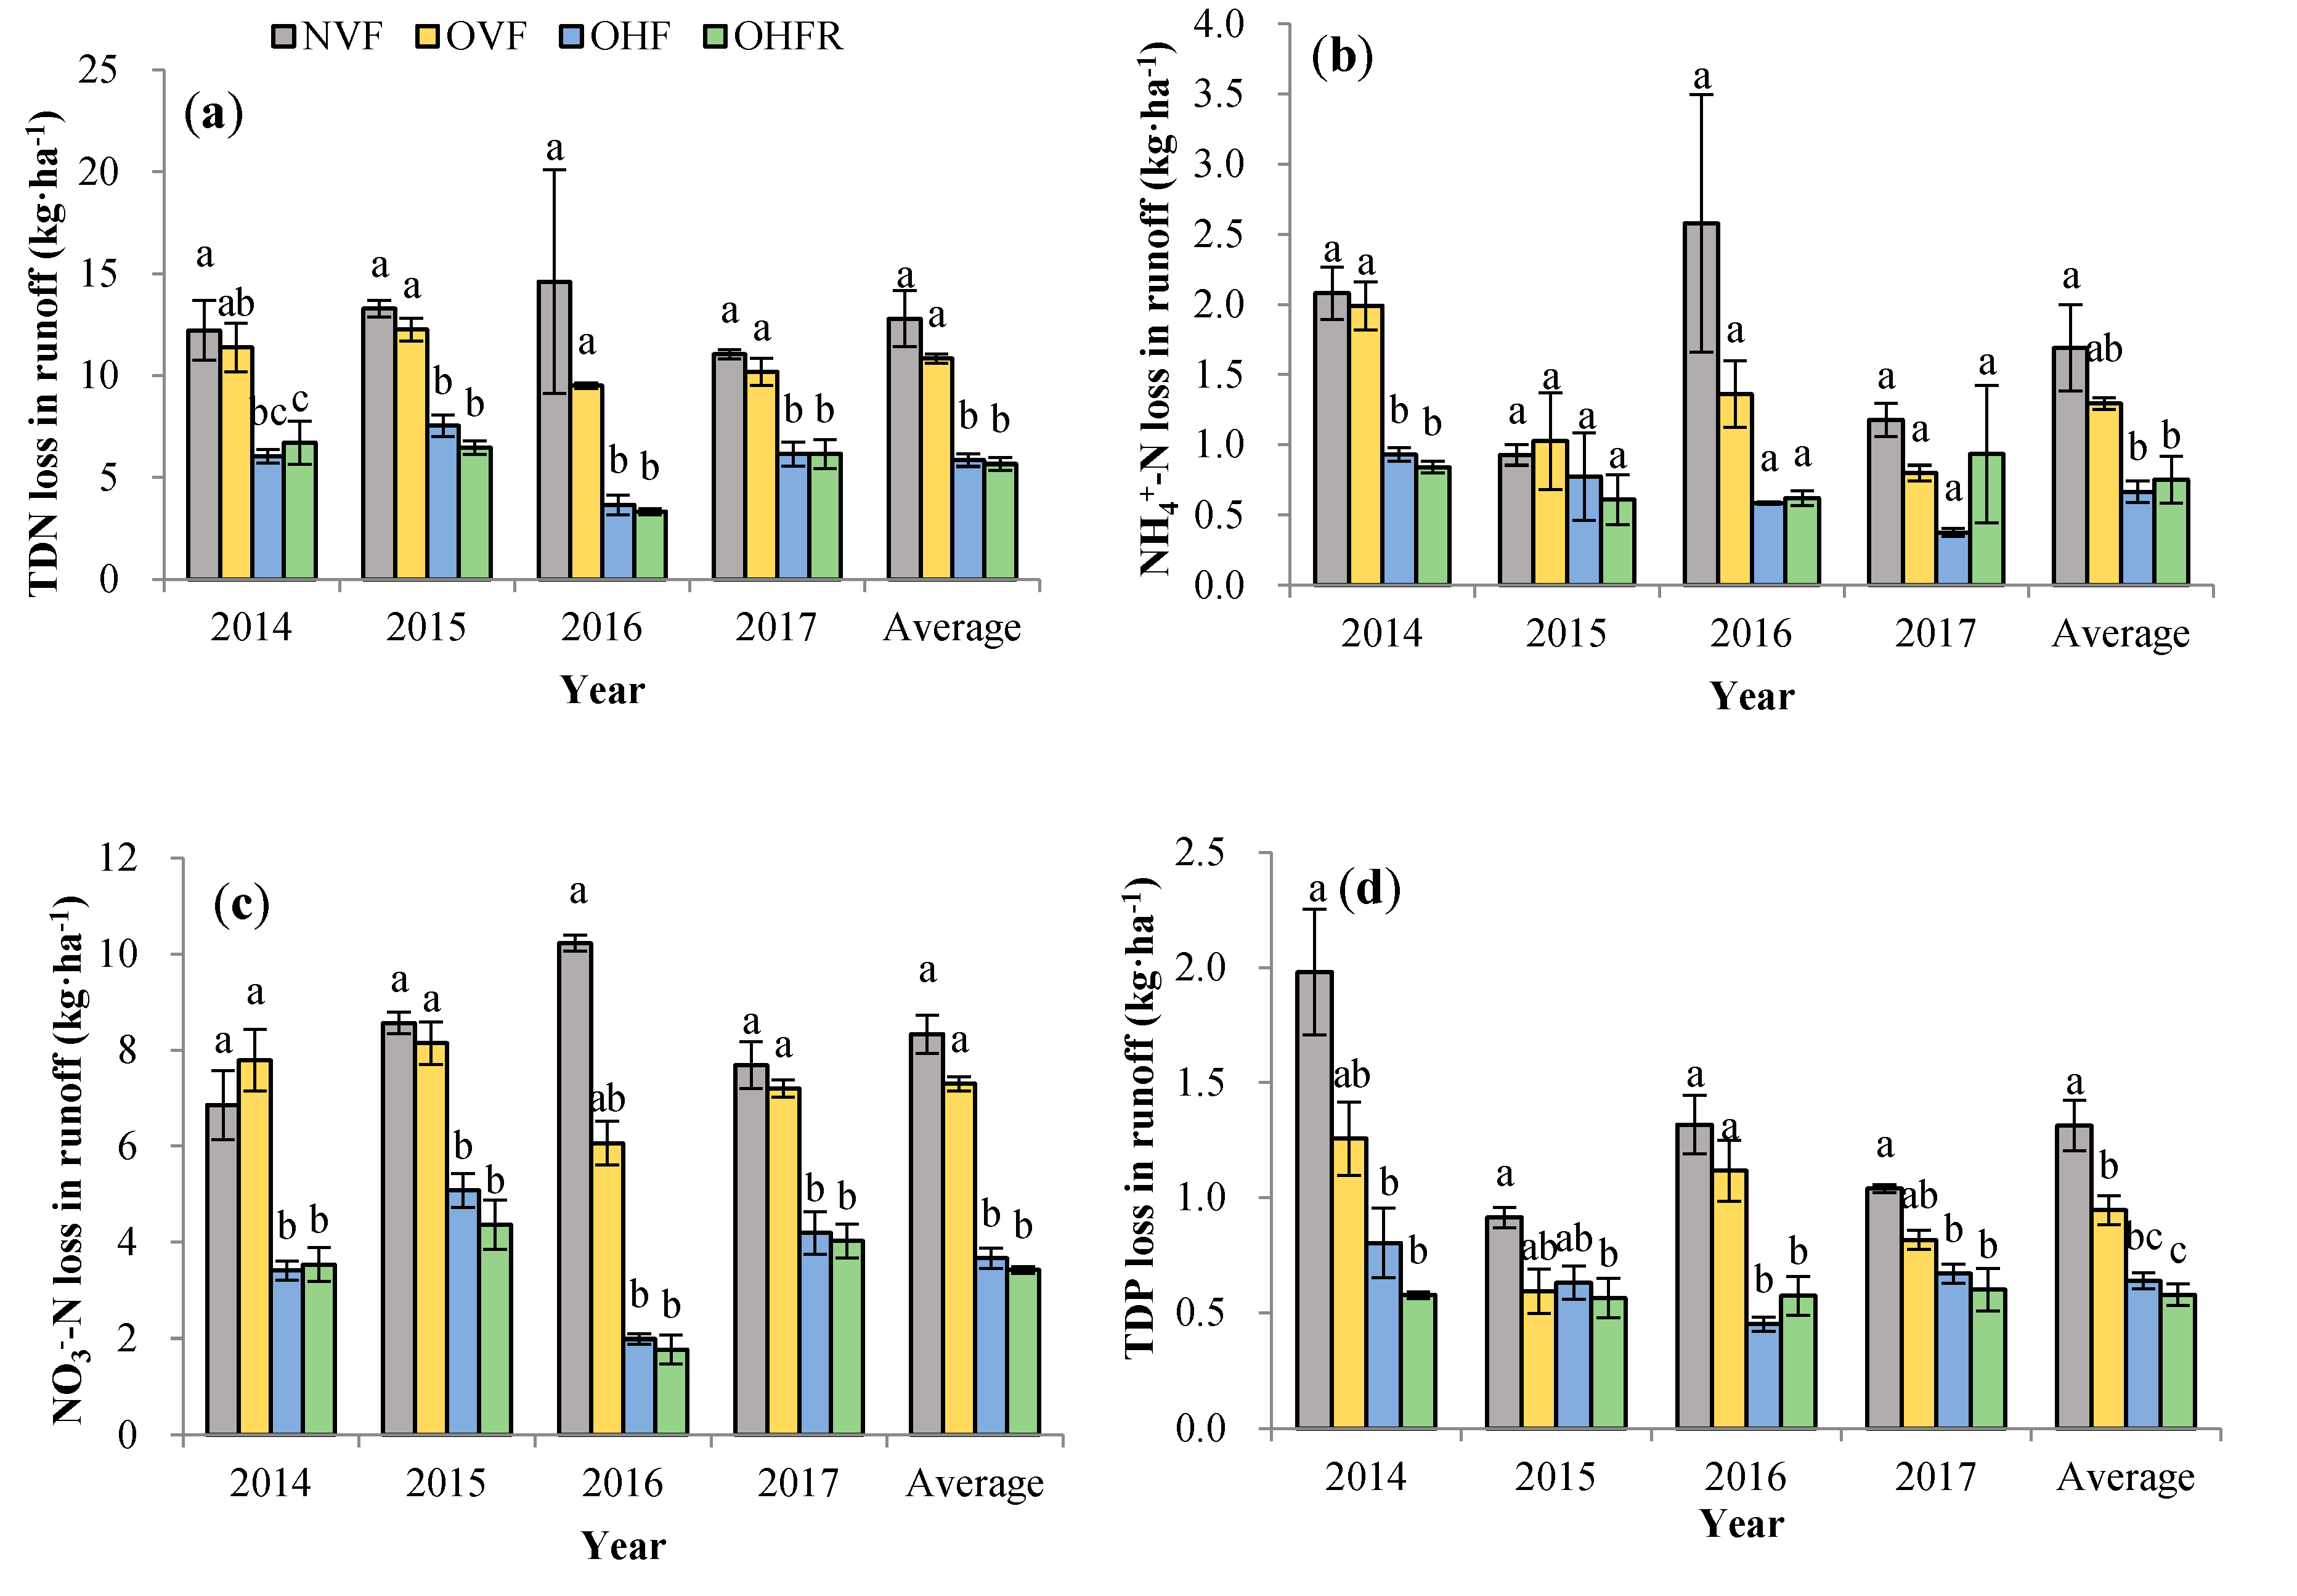
3.3. Different Forms of Nitrogen and Phosphorus Loss in Runoff

TDN (5.66–12.79 kg·ha−1) was the largest form of TN (7.58–17.91 kg·ha−1) loss from runoff, followed by NO3-N (3.42–8.33 kg·ha−1) and NH4+-N (0.67–1.69 kg·ha−1) (Figure 4). They accounted for 71–77%, 45–52%, and 8–10% of TN, respectively. Similarly, TDP (0.58–1.31 kg·ha−1) dominated TP (1–2.38 kg·ha−1) loss from runoff, which accounted for 48–59% of TP. In general, the treatment effects on different forms of N and P loss from runoff were similar to the effects on TN and TP from runoff, respectively. For example, HR treatments usually produced significantly (p < 0.05) lower TDN, NO3-N, NH4+-N, and TDP than VR treatments (Figure 4). Within the VR group, NVF usually produced more TDN, NO3-N, NH4+-N, and TDP compared with the control treatment (OVF), with a few exceptions. For TDP, the difference in the 4-y average between OVF and NVF was significant, and OVF treatment decreased TDP loss by 43% (p < 0.05) (Table 2). This indicated that optimizing fertilizer application was beneficial to reducing different forms of N and P losses in runoff, especially for TDP.

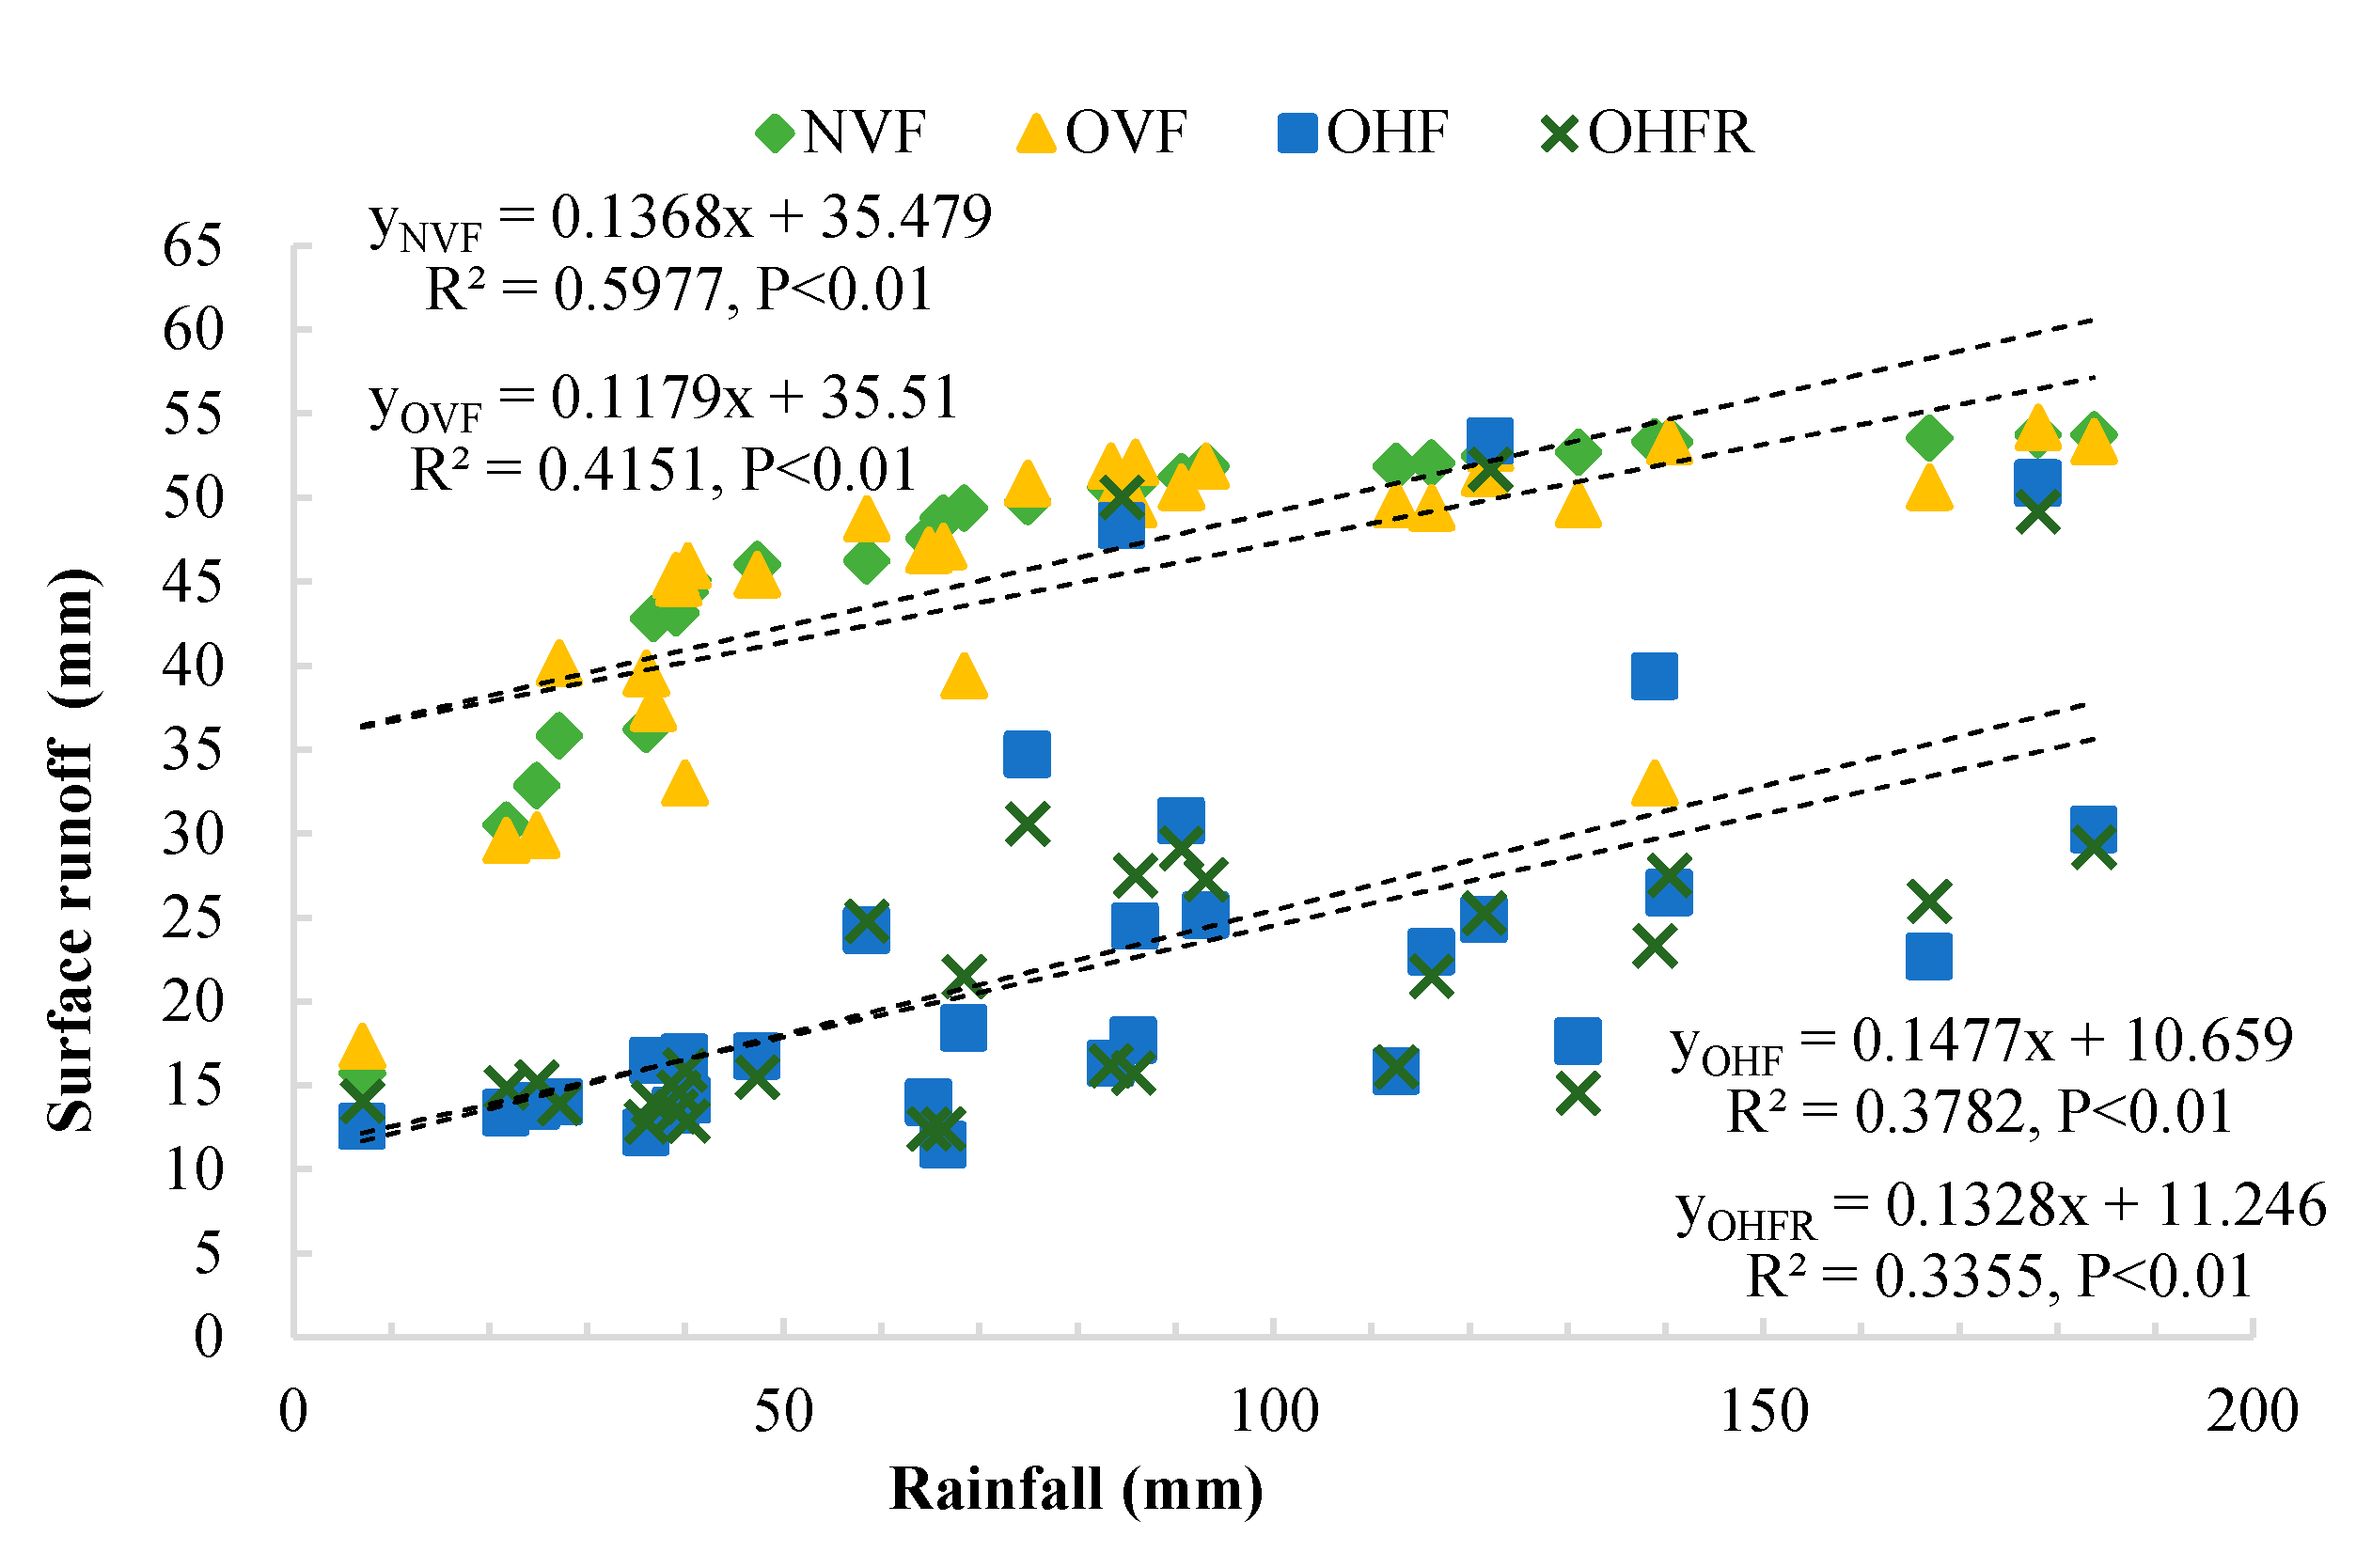
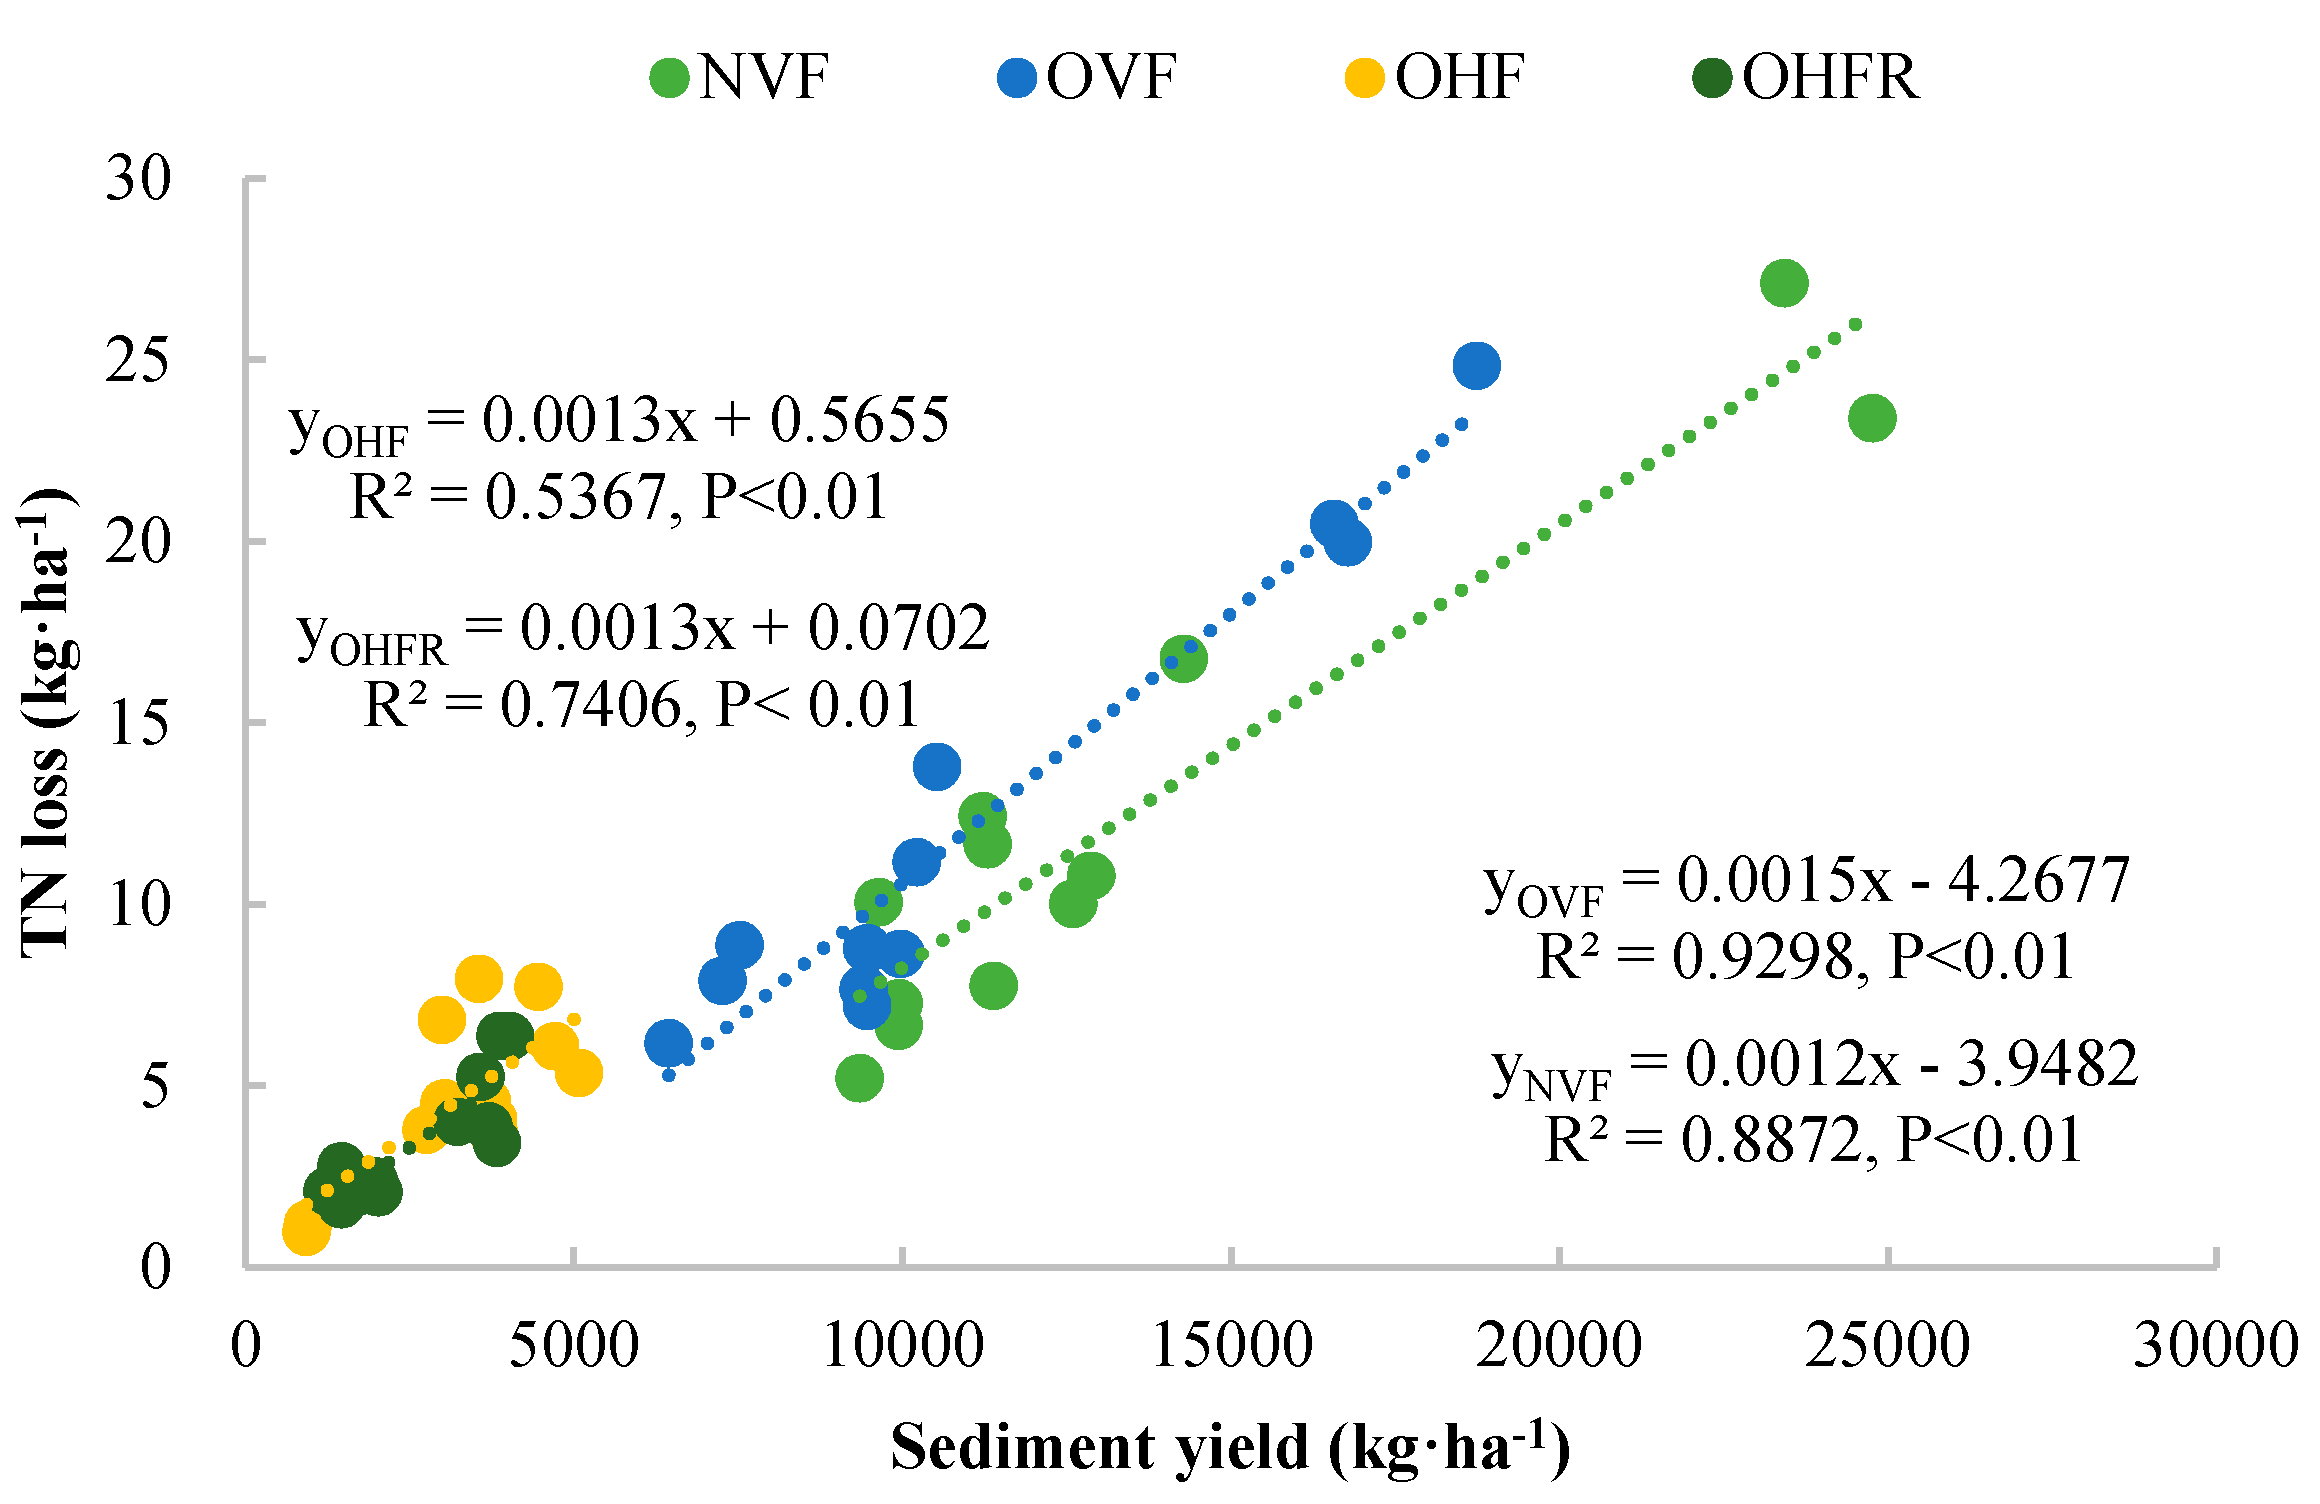
3.4. Relationship between Runoff Depth and Rainfall, Sediment Loss and Nutrient Loss

The relationship between runoff and rainfall is presented in Figure 5. Runoff depth was positively correlated with rainfall for both VR group and HR group among four years. We also identified significant relationships between the runoff and rainfall using linear regressions for the four treatments. Under the same rainfall, the difference between VR and HR groups was significant (p < 0.01), while no significant within group differences were found. The R2 value between runoff and rainfall ranked in an order of treatment NVF > OVF > OHF > OHFR. This indicated that the runoff was more affected by rainfall in the vertical ridge (VR) group, non-fertilization treatment, and mulching treatment than the horizontal ridge (HR) group, fertilization treatment, and no-mulching treatment, respectively.
Moreover, the relationships between sediment and TN and TP loss for the data from the NVF, OVF, OHF, and OHFR treatments are shown in Figure 6 and Figure 7. A strong positive correlation between the corresponding values of sediment and nutrient (TN, TP) loss (p < 0.01) was presented.

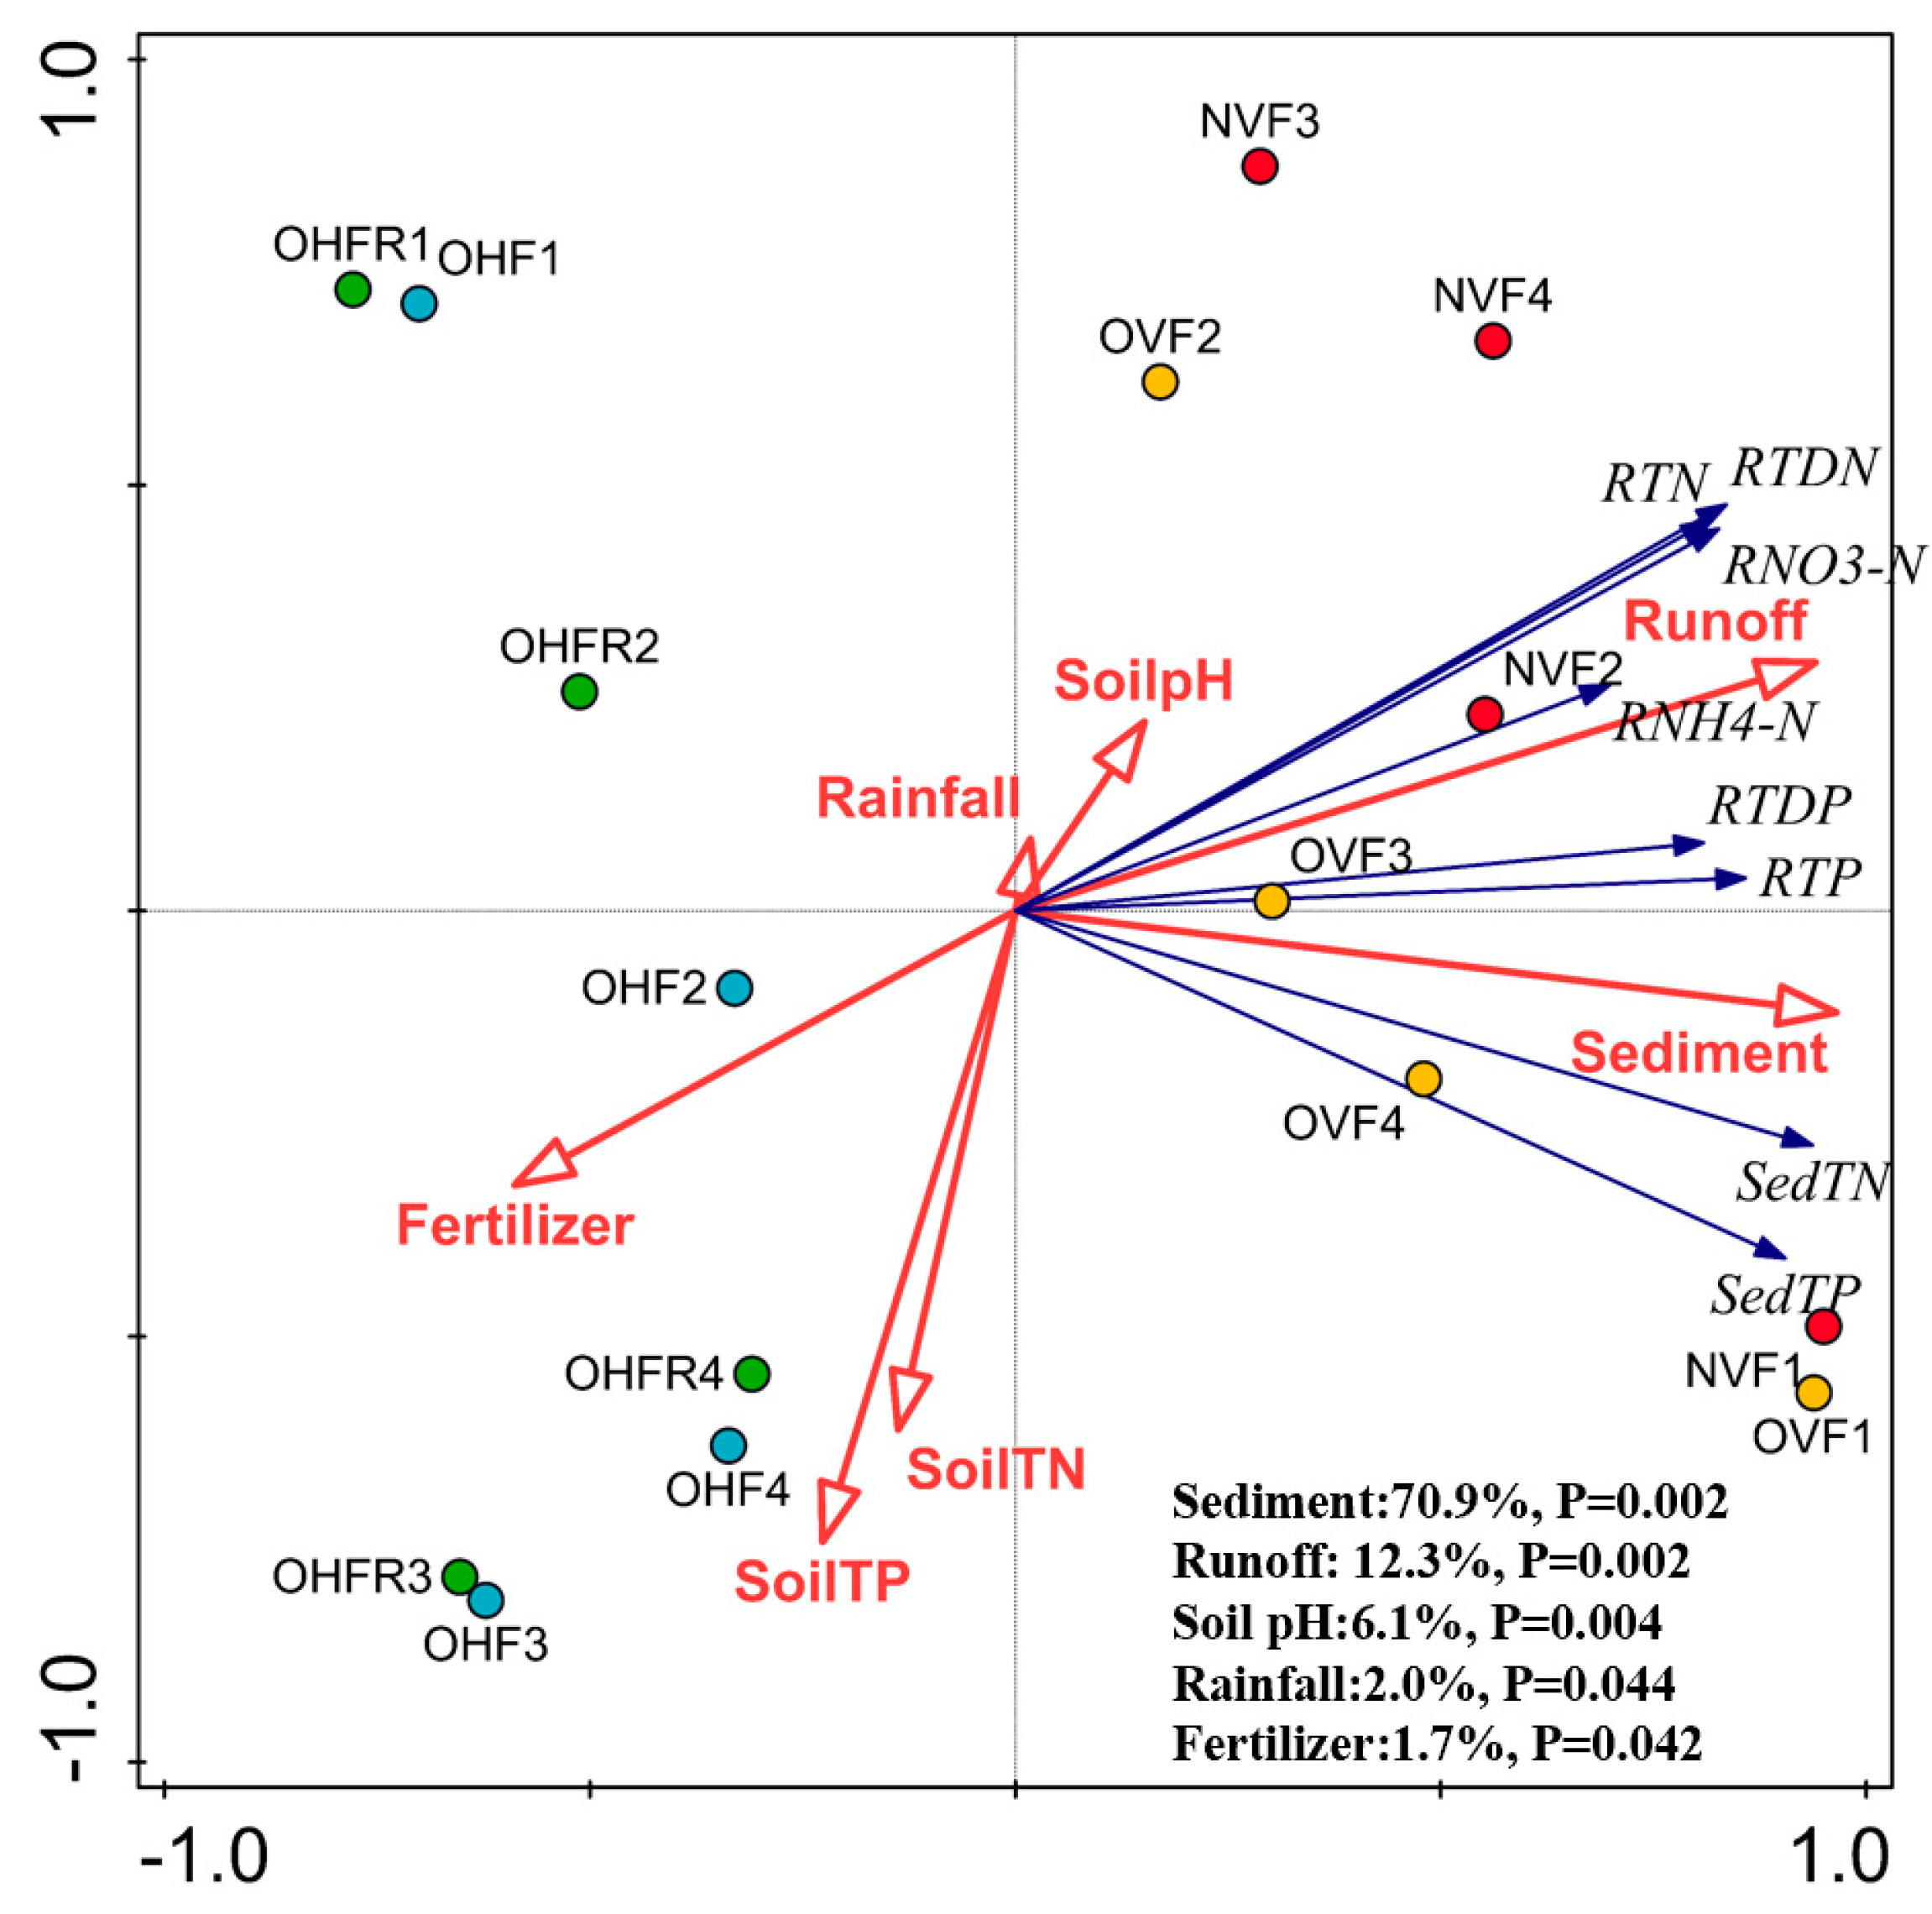
3.5. Factors Controlling Nitrogen and Phosphorus Losses

RDA results on the relationship between factors and N and P loss are shown in Figure 8. Moreover, 90% of the total variance was explained by the first two constrained axes of the RDA. Sediment, runoff, soil pH, rainfall, and fertilizer were identified as the most important contributors to the variation in N and P loss which explained 93.0% of the variation (approximate 94.4% of the variation caused by all the seven parameters), followed by soil TN and soil TP. Sediment, runoff and soil pH explained 70.9% (p = 0.002), 12.3% (p = 0.002), 6.1% (p = 0.004) of the variation, respectively (Table 3). Sediment, runoff, and soil pH were the three key factors (p < 0.01) of the nutrient loss change. The four treatments were divided into VR and HR groups by the RDA analysis (Figure 8). Treatments in VR group were positively correlated with the factors of nutrient loss in runoff and sediment, while treatments in HR group were negatively correlated with those. The risk of nitrogen loss was higher than phosphorus loss in runoff, while the situation was the opposite in sediment. Soil pH and rainfall presented greater correlations with nutrient loss in runoff than that in sediment. Soil TN and TP had greater correlation with nutrient loss in sediment, while fertilizer had little correlation with nutrient loss in runoff and sediment.

4. Discussion

4.1. Cultivation Pattern Effects on Runoff, Sediment Loss, and Nutrient Loss

In this study, different cultivated patterns and soil management interacted, which meant that comprehensive effects were observed. The results were easier to understand by separating cultivation factors including ridging direction, optimized fertilizer application, film mulch, and film mulch removed after prosperous growth period.
Ridging direction was the dominant factor to control soil erosion and nutrient loss as previous studies found [14,15].The biological barrier formed by ridge direction not only shorted the slope length and intercepted runoff, but also improved soil comprehensive anti-erodibility (CAE) [35]. Additionally, the duration of soil saturation, which was affected by ridge height, interception of vegetation, redistribution, and infiltration in the soil profile could be prolonged by establishing contour lines on sloping land [24]. In a similar study, horizontal ridge systems controlled and slowed the velocity of runoff, blocked sediment and filtered nutrient, thus increased nutrient percolation into soil effectively, which provides a guarantee for increasing crop yield [14,25,26]. However, vertical/longitudinal ridge tillage downslope without barriers probably accelerated surface runoff and degraded barren sloping land (sediment loss of 13,392.5 kg·ha−1 in NVF during 4-y trial) [36]. The current study of horizontal/contour ridge displayed the close relationship between runoff and nutrient loss, nutrient loss significantly (p < 0.05) reduced after runoff declined. Compared with control treatment (OVF), horizontal/contour ridge significantly (p < 0.05) reduced runoff by 50–51%, sediment by 65–73%, and nutrient loss by 39–64% (Table 2).
Optimizing fertilizer application controlled losses of runoff, sediment, and nutrients [37] through increased crop biomass and surface coverage. The aboveground biomass (AB) of NVF (ABNVF = 0.67 ± 0.21a t·ha−1, ABOVF = 4.62 ± 0.17b t·ha−1) indicated that rate of loss from runoff, sediment, and corresponding nutrients, except TP in sediment, was greater in NVF compared to OVF (Table 2). Soils have different nutrient retention capacities because of differences in soil physicochemical properties. This may cause different forms and proportions of nutrient losses in runoff [29].Low cation exchange capacity of red soil (CEC) makes it difficult to adsorb NH4+-N and NO3-N, which leads to its loss through runoff [29]. The P content in the runoff was far less than that in the sediment, particulate P dominated in the runoff [38], which meant that P was lost mainly through sediment transport on red soil in southwestern China (Figure 4). There are different views on the form of nitrogen loss in runoff affected by many factors such as fertilizer variety, soil type, and crop. Soluble N was the dominant form of N loss in runoff. Our finding showed that TDP was mainly lost through runoff in the VR and HR groups, accounting for 48% to 59% of TP, slightly higher than those previous studies have reported [7]. TDN accounted for 71% to 77% of TN loss through runoff. Of which, NO3-N accounted for 45–52%, and NH4+-N only accounted for 8–10% (Figure 4).
Straw mulching significantly reduced the loss of N associated with soil erosion, by eliminating raindrop splashing and alleviating runoff scouring. In their study, runoff, sediment, and associated nutrient loss were significantly (p < 0.05) decreased by using straw mulching or film mulching than treatments without mulching [16]. In another study, straw mulching reduced annual runoff, sediment yield, N and P loss by 13–55% from Sloping Citrus Land [39]. Film mulching has beneficial effect on maintaining the temperature and moisture required for early stage of crops, whereas it affected nutrient absorption of fertilizers in the later stage of crop growth, which caused crop senescence [40]. After 45 days, the film was removed when the crop was in a period of vigorous growth, which reduced nutrient loss in runoff and sediment, and also increased crop nutrient absorption. Based on our 4-y trial, the average nutrient loss of OHF was higher than OHFR, except the loss of NH4+-N in OHF. This may happen because film mulching promoted absorption of NH4+-N in prosperous growth period relative to film mulching removed as the loss of NH4+-N was associated with its concentration in soil [41].

4.2. Factors Affecting Nutrient Losses

Factors that affect nutrient losses include rainfall, runoff, corresponding sediment, fertilizer application, soil pH, and soil nutrient contents (e.g., soil TN and TP). Based on our 4-y trial, different forms of N and P nutrients losses were positively (p < 0.01) correlated with the annual runoff and sediment (Figure 8). As a key drive factor, rainfall caused runoff and soil erosion in rain-fed agriculture areas. Our study showed that runoff depth was positively correlated with rainfall (Figure 5). Nitrogen and phosphorus as essential elements of soil are prone to loss through runoff. The amount of nutrient loss, therefore, is directly proportional to the amount of runoff and sediment [42]. However, cultivation pattern of HR group significantly reduced runoff volume and sediment amount, contributing to relatively less influence of rainfall on nutrient losses than other factors (Figure 5, Figure 6 and Figure 7).
The between-treatment variations of N and P concentrations in runoff and sediment were much lower than those of annual runoff discharge and sediment yield. For example, the ranges of TN and TP concentrations in runoff were 4.04 ± 1.06–4.84 ± 2.43 mg·L−1 and 0.56 ± 0.24–0.64 ± 0.32 mg·L−1, respectively, while the ranges of annual runoff discharge were 177.13 ± 28.87–373.64 ± 5.43 mm (Table 4). Our results confirmed a previous study, which found that nutrient loss in runoff was dominated by runoff volume but not by nutrient concentration [7]. Likewise, this study also showed that the nutrient loss in sediment was dominated by sediment yield rather than associated nutrient concentrations. However, there were a few cases when the runoff discharge or sediment yield were comparable between treatments, nutrient concentration in runoff or sediment could be important to determining the relative quantity of nutrient losses (Figure 3).
Fertilizer applied in soil, surplus nutrient may affect N, P concentrations in runoff after absorbed by crops [20]. In this trial, treatments had the same fertilizer input, except NVF, thus there were small correlations between fertilizer and soil nutrient loss in this study (Figure 8). Soil pH, as the third important and significant (p < 0.01) factor, affected the release of nutrient (N,P) in the soil and plant absorption of available nutrients; thus, affecting nutrient losses via runoff and sediment [29]. In acid soils (low soil pH 5.64), nitrogen was easy to be absorbed by crops and was also prone to loss through runoff. Our study showed that TN was lost mainly through runoff transport. TN loss through runoff were 7.58–17.91 kg·ha−1, while TN loss through sediment were 3.53–12.42 kg·ha−1 for the four treatments (Figure 3a,c).On the other hand, Fe-P and Al-P are formed as a result of P adsorption, fixation and precipitation by activated iron and aluminum in low soil pH. This reduces the effectiveness of soil P [29]. We found that TP was lost mainly through sediment transport. Average TP loss through runoff were 1.00–2.38 kg·ha−1, while TP loss through sediment were 2.59–7.49 kg·ha−1 for the four treatments (Figure 3b,d).

5. Conclusions

Long-term in situ observations provided scientific supports for implementing cultivation pattern (horizontal ridge, optimizing fertilizer application, film removed at suitable time). Nutrient losses through both runoff and sediment were quantified in sloping farmlands under the combined cultivation patterns. Horizontal ridge (HR) group significantly decreased nutrient losses compared with vertical ridge (VR) group. The HR group effectively reduced erosion and nutrient losses by intercepting surface runoff discharge and sediment yield from sloping farmland on red soil. TN was lost mainly through runoff transport, while TP was lost mainly through sediment transport. TDN and TDP were the dominant nutrient forms of N and P loss through runoff, respectively.
Sediment, runoff, and soil pH were the three key factors to explain nutrient losses through runoff and sediment. The risk of nitrogen loss was higher than phosphorus loss in runoff, while the opposite was true in sediment. Soil pH and rainfall showed greater correlations with nutrient loss through runoff than through sediment. Soil TN and TP had higher correlation with nutrient loss in sediment; however, fertilizer had relatively low correlation with nutrient loss in runoff and sediment.
Our study suggested that combined cultivation pattern of HR group reduced soil erosion and nutrient loss significantly (p < 0.05) from sloping farmland on red soil in southwestern China. The combination of optimizing fertilizer application, horizontal ridge, and film removed (OHFR) consistently outperformed other patterns in reducing nutrient losses, and also it benefits for sustainable development of mountain agriculture. Therefore, the OHFR is recommended to be applied in sloping lands for mitigating nutrient losses.

Author Contributions

Y.-T.M. and A.-Q.C. performed experiments; Y.-T.M., W.H. analyzed data and wrote the manuscript; H.W.C., H.-J.D., and S.W. participated the discussion of data analysis and paper writing; B.-K.L. designed the experiments and developed ideas for paper writing; M.-T.H. provided climate data. All authors have read and agreed to the published version of the manuscript.

Funding

This research was funded by [National Natural Science Foundation of China], grant number [31960635; 31760610; 31560583], [Yunnan Provincial Research Foundation for Basic Research, China(2019)], [National Monitoring Network of Agricultural Nonpoint Sources Pollution] and [China Scholarship Council of 2018 (CSC)]. And The APC was funded by [31760610].

Acknowledgments

The authors express deep gratitude to Postgraduates Liyan Wang and Fengchao Ping for their help with lab experiments and field experiments.

Conflicts of Interest

The authors declare no conflict of interest.

References

  1. Garrity, D.P.; Sajise, P.E. Sustainable land use systems research in Southeast Asia: A regional assessment. In Sustainable Land Use Systems Research and Development; Rodale Press: Emmaus, PA, USA, 1992; pp. 59–76. [Google Scholar]
  2. Vien, T.D.J.; Leisz, S.; Lam, N.T.; Rambo, A.T. Using Traditional Swidden Agriculture to Enhance Rural Livelihoods in Vietnam’s Uplands. Mt. Res. Dev. 2006, 26, 192–196. [Google Scholar] [CrossRef]
  3. Partap, T. Hill agriculture: Challenges and opportunities. Indian J. Agric. Econ. 2011, 66, 33–52. [Google Scholar]
  4. Li, P.; Li, H.; Yang, G.; Zhang, Q.; Diao, Y. Assessing the hydrologic impacts of land use change in the Taihu Lake Basin of China from 1985 to 2010. Water 2018, 10, 1512. [Google Scholar] [CrossRef] [Green Version]
  5. De Jesús-Crespo, R.; Newsom, D.; King, E.G.; Pringle, C. Shade tree cover criteria for non-point source pollution control in the Rainforest Alliance coffee certification program: A snapshot assessment of Costa Rica’s Tarrazú coffee region. Ecol. Indic. 2016, 66, 47–54. [Google Scholar] [CrossRef]
  6. Cosentino, S.L.; Copani, V.; Scalici, G.; Scordia, D.; Testa, G. Soil erosion mitigation by perennial species under Mediterranean environment. Bioenergy Res. 2015, 8, 1538–1547. [Google Scholar] [CrossRef]
  7. Guo, S.F.; Zhai, L.M.; Liu, J.; Liu, H.B.; Chen, A.Q.; Wang, H.Y. Cross-ridge tillage decreases nitrogen and phosphorus losses from sloping farmlands in southern hilly regions of China. Soil Tillage Res. 2019, 191, 48–56. [Google Scholar] [CrossRef]
  8. Guo, Y.; Liu, S.; Baetz, B.W. Probabilistic rainfall-runoff transformation considering both infiltration and saturation excess runoff generation processes. Water Resour. Res. 2012, 48, 6513. [Google Scholar] [CrossRef] [Green Version]
  9. Yang, J.L.; Zhang, G.L.; Shi, X.Z.; Wang, H.J.; Cao, Z.H.; Ritsema, C.J. Dynamic changes of nitrogen and phosphorus losses in ephemeral runoff processes by typical storm events in Sichuan Basin, Southwest China. Soil Tillage Res. 2009, 105, 292–299. [Google Scholar] [CrossRef]
  10. Xia, Y.F.; Zhang, M.; Tsang, D.C.W.; Geng, N.; Lu, D.B.; Zhu, L.F.; Igalavithana, A.D.; Dissanayake, P.D.; Rinklebe, J.; Yang, X.; et al. Recent advances in control technologies for non-point source pollution with nitrogen and phosphorous from agricultural runoff: Current practices and future prospects. Appl. Biol. Chem. 2020, 63, 1–13. [Google Scholar] [CrossRef]
  11. Xu, W.; Cai, Y.P.; Rong, Q.Q.; Yang, Z.F.; Li, C.H.; Wang, X. Agricultural non-point source pollution management in a reservoir watershed based on ecological network analysis of soil nitrogen cycling. Environ. Sci. Pollut. Res. 2018, 25, 9071–9084. [Google Scholar] [CrossRef]
  12. Zhang, B.L.; Cui, B.H.; Zhang, S.M.; Wu, Q.Y.; Yao, L. Source apportionment of nitrogen and phosphorus from non-point source pollution in Nansi Lake Basin, China. Environ. Sci. Pollut. Res. 2018, 25, 19101–19113. [Google Scholar] [CrossRef] [PubMed]
  13. Ma, X.; Li, Y.; Li, B.; Han, W.; Liu, D.; Gan, X. Nitrogen and phosphorus losses by runoff erosion: Field data monitored under natural rainfall in Three Gorges Reservoir Area, China. Catena 2016, 147, 797–808. [Google Scholar] [CrossRef]
  14. Fan, J.; Yan, L.J.; Zhang, P.; Zhang, G. Effects of grass contour hedgerow systems on controlling soil erosion in red soil hilly areas, Southeast China. Int. J. Sediment Res. 2015, 30, 107–116. [Google Scholar] [CrossRef]
  15. Vinten, A.J.; Loades, K.; Addy, S.; Richards, S.; Stutter, M.; Cook, Y.; Watson, H.; Taylor, C.; Abel, C.; Baggaley, N.; et al. Assessment of the use of sediment fences for control of erosion and sediment phosphorus loss after potato harvesting on sloping land. Sci. Total Environ. 2014, 468, 1234–1244. [Google Scholar] [CrossRef]
  16. Liu, Y.; Tao, Y.; Wan, K.Y.; Zhang, G.S.; Liu, D.B.; Xiong, G.Y.; Chen, F. Runoff and nutrient losses in citrus orchards on sloping land subjected to different surface mulching practices in the Danjiangkou Reservoir area of China. Agric. Water Manag. 2012, 110, 34–40. [Google Scholar] [CrossRef]
  17. Zhang, B.L. Impact on mountainous agricultural development in the Three Gorges Reservoir Area forced by migrants of the Three Gorges Project. Chin. J. Popul. Res. Environ. 2008, 6, 83–89. [Google Scholar]
  18. Adhikary, P.P.; Hombegowda, H.C.; Barman, D.; Jakhar, P.; Madhu, M. Soil erosion control and carbon sequestration in shifting cultivated degraded highlands of eastern India: Performance of two contour hedgerow systems. Agrofor. Syst. 2017, 91, 757–771. [Google Scholar] [CrossRef]
  19. Angima, S.D.; Stott, D.E.; O’Neill, M.K.; Ong, C.K.; Weesies, G.A. Use of calliandra-Napier grass contour hedges to control erosion in central Kenya. Agric. Ecosyst. Environ. 2002, 91, 15–23. [Google Scholar] [CrossRef]
  20. Dabney, S.M.; Wilson, G.V.; McGregor, K.C.; Vieira, D.A.N. Runoff Through and Upslope of Contour Switchgrass Hedges. Soil Sci. Soc. Am. J. 2012, 76, 210–219. [Google Scholar] [CrossRef]
  21. Mutegi, J.K.; Mugendi, D.N.; Verchot, L.V.; Kungu, J.B. Impacts of vegetative contour hedges on soil inorganic-N cycling and crosional losses in Arable Steep-lands of the Central Highlands of Kenya. In Advances in Integrated Soil Fertility Management in Sub-Saharan Africa: Challenges and Opportunities; Springer: Dordrecht, The Netherlands, 2007; pp. 679–689. [Google Scholar]
  22. Xia, L.Z.; Liu, G.H.; Ma, L.; Yang, L.Z.; Li, Y.D. The effects of contour hedges and reduced tillage with ridge furrow cultivation on nitrogen and phosphorus losses from sloping arable land. J. Soil Sediment 2014, 14, 462–470. [Google Scholar] [CrossRef]
  23. Wang, T.; Zhu, B.; Xia, L.Z. Effects of contour hedgerow intercropping on nutrient losses from the sloping farmland in the Three Gorges area, China. J. Mt. Sci. Engl. 2012, 9, 105–114. [Google Scholar] [CrossRef]
  24. Xia, L.; Hoermann, G.; Ma, L.; Yang, L. Reducing nitrogen and phosphorus losses from arable slope land with contour hedgerows and perennial alfalfa mulching in Three Gorges Area, China. Catena 2013, 110, 86–94. [Google Scholar] [CrossRef]
  25. Liu, H.T.; Yao, L.; Lin, C.W.; Wang, X.; Xu, W.Z.; Wang, H. 18-year grass hedge effect on soil water loss and soil productivity on sloping cropland. Soil Tillage Res. 2018, 177, 12–18. [Google Scholar] [CrossRef]
  26. Yang, J.; Zheng, H.; Chen, X.; Shen, L. Effects of tillage practices on nutrient loss and soybean growth in red-soil slope farmland. Int. Soil Water Conserv. Res. 2013, 1, 49–55. [Google Scholar]
  27. Zhang, J.H.; Frielinghaus, M.; Tian, G.; Lobb, D.A. Ridge and contour tillage effects on soil erosion from steep hillstopes-in the Sichuan Basin, China. J. Soil Water Conserv. 2004, 59, 277–284. [Google Scholar]
  28. Singh, S.; Brandenburg, N.; Ahiablame, L.; Gonzalez, A.; Kjaersgaard, J.; Trooien, T.P.; Kumar, S. Response of Winter Manure Application on Surface Runoff Water Quantity and Quality from Small Watersheds in South Dakota. Water Air Soil Pollut. 2017, 228, 389. [Google Scholar] [CrossRef]
  29. Wilson, M.J.; He, Z.L.; Yang, X.E. The Red Soils of China: Their Nature, Management and Utilization; Springer: Dordrecht, The Netherlands, 2004. [Google Scholar]
  30. Peel, M.C.; Finlayson, B.L.; McMahon, T.A. Updated world map of the Köppen–Geiger climate classification. Hydrol. Earth Syst. Sci. 2007, 11, 1633–1644. [Google Scholar] [CrossRef] [Green Version]
  31. American Public Health Association. Standard Methods for the Examination of Water and Wastewater, 20th ed.; American Public Health Association: Washington, DC, USA, 1998. [Google Scholar]
  32. Murphy, J.; Riley, J.R. A modified single solution method for the determination of phosphate in natural waters. Anal. Chim. Acta 1962, 27, 31–36. [Google Scholar] [CrossRef]
  33. Olsen, S.R.; Sommers, L.E. Methods of Soil Analysis, Part 2; Pages, A.L., Ed.; American Society of Agronomy Inc.: Madison, WI, USA, 1982; pp. 403–429. [Google Scholar]
  34. Bao, S.D. Agro-Chemical Analysis of Soil (Third Version); Agricultural Publish House of China: Beijing, China, 2000; pp. 1–150. (In Chinese) [Google Scholar]
  35. Pu, Y.L.; Xie, D.T.; Lin, C.W.; Wei, C.F. Characteristics of soil comprehensive anti-erodibility under sloped cropland with hedgerows. Trans. Chin. Soc. Agric. Eng. 2013, 29, 125–135. (In Chinese) [Google Scholar]
  36. Sun, H.; Tang, Y.; Xie, J. Contour hedgerow intercropping in the mountains of China: A review. Agrofor. Syst. 2008, 73, 65–76. [Google Scholar] [CrossRef]
  37. Bouraima, A.K.; He, B.; Tian, T. Runoff, nitrogen (N) and phosphorus (P) losses from purple slope cropland soil under rating fertilization in Three Gorges Region. Environ. Sci. Pollut. Res. Int. 2016, 23, 4541–4550. [Google Scholar] [CrossRef] [PubMed]
  38. Fu, X.L.; Shao, M.A.; Wei, X.R.; Horton, R. Effects of two perennials, fallow and millet on distribution of phosphorous in soil and biomass on sloping loess land, China. Catena 2009, 77, 200–206. [Google Scholar] [CrossRef]
  39. Xia, L.Z.; Liu, G.H.; Wu, Y.H.; Ma, L.; Li, Y.D. Protection Methods to Reduce Nitrogen and Phosphorus Losses from Sloping Citrus Land in the Three Gorges Area of China. Pedosphere 2015, 25, 478–488. [Google Scholar] [CrossRef]
  40. Liu, Y.F.; Xie, Y.H.; Li, T.L. Overview of effect of film mulching on crop yield and soil moisture in dry land. J. Shanxi Agric. Sci. 2018, 46, 461–465. (In Chinese) [Google Scholar]
  41. Ren, R. Influence of Different Plastic Film Mulching Ways on Nitrogen Leaching in Danjiangkou Reservoir Area, China; Hubei University: Wuhan, China, 2018; pp. 37–38. (In Chinese) [Google Scholar]
  42. Wei, W.; Chen, L.D.; Fu, B.J.; Lü, Y.H.; Gong, J. Responses of water erosion to rainfall extremes and vegetation types in a loess semiarid hilly area, NW China. Hydrol. Process. 2009, 23, 1780–1791. [Google Scholar] [CrossRef]
Figure 1. Photos and location of the long-term experiment plots for four treatments.
Agronomy 10 01071 g001
Figure 2. Annual runoff depth (a) and sediment loss (b) from trial plots during 2014–2017. Error bars represent ± standard errors.
Agronomy 10 01071 g002
Figure 3. Annual total nitrogen (a and c) and total phosphorus loss (b and d) in runoff and sediment from trial plots during 2014–2017. Error bars represent ±standard errors.
Agronomy 10 01071 g003
Figure 4. Different forms of nitrogen (TDN (a), NH4+-N (b), and NO3-N (c)) and phosphorus (TDP) loss (d) in runoff from trial plots during 2014–2017. Error bars represent ± standard errors.
Agronomy 10 01071 g004
Figure 5. Linear regressions of runoff depth and rainfall under four treatments.
Agronomy 10 01071 g005
Figure 6. Linear regressions of annual TN losses and sediment yield.
Agronomy 10 01071 g006
Figure 7. Linear regressions of annual TP losses and sediment yield.
Agronomy 10 01071 g007
Figure 8. Redundancy analysis (RDA) analysis of environmental factors of nitrogen and phosphorus nutrient loss for different treatments. The nutrient loss was indicated in blue text, including total nitrogen (RTN), total dissolved nitrogen (RTDN), nitrate nitrogen (RNO3-N), ammonium nitrogen (RNH4+-N), total phosphorus (RTP) and total dissolved phosphorus (TDP) in runoff and total nitrogen (SedTN), total phosphorus (SedTP) in sediment. Environmental factors indicated in red text included sediment, runoff, soil pH, rainfall, fertilizer, soil TN, and soil TP. Different treatments were four kinds of color circles. Subscript 1 to 4 of color circles represented 2014 to 2017.
Agronomy 10 01071 g008
Table 1. Treatments, description, and fertilizer input for the study of effects of cultivation pattern on erosion and nutrient loss from sloping land on red soil in southwestern China.
TreatmentTreatment GroupDescription of TreatmentFertilizer Input (kg·ha−1)
NP2O5K2O
NVFVRNo fertilizer application + Vertical ridge + Film covered000
OVFVROptimizing fertilizer application + Vertical ridge + Film covered122131240
OHFHROptimizing fertilizer application + Horizontal ridge + Film covered122131240
OHFRHROptimizing fertilizer application + Horizontal ridge + Film removed122131240
Note: VR (vertical ridge), HR (horizontal ridge), NVF (No fertilizer application + Vertical ridge + Film covered), OVF (Optimizing fertilizer application + Vertical ridge + Film covered), OHF (Optimizing fertilizer application + Horizontal ridge + Film covered), and OHFR (Optimizing fertilizer application + Horizontal ridge + Film removed).
Table 2. Average reduction rate (ARR) of runoff, sediment, and nutrients in different treatments during 2014–2017.
GroupVRHR
TreatmentOVFNVFOHFOHFR
ARR%runoff0.0b−3.43 ± 0.98b49.58 ± 1.35a50.99 ± 0.64a
sediment0.0b−28.00 ± 5.15c64.57 ± 1.40a72.54 ± 0.85a
TN in runoff0.0b−29.92 ± 8.61c43.30 ± 1.75a46.73 ± 3.39a
TP in runoff0.0b−26.08 ± 5.73c38.83 ± 6.51a44.04 ± 5.05a
TN in sediment0.0b−8.88 ± 5.73b48.89 ± 1.78a64.12 ± 1.28a
TP in sediment0.0b5.78 ± 2.65b51.48 ± 3.97a57.10 ± 2.51a
TDN in runoff0.0b−20.08 ± 12.39b46.11 ± 1.96a47.53 ± 3.46a
NO3-N in runoff0.0b−20.77 ± 21.25b50.43 ± 1.84a53.50 ± 0.76a
NH4+-N in runoff0.0ab−42.34 ± 16.82b46.26 ± 3.11a31.56 ± 14.61a
TDP in runoff0.0b−42.74 ± 4.28c24.55 ± 3.63a31.50 ± 5.51a
Note: Data are means ± standard errors (n = 4 years), the different lowercase letters in the same row means significant different at p < 0.05, respectively. OVF is control treatment. TN, TP, TDN, and TDP represent total nitrogen, total phosphorus, total dissolved nitrogen, and total dissolved phosphorus, respectively.
Table 3. Result of Monte Carlo permutation test for the test of environmental impact factors of nitrogen and phosphorus nutrient loss.
ParametersExplains %p Value
sediment70.90.002
runoff12.30.002
soil pH6.10.004
rainfall2.00.044
fertilizer1.70.042
soil TN0.90.338
soil TP0.50.530
Table 4. Runoff and concentration of nitrogen and phosphorus loss in runoff during 2014–2017.
GroupVRHR
TreatmentOVFNVFOHFOHFR
Runoff361.47 ±5.03 A373.64 ± 2.72A182.28 ± 16.88 B177.13 ± 14.44 B
TN 4.04 ± 0.53 A4.84 ± 1.22 A4.15 ± 0.64 A4.18 ± 0.87 A
TDN 3.07 ± 0.38 A3.50 ± 0.92 A3.06 ± 0.32 A3.14 ± 0.48 A
NO3-N 2.03 ± 0.27 A2.28 ± 0.82 A1.89 ± 0.26 A1.85 ± 0.29 A
NH4+-N0.38 ± 0.11 A0.52 ± 0.23 A0.42 ± 0.12 A0.50 ± 0.21 A
TP 0.56 ± 0.12 A0.64 ± 0.16 A0.59 ± 0.11 A0.59 ± 0.14 A
TDP 0.27 ± 0.06 A0.35 ± 0.07 A0.35 ± 0.06 A0.33 ± 0.06 A
Note: data are means ± standard errors (n = 4 years), the different capital letters in the same row means significant different at p < 0.01, respectively. OVF is control treatment. The unit of runoff depth is mm and unit of concentration is mg·L−1.

