Abstract
Grasspea (Lathyrus sativus L.) and its relatives are considered resilient legumes due to their high ability to cope with different stresses. In this study, the genetic diversity of three Lathyrus species (L. sativus, L cicera and L. ochrus) was assessed by agronomic traits and molecular markers (Simple Sequence Repeat-SSR) in order to detect accessions useful for future breeding strategies. Phenotypic traits showed a high significant variation in which 1000 seed weight (1000 SW) and protein content appeared the most discriminant, as observed by principal component analysis (PCA). SSR analysis was able to detect forty-eight different alleles with an average of 9.6 allele per locus, and a Polymorphic Information Content (PIC) and a gene diversity of 0.745 and 0.784, respectively. Cluster analysis based on agronomic traits as well as molecular data grouped accessions by species but not by geographical origin. This result was confirmed by Principal Coordinates Analysis (PCoA) and Structure Analysis as well. Moreover, genetic structure analysis revealed a high genetic differentiation between L. ochrus and the other species. Analysis of MOlecular Variance (AMOVA) displayed a greater genetic diversity within species (77%) than among them (23%). Finally, a significant positive correlation was observed between agronomic and genetic distances (Mantel’s test). In conclusion, the variability detected within accessions in each species and the differences among species may be useful to plan next breeding programs, focusing on biomass production as well as protein content.
1. Introduction
The genus Lathyrus encompass more than 160 species [1], widely distributed in the Mediterranean Basin and in temperate as well as tropical countries. Among different species, grasspea (Lathyrus sativus L.) with chickling vetch (Lathyrus cicera L.) are largely cultivated and appreciated as both food and fodder, being the cheapest source of high-quality proteins mainly in arid areas [2]. The other species in the genus such as Lathyrus ochrus L. is well known as ornamental crop [3], forage or for allowing N-enrichment and soil fixation [4].
Most Lathyrus species are diploid (2n = 14), showing similar chromosome morphology as L. sativus and L. cicera [5]. According to different classifications based on morphological analysis, in the genus Lathyrus were individuated 13 sections [6], and these classifications were further confirmed by using sequence data for internal transcribed spacer (ITS) region from chloroplastic DNA [7,8]. In particular, this last molecular method was able to detect homoplasy and hybridization events, avoiding thereby misclassification [7].
Grasspea (L. sativus) and chickling vetch (L. cicera) are classified in the Lathyrus section, whereas L. ochrus is included in Clymenum section [9]. They are also highly efficient for low input cropping systems and subsistence farming systems [10,11].
In Italy, grasspea used to be part of sustainable cropping systems in both Central and Southern regions [12]. Nowadays, its cultivation is reduced to small scale farming for household consumption being an important protein supply for animals feeding [13]. However, the neurotoxin β-N-oxalyl-L-α, β-diaminopropionic acid (β-ODAP) production in the crop, which is responsible for neurolathyrisme in humans, represent the major limiting factor for its cultivation, and breeding programs should be more effective in this respect to exploit the full potential of this grain legume.
In the past, many studies aimed to improve the spread of grasspea in Italy [14,15,16,17], focusing on identification of the most adapted germplasm by collecting and characterizing Italian grasspea landraces.
Lathyrus genus genetic diversity was so far assessed by morphological traits [12,18,19], isoenzyme polymorphism [20] and DNA based markers including RAPD and RFLP to characterize Indian and Tunisian Lathyrus species [21,22], and AFLP and ISSR to assess the genetic structure of two small collections of grasspea landraces from Central and South Italy and to analyze the genetic diversity among L. sativus and its relatives [4,19,23,24]. More recently, simple sequence repeat (SSRs) markers have been developed for Lathyrus genus and more than 470 microsatellites were selected, although only 121 were polymorphic [19,25,26,27].
The aim of this study was to assess the genetic diversity of three Lathyrus species including grasspea, which exhibited a high adaptability to semi-arid conditions, by using both agronomical traits and molecular markers. In addition, agronomic traits were evaluated for three years in order to assess the production stability in our environment. Finally, we evaluated the usefulness of 10 grasspea SSRs markers in the assessment of the genetic diversity among 40 Lathyrus accessions from diverse geographical origins highlighting the phylogenetic relationships among species (L. sativus, L. cicera and L. ochrus) and to find out the available genetic diversity and the population structure of the crop useful for planning future breeding programs.
2. Materials and Methods
2.1. Plant Material
Forty (40) Lathyrus accessions were evaluated for their agronomic performances in this study. Seeds of 13 L. sativus, 15 L. cicera and 12 L. ochrus accessions were provided by the International Center for Agriculture Research in the Dry Areas, ICARDA (Aleppo-Syria) (Table S1).
2.2. Experimental Design and Agronomic Measurements
Field experiments were carried out in three growing seasons: 2013/14, 2014/15 and 2015/16 at the experimental station of AGRARIA Department of the Università degli Studi Mediterranea of Reggio Calabria (Gallina (RC), Italy-38°10′ N, 15°45′ E, 232 m a.s.l). In the experimental station the temperature and rainfall ranged from 15 to 18 °C and from 400 to 700 mm, respectively.
The soil at the site consisted of a Typic Haploxeralfs’ (USDA): sand 51.5%, clay 33.1%, silt 15.4%, reaction 6.8 (pH in water), organic matter 1.1% (Lotti), total N 0.9‰ (Kjeldhal), assimilable P2O5 16.7 ppm (Olsen), exchangeable K2O 284.5 ppm (ammonium acetate); field capacity and wilting point 30.3% and 17.2% in dry weight, respectively.
The accessions were evaluated in a randomized complete block design with three replications. The blocks were divided in rows spaced apart 0.30 m and the hills containing one grain each were spaced 0.08 m in each row achieving a final plant density of approximately 42 plants m−2. Currently accepted management and cultural practices were used. The following six traits were recorded: day to flowering (DF, day), Biomass production (t ha−1), Grain yield (GY, t ha−1), 1000 seed weight (1000 SW, g), Harvest Index (HI) and protein content (%); the former was determined by using Kjeldahl nitrogen method (AOAC official method) estimating crude protein concentration (n = 6.25). All parameters assessed are reported in Table S2.
2.3. Enetic Diversity
2.3.1. DNA Extraction
To perform molecular analysis the seeds were sown in pots containing soil and placed in growth chamber at 25 °C. After seed germination, first leaf true, approximately 0.1 g of young leaf tissue, was ground in liquid nitrogen and the total DNA of each accession was extracted and purified by using the DNAeasy Plant Mini Kit (Qiagen). Stock solutions of DNA were resuspended in 70 µL of water (Nuclease-free water, Merk Millipore Corporation) and quantity and quality were measured using Biophotometer® D30 (Eppendorf) and stored at −20 °C.
2.3.2. Microsatellite Analysis
Ten SSR markers selected based on their high polymorphic information content (PIC) values [27] were used in the present study and their characteristics are reported in Table S3. Polymerase chain reactions (PCRs) were performed in 20 µL containing 20 ng of DNA, 1X PCR buffer (20 mM Tris-HCl pH 8.0, 100 mM KCl, 0.1 mM EDTA, 1 mM DDT, 50% glycerol, 0.5% Tween® 20, 0.5% Igepal® CA-630), 0.2 mM dNTPs (Roche), 0.32 µM reverse primer, 0.16 µM fluorescence labeled (FAM) universal M13(-21) primer and 0.16 µM forward primer with M13(−21) tail, as reported by [28]. Amplifications were performed using GeneAmp 2700 Thermal Cycler (Applied Biosystems) under different annealing temperatures (Ta), depending on the primer pairs. Amplification was preceded by a denaturing step at 94 °C for 4 min followed by 30 three-step cycles at 94 °C for 45 s, Ta for 45 s, and 72 °C for 30 s. Subsequently, dilute PCR product was added to formamide and ROX standard (Perkin-Elmer) and run on ABI PRISM 3500 Genetic Analyzer (Applied Biosystems).
2.4. Statistical Analysis
2.4.1. Agronomic Data
For each parameter, the data were analyzed by ANOVA adopting GLM procedure. Pearson’s correlation was performed using the mean of three years for each parameter. Moreover, clusGap function in R software was used to calculate the goodness of clustering. Cluster analysis was performed using Euclidean distance and Ward’s methods using hclust function, whereas Principal Component Analysis (PCA) were performed by using factoextra package based on ggplot2 package [29] both in R software v.3.4.3 [30].
Finally, the heritability was estimated on the basis of entry mean following σ2g/(σ 2g + σ 2e/r), where σ2g is the variance component due to genotypes (genotypes) and σ2e is variance components due to unexplainable error, and r is the number of replicates.
2.4.2. Molecular Data
For molecular analysis by SSR markers, electropherograms were confirmed visually using Gene Mapper v.4.1 software (Applied Biosystems). Statistical analysis including the number of alleles per locus (Na), number of effective alleles (Ne), gene diversity (H), Shannon diversity index (I) were determined using GenAlEx6 software version 6.5 [31].
Polymorphic Information Content (PIC) was also estimated as reported by Botstein et al. [32], using Cervus v. 3.0.7 software (Copyright Tristan Marshal, Field Genetic, Ltd.). Analysis of Molecular Variance (AMOVA) was also performed to analyze genetic variation among and within species [33] by Arlequin software (http://cmpg.unibe.ch/sofware/arlequin3) testing Fst by 9999 random permutations.
For genetic distance analysis based on SSR results, the allelic size data were transformed to tree similarity matrix adopting the Nei genetic distance [34]. Data were finally processed through the UPGMA algorithm method [35] for cluster analysis conducted using MEGA v. X software [36].
Genetic distances between accessions in each species based on the proportion of shared alleles were determined. Principal Coordinates Analysis (PCoA) were performed based on Fst genetic distances using GenAlEx6 software version 6.5 [31]. In addition, the genetic structure of the three species was estimated with the model-based (Bayesian) clustering by using software STRUCTURE [37]. The program was set up and run as previously reported in [38]. Then, the criterion (∆K) of Evanno et al. [39] was used to determine the most probable K value to recompense an overestimation of subgroup number by STRUCTURE. Finally, accessions with membership probabilities ≥0.90 were assigned to the corresponding subgroups, while the others (with membership <0.90) were assigned to a mixed subgroup.
To evaluate the correlation between agronomic and genetic matrices and its significance a Mantel test with 1000 permutations was performed by using package ade4 with mantel.rtest function in R software [30].
3. Results
3.1. Agronomic Traits
ANOVA showed a significant block effect for grain yield (GY) in 2013/14 and 2015/16, Harvest Index (HI) in 2014/15 and biomass in 2015/16 (Table 1). Highly significant differences (p < 0.001) were detected among Lathyrus spp. (S) for all parameters in the three-years. Significant accession effect (A) was observed for all traits, except for days to flowering (DF) in the three-years and Grain Yield (GY) in 2014/15 (Table 1). Moreover, the interaction S*A resulted significant for many traits except for biomass (2013/14), 1000 SW and GY (2014/15), whereas the interaction was not significant for DF and protein content (Table 1).

Table 1.
Analysis of variance for agronomic traits in three Lathyrus spp.
The variability within Lathyrus spp. (among accessions) for each parameter is reported in Table 2. L. sativus showed a lower 1000 SW variability (CV = 3.9%) compared to L. cicera and L. ochrus (5.6 and 6.3%, respectively). The average 1000 SW in L. sativus was 75.72 g, ranging from 71.32 g (accession 4, Ethiopia) to 81.54 g (accession 11, Ethiopia), whereas L. ochrus showed an average value of 103.51 g, ranging from 92.04 g (accession 8, Greece) to 115.89 g (accession 3, Greece) (Table S4). Finally, L. cicera was characterized by the lowest average 1000 SW (71.58 g) in which the accessions 8 (Greece) and 14 (Greece) exhibited contrasting values (64.2 and 82.04 g, respectively) (Table S4). A high 1000 SW heritability was observed in L. cicera, L. sativus and L. ochrus with 0.92, 0.88 and 0.81, respectively (Table 2).
Table 2.
Means, coefficient of variability and heritability of agro-morphological traits in three Lathyrus spp.
The coefficient of variability for GY was different among species (5.8, 8.2 and 7.1 for L. cicera, L. sativus and L. ochrus, respectively) as well as within species. The highest GY average value was detected in L. cicera (3.49 t ha−1) followed by L. sativus (2.74 t ha−1) and finally L. ochrus (2.24 t ha−1); further, the heritability appeared low in two species (0.55 and 0.46 for L. cicera and L. sativus, respectively), while L. ochrus showed a higher value (0.69) (Table 2). In detail, Ethiopia 2 (L. sativus), Australia (L. cicera) and Greece 5 (L. ochrus) were the most productive accessions (Table S4).
The highest biomass CV was detected among L. ochrus accessions with an average of 6.92 t ha−1 ranging from 6.15 (Greece 3) to 7.46 t ha−1 (Greece 5) (Table S4), whereas L. sativus and L. cicera exhibited an average of 7.57 and 8.2 t ha−1, respectively (Table 2). The heritability of this trait varied among species, L. ochrus and L. cicera showed similar values (0.68 and 0.63, respectively), whereas the lowest (0.44) was recorded in L. sativus. The averages of days to flowering (DF) were of 98.3, 96.58 and 95.81 days for L. cicera, L. sativus and L. ochrus respectively; this trait showed a high heritability (0.97, 0.97 and 0.96, respectively) and low CV values (1, 1.6 and 1.9, respectively) in all species.
Moreover, Protein content was higher in L. sativus and L. ochrus (30.67 and 30.20, respectively) respect to L. cicera (27.57); the former showed a higher heritability for this trait (0.66) compared to L. sativus (0.41) and L. ochrus (0.48) (Table 2). Finally, L. cicera recorded a higher HI (0.42) compared to L. sativus (0.36) and L. ochrus (0.33), although the latter showed the highest heritability (0.94) and CV (9.2) for this trait, followed by L. cicera (0.82–5.2, respectively) and L. sativus (0.58–5.8, respectively) (Table 2).
3.2. Correlations Among Agronomic Traits
The relationships between agronomic traits within Lathyrus spp. were also calculated by Pearson’s correlation (Table S5). Correlation coefficient between pairs of agronomic traits highlighted specific significant correlations; in detail, negative correlation between 1000 SW and DF was detected in L. sativus (−0.67) and L. cicera (−0.58) and positive correlation between GY and HI was observed in L. sativus (0.70) and L. ochrus (0.59), while 1000 SW was significantly correlated with biomass (0.87) in L. cicera. Finally, negative correlation was also observed in L. ochrus between biomass and HI (−0.58), DF and HI (−0.74) and protein content and HI (−0.71). By contrast, positive significant correlations were detected between DF and protein content (0.72) as well as between DF and biomass (0.65) in L. ochrus (Table S5).
3.3. Multivariate Analysis of the Agronomic Traits
Cluster analysis was performed based on the three-years mean for each parameter (Figure 1). The dendrogram generated using Euclidean distance and Ward’s method was able to distinguish three major groups clustered by species, and this result was also confirmed by the gap statistics method (data not shown). Cluster I (blue) included all genotypes belonging to L. cicera, which was the latest ripening species, with the best performance for GY and biomass as well as the highest HI. Cluster II (yellow) included all the L. sativus accessions, characterized by a high protein content, as well as one accession from Cyprus (O6_C) belonging to L ochrus; finally, Cluster III (orange) was represented by the remaining L. ochrus accessions characterized by high 1000 SW (Figure 1). The distances among clusters was higher between L. cicera and L. ochrus (32.67) followed by L. sativus vs. L. ochrus (26.67) and L. sativus vs. L. cicera (6.84). In addition, a higher intra-group variance was detected in L. sativus and L. ochrus (47.9 and 46.9, respectively) than in L. cicera (18.1) (data not shown). Moreover, similarities between some accessions from same geographical origin were also highlighted as L. cicera accessions from Australia and L. ochrus accessions from Cyprus (Figure 1).
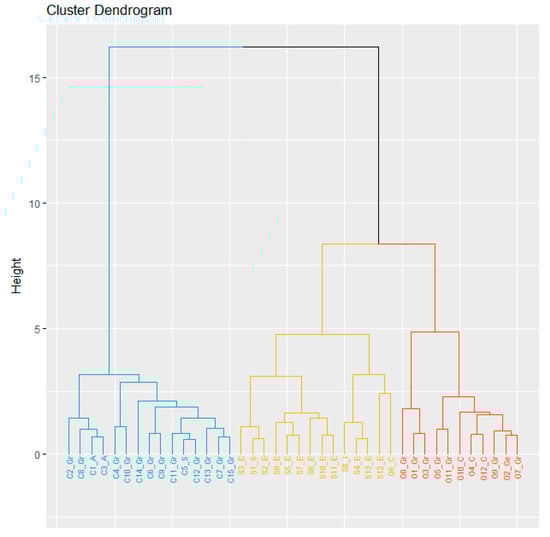
Figure 1.
Cluster analysis of forty Lathyrus accessions (C, S and O indicates L. cicera, L. sativus and L. ochrus, respectively; Gr, A, S, E, I, C and Ge indicates Greece, Australia, Syria, Ethiopia, Italy, Cyprus and Germany, respectively). Cluster analysis was performed based on agronomic traits by using Euclidean distance and Ward’s method.
Principal component analysis based on agronomic traits displayed two components contributing for 84.2% of the variability among species (Figure S1). PC1 explained 69.3% of total variance, where 1000 SW and protein content were mainly involved, whereas PC2 explained 14.9% of the variance and the traits involved were DF, HI, GY and biomass (Figure S1).
3.4. Genetic Diversity Among Species
Despite the high PIC values previously reported for the 10 selected SSR markers, only 50% of them showed polymorphism among Lathyrus accessions. SSR summary statistics and genetic parameters among 40 Lathyrus accessions are reported in Table 3.
Table 3.
Genetic diversity parameters among three Lathyrus species based on five SSR markers.
Five polymorphic SSR markers amplified a total of 48 polymorphic alleles (Na) with an average of 9.6 alleles per locus. Allele number for each locus ranged from 6 to 13 for the SSR G157 and G67, respectively. Number of effective alleles (Ne) ranged from 2.485 (G26) to 4.733 (G67) with a mean of 3.392 alleles per locus. Gene diversity (H) varied from 0.662 to 0.881 for G157 and G67, respectively with an average of 0.784 in the whole Lathyrus collection. Meanwhile, polymorphic information content (PIC), which provide an estimate of the discriminatory power of each SSR locus, ranged from 0.607 (G157) to 0.856 (G67) with an average of 0.745 (Table 3).
Shannon’s information index (I), commonly used to assess population genetic diversity, was also estimated and ranged from 1.078 (G157) to 1.571 (G67) with a mean of 1.226. A relatively important genetic differentiation was observed among 40 Lathyrus accessions with an average Fst value of 0.227 (Table 3).
3.5. Genetic Diversity Within Lathyrus Species
The genetic diversity parameters for each species are listed in Table 4. According to SSR markers analysis, L. sativus had the highest PIC (0.641) whereas L. cicera harbor the lowest one (0.528). The study also revealed that L. sativus showed the highest genetic diversity according to Shannon’s information index and gene diversity values (I = 1.492 and H = 0.694, respectively). Furthermore, 58.33% (28 alleles) of total allele number were private, of which 64.3% (18 alleles) were exclusively detected in L. sativus, and this result indicated that grasspea shared less than 50% of total alleles (34) with the other two studied species (Table 4).
Table 4.
Genetic diversity parameters within the Lathyrus species based on five SSR markers.
Finally, the genetic differentiation within the species was the highest in L. ochrus (Fst = 0.256) and the lowest in L. cicera (Fst = 0.137). These results suggested that the gene flow within L. ochrus accessions is highly limited being a strictly autogamous species by contrast with the two other species which are primarily autogamous, with some out-crossing likely.
3.6. Genetic Differentiation and Relationship Among the Three Species
Nei and Li [34] genetic distance varied from 0.635 to 1.326 among Lathyrus species (Table 5). The greatest genetic distance was observed between L. ochrus and L. cicera, contrary to L. sativus vs. L. cicera. Pairwise Fst estimates followed the trend of genetic diversity and revealed a high degree of differentiation between L. ochrus and the other Lathyrus species (Table 5).
Table 5.
Nei and Li (1979) genetic distance (belong diagonal) and Pair-wise estimates Fst (above diagonal) based on SSR markers among Lathyrus species.
Furthermore, the gene flow (Nm) showed that the major gene flow occurred between L. sativus and L. cicera with Nm = 1.139 (data not shown). Moreover, AMOVA revealed that most of the total genetic diversity was explained by within species variation (77%) (Table 6).
Table 6.
Analysis of molecular variation (AMOVA) among and within three Lathyrus species.
The clustering analysis by Unweighted Pair Group Method using the Arithmetic Averaging dendrogram (UPGMA) divided the forty accessions into two distinct groups which correlated with the sections Lathyrus and Clymenum (Figure 2A).
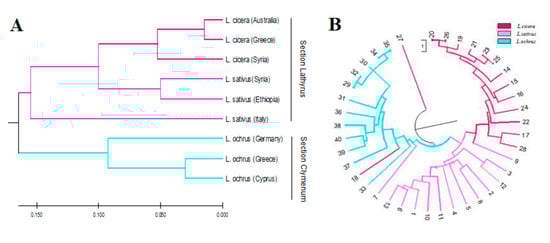
Figure 2.
(A) UPGMA cluster analysis of forty Lathyrus spp. accessions and, (B) UPGMA cluster analysis of nine populations grouped according to the geographic origin (3 L. sativus, 3 L. cicera and 3 L. ochrus) based on Nei and Li (1979) genetic distance.
The first group in red and cyclamen represented the Lathyrus section, including the accessions of the two most cultivated species aggregated in two distinct subgroups: L. cicera and L. sativus. The second group, in light blue, represented the Clymenum section, comprising all L. ochrus accessions. Interestingly, one accession of L. cicera appeared as an out-group being the most distant accession.
To further highlight the genetic relationships among accessions of different origin within each species, a second clustering analysis was based on the genetic distances among each geographic group or population (Figure 2B). The genetic distance matrix between each population pairs was computed based on Nei and Li [34] algorithm (Table S6). The UPGMA dendrogram grouped the Lathyrus accessions by species. In particular, L. cicera and L. sativus accessions clustered in the same group, even if the Italian accession appeared the most distant. The second cluster grouped all the L. ochrus accessions, in which the German accession was the most diverse compared to the others.
3.7. Genetic Structure
The genetic structure of the 13 L. sativus, 15 L. cicera and 12 L. ochrus accessions was revealed by using Structure software (Figure 3). The optimal number of genetic groups (K) was identified based on posterior probability (∆K) values. K was tested from one to ten based on the distribution of the 48 alleles at the 5 SSR loci among the 40 individuals. Structure simulation demonstrated that the highest ∆K values was at K = 3 (Figure S2). Estimated membership coefficients inferred for K = 3 for each individual is presented in Figure 3. Every accession corresponded to a vertical line which is divided into K segments. The length of each segment is proportional to the K assigned to each cluster. The results revealed three clear distinct gene pools with few admixture rates among the species. However, the accession C5_S showed more than 80% admixture indicating a frequent gene flow between this accession and the others from different clusters. However, the representation of the three clusters (Figure 3) revealed a clustering by species.
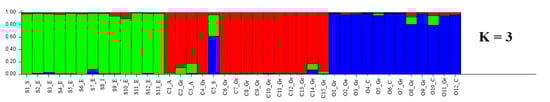
Figure 3.
Estimated population structure of the forty Lathyrus spp. accessions (K = 3). Summary plot of estimated membership of 40 individuals from 3 Lathyrus species in the three clusters (L. sativus, green; L. cicera, red; L. ochrus, blue) based on five high polymorphic SSR. C, S and O indicates L. cicera, L. sativus and L. ochrus, respectively, whereas Gr, A, S, E, I, C and Ge indicates Greece, Australia, Syria, Ethiopia, Italy, Cyprus and Germany, respectively.
Additional evidence for Lathyrus spp. genetic structure was furnished by Principal Coordinate Analysis (PCoA). This was performed to provide a spatial representation of the pair-wise estimated genetic differentiation of forty accessions and the different populations of diverse origins within Lathyrus species (Figure 4A, B). The first two principal coordinates explained 27.17% and 15.05% of total variation, respectively, and the 50.22% of the variation was explained considering the three coordinates. In agreement with cluster analysis, accessions of each Lathyrus species formed clear separated groups; however, overlap among the three species was still detected, highlighting the level of genetic admixture among the individuals, as revealed by structure analysis. Moreover, most of the accessions of the same species clustered regardless the geographic origin: L. sativus (Syria, Italy and Ethiopia); L. cicera (Australia and Syria, Greece) and L. ochrus (Germany, Greece and Cyprus). However, two Greece accessions of L. cicera and most L. ochrus accessions were defined positively by the first coordinate and negatively by the second, suggesting a genetic relatedness probably correlated to the geographic origin. In addition, most of the accessions of both species L. sativus and L. cicera were defined negatively by the first coordinate contrary to L. ochrus accessions, indicating that L. sativus and L. cicera are closely related.
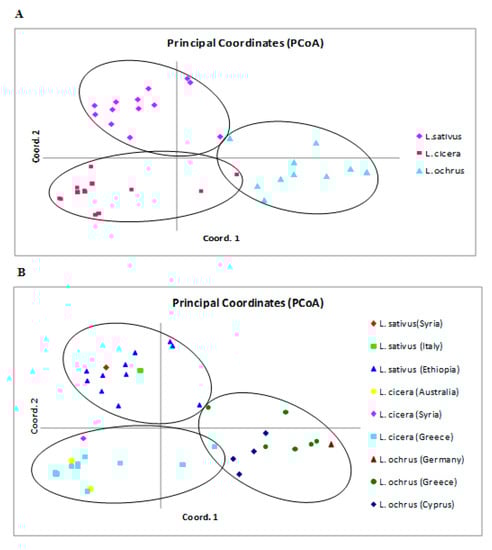
Figure 4.
A two-dimensional plot of Principal Coordinate Analysis (PCoA) based on Fst genetic distance showing the clustering of forty accessions belong three Lathyrus species, (A) according to species membership, (B) according to the geographic origin. The first two principal coordinates account for 27.17% and 15.05% of total variation, respectively.
Finally, significant correlation existed between agronomic and genetic distance tested by Mantel test (r = 0.504) (Figure S3).
4. Discussion
The cultivated Lathyrus species are considered as orphan crops. Extensively cultivated in some African and Middle East countries, they constitute a reliable resource in marginal low input agricultural ecosystems [10]. Despite the high resilience to biotic and abiotic stresses of these species combined to their high yields and their recognized nutritional values (as major source of proteins), they are still underused and neglected [11,40,41]. The aforesaid characteristics defined these crops among the most potential genetic resources for feeding future breeding programs to face the ongoing major world challenges and climate changes.
Assessing and highlighting the available genetic diversity will be useful for a wise reutilization and conservation of the Lathyrus germplasm collections. Recently, Wang et al. [27] considered the opportunity to combine grasspea and the other Lathyrus species from contrasting environments to breed for pyramiding the tolerances to extreme stresses, as drought tolerance, reproductive heat stress and salinity, according to specific target environments. Moreover, particular attention should be given to the selection of genotypes with low toxicity to reduce the risks of poisoning which is the main limiting factor to human consumption of this legume.
4.1. Morphological and Agronomic Traits
The present study aimed to compare three different Lathyrus species based on their agronomical potential in semi-arid conditions, as suggested by Wang et al. [27]. In addition, within species, accessions from different geographical origins were also evaluated. Field evaluation showed that the accessions performances within each species did not show any correlation with their geographical origin as reported in a previous study where 47 grasspea accessions were evaluated using 10 morpho-agronomic and seed quality traits [12]. Similar results were also obtained by Ahamed et al. [42] who evaluated 107 grasspea genotypes from different geographic origin, and these evidences corroborated the hypothesis that the natural distribution of Lathyrus spp. was completely disconnected from their cultivation [43]. However, the observed diversity indicates that the genetic improvement by crossing and selection is potentially possible.
Moreover, in our environment, the studied species were significantly different for1000 SW with the following hierarchy: L. ochrus > L. sativus > L. cicera, and significant differences among accessions were also detected within species. The variability observed in 1000 SW in L. sativus (CV = 3.9%), the lowest among Lathyrus species analyzed in this study, was lower compared to previous study carried out on the same species, and the authors concluded that it was probably due to the scarce variability of the genotypes [12]. On the other hand, average of protein content in L. sativus (30.67) was similar to previous studies [13,44], while it was lower in L. cicera (27.57) as previously observed by Franco Jubete [45] and Hanbury [46],
Different performances were observed for GY among Lathyrus spp. in which L. cicera accessions appeared the most productive compared to L. sativus and L. ochrus, as already reported in Australia by Hanbury et al. [47]. Moreover, this trait (GY) exhibited high CV, mainly within L. sativus accessions, suggesting the possibility of genetic selection for high yield in our environment, considering also the performance of L. cicera.
Our results pointed out that L. cicera was the latest species to flowering, considering the averages of all three species. This trait appeared hardly affected by environment (high heritability) and could represent a key trait to consider in Mediterranean-type environment thus overcoming abiotic stress [48]. In addition, the agronomic trait correlations, which indicated different responses among Lathyrus species, should be considered while planning breeding strategies [19].
Furthermore, based on the biomass production, we can state that L. sativus and L. cicera are suitable to forage and grain stockfeeds with high protein content and acceptable HI and GY, as previously reported [49,50,51].
Finally, although the selected ICARDA germplasm evaluated in the present study was characterized by relatively uniform agronomic traits, the CVs observed within Lathyrus species were comparable to previous studies [18] and suggested that this germplasm constitutes a substantial source of interesting traits to include in future breeding programs.
4.2. Genetic Diversity
In the present study, SSR markers were used to assess the genetic diversity among forty accessions belonging to three Lathyrus species of diverse geographic origins. Although microsatellites have been applied to study the genetic diversity in the genus Lathyrus, the detection of polymorphic SSR loci has been always challenging [19,25,26,27]. In contrast to previous study [27], only 5 out of 10 selected SSR markers were successfully amplified and polymorphic in our Lathyrus germplasm panel; nevertheless, the genetic diversity and the PIC-value were higher in our study. Beside the high level of genetic variability among Lathyrus species, according to Wang et al. [27] the highest genetic diversity in our study was detected in the most cultivated species (L. sativus and L. cicera).
Our investigation highlighted a high genetic polymorphism at intra-specific level (77% of the total genetic diversity), regardless the geographic origin. These results confirmed previous phylogenetic studies based on morphological/agronomic, biochemical, and molecular markers [23,52,53,54]. This is probably due to the high out-crossing rate within the populations of each species which increased the intra-specific diversity.
On the other hand, AMOVA revealed that only 23% of the total variation was due to differences among species. Thus, we obtained a larger genetic variation within species, because most of the accessions were from the two closest Lathyrus species (L. sativus and L. cicera) in contrast with the Wang et al. [27] reports. Indeed, despite the high distance between their geographic origin sites, L. sativus and L. cicera accessions appeared to be less differentiated compared to L. ochrus accessions in agreement with previous reports [4,22,23]. Chtourou-Ghorbel et al. [22] considered these two species the results of possible hybridization events or most likely to share a common ancestry during the domestication in the Middle East and spread all over the world. Interestingly, some authors reported successful inter-specific crosses between the two species [53,55].
4.3. Genetic Relationship and Population Structure
The genetic diversity clustered the accessions belonging to the Lathyrus section from those deriving from Clymenum section. Here, we highlighted a marked distance of L. ochrus accessions from those of L. sativus and L. cicera which clustered in the same group. Our results were mostly in agreement with the morphological classification of these species [6] as well as other DNA markers based classifications such as RAPD [53], RFLP [56,57], ISSR [23] and SSR [27]. Overall, the accessions included in our panel covered a wide area from South-Eastern Europe (Greece and Cyprus) to Eastern Africa (Ethiopia) and some isolated geographic sites were also represented by one or two accessions (Syria, Australia, Germany and Italy). Population structure demonstrated that Lathyrus accessions were divided into 3 populations regardless their geographic origin (K = 3). One gene pool included 13 L. sativus accessions; the second included all L. cicera accessions except one from Syria which was integrated in the third gene pool with L. ochrus accessions. These results were also supported by PCoA analysis which showed that the accessions grouping followed the specific membership.
Finally, Mantel test was performed to provide a comparison between genetic and agronomic traits, offering a significant correlation between SSR similarity matrix and agronomic traits, indicating a high correlation between markers used to detect genetic relationships.
5. Conclusions
Grasspea and its relatives are climate-resilient crops able to withstand severe dry years, as well as other abiotic stresses thus having a great potential as a multiple stress-tolerant genes source for crop oncoming improvements. In this study, we combined SSR markers and the main important agronomical traits to assess the genetic diversity and population structure in the Lathyrus genus with forty accessions belonging to three different species. In the agronomical evaluation the high potential of the three Lathyrus species was clearly emphasized in our environment with a particular attention to yield and protein content, both important parameters for animal and human nutrition. At the molecular level, the results showed a wide genetic diversity within and among the species and confirmed largely previous classifications based on other molecular markers. Inter alia, we found a clear differentiation among the species belonging to Lathyrus and Clymenum sections and confirmed the phylogenetic closeness between the most cultivated Lathyrus species: grasspea (L. sativus) and L. cicera. These results will be useful for germplasm preservation and collection’s management, and will also be helpful for new efficient breeding programs. Finally, modern molecular approaches (i.e., CRISPR-associate protein9) will allow the study of the specific mechanisms involved in stress tolerance and to accelerate breeding by specific research activities.
Supplementary Materials
The following are available online at https://www.mdpi.com/2073-4395/10/8/1182/s1, Figure S1: Principal component analysis of forty Lathyrus spp. accessions (C, S and O indicates L. cicera, L. sativus and L. ochrus, respectively; Gr, A, S, E, I, C and Ge indicates Greece, Australia, Syria, Ethiopia, Italy, Cyprus and Germany, respectively), Figure S2: Analysis of the population structure of the 40 Lathyrus spp: ∆K value related to different K, Figure S3: Mantel statistical values for the null hypothesis for the correlation between genetic and agronomic distance matrices. The red arrow shows the position of the statistical value (r (AB) = 0.504, in the zone of rejection of the null hypothesis; p < 0.05). The data in the frequency distribution curve were generated from 9999 random permutation, Table S1: Geographic origin of 40 Lathyrus accessions, Table S2: Traits measured in the evaluation of the forty (40) Lathyrus accessions from seven diverse origins in 2013/14, 2014/15 and 2015/16 seasons, Table S3: Microsatellite primer pairs (SSR), motif and expected size range used for the genetic characterization of Lathyrus collection, Table S4: Three-years means of agro-morphological traits in the accessions of three Lathyrus spp., Table S5. Pearson’s correlation between agronomic traits for each Lathyrus spp., Table S6: Nei genetic distances.
Author Contributions
M.M.A. and A.L. planned the genetic experiments; G.B., E.L.P. and G.P. planned agronomic experiments and carried out agronomic analysis; M.M.A. and A.M. carried out the genetic analysis; M.M.A. and A.L. analyzed the data; M.M.A., A.L. were involved in drafting the manuscript; A.L. and G.P. review and editing the manuscript. All authors have read and agreed to the published version of the manuscript.
Funding
This research received no external funding.
Conflicts of Interest
The authors declare no conflict of interest.
References
- Allkin, R.; Goyder, D.J.; Bisby, F.A.; White, R.J. Names and Synonyms of Species and Subspecies in the Vicieae; Issue 3. Vicieae Database Project; Southampton Universit: Southampton, UK, 1986. [Google Scholar]
- Campbell, C.G.; Mehra, R.B.; Agrawal, S.K.; Chen, Y.Z.; Abd El-Moneim, A.M.; Khawaja, H.I.T.; Yadov, C.R.; Tay, J.U.; Araya, W.A. Current status and future strategy in breeding grass pea (Lathyrus sativus). Euphytica 1993, 73, 167–175. [Google Scholar] [CrossRef]
- Shehadeh, A.; Amri, A.; Maxted, N. Ecogeographic survey and gap analysis of Lathyrus L. species. Genet. Resour. Crop. Evol. 2013, 60, 2101–2113. [Google Scholar] [CrossRef]
- Ghorbel, M.; Marghali, S.; Trifi-Farah, N.; Chtourou-Ghorbel, N. Phylogeny of Mediterranean Lathyrus species using inter simple sequence repeats markers. Acta Bot. Gall. 2014, 161, 91–98. [Google Scholar] [CrossRef]
- Ali, H.B.M.; Meister, A.; Schubert, I. DNA content, rDNA loci, and DAPI bands reflect the phylogenetic distance between Lathyrus species. Genome 2000, 43, 1027–1032. [Google Scholar] [CrossRef]
- Kupicha, F.K. The infrageneric structure of Lathyrus. Notes R. Bot. Gard. Edinb. 1983, 41, 209–244. [Google Scholar]
- Kenicer, G.J.; Kajita, T.; Pennington, R.T.; Murata, J. Systematics and biogeography of Lathyrus (Leguminosae) based on internal transcribed spacer and cpDNA sequence data. Am. J. Bot. 2005, 92, 1199–1209. [Google Scholar] [CrossRef]
- Kenicer, G.; Nieto-Blasquez, E.M.; Mikic, A.; Smykal, P. Lathyrus—diversity and phylogeny in the genus. Grain Legumes 2009, 54, 16–18. [Google Scholar]
- Kumar, S.; Bejiga, G.; Ahmed, S.; Nakkoul, H.; Sarker, A. Genetic improvement of grass pea for low neurotoxin (b-ODAP) content. Food Chem. Toxicol. 2011, 49, 589–600. [Google Scholar] [CrossRef]
- Vaz Patto, M.C.; Fernandez-Aparicio, M.; Moral, A.; Rubiales, D. Characterization of resistance to powdery mildew (Erysiphe pisi) in a germplasm collection of Lathyrus sativus. Plant. Breed. 2006, 125, 308–310. [Google Scholar] [CrossRef]
- Vaz Patto, M.C.; Skiba, B.; Pang, E.C.K.; Ochatt, S.J.; Lambein, F.; Rubiales, D. Lathyrus improvement for resistance against biotic and abiotic stresses: From classical breeding to marker assisted selection. Euphytica 2006, 147, 133–147. [Google Scholar] [CrossRef]
- Polignano, G.B.; Uggenti, P.; Alba, V.; Bisignano, V.; Della Gatta, C. Morpho-agronomic diversity in grasspea (Lathyrus sativus L.). Plant. Genet. Resour. 2005, 3, 29–34. [Google Scholar] [CrossRef]
- Hanbury, C.D.; White, C.L.; Mullan, B.P.; Siddique, K.H.M. A review of the potential of Lathyrus sativus L. and L. cicera L. grain for use as animal feed. Anim. Feed Sci. Technol. 2000, 87, 1–27. [Google Scholar] [CrossRef]
- Bozzini, A. Utilizzazione di germoplasma in alcune leguminose da granella presso il C. R. Casaccia dell’ENEA. In Proceedings of the Atti 3rd National Congress “Biodiversità: Tecnologie-Qualità”, Reggio Calabria, Italy, 16–17 June 1997; pp. 107–121. [Google Scholar]
- Tavoletti, S.; Capitani, E. Field evaluation of grass pea populations collected in the Marche region (Italy). Lathyrus Lathyrism Newsl. 2000, 1, 17–20. [Google Scholar]
- Alba, E.; Polignano, G.B.; de Carlo, D.; Mincione, A. Electrophoretic phenotypes of different enzymes in some entries of Lathyrus sativus L. Lathyrus Lathyrism Newsl. 2001, 2, 15–20. [Google Scholar]
- Granati, E.; Bisignano, V.; Chiaretti, D.; Crino, P.; Polignano, G.B. Characterization of Italian and exotic Lathyrus germplasm for quality traits. Genet. Resour. Crop. Evol 2003, 50, 273–280. [Google Scholar] [CrossRef]
- Rahman, S.; Molla, M.R.; Nazim-udDowla, M.A.N.; Rasul, M.G.; Mian, M.A.K. Assessment of Genetic Diversity in Grasspea (Lathyrus sativus L.) Genotypes using Morphological Markers. Acad. J. Plant. Sci. 2010, 3, 85–91. [Google Scholar]
- Lioi, L.; Sparvoli, F.; Sonnante, G.; Laghetti, G.; Lupo, F.; Zaccardelli, M. Characterization of Italian grass pea (Lathyrus sativus L.) germplasm using agronomic traits, biochemical and molecular markers. Genet. Resour. Crop. Evol. 2011, 58, 425–437. [Google Scholar] [CrossRef]
- Chowdhury, M.A.; Slinkard, A.E. Genetic diversity in grass pea (Lathyrus sativus L.). Genet. Resour. Crop. Evol. 2000, 47, 163–169. [Google Scholar] [CrossRef]
- Barik, D.P.; Acharya, L.; Mukherjee, A.K.; Chand, P.K. Analysis of genetic diversity among selected grasspea (Lathyrus sativus L.) genotypes using RAPD markers. Z. fur Nat. 2007, 62c, 869–874. [Google Scholar] [CrossRef]
- Chtourou-Ghorbel, N.; Lauga, B.; Combes, D.; Marrakchi, M. Comparative genetic diversity studies in the genus Lathyrus using RFLP and RAPD markers. Lathyrus Lathyrism Newsl. 2001, 2, 62–68. [Google Scholar]
- Belaid, Y.; Chtourou-Ghorbel, N.; Marrakchi, M.; Trifi-Farah, N. Genetic diversity within and between populations of Lathyrus genus (Fabaceae) revealed by ISSR markers. Genet. Resour. Crop. Evol. 2006, 53, 1413–1418. [Google Scholar] [CrossRef]
- Tavoletti, S.; Iommarini, L. Molecular marker analysis of genetic variation characterizing a grasspea (Lathyrus sativus) collection from central Italy. Plant. Breed. 2007, 126, 607–611. [Google Scholar] [CrossRef]
- Shiferaw, E.; Pe, M.; Porceddu, E.; Ponnaiah, M. Exploring the genetic diversity of Ethiopian grass pea (Lathyrus sativus L.) using EST-SSR markers. Mol. Breed. 2012, 30, 789–797. [Google Scholar] [CrossRef]
- Yang, T.; Jiang, J.; Burlyaeva, M.; Hu, J.; Coyne, C.J.; Kumar, S.; Redden, R.; Sun, X.; Wang, F.; Chang, J.; et al. Large-scale microsatellite development in grasspea (Lathyrus sativus L.), an orphan legume of the arid areas. BMC Plant. Biol. 2014, 14, 65. [Google Scholar] [CrossRef]
- Wang, F.; Yang, T.; Burlyaeva, M.; Li, L.; Jiang, J.; Fang, L.; Redden, R.; Zong, X. Genetic diversity of grass pea and its relative species revealed by SSR markers. PLoS ONE 2015, 10, e0118542. [Google Scholar]
- Schuelke, M. An economic method for the fluorescent labelling of PCR fragments. Nat. Biotechnol. 2000, 18, 233–234. [Google Scholar] [CrossRef]
- Wickham, H. Ggplot2: Elegant Graphics for Data Analysis, 2nd ed.; Springer: Berlin/Heidelberg, Germany, 2009. [Google Scholar]
- R Core Team. R: A language and environment for statistical Computing R Foundation for Statistical Computing. Available online: http://www.r-project.org/ (accessed on 8 August 2020).
- Peakall, R.O.D.; Smouse, P.E. Genalex 6: Genetic analysis in Excel. Population genetic software for teaching and research. Mol. Ecol. Notes 2006, 6, 288–295. [Google Scholar] [CrossRef]
- Botstein, D.; White, R.L.; Skolnick, M.; Davis, R.W. Construction of a genetic linkage map in man using restriction fragment length polymorphisms. Am. J. Hum. Genet. 1980, 32, 314–331. [Google Scholar]
- Excoffier, L.L.; Smouse, P.E.; Quattro, J.M. Analysis of molecular variance inferred from metric distances among DNA haplotypes: Application to human mitochondrial DNA restriction data. Genetics 1992, 131, 479–491. [Google Scholar]
- Nei, M.; Li, W.H. Mathematical model for studying genetic variation in terms of restriction endonucleases. Proc. Natl. Acad. Sci. USA 1979, 76, 5269–5273. [Google Scholar] [CrossRef]
- Sneath, P.H.A.; Sokal, R.R. Numerical Taxonomy—the Principles and Practice of Numerical Classification; W.H. Freeman: San Francisco, CA, USA, 1973. [Google Scholar]
- Kumar, S.; Stecher, G.; Li, M.; Knyaz, C.; Tamura, K. MEGA X: Molecular evolutionary genetics analysis across computing platforms. Mol. Biol. Evol. 2018, 35, 1547–1549. [Google Scholar] [CrossRef]
- Pritchard, J.K.; Stephens, M.; Donnelly, P. Inference of population structure using multilocus genotype data. Genetics 2000, 155, 945–959. [Google Scholar]
- Aci, M.M.; Lupini, A.; Mauceri, A.; Morsli, A.; Khelifi, L.; Sunseri, F. Genetic variation and structure of maize populations from Saoura and Gourara oasis in Algerian Sahara. BMC Genet. 2018, 19, 51. [Google Scholar] [CrossRef]
- Evanno, G.; Regnaut, S.; Goudet, J. Detecting the number of clusters of individuals using the software structure: A simulation study. Mol. Ecol. 2005, 14, 2611–2620. [Google Scholar] [CrossRef]
- Korus, J.; Wituak, M.; Juszczak, L.; Ziobro, R. Grass pea (Lathyrus sativus L.) starch as an alternative for cereal starches. Rheological properties and retrogradation susceptibility. J. Food Eng. 2008, 88, 528–534. [Google Scholar] [CrossRef]
- Grela, E.R.; Rybiński, W.; Klebaniuk, R.; Matras, J. Morphological characteristics of some accessions of grass pea (Lathyrus sativus L.) grown in Europe and nutritional traits of their seeds. Genet. Resour. Crop. Evol. 2010, 57, 693–701. [Google Scholar] [CrossRef]
- Ahamed, K.U.; Akhter, B.; Islam, S.M.A.S.; Moniruzzaman, M.; Alam, M.A. Genetic variability of some morphological traits in grasspea (Lathyrus sativus) germoplasm. Bull. Inst. Trop. Agr. Kyushu Univ. 2012, 35, 61–68. [Google Scholar]
- Vaz Patto, M.C.; Rubiales, D. Lathyrus diversity: Available resources with relevance to crop improvement—L. sativus and L. cicera as case studies. Ann. Bot. 2014, 113, 895–908. [Google Scholar] [CrossRef]
- Grela, E.R.; Rybinski, W.; Matras, J.; Sobolewska, S. Variabilityof phenotypic and morphological characteristics of some Lathyrus sativus L. and Lathyrus cicera L. accessions and nutritional traits of their seeds. Genet. Resour. Crop. Evol. 2012, 59, 1687–1703. [Google Scholar] [CrossRef]
- Franco Jubete, F. Los Titarros. El Cultivo de Lathyrus en Castilla y León; Junta de Castilla y León: Valladolid, Spanish, 1991. [Google Scholar]
- Hanbury, C.D. Lathyrus grain as quality animal feed. Grain Legumes 2000, 30, 10–11. [Google Scholar]
- Hanbury, C.D.; Marker, A.; Siddique, K.H.M.; Perry, M.W. Evaluation of Lathyrus Germplasm in a Mediterranean Type Environment in South-Western Australia; CLIMA Occasional Publication: Perth, Australia, 1995; Volume 8. [Google Scholar]
- Loss, S.P.; Siddique, K.H.M. Morphological and physiological traits associated with wheat yield increases in Mediterranean environments. Adv. Agron. 1994, 52, 229–276. [Google Scholar]
- Aletor, V.A.; Abd El-Moneim, A.; Goodchild, A.V. Evaluation of the seeds of selected lines of three Lathyrus spp. for β-N-oxalylamino-L-alanine (BOAA), tannins, trypsin inhibitor activity and certain in-vitro characteristics. J. Sci. Food Agric. 1994, 65, 143–151. [Google Scholar] [CrossRef]
- Abd El-Moneim, A.M.; Cocks, P.S. Adaptation and yield stability of selected lines of Lathyrus spp. under rainfed conditions in West Asia. Euphytica 1993, 66, 89–97. [Google Scholar] [CrossRef]
- Siddique, K.H.M.; Loss, S.P.; Herwig, S.P.; Wilson, J.M. Growth, yield and neurotoxin (ODAP) concentration of three Lathyrus species in Mediterranean-type environments of Western Australia. Aust. J. Exp. Agric. 1996, 36, 209–218. [Google Scholar] [CrossRef]
- Alkadi, I. Etude du Polymorphisme Biochimique de Quelques Espèces du Genre Lathyrus. Ph.D. Thesis, Université de Pau et des pays de l’Adour, Pau, France, 1993. [Google Scholar]
- Croft, A.M.; Pang, E.C.K.; Taylor, P.W.J. Molecular analysis of Lathyrus sativus L. (grass pea) and related Lathyrus species. Euphytica 1999, 107, 167–176. [Google Scholar] [CrossRef]
- Chtourou-Ghorbel, N.; Ben Brahim, N.; Boussaid, M.; Marrakchi, M. Flower pigmentation analysis in populations of Lathyrus sativus L. and Lathyrus cicera L. Ann. Inst. Nat. Rech. Agr. Tunis. 2000, 73, 3–15. [Google Scholar]
- Yunus, A.G.; Jackson, M.T.; Catty, J.P. Phenotypic polymorphism of six enzymes in the grasspea (Lathyrus sativus L.). Euphytica 1991, 55, 33–42. [Google Scholar] [CrossRef]
- Chtourou-Ghorbel, N.; Lauga, B.; Ben Brahim, N.; Combes, D.; Marrakchi, M. Genetic variation analysis in the genus Lathyrus using RADP markers. Genet. Resour. Crop. Evol. 2002, 49, 363–370. [Google Scholar] [CrossRef]
- Chtourou-Ghorbel, N.; Lauga, B.; Combes, D.; Ben Brahim, N.; Marrakchi, M. Genetic diversity in selected Lathyrus species revealed by restriction fragment length polymorphism (RFLP) markers. J. Genet. Breed. 2002, 56, 279–286. [Google Scholar]


© 2020 by the authors. Licensee MDPI, Basel, Switzerland. This article is an open access article distributed under the terms and conditions of the Creative Commons Attribution (CC BY) license (http://creativecommons.org/licenses/by/4.0/).