Article

Effect of Waterlogging Stress on Dry Matter Accumulation, Photosynthesis Characteristics, Yield, and Yield Components in Three Different Ecotypes of Peanut (Arachis hypogaea L.)

College of Agriculture, South China Agricultural University, Guangzhou 510642, China
*
Author to whom correspondence should be addressed.
These authors have contributed equally to this work.
Agronomy 2020, 10(9), 1244; https://doi.org/10.3390/agronomy10091244
Submission received: 16 July 2020 / Revised: 18 August 2020 / Accepted: 21 August 2020 / Published: 24 August 2020

Abstract

:
Waterlogging has a negative effect on peanut production, but few studies have focused on the relationship between the geographical origin and waterlogging tolerance of peanut varieties. To explore this problem, three different peanut ecotypes (Zhanhong 2, Zhongkaihua 1, and Huayu 39) were waterlogged for 5, 10, and 15 days at seedling stage (S), flowering and pegging stage (F), and pod-filling stage (P), respectively. The relationship between the ecotype and waterlogging tolerance was determined by analyzing the effects of waterlogging on dry matter accumulation, photosynthetic characteristics, yield, and the yield components of peanut. The soil and plant analysis development (SPAD), net photosynthetic rate (Pn), stomatal conductance (Gs), transpiration rate (Tr), and intercellular CO2 concentration (Ci) values in leaves decreased under waterlogging stress, which led to a significant decrease in yield and yield components. The most noticeable effect of waterlogging stress appeared at the P stage and deleterious effects increased with an extension of the duration of waterlogging, where the yield loss was mainly attributed to the decrease in the number of total pods (TP) and the number of full pods (FP). Significant relationships were found between total dry weight (TDW), leaf dry weight (LDW), pod dry weight (PDW), TP, and FP, and the waterlogging stress tolerance index (WTI). Additionally, the waterlogging tolerance of peanut ecotypes is closely related to their geographic origin, where the most waterlogging-resistant ecotype was Zhanhong 2, followed by Zhongkaihua 1 and Huayu 39. Finally, breeding backgrounds and screening indices (SPAD, Pn, dry matter accumulation, and pod characteristics) beneficial to waterlogging tolerance breeding are suggested.

1. Introduction

Waterlogging stress is an important abiotic factor constraining agricultural production. It has been estimated that over 12% of the global agricultural area is considerably affected by waterlogging stress, which results in considerable yield loss [1,2]. With the frequent occurrence of extreme climate events, the possibility of plants suffering from waterlogging is expected to greatly increase [1]. Peanut, a leguminous crop planted globally, is a major source of oil and protein for humans [3]. However, peanut plants are highly susceptible to waterlogging and long-term stress seriously affects plant growth and development, which eventually leads to considerable yield loss [4].
Waterlogging is harmful or even fatal to crops [5]. Excessive water creates an anoxic environment and inhibits the respiration and nutrient uptake of roots [6]. Additionally, the antioxidant system of leaves is destroyed under waterlogged conditions and the soil and plant analysis development (SPAD) value decreases drastically, which has a destructive impact on the photosynthetic system of chloroplasts. Therefore, the assimilation rate of CO2 becomes confined and the photosynthetic efficiency of leaves is hindered [7,8]. Consequently, the insufficient absorption of nutrients by the roots results in early leaf senescence and the decline of photosynthetic capacity, which reduces the dry matter accumulation of the plant [9]. Meanwhile, the obstruction of transportation of photosynthetic products shortens the grain filling period and the grouting rate, eventually causing a decline in yield [10,11]. Meanwhile, yield reduction can also be attributed to the decline of yield components. For instance, it has been found that the decline of yield in wheat and barley under waterlogging is mainly due to the decrease in grain number per spike [12]. Waterlogging resulted in the decrease in grain weight and, finally, the decrease in the yield in maize [13]. Previous studies have shown that the response of crops to waterlogging varied with the growth and development stages [14]. Waterlogging during the stem elongation stage of oilseed rape resulted in higher yield loss than during the floral bud appearance stage [15]. Furthermore, a field experiment revealed that the most sensitive stage of maize to waterlogging was the seedling stage, followed by the joining stage and tasseling stage [13].
Varieties from different habitats have different tolerance to the same stress [16]. To adapt to the local ecological conditions, including sunshine hours, effective accumulated temperature, rainfall, and soil nutrients, ecotypes have various morphologies, structures, and physiological and biochemical characteristics [17,18]. In diverse habitats, the regulation of endogenous stress response genes within a population is very different [19,20]. Therefore, due to the differences between tissue growth and gene regulation, ecotypes have contrasting tolerance to abiotic stresses [21,22,23]. For instance, compared with waterlogging-sensitive barley varieties, the leaves of waterlogging-sensitive varieties have been shown to have more intercellular space and better integrated chloroplast membrane structures [24]. In addition, it has been found that under waterlogging stress, the palisade parenchyma of the leaves of resistant Dendranthema was thicker, and the intercellular space developed in the spongy mesophyll was larger. Moreover, the leaves of waterlogging-tolerant Dendranthema species had higher superoxide dismutase, ascorbate peroxidase, and catalase content [25]. The overexpression of an ethylene response factor (ZmEREB180) in maize enhanced the formation of adventitious roots and the regulation of antioxidant levels, which apparently enhanced the plant survival rates under waterlogging stress [26].
Previous studies have mainly focused on the selection of waterlogging-tolerant varieties and the morphological, physiological, and genetic regulation of waterlogging-tolerant varieties; however, there have been few reports on the relationship between the waterlogging tolerance of ecotypes and their geographic origin. Therefore, we propose the following hypothesis: there are great differences in the waterlogging tolerance of peanut ecotypes from diverse habitats, and these differences are closely related to the climatic conditions (especially rainfall) in the source area. In order to verify these hypotheses, three different peanut ecotypes (Zhanhong 2, Zhongkaihua 1, and Huayu 39 peanut ecotypes; these three varieties are the main cultivated varieties in Zhanjiang, Guangzhou, and Jinan, respectively) were selected and waterlogged for 5, 10, and 15 days at the S, F, and P stage, respectively. By determining the plant photosynthetic characteristics, dry matter accumulation, and yield characteristics at the harvest stage after waterlogging, we explored the following questions. (1) What is the impact of waterlogging on the photosynthetic characteristics, dry matter accumulation, yield, and yield components of peanuts and which is the most critical growth stage, in terms of waterlogging, in peanut? (2) What is the relationship between the tolerance of varieties and habitats, in order to provide strategies for waterlogging tolerance evaluation and breeding?

2. Materials and Methods

2.1. Plant Material and Growth Conditions

The Zhanhong 2, Zhongkaihua 1, and Huayu 39 peanut ecotypes were selected as experimental materials, and experiments were carried out in 2019, from March to July. The geographical origins of the three peanut ecotypes and their climate characteristics are shown in Table 1. Field experiments were conducted in the farm of the South China Agricultural University in Guangzhou (113°21′ E, 23°09′ N), Guangdong Province, PR China. The test site had a sub-tropical monsoon climate. Average monthly maximum and minimum temperatures during the tests were 37.0 and 12.0 °C and the total rainfall was 1116 mm (Figure 1). Waterlogging treatments were implemented for 5, 10, or 15 days at different growth stages, including the S stage (when there were four leaves on the main stem of the plant), the F stage (more than 50% of the plants had flowered and needled), and the P stage (from the beginning of the seed to the full seed). Details of the experimental design are listed in Table 2. The water surface was kept 2 cm above the soil surface and the control treatments (CK) were maintained in the best condition throughout the growth period. A completely randomized design was adopted, each treatment was repeated three times, each test plot was 2 × 2 m, the plant density was 225,000 plants per ha, and the soil layer of each plot was 50 cm. A waterproof cloth was placed under the soil layer, in order to prevent mutual influence among the plots and to ensure that the water did not leak during the treatment. Standard agronomic management practices were implemented to control diseases, weeds, and pests. Except for the period of waterlogging, the soil relative water content in the field was maintained at about 75% (by measuring soil gravimetric water content every day and adding the lost water to the pots) during other growth stages. During the P stage, plants of Zhongkaihua 1 died during the growth process after 15 days treatment, and the plants of Huayu 39 died during the growth process after 10 days and 15 days of treatment.

2.2. Determination of Dry Matter Accumulation

Five representative plant samples were obtained from each plot at the harvest stage. They were separated into roots, stems, leaves, and pods and dried at 105 °C for 30 min followed by 80 °C until they reached a constant dry weight. The total dry weight (TDW), root dry weight (RDW), stem dry weight (SDW), leaf dry weight (LDW), pod dry weight (PDW), per plant, root-shoot ratio (RSR), and harvest index (HI) were recorded.

2.3. Determination of SPAD Value and Gas Exchange Parameters

On the day at the end of the waterlogging treatments (5, 10, and 15 days) during the S, F, and P stages, the SPAD value in the functional leaves of the main stem (i.e., from the top of the main stem to the base of the stem, the third open leaf) was measured using a chlorophyll meter (SPAD-502; Konica Minolta Sensing, Inc., Osaka, Japan). Three functional leaves were measured in each plot. The datum of one plot was a replicate, and each treatment contained three replicates. Meanwhile, the photosynthetic parameters, including the Pn, Gs, Tr, and Ci of the functional leaves of the main stem, were measured using an LI-6400 portable photosynthesis system (LI-COR, Lincoln, NE, USA), which was installed in a 6 cm2 leaf area chamber. Five representative samples from each treatment were measured at approximately 9:00 a.m.–11:00 a.m. on a sunny and windless day. These parameters were determined under a CO2 concentration of 400 µmol mol−1 and a light intensity of 1400 µmol m−2 s−1.

2.4. Determination of Yield and Yield Components

Ten representative plant samples from each treatment were obtained at the physiological maturity stage to determine the yield and yield components, including the number of total pods (TP), the number of full pods (FP), and the hundred pods weight (HP). The pods picked from each plant were air-dried to calculate the yield per ha (YH) with the density of 225,000 plants per ha.
The waterlogging stress tolerance index (WTI) was calculated using the following formula [27,28]:
WTI = Yc ∗ Yw/(Ys)2,
where Yc and Yw are the yields per plant of the treatments under the control and stressed conditions, respectively, and Ys is the average yield per plant of each ecotype without waterlogging treatment.

2.5. Statistical Analysis

The software package SPSS 16.0 (SPSS., Chicago, IL, USA) was used for all statistical analyses. All data are the means of three replicates (n = 3). Comparisons among multiple groups were performed using Fisher’s protected least significant difference (LSD) test. Probability values p < 0.05 were considered statistically significant.
Principal component analysis (PCA) is a multivariate statistical technique which can be used to identify the most significant traits in a data set. This method reduces the dimension of the data, transforms the original variables into new effective principal components, and retains the total variation, as much as possible, using only a few principal components. PCA was used to study the relationships among different peanut ecotypes. The average value was used to create a correlation matrix, from which the normalized principal component scores were extracted, and the principal component scores with eigenvalues greater than 1.00 were selected. The correlation coefficients between the original traits and each trait were calculated, and the scatter plot was drawn in Origin 2017, according to PC1 and PC2.

3. Results

3.1. Waterlogging-Stress Tolerance Index

As can be seen from Figure 2, the WTI in three ecotypes decreased with the increase in duration in different growth stages. Among them, the minimum value of WTI was found at the P stage in the three peanut ecotypes, which suggested that the P stage in peanut might be more sensitive to waterlogging stress.

3.2. Dry Matter Accumulation

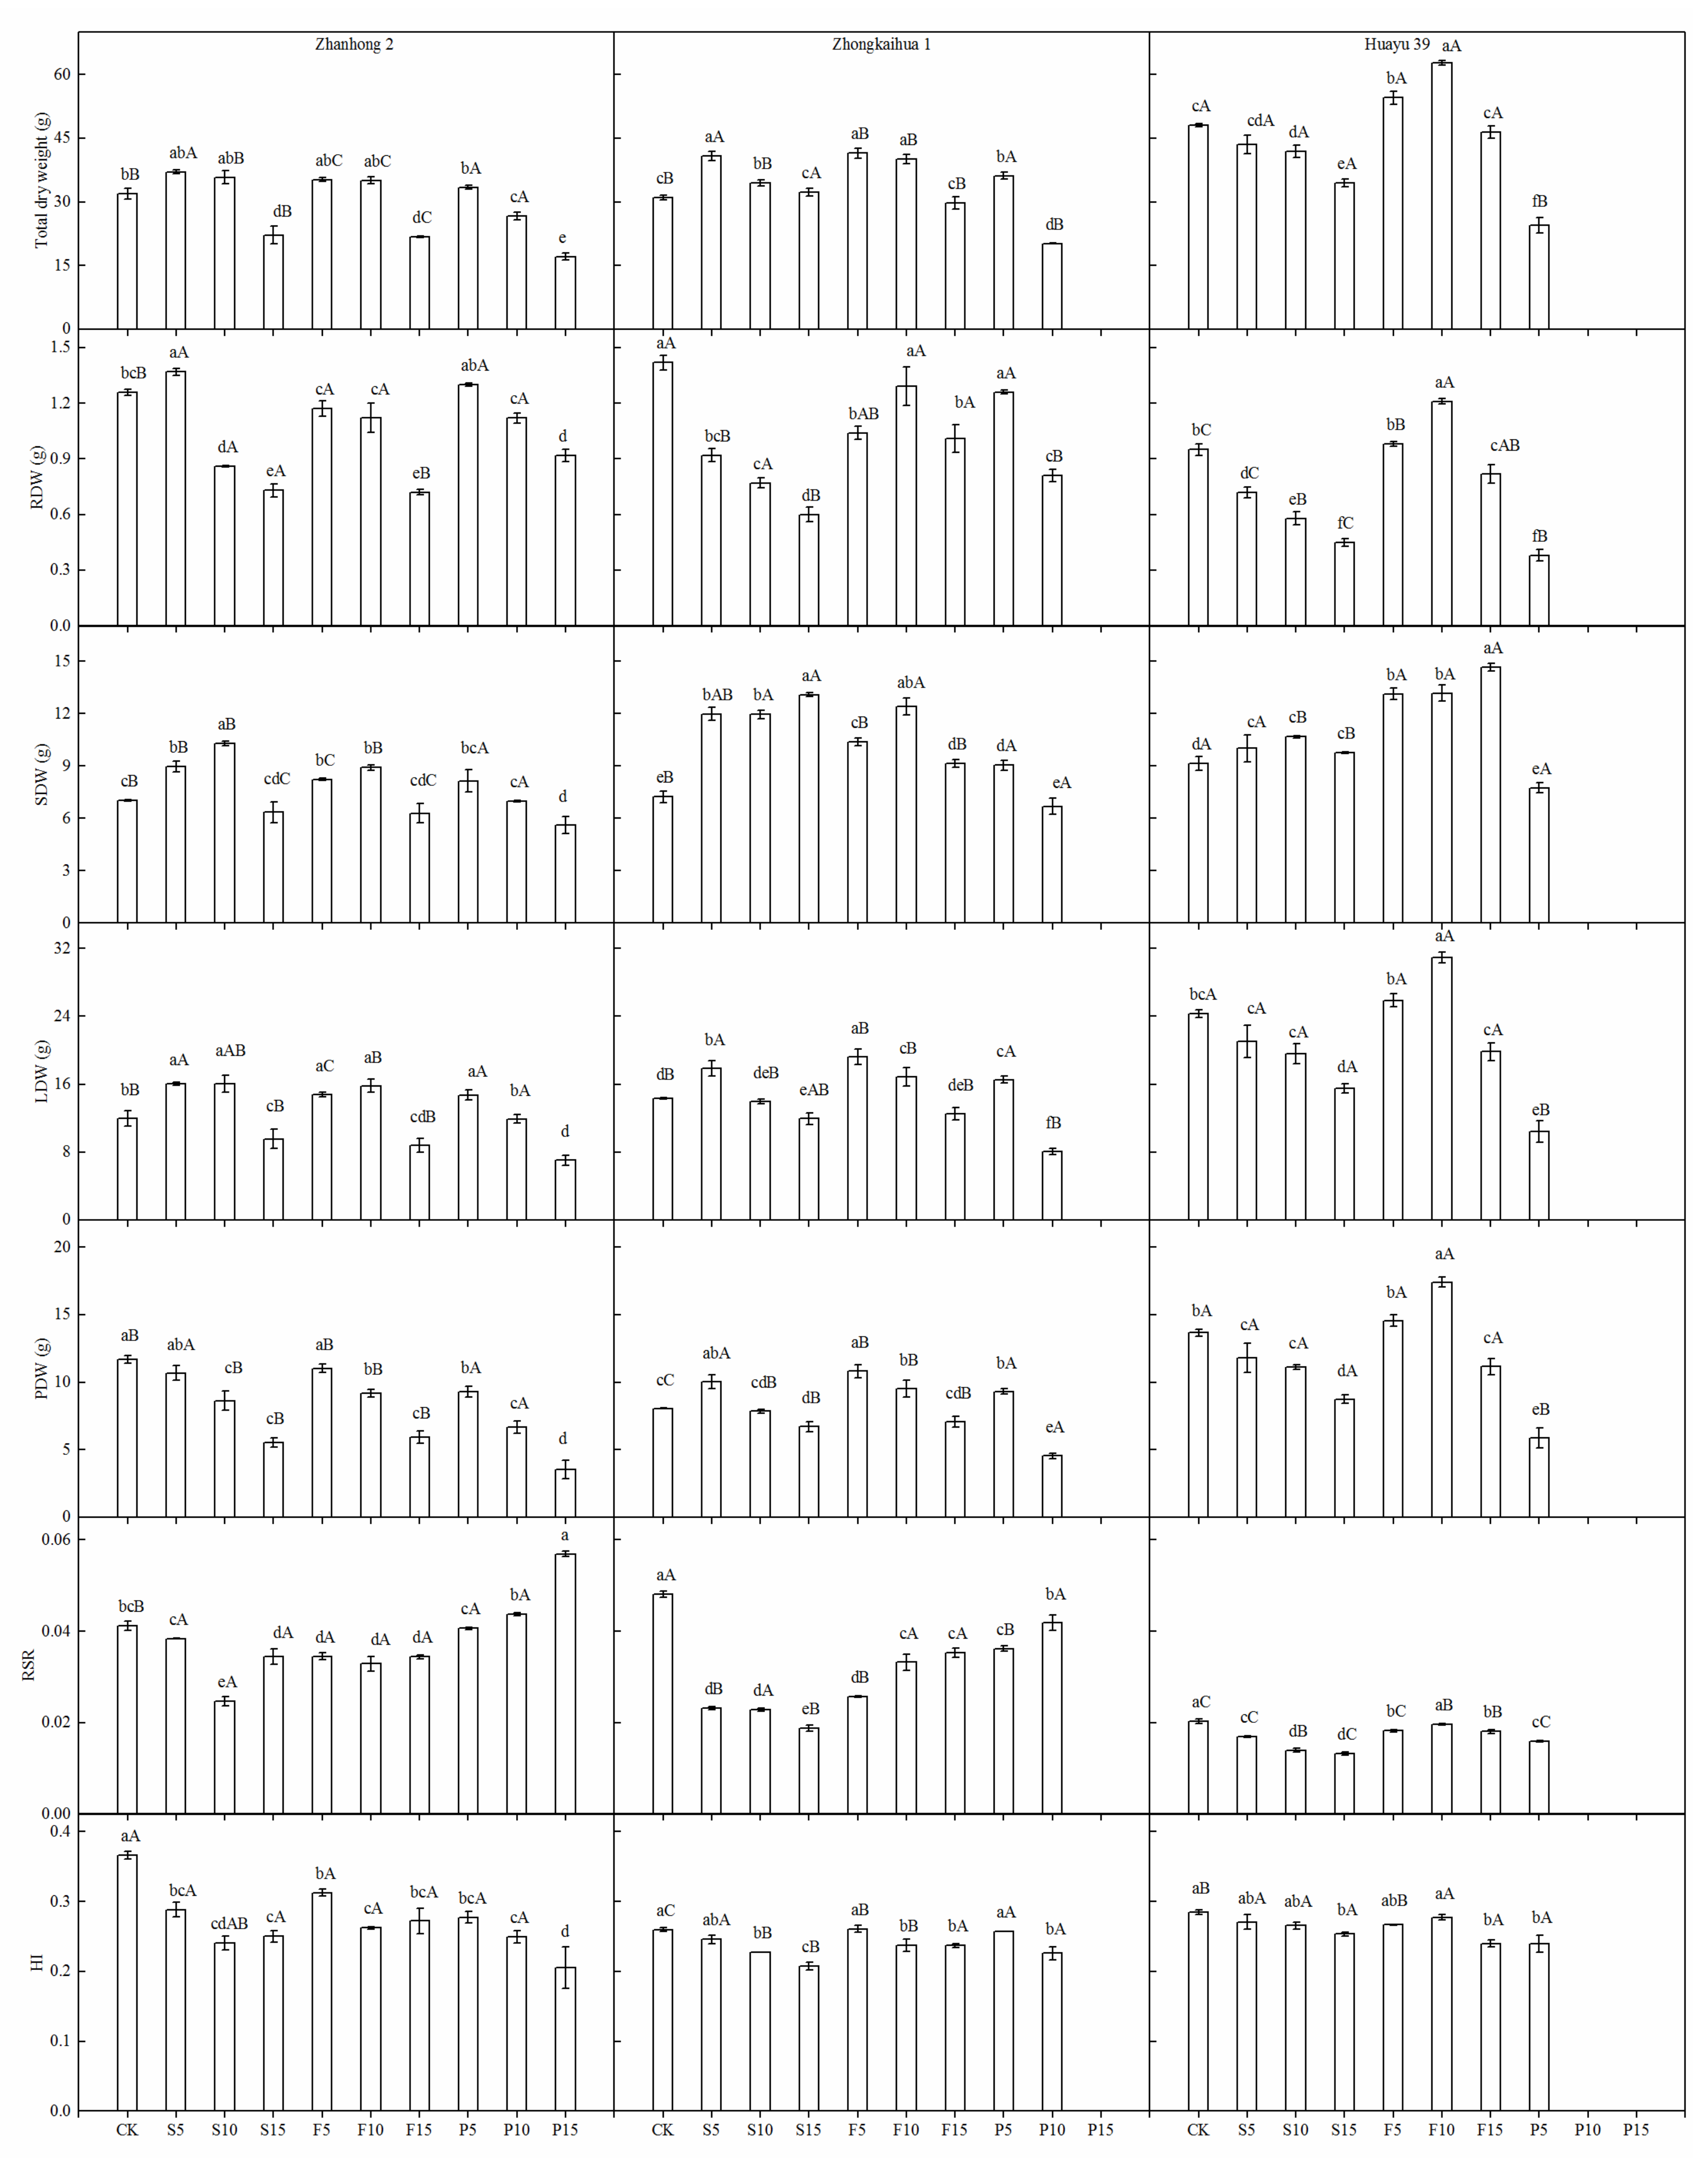
The adverse effects of waterlogging on dry matter accumulation during harvest are presented in Figure 3. Waterlogging stress at different growth stages reduced the PDW of Zhanhong 2, which decreased with an increase in duration. For Zhongkaihua 1, waterlogging for 5 days at the S stage increased the PDW by 19.74% and waterlogging at the F stage also provoked an increase in its PDW. Furthermore, at the F stage, waterlogging for 5 and 10 days increased the PDW of Huayu 39; while, with waterlogging for 15 days, the PDW decreased. However, the ratios of PDW to TDW (Supplementary Figure S1) and HI were reduced with the elongation of waterlogging time.
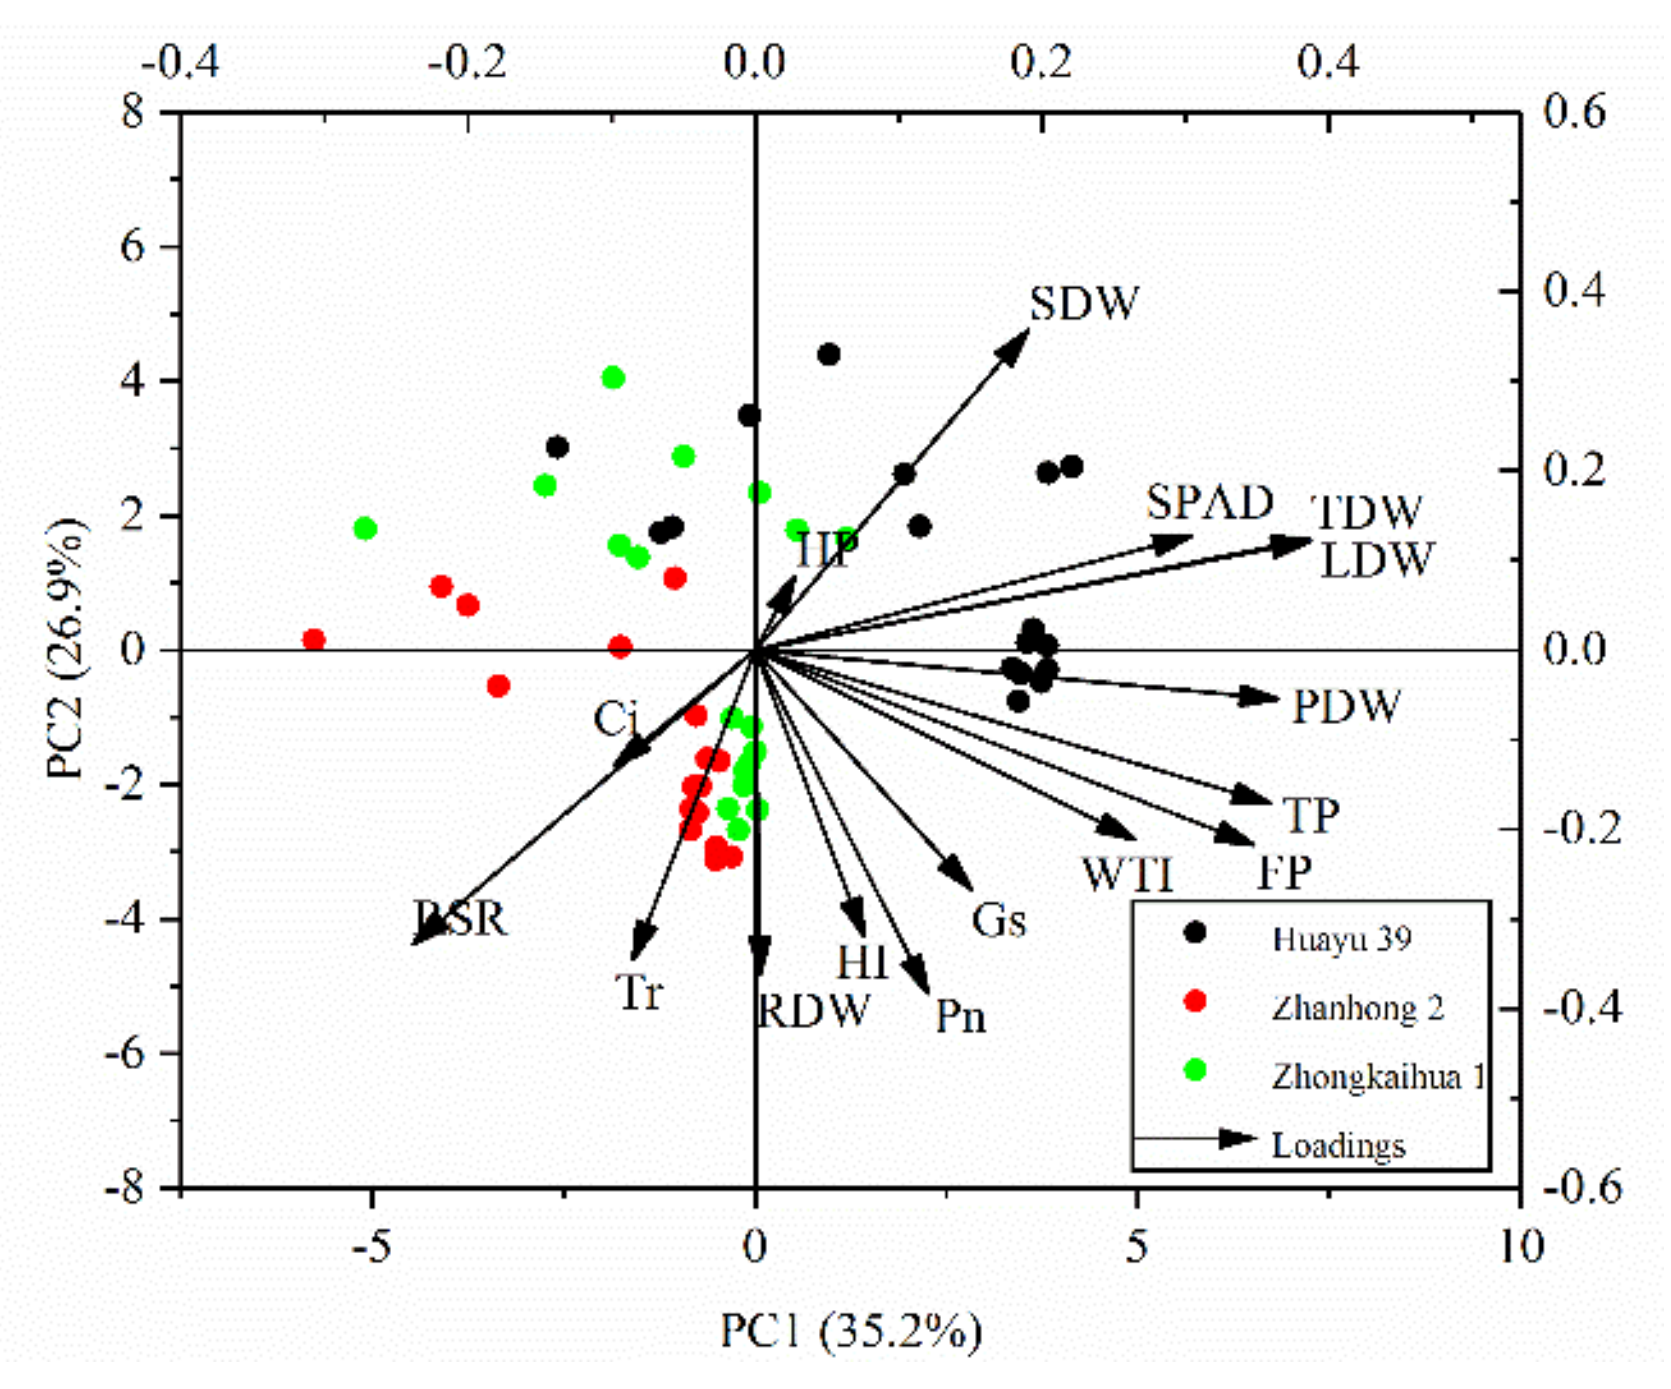
The SDW and LDW of the three ecotypes were promoted by waterlogging for 5 and 10 days at the S and F stages. Additionally, the maximum decline of TDW, SDW, LDW, and PDW of all ecotypes occurred at the P stage, where the maximum declines of TDW, SDW, LDW, and PDW of Zhanhong 2 were 47.64%, 19.94%, 41.21%, and 69.78%, respectively, while those in Zhongkiahua 1 were 35.06%, 7.47%, 43.50%, and 43.60%, and those in Huayu 39 were 49.14%, 15.12%, 57.04%, and 57.07%. After 5 days of treatment during the P stage, the TDW and LDW of Zhanhong 2 increased by 4.76% and 23.20%, those of Zhongkaihua 1 increased by 14.22% and 13.49%, respectively, while those of Huayu 39 decreased by 49.14% and 57.04%, respectively. However, after 10 days of stress during the P stage, the TDW, LDW, and PDW of Zhanhong 2 decreased by 16.42%, 0.22%, and 42.94%, while those of Zhongkaihua 1 decreased by 35.09%, 43.51%, and 43.51%, respectively. In addition, it was found that waterlogging led to an increase in stem percentage. A drop in the leaf percentage in Zhongkaihua 1 and Huayu 39 and a rise in leaf percentage in Zhanhong 2 were observed (Supplementary Figure S1). Meanwhile, it was revealed that the first and second components (PC1 and PC2) accounted for 35.2% and 26.9% of the variation, respectively. PC1 explained the majority of the variation in LDW (0.38703), TDW (0.38695), PDW (0.3649), TP (0.35968), FP (0.34771), and SPAD (0.30464), while PC2 explained the majority of variance in Pn (−0.38317), RDW (−0.36234), SDW (0.35677), Tr (−0.34518), RSR (−0.32865), and HI (−0.3192); see Figure 4. The greater positive correlation of TDW, RDW, LDW, and PDW with WTI was observed (Table 3).

3.3. SPAD Value

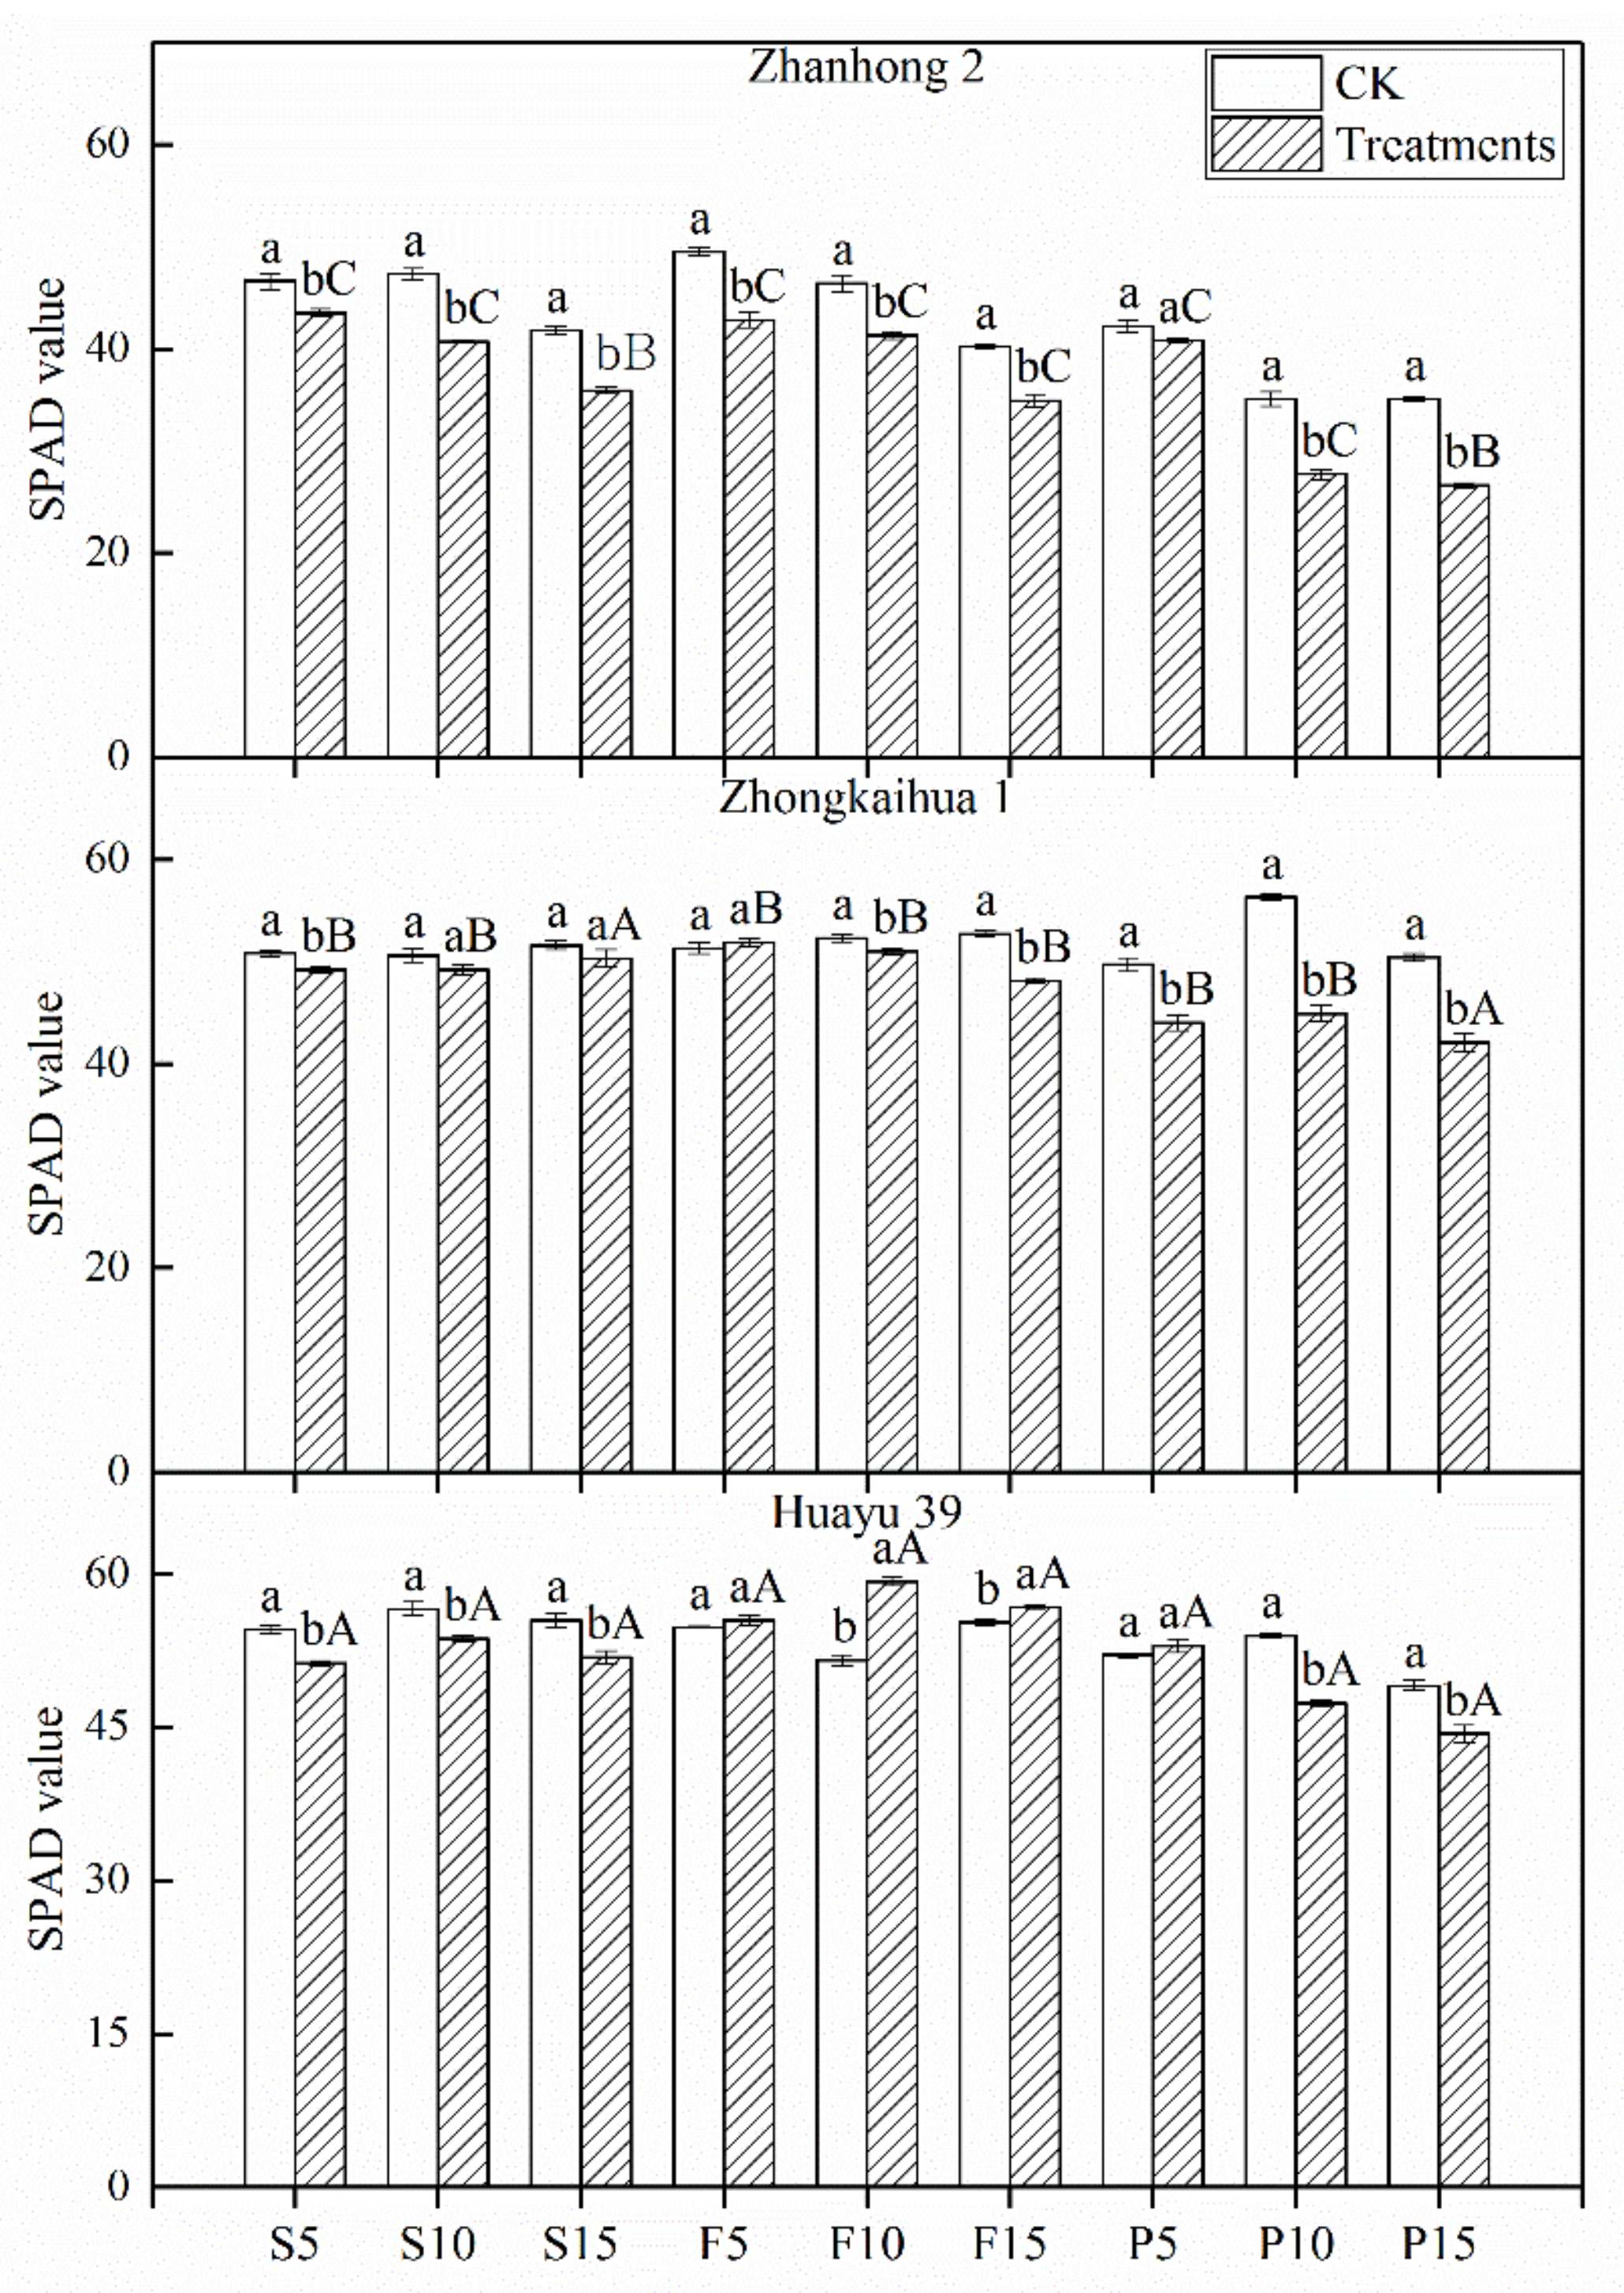
As indicated in Figure 5, the SPAD values of Zhanhong 2 and Zhongkaihua 1 decreased with the increase in waterlogging duration at different developmental stages. However, for Huayu 39, waterlogging at the S and P stages decreased the SPAD value, while waterlogging at the F stage for 5 days and 10 days increased the SPAD value, with a significant difference from CK (p < 0.05). Waterlogging for 10 days and 15 days during the P stage reduced the SPAD value in Zhanhong 2 by 21.08% and 24.22%, Zhongkaihua 1 by 20.25% and 16.47%, and Huayu 39 by 12.22% and 9.57%, respectively. As shown in Table 3, SPAD has a significant positive correlation with WTI.

3.4. Photosynthetic Parameters

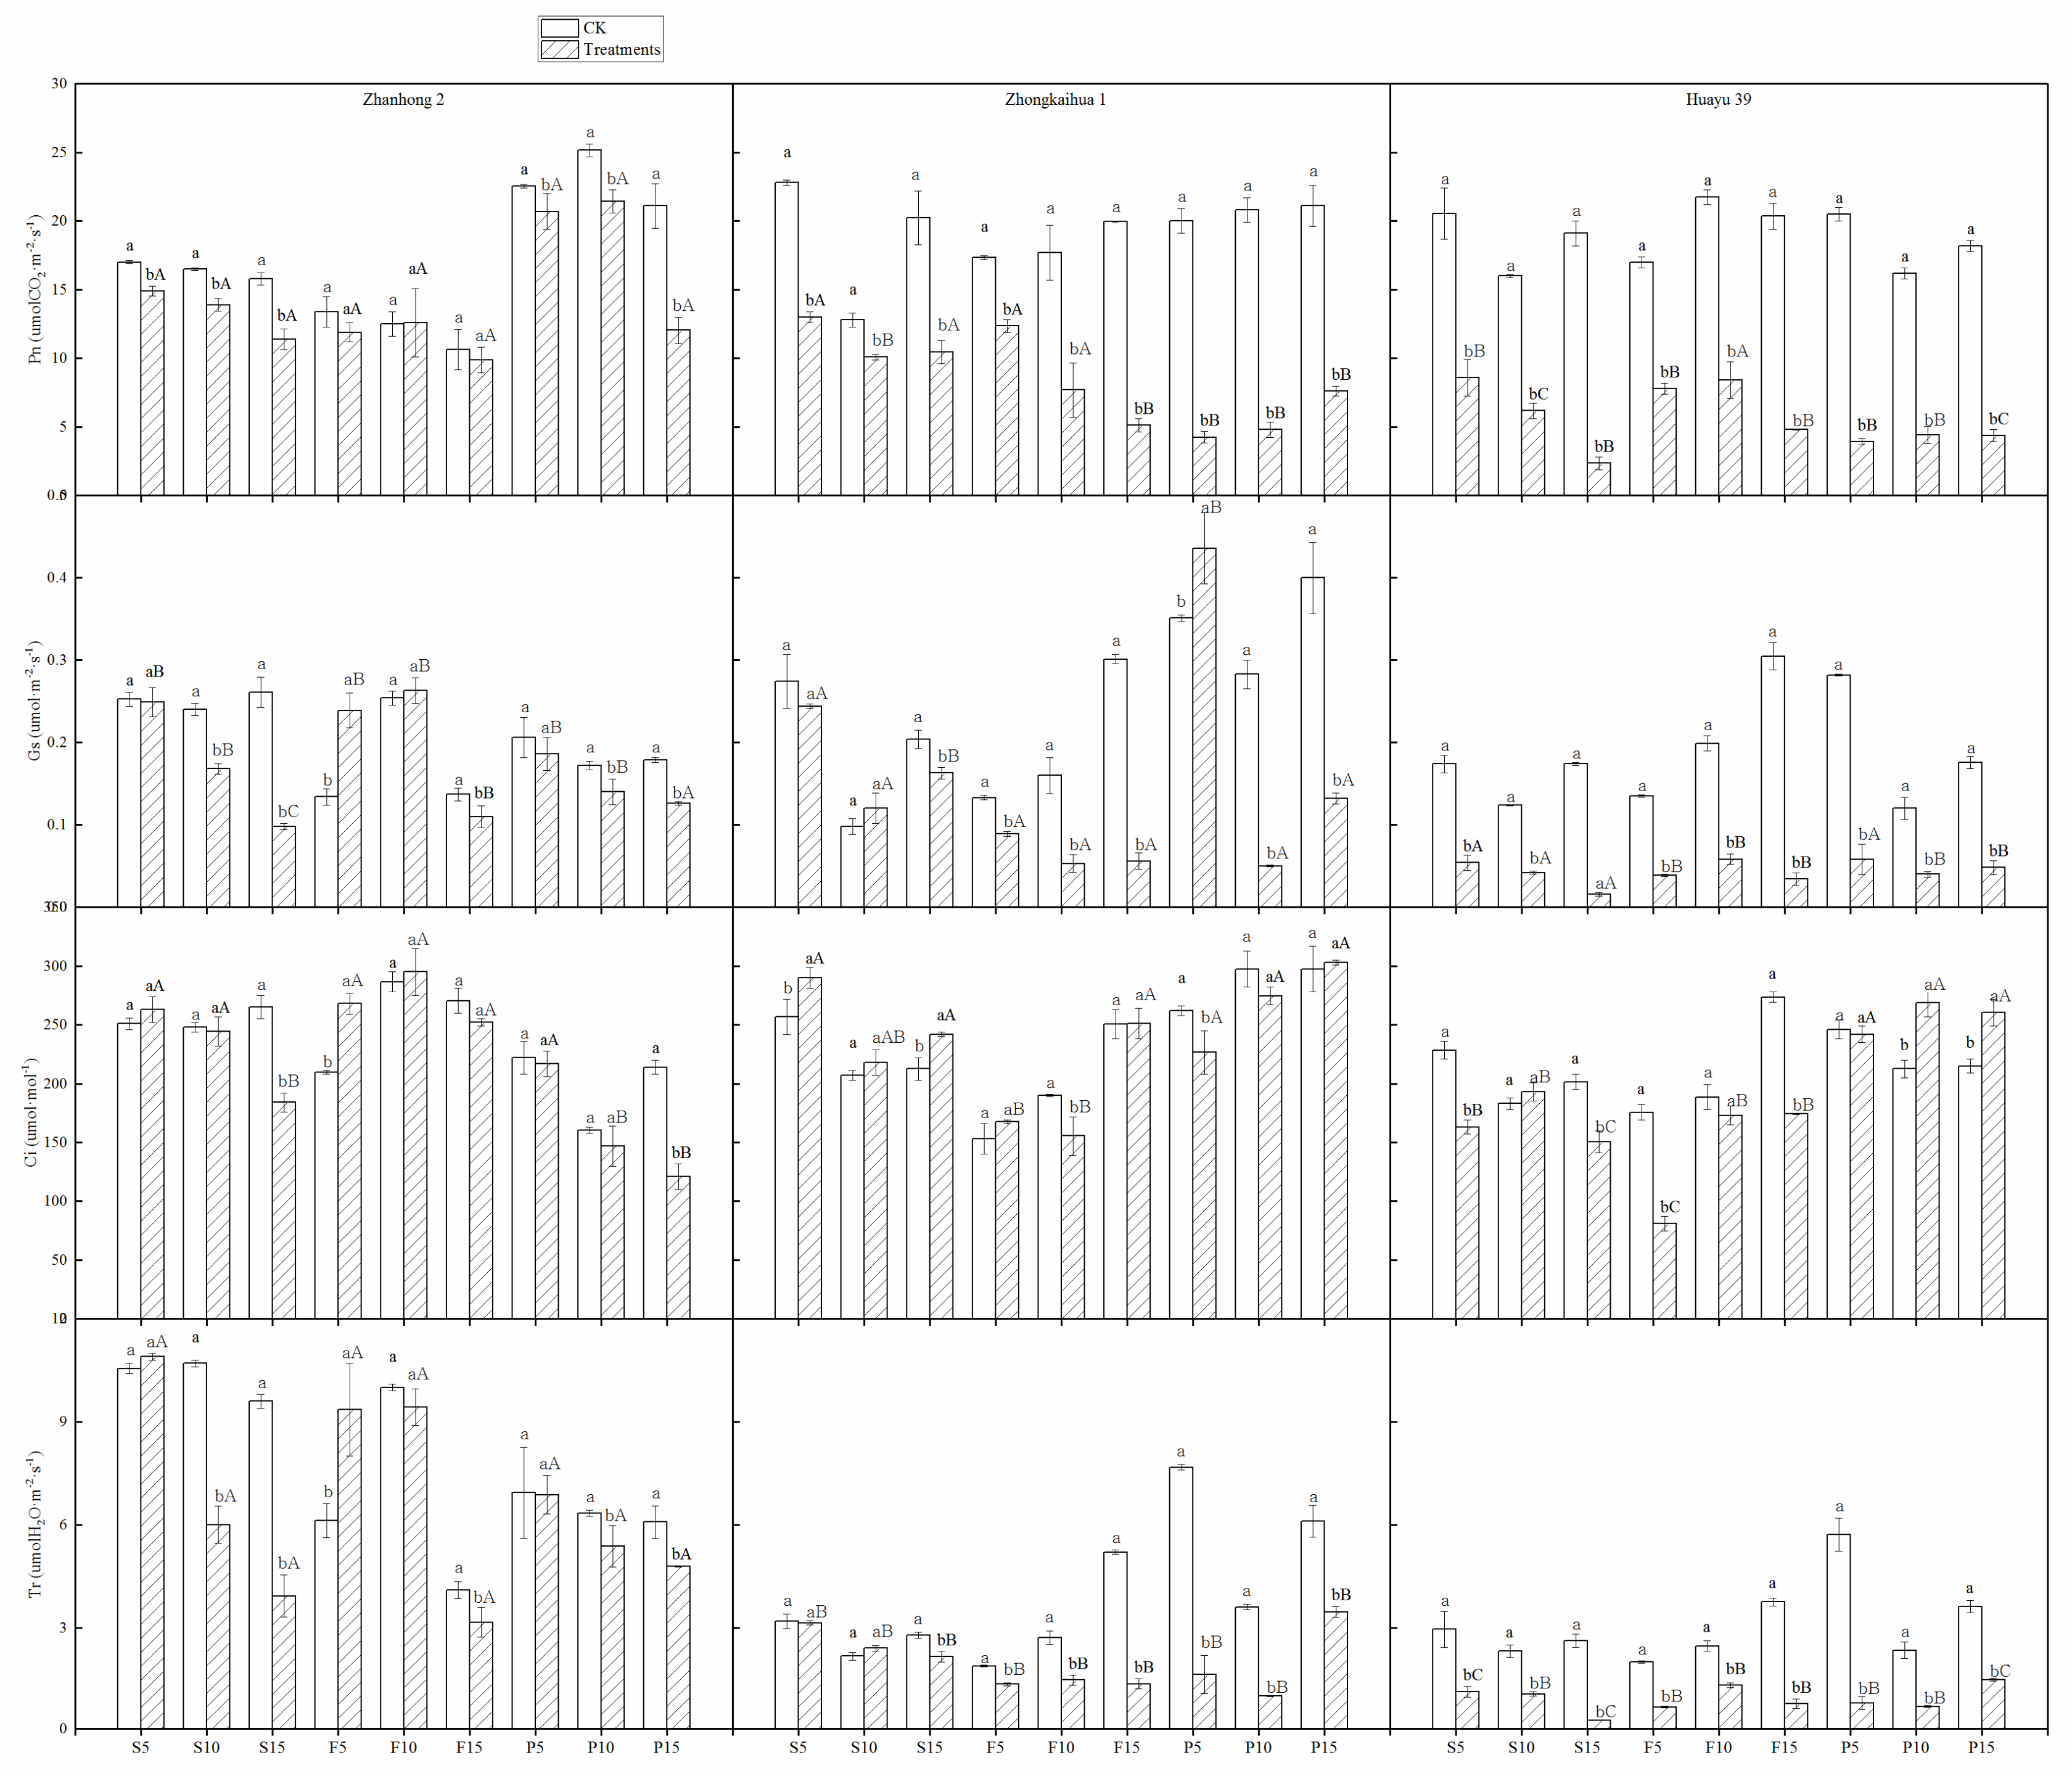
The effects of waterlogging on the photosynthetic parameters of functional leaves on the main stems of the three ecotypes are presented in Figure 6. For Zhongkaihua 1 and Huayu 39, the effect of waterlogging on Pn was particularly significant at the P stage. Pn decreased by 78.75%, 80.05%, and 63.93%, respectively, after 5, 10, and 15 days of stress in Zhongkaihua 1, and those in Huayu 39 decreased by 80.88%, 72.78%, and 76.04%, respectively. Waterlogging resulted in the decrease in the Gs and Tr of Zhongkaihua 1 and Huayu 39. For Zhanhong 2, waterlogging at the S and P stages caused a reduction in its Gs, Ci, and Tr, while waterlogging for 5 days at the F stage induced a rise in its Gs, Ci, and Tr values, and waterlogging for 10 and 15 days had no significant effect on them. In addition, Pn was positively correlated with WTI (Table 3).

3.5. Yield and Yield Components

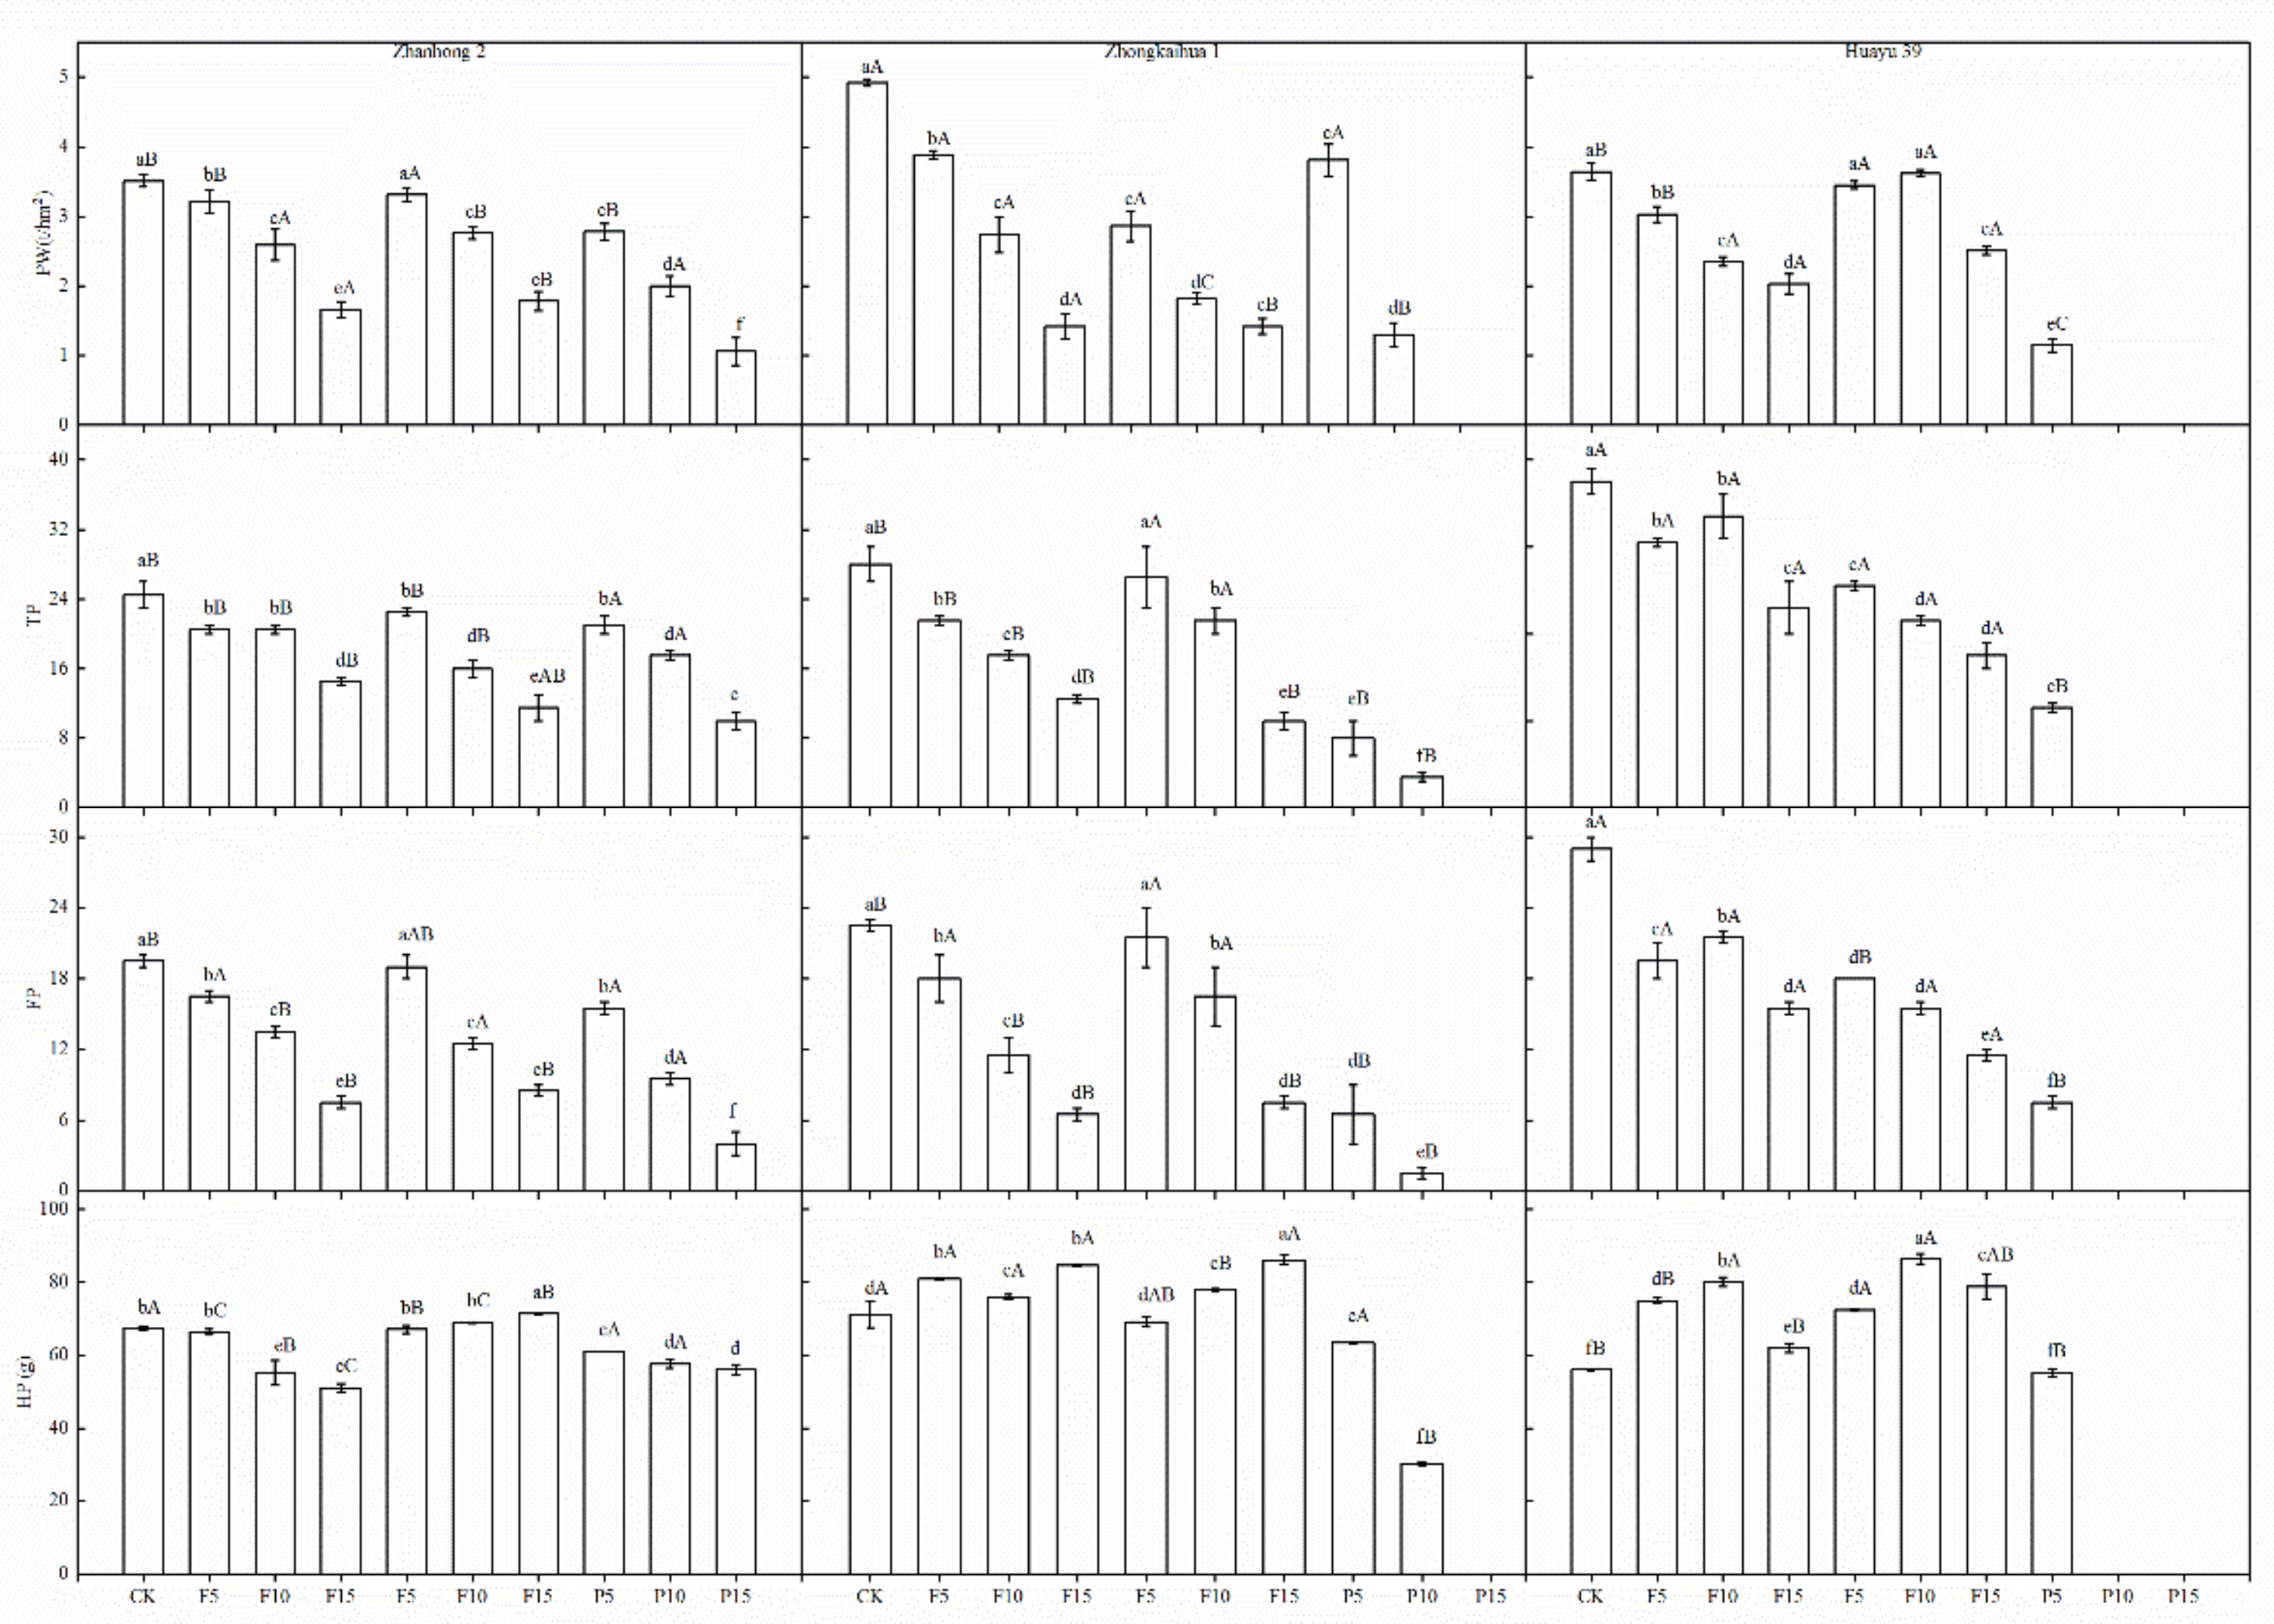
The YH, TP, and FP of the three ecotypes decreased with the increase in duration (Figure 7). The largest decline in YH, TP, and FP were found at the P stage. Waterlogging at the P stage reduced the YH, TP, and FP of Zhanhong 2 by 69.80%, 59.18%, and 79.49%, those of Zhongkaihua 1 by 73.58%, 87.50%, and 93.33%, and those of Huayu 39 by 68.41%, 69.33%, and 74.14%, respectively. The results suggest that the HP increased with waterlogging at the F stage but decreased with waterlogging stress at the P stage. At the P stage, compared to the plants without treatment, the HP of Zhanhong 2 reduced by 16.83% with 15 days of waterlogging stress, that of Zhongkaihua 1 was reduced by 57.88% with 10 days of waterlogging stress, and that of Huayu 39 was reduced by 1.59% with 5 days of waterlogging stress. Waterlogging at the S stage increased the HP values of Zhongkaihua 1 and Huayu 39, but decreased that of Zhanhong 2. It was observed that the TP and FP had a greater positive relationship with WTI, while Ci, Tr, RDW, and HP had no relationship with WTI (Table 3).

4. Discussion

Waterlogging limits the production of crops globally. Under the threat of global warming, crop production is undoubtedly expected to face a higher risk of being subjected to waterlogging stress, thus threatening food security [29,30,31]. This paper, for the first time, explored the relationship between the waterlogging tolerance and the geographical origin of peanut ecotypes, which may be of great significance for peanut breeding and production.
Chlorophyll breakdown is one of the most noticeable signs of leaf senescence [32]. Previous reports have indicated that waterlogging accelerated leaf senescence and decreased photosynthetic capacity, as observed by such indicators as the decline in Pn and SPAD values, which are significantly correlated with chlorophyll content [13,33,34,35,36]. In our experiment, waterlogging obviously brought about decreases in the SPAD and Pn values, to varying degrees, suggesting that waterlogging led to the degradation of chlorophyll in the functional leaves on the main peanut stem and reduced the photosynthetic capacity, which corroborated previous research results [8]. In addition, we found that the stage of the greatest impact of waterlogging on Pn was the P stage. This may be because the P stage comprises the middle and later growth stages of peanut. In this stage, the senescence of leaves is accelerated, and the photosynthetic capacity of leaves is decreased, along with the increase in the malondialdehyde (MDA) content and the enhancement of membrane lipid peroxidation. Therefore, the scavenging ability of leaves to reactive oxygen species, as well as their tolerance to stress, are reduced [37,38,39].
In this research, we found that waterlogging for 5 and 10 days at different growth stages promoted the accumulation of stem and leaf dry matter, while waterlogging for 15 days was not conducive to the dry matter accumulation of plants, and the proportion of stems and leaves increased continuously with the extension of stress. Additionally, a significant decrease in the YH, TP, and FP values of peanut were found with the extension of waterlogging time. Compared with the control, the most noticeable period of decline of TDW, YH, TP, and FP for the three varieties was the P stage. Therefore, we speculate that, under stress, the photosynthetic products synthesized by the plant leaves may not be effectively transported to the pods, thereby causing an increase in the proportion of stems and leaves and a decrease in the proportion of pods [40,41,42]. Furthermore, the TP decreases with the extension of duration, which may be due to the decay of pods in the soil or the abortion of newly planted peanut needles, resulting in the discernible decline of the TP [43].
In addition, waterlogging tolerance is a complex trait, including morphological growth, physiological and biochemical characteristics, and molecular expression [20,26,44]. A single index is insufficient to accurately reflect the waterlogging tolerance of plants. Therefore, a new indicator, WTI, was constructed to evaluate the waterlogging tolerance of peanut ecotypes. A larger value of WTI indicates the stronger waterlogging tolerance of a variety [45]. In our research, the WTI decreased with the extension of waterlogging time in different growth stages, where the three ecotypes had the weakest tolerance at the P stage. Moreover, the PCA analysis showed that TDW, RDW, LDW, PDW, SPAD, Pn, TP, and FP were positively correlated with WTI. Therefore, we propose that an effective way to pick tolerant varieties was by measuring the SPAD, Pn, dry matter accumulation, and pod characteristics of waterlogged plants.
Crops from different habitats have different tolerance to adversity as, in order to be adapted to their habitats, their morphology, physiology, and function are extremely different [46,47]. Meanwhile, due to long-term cultivation in the same habitat, the gene regulation patterns and phenotypes of the same population converge [48,49]. Therefore, when subjected to the same adversities, ecotypes have different response mechanisms [21,50]. It was found that, if some oxygen exists further along the root with waterlogging, the respiration of the root can continue, which assists in the survival of the plant [44]. Previous studies have shown that, compared with waterlogging-sensitive barley varieties, waterlogging-tolerant varieties showed significantly better abilities for H+ pumping and a smaller decrease in the K+ uptake under waterlogging conditions [50]. From the perspective of the place of origin, Huayu 39 is from a temperate monsoon climate zone, while Zhanhong 2 and Zhongkaihua 1 are from sub-tropical monsoon climate zones. There are great differences in the sunshine hours, rainfall, effective accumulated temperature, and other aspects between the two climate zones. Among them, in the geographic origin of Huayu 39—Jinan—the annual rainfall is 880.0 mm, which is lower than that in the areas of origin of the other two varieties. As for the varieties from sub-tropical monsoon climate zones, the cultivation land of Zhanhong 2—Zhanjiang—has significantly higher rainfall than that of Zhongkaihua 1—Guangzhou—(Table 1). In this paper, Huayu 39 was obviously more sensitive to waterlogging than Zhonghong 2 and Zhongkaihua 1, as the Pn of the leaves in Huayu 39 decreased obviously with waterlogging at the P stage, and even waterlogging for 5 days led to the sharp decline of YH, TP, and FP. Under the same duration of waterlogging at the P stage, the decrease in the YH, TP, FP, and HP of Huayu 39 was the largest among the three ecotypes, followed by Zhongkaihua 1 and Zhanhong 2. In terms of the duration time of waterlogging tolerance, the most tolerant ecotype was Zhanhong 2, followed by Zhongkaihua 1 and Huayu 39. Therefore, we speculate that peanuts from different habitats have distinct tolerances to waterlogging, and that peanut ecotypes (e.g., Zhanhong 2) which come from lower latitudes and areas with abundant rainfall are more resistant to waterlogging. Due to the sudden rainstorms and high rainfall during the growing process, the cell structures of roots, stems, leaves, and other tissues of peanut ecotypes planted in the waterlogged environment for a long time is preferable to that of peanut ecotypes planted in other habitats [51,52]. In addition, in the process of cultivation and domestication, the individual gene regulation mode and response mechanism in the same population tend to make the plant more suitable for the waterlogged environment. Therefore, we believe that it might be more effective to select peanut varieties from lower latitudes with higher rainfall as parents, when breeding for waterlogging tolerance. At the same time, water conservancy projects should be built and timely drainage should be performed, in the case of waterlogging.
In this paper, the effects of waterlogging on dry matter accumulation, photosynthetic characteristics, yield, and yield components of peanut ecotypes were studied under waterlogging conditions in different growth stages. The most sensitive stage of waterlogging for peanuts was identified as the P stage, and the relationship between the tolerance and habitat was described. This is the first time a new idea for peanut waterlogging tolerance breeding considering the main indicators of tolerance identification has been put forward, which is of great significance to peanut tolerance cultivation and breeding. The deficiency of this study is that the responses of peanut ecotypes in different habitats to waterlogging was only obtained from the comprehensive comparison of SPAD, Pn, dry matter accumulation, yield, and yield components. Therefore, further exploring the differences in the aspects of cytology, physicochemical properties, and genomics may serve to better explain the mechanisms of waterlogging tolerance in peanuts.

5. Conclusions

In this experiment, the most tolerant ecotype was Zhanhong 2, followed by Zhongkaihua 1 and Huayu 39. The most sensitive stage to waterlogging stress in different peanut ecotypes was identified as the pod-filling stage, where the deleterious effects increased with the extension of waterlogging time. Waterlogging inhibited the photosynthetic characteristics in the leaves of peanut, which eventually resulted in a decline in yield. Furthermore, the yield penalties were mainly attributed to the decrease in the number of total pods and full pods under waterlogging stress. Importantly, we proposed a novel idea of waterlogging tolerance breeding, using a breeding background based on peanut ecotypes from low latitude and rainy areas, combined with the measurement of SPAD, Pn, dry matter accumulation, and pod characteristics.

Supplementary Materials

The following are available online at https://www.mdpi.com/2073-4395/10/9/1244/s1, Figure S1: The proportion of the dry weight of each organ of a single plant to the total dry weight. CK: control (plants without waterlogging stress); treatments: plants with waterlogging stress. S5, S10, S15, F5, F10, F15, P5, P10, P15 indicate the waterlogging stress for 5, 10, and 15 days at the seedling, flowering, and pod-filling stages, respectively. RDW: root dry weight per plant, SDW: stem dry weight per plant, LDW: leaves dry weight per plant, PDW: pod dry weight per plant.

Author Contributions

Conceptualization, T.C. and L.Z.; data curation, R.Z.; funding acquisition, L.Z.; investigation, R.Z., L.C., X.W., J.C., X.L., X.X. and Q.X.; project administration, R.Z., L.C., X.L., Q.X., T.C. and L.Z.; resources, L.C., X.W. and X.X.; software, R.Z.; supervision, T.C. and L.Z.; writing—original draft, R.Z., L.C. and T.C.; writing—review and editing, T.C. and L.Z. All authors have read and agreed to the published version of the manuscript.

Funding

This work was supported by the National Key R&D Program of China (2018YFD1000906), Key Science and Technology Planning Project of Guangdong Province (2019B020214003), and Guangdong Technical System of Peanut and Soybean Industry (2019KJ136-05).

Acknowledgments

We are grateful to the personnel of Shandong Academy of Agricultural Science for providing the seed of Huayu 39. We are also grateful to editor and the anonymous reviewers.

Conflicts of Interest

The authors declare no conflict of interest.

References

  1. Ploschuk, R.A.; Miralles, D.J.; Colmer, T.D.; Ploschuk, E.L.; Striker, G.G. Waterlogging of winter crops at early and late stages: Impacts on leaf physiology, growth and yield. Front. Plant Sci. 2018, 9, 1863. [Google Scholar] [CrossRef] [PubMed] [Green Version]
  2. Bailey-Serres, J.; Lee, S.C.; Brinton, E. Waterproofing Crops: Effective flooding survival strategies. Plant Physiol. 2012, 160, 1698–1709. [Google Scholar] [CrossRef] [PubMed] [Green Version]
  3. Khera, P.; Pandey, M.K.; Mallikarjuna, N.; Sriswathi, M.; Roorkiwal, M.; Janila, P.; Sharma, S.; Shilpa, K.; Sudini, H.; Guo, B.; et al. Genetic imprints of domestication for disease resistance, oil quality, and yield component traits in groundnut (Arachis hypogaea L.). Mol. Genet. Genom. 2019, 294, 365–378. [Google Scholar] [CrossRef] [PubMed] [Green Version]
  4. Fukao, T.; Barrera-Figueroa, B.E.; Juntawong, P.; Peña-Castro, J.M. Submergence and waterlogging stress in plants: A review highlighting research opportunities and understudied aspects. Front. Plant Sci. 2019, 10, 340. [Google Scholar] [CrossRef] [PubMed]
  5. Mittler, R. Abiotic stress, the field environment and stress combination. Trends Plant Sci. 2006, 11, 15–19. [Google Scholar] [CrossRef]
  6. Arduini, I.; Baldanzi, M.; Pampana, S. Reduced growth and nitrogen uptake during waterlogging at tillering permanently affect yield components in late sown oats. Front. Plant Sci. 2019, 10, 1087. [Google Scholar] [CrossRef] [Green Version]
  7. Ahmed, S.; Nawata, E.; Hosokawa, M.; Domae, Y.; Sakuratani, T. Alterations in photosynthesis and some antioxidant enzymatic activities of mungbean subjected to waterlogging. Plant Sci. 2002, 163, 117–123. [Google Scholar] [CrossRef]
  8. Ahmed, S.; Nawata, E.; Sakuratani, T. Changes of endogenous ABA and ACC, and their correlations to photosynthesis and water relations in mungbean (Vigna radiata (L.) Wilczak cv. KPS1) during waterlogging. Environ. Exp. Bot. 2006, 57, 278–284. [Google Scholar] [CrossRef]
  9. Zhang, Y.; Song, X.; Yang, G.; Li, Z.; Lu, H.; Kong, X.; Eneji, A.E.; Dong, H. Physiological and molecular adjustment of cotton to waterlogging at peak-flowering in relation to growth and yield. Field Crops Res. 2015, 179, 164–172. [Google Scholar] [CrossRef]
  10. Arguello, M.N.; Mason, R.E.; Roberts, T.L.; Subramanian, N.; Acuña, A.; Addison, C.K.; Lozada, D.N.; Miller, R.G.; Gbur, E. Performance of soft red winter wheat subjected to field soil waterlogging: Grain yield and yield components. Field Crops Res. 2016, 194, 57–64. [Google Scholar] [CrossRef] [Green Version]
  11. Grassini, P.; Indaco, G.V.; Pereira, M.L.; Hall, A.J.; Trápani, N. Responses to short-term waterlogging during grain filling in sunflower. Field Crops Res. 2007, 101, 352–363. [Google Scholar] [CrossRef]
  12. De San Celedonio, R.P.; Abeledo, L.G.; Miralles, D.J. Identifying the critical period for waterlogging on yield and its components in wheat and barley. Plant Soil 2014, 378, 265–277. [Google Scholar] [CrossRef]
  13. Tian, L.; Li, J.; Bi, W.; Zuo, S.; Li, L.; Li, W.; Sun, L. Effects of waterlogging stress at different growth stages on the photosynthetic characteristics and grain yield of spring maize (Zea mays L.) under field conditions. Agric. Water Manag. 2019, 218, 250–258. [Google Scholar] [CrossRef]
  14. Ren, B.; Zhang, J.; Dong, S.; Liu, P.; Zhao, B. Exogenous 6-benzyladenine improves antioxidative system and carbon metabolism of summer maize waterlogged in the field. J. Agron. Crop Sci. 2018, 204, 175–184. [Google Scholar] [CrossRef]
  15. Wollmer, A.C.; Pitann, B.; Mühling, K.H. Waterlogging events during stem elongation or flowering affect yield of oilseed rape (Brassica napus L.) but not seed quality. J. Agron. Crop Sci. 2018, 204, 165–174. [Google Scholar] [CrossRef]
  16. Morishita, T.; Hara, T.; Hara, T. Important agronomic characteristics of yielding ability in common buckwheat; ecotype and ecological differentiation, preharvest sprouting resistance, shattering resistance, and lodging resistance. Breed. Sci. 2020, 70, 39–47. [Google Scholar] [CrossRef] [Green Version]
  17. Kreyling, J.; Puechmaille, S.J.; Malyshev, A.V.; Valladares, F. Phenotypic plasticity closely linked to climate at origin and resulting in increased mortality under warming and frost stress in a common grass. Ecol. Evol. 2018, 9, 1344–1352. [Google Scholar] [CrossRef]
  18. Guan, B.; Yu, J.; Hou, A.; Han, G.; Wang, G.; Qu, F.; Xia, J.; Wang, X. The ecological adaptability of Phragmites australis to interactive effects of water level and salt stress in the Yellow River Delta. Aquat. Ecol. 2017, 51, 107–116. [Google Scholar] [CrossRef]
  19. Shabala, S. Physiological and cellular aspects of phytotoxicity tolerance in plants: The role of membrane transporters and implications for crop breeding for waterlogging tolerance. New Phytol. 2011, 190, 289–298. [Google Scholar] [CrossRef] [Green Version]
  20. Yin, D.; Sun, D.; Han, Z.; Ni, D.; Norris, A.; Jiang, C. PhERF2, an ethylene-responsive element binding factor, plays an essential role in waterlogging tolerance of petunia. Hortic. Res. Engl. 2019, 6, 1–11. [Google Scholar] [CrossRef] [Green Version]
  21. Akhtar, N.; Hameed, M.; Nawaz, F.; Ahmad, K.S.; Hamid, A.; Segovia-Salcedo, C.; Shahnaz, M.M. Leaf anatomical and biochemical adaptations in Typha domingensis Pers. ecotypes for salinity tolerance. Bot. Sci. 2017, 95, 807. [Google Scholar] [CrossRef] [Green Version]
  22. Hammami, H.; Saadatian, B.; Aliverdi, A. Geographical variation in breaking the seed dormancy of Persian cumin (Carum carvi L.) ecotypes and their physiological responses to salinity and drought stresses. Ind. Crop Prod. 2018, 124, 600–606. [Google Scholar] [CrossRef]
  23. Liu, Y.; Li, X.; Liu, M.; Cao, B.; Tan, H.; Wang, J.; Li, X. Responses of three different ecotypes of reed (Phragmites communis Trin.) to their natural habitats: Leaf surface micro-morphology, anatomy, chloroplast ultrastructure and physio-chemical characteristics. Plant Physiol. Biochem. 2012, 51, 159–167. [Google Scholar] [CrossRef] [PubMed]
  24. Luan, H.; Guo, B.; Pan, Y.; Lv, C.; Shen, H.; Xu, R. Morpho-anatomical and physiological responses to waterlogging stress in different barley (Hordeum vulgare L.) genotypes. Plant Growth Regul. 2018, 85, 399–409. [Google Scholar] [CrossRef]
  25. Yin, D.; Chen, S.; Chen, F.; Guan, Z.; Fang, W. Morpho-anatomical and physiological responses of two Dendranthema species to waterlogging. Environ. Exp. Bot. 2010, 68, 122–130. [Google Scholar] [CrossRef]
  26. Yu, F.; Liang, K.; Fang, T.; Zhao, H.; Han, X.; Cai, M.; Qiu, F. A group VII ethylene response factor gene, ZmEREB180, coordinates waterlogging tolerance in maize seedlings. Plant Biotechnol. J. 2019, 17, 2286–2298. [Google Scholar] [CrossRef] [Green Version]
  27. Krishnamurthy, S.L.; Gautam, R.K.; Sharma, P.C.; Sharma, D.K. Effect of different salt stresses on agro-morphological traits and utilisation of salt stress indices for reproductive stage salt tolerance in rice. Field Crops Res. 2016, 190, 26–33. [Google Scholar] [CrossRef]
  28. Mann, A.; Kaur, G.; Kumar, A.; Sanwal, S.K.; Singh, J.; Sharma, P.C. Physiological response of chickpea (Cicer arietinum L.) at early seedling stage under salt stress conditions. Legume Res. 2019, 42, 625–632. [Google Scholar] [CrossRef]
  29. Erda, L.; Wei, X.; Hui, J.; Yinlong, X.; Yue, L.; Liping, B.; Liyong, X. Climate change impacts on crop yield and quality with CO2 fertilization in China. Philos. Trans. R. Soc. B Biol. Sci. 2005, 360, 2149–2154. [Google Scholar] [CrossRef] [Green Version]
  30. Sultan, B.; Defrance, D.; Iizumi, T. Evidence of crop production losses in West Africa due to historical global warming in two crop models. Sci. Rep. 2019, 9, 12834–12915. [Google Scholar] [CrossRef] [Green Version]
  31. Wang, Y.; Chen, Z.; Jiang, Y.; Duan, B.; Xi, Z. Involvement of ABA and antioxidant system in brassinosteroid-induced water stress tolerance of grapevine (Vitis vinifera L.). Sci. Hortic Amst. 2019, 256, 108596. [Google Scholar] [CrossRef]
  32. Barickman, T.C.; Simpson, C.R.; Sams, C.E. Waterlogging causes early modification in the physiological performance, carotenoids, chlorophylls, proline, and soluble sugars of cucumber plants. Plants 2019, 8, 160. [Google Scholar] [CrossRef] [PubMed] [Green Version]
  33. Ren, B.; Dong, S.; Liu, P.; Zhao, B.; Zhang, J. Ridge tillage improves plant growth and grain yield of waterlogged summer maize. Agric. Water Manag. 2016, 177, 392–399. [Google Scholar] [CrossRef]
  34. Irving, L.J.; Sheng, Y.B.; Woolley, D.; Matthew, C. Physiological effects of waterlogging on two lucerne varieties grown under glasshouse conditions. J. Agron. Crop Sci. 2007, 193, 345–356. [Google Scholar] [CrossRef]
  35. Najeeb, U.; Bange, M.P.; Atwell, B.J.; Tan, D.K.Y. Low incident light combined with partial waterlogging impairs photosynthesis and imposes a yield penalty in cotton. J. Agron. Crop Sci. 2016, 202, 331–341. [Google Scholar] [CrossRef]
  36. Shah, S.H.; Houborg, R.; McCabe, M.F. Response of chlorophyll, carotenoid and SPAD-502 measurement to salinity and nutrient stress in wheat (Triticum aestivum L.). Agronomy 2017, 7, 61. [Google Scholar] [CrossRef] [Green Version]
  37. Tian, L.; Bi, W.; Liu, X.; Sun, L.; Li, J. Effects of waterlogging stress on the physiological response and grain-filling characteristics of spring maize (Zea mays L.) under field conditions. Acta Physiol. Plant 2019, 41, 63. [Google Scholar] [CrossRef]
  38. Ren, B.; Hu, J.; Zhang, J.; Dong, S.; Liu, P.; Zhao, B. Effects of urea mixed with nitrapyrin on leaf photosynthetic and senescence characteristics of summer maize (Zea mays L.) waterlogged in the field. J. Integr. Agric. 2020, 19, 1586–1595. [Google Scholar] [CrossRef]
  39. Zhang, Y.; Wang, H.; Li, Z.; Guo, H. Genetic network between leaf senescence and plant immunity: Crucial regulatory nodes and new insights. Plants 2020, 9, 495. [Google Scholar] [CrossRef] [Green Version]
  40. Malik, A.I.; Colmer, T.D.; Lambers, H.; Setter, T.L.; Schortemeyer, M. Short-term waterlogging has long-term effects on the growth and physiology of wheat. New Phytol. 2002, 153, 225–236. [Google Scholar] [CrossRef]
  41. Herzog, M.; Striker, G.G.; Colmer, T.D.; Pedersen, O. Mechanisms of waterlogging tolerance in wheat—A review of root and shoot physiology. Plant Cell Environ. 2016, 39, 1068–1086. [Google Scholar] [CrossRef] [PubMed]
  42. Hossain, M.A.; Araki, H.; Takahashi, T. Poor grain filling induced by waterlogging is similar to that in abnormal early ripening in wheat in Western Japan. Field Crops Res. 2011, 123, 100–108. [Google Scholar] [CrossRef]
  43. Wang, X.; Huang, M.; Zhou, Q.; Cai, J.; Dai, T.; Cao, W.; Jiang, D. Physiological and proteomic mechanisms of waterlogging priming improves tolerance to waterlogging stress in wheat (Triticum aestivum L.). Environ. Exp. Bot. 2016, 132, 175–182. [Google Scholar] [CrossRef]
  44. Yamauchi, T.; Colmer, T.D.; Pedersen, O.; Nakazono, M. Regulation of root traits for internal aeration and tolerance to soil waterlogging-flooding stress. Plant Physiol. 2018, 176, 1118–1130. [Google Scholar] [CrossRef] [PubMed] [Green Version]
  45. Ahmed, K.; Shabbir, G.; Ahmed, M.; Shah, K.N. Phenotyping for drought resistance in bread wheat using physiological and biochemical traits. Sci. Total Environ. 2020, 729, 139082. [Google Scholar] [CrossRef]
  46. Gould, B.A.; Chen, Y.; Lowry, D.B. Gene regulatory divergence between locally adapted ecotypes in their native habitats. Mol. Ecol. 2018, 27, 4174–4188. [Google Scholar] [CrossRef]
  47. Velikova, V.; Tsonev, T.; Tattini, M.; Arena, C.; Krumova, S.; Koleva, D.; Peeva, V.; Stojchev, S.; Todinova, S.; Izzo, L.G.; et al. Physiological and structural adjustments of two ecotypes of Platanus orientalis L. from different habitats in response to drought and re-watering. Conserv. Physiol. 2018, 6. [Google Scholar] [CrossRef] [Green Version]
  48. Baduel, P.; Arnold, B.; Weisman, C.M.; Hunter, B.; Bomblies, K. Habitat-associated life history and stress-tolerance variation in Arabidopsis arenosa. Plant Physiol. 2016, 171, 437–451. [Google Scholar] [CrossRef] [Green Version]
  49. Clark, J.S.; Poore, A.G.B.; Doblin, M.A. Shaping up for stress: Physiological flexibility is key to survivorship in a habitat-forming macroalga. J. Plant Physiol. 2018, 231, 346–355. [Google Scholar] [CrossRef]
  50. Gill, M.B.; Zeng, F.; Shabala, L.; Böhm, J.; Zhang, G.; Zhou, M.; Shabala, S. The ability to regulate voltage-gated K+-permeable channels in the mature root epidermis is essential for waterlogging tolerance in barley. J. Exp. Bot. 2018, 69, 667–680. [Google Scholar] [CrossRef] [Green Version]
  51. Nishiuchi, S.; Yamauchi, T.; Takahashi, H.; Kotula, L.; Nakazono, M. Mechanisms for coping with submergence and waterlogging in rice. Rice 2012, 5, 2. [Google Scholar] [CrossRef] [PubMed] [Green Version]
  52. Bashar, K.K. Hormone dependent survival mechanisms of plants during post-waterlogging stress. Plant Signal. Behav. 2018, 13, e1529522. [Google Scholar] [CrossRef] [PubMed] [Green Version]
Figure 1. Total rainfall and maximum temperature, minimum temperature, average temperature, and rainfall per week during the peanut growing season at Guangzhou, Guangdong, China, in 2019. Tav: average temperature; Tmax: maximum temperature; Tmin: minimum temperature.
Agronomy 10 01244 g001
Figure 2. Effects of waterlogging stress on the waterlogging-stress tolerance index (WTI) in three peanut ecotypes at different growth stages. Different lowercase letters indicate statistically significant differences between waterlogging stress treatments (p < 0.05) for the same ecotype, as determined by the least significant difference test. A, B, C indicate the statistically significant differences between the different ecotypes under the same waterlogging stress treatments (p < 0.05), as determined by the least significant difference test. WTI: waterlogging-stress tolerance index; S5, S10, S15, F5, F10, F15, P5, P10, and P15 indicate the waterlogging stress for 5, 10, and 15 days at the seedling, flowering, and pod-filling stages, respectively.
Agronomy 10 01244 g002
Figure 3. Effect of waterlogging on dry matter accumulation at the harvest stage. Note: data are presented as the average value (n = 3). Different lowercase letters indicate statistically significant differences between waterlogging stress treatments (p < 0.05) in the same ecotype, as determined by the least significant difference test. A, B, and C indicate statistically significant differences between different ecotypes under the same waterlogging stress treatments (p < 0.05), as determined by the least significant difference test. CK: control (plants without waterlogging stress); treatments: plants with waterlogging stress. S5, S10, S15, F5, F10, F15, P5, P10, P15 indicate the waterlogging stress for 5, 10, and 15 days at the seedling, flowering, and pod-filling stages, respectively; TDW: total dry weight; RDW: root dry weight per plant; SDW: stem dry weight per plant; LDW: leaves dry weight per plant; PDW: pod dry weight per plant; RSR: root-shoot ratio; and HI: harvest index.
Agronomy 10 01244 g003
Figure 4. Biplot from the principal component analysis (PCA) of three peanut ecotypes and 16 attributes. The first and second components account for 35.2% and 26.9% of the variation, respectively. Eigenvector plots can be interpreted as follows: (1) Agronomy 10 01244 i001 trait vectors with a narrow angle between them indicate that a positive correlation exists between the traits (the narrower the angle, the greater the correlation); (2) Agronomy 10 01244 i002 trait vectors perpendicular to each other indicate no correlation between the traits; and (3) Agronomy 10 01244 i003 trait vectors in opposing directions indicate that a negative correlation exists between the traits.
Agronomy 10 01244 g004
Figure 5. Effects of waterlogging stress on the SPAD value in three peanut ecotypes at different growth stages. Data are presented as the average value (n = 3). Different lowercase letters indicate statistically significant differences between treatments (p < 0.05) in the same ecotype, as determined by the least significant difference test. A, B, C indicate statistically significant differences between the different ecotypes under the same waterlogging stress treatments (p < 0.05), as determined by the least significant difference test. S5, S10, S15, F5, F10, F15, P5, P10, P15 indicate the waterlogging stress for 5, 10, and 15 days at the seedling, flowering, and pod-filling stages, respectively; CK: control (plants without waterlogging stress); treatments: plants with waterlogging stress.
Agronomy 10 01244 g005
Figure 6. The effects of the different durations of waterlogging treatments on the photosynthetic parameters of the three peanut ecotypes at different growth stages. Data are presented as the average value (n = 3). Different lowercase letters indicate statistically significant differences between the treatments (p < 0.05) in the same genotype, as determined by the least significant difference test. A, B, C indicate statistically significant differences between different ecotypes under same waterlogging stress treatments (p < 0.05), as determined by the least significant difference test. S5, S10, S15, F5, F10, F15, P5, P10, P15 indicate the waterlogging stress for 5, 10, and 15 days at the seedling, flowering, and pod-filling stages, respectively; CK: control (plants without waterlogging stress); treatments: plants with waterlogging stress.
Agronomy 10 01244 g006
Figure 7. Effects of waterlogging stress on the yield and yield components. Note: data are presented as the average value (n = 3). Different lowercase letters indicate statistically significant differences among the waterlogging stress treatments (p < 0.05) in the same genotype, as determined by the least significant difference test. A, B, and C indicate statistically significant differences between different ecotypes under the same waterlogging stress treatments (p < 0.05), as determined by the least significant difference test. CK: control (plants without waterlogging stress); treatments: plants with waterlogging stress. S5, S10, S15, F5, F10, F15, P5, P10, P15 indicate the waterlogging stress for 5, 10, and 15 days at the seedling, flowering, and pod-filling stages, respectively; TP: total pods per plant, FP: full pods per plant, HP: hundred pods weight, YH: yield per ha.
Agronomy 10 01244 g007
Table 1. Geographical origin of three ecotypes of peanut, average rainfall in the last five years, and the experimental site location.
EcotypesVarietyVariety SourceLocalitiesGeographic CoordinatesAnnual Rainfall (mm)Experimental Site Location
Latitude NLongitude E
Zhanhong 2VulgarisZhanyou 30 × WengyuanzhusiZhanjiang, Guangdong Province, PR China21°12′ N110°04′ E2031.7Guangzhou, Guangdong Province, PR China (23°15′ N, 113°36′ E)
Zhongkaihua 1VulgarisZhanyou 41 × Yueyou 193Guangzhou, Guangdong Province, PR China23°06′ N113°15′ E1759.0
Huayu 39VulgarisBaisha 1016 × FloraJinan, Shandong Province, PR China36°40′ N117°00′ E880.0
Table 2. Experimental design.
EcotypesAbbreviationTreatment
Zhanhong 2 Zhongkaihua 1 Huayu 39CKNo waterlogging
TreatmentsS5Waterlogging for 5 days at the seedling stage
S10Waterlogging for 10 days at the seedling stage
S15Waterlogging for 15 days at the seedling stage
F5Waterlogging for 5 days at the flowering and pegging stage
F10Waterlogging for 10 days at the flowering and pegging stage
F15Waterlogging for 15 days at the flowering and pegging stage
P5Waterlogging for 5 days at the pod-filling stage
P10Waterlogging for 10 days at the pod-filling stage
P15Waterlogging for 15 days at the pod-filling stage
Note: CK: control treatments without waterlogging; seedling stage (S): when there were four leaves on the main stem of the plant; flowering and pegging stage (F): more than 50% of the plants had flowered and needled; pod-filling stage (P): from the beginning of the seed to the full seed.
Table 3. Correlation coefficients of the individual indices of peanut under waterlogging stress.
IndexSPADPnGsCiTrTDWRDWSDWLDWPDWRSRHITPFPHPWTI
SPAD1
Pn−0.0651
Gs0.020.5021
Ci−0.0360.059−0.1221
Tr−0.4250.4650.2680.4081
TDW0.6440.0330.191−0.249−0.2651
RDW−0.0610.5430.3170.1880.475−0.1131
SDW0.504−0.428−0.235−0.25−0.4540.681−0.3941
LDW0.6570.0750.175−0.261−0.3370.973−0.1350.5961
PDW0.4560.2160.415−0.1420.0690.8720.0810.3680.7971
RSR−0.4720.370.1160.2070.461−0.6940.763−0.724−0.675−0.4921
HI−0.1590.3660.4990.1580.60.0530.384−0.377−0.0690.5310.1911
TP0.5220.560.421−0.1050.0070.6220.1750.0310.6660.685−0.2580.311
FP0.5230.6030.421−0.0070.080.5810.306−0.0320.6160.681−0.1570.3780.9781
HP0.22−0.169−0.094−0.005−0.060.1310.2090.4310.0170.0550.021−0.03−0.085−0.0631
WTI0.5110.6060.335−0.0940.0230.360.38−0.1080.4330.370.0440.1320.7190.755−0.0351
Note: SPAD: the soil and plant analysis development; Pn: net photosynthetic rate; Gs: stomatal conductance; Ci: intercellular CO2 concentration; Tr: transpiration rate; TDW: total dry weight; RDW: root dry weight; SDW: stem dry weight; LDW: leaf dry weight; PDW: pod dry weight; RSR: root-shoot ratio; HI: harvest index; TP: the number of total pods; FP: the number of full pods; HP: the hundred pods weight; WTI: waterlogging stress tolerance Index.