Land Use Favourability Assessment Based on Soil Characteristics and Anthropic Pollution. Case Study Somesul Mic Valley Corridor, Romania


 ,
,  ,
,  ,
,  ,
, 
Abstract
:1. Introduction
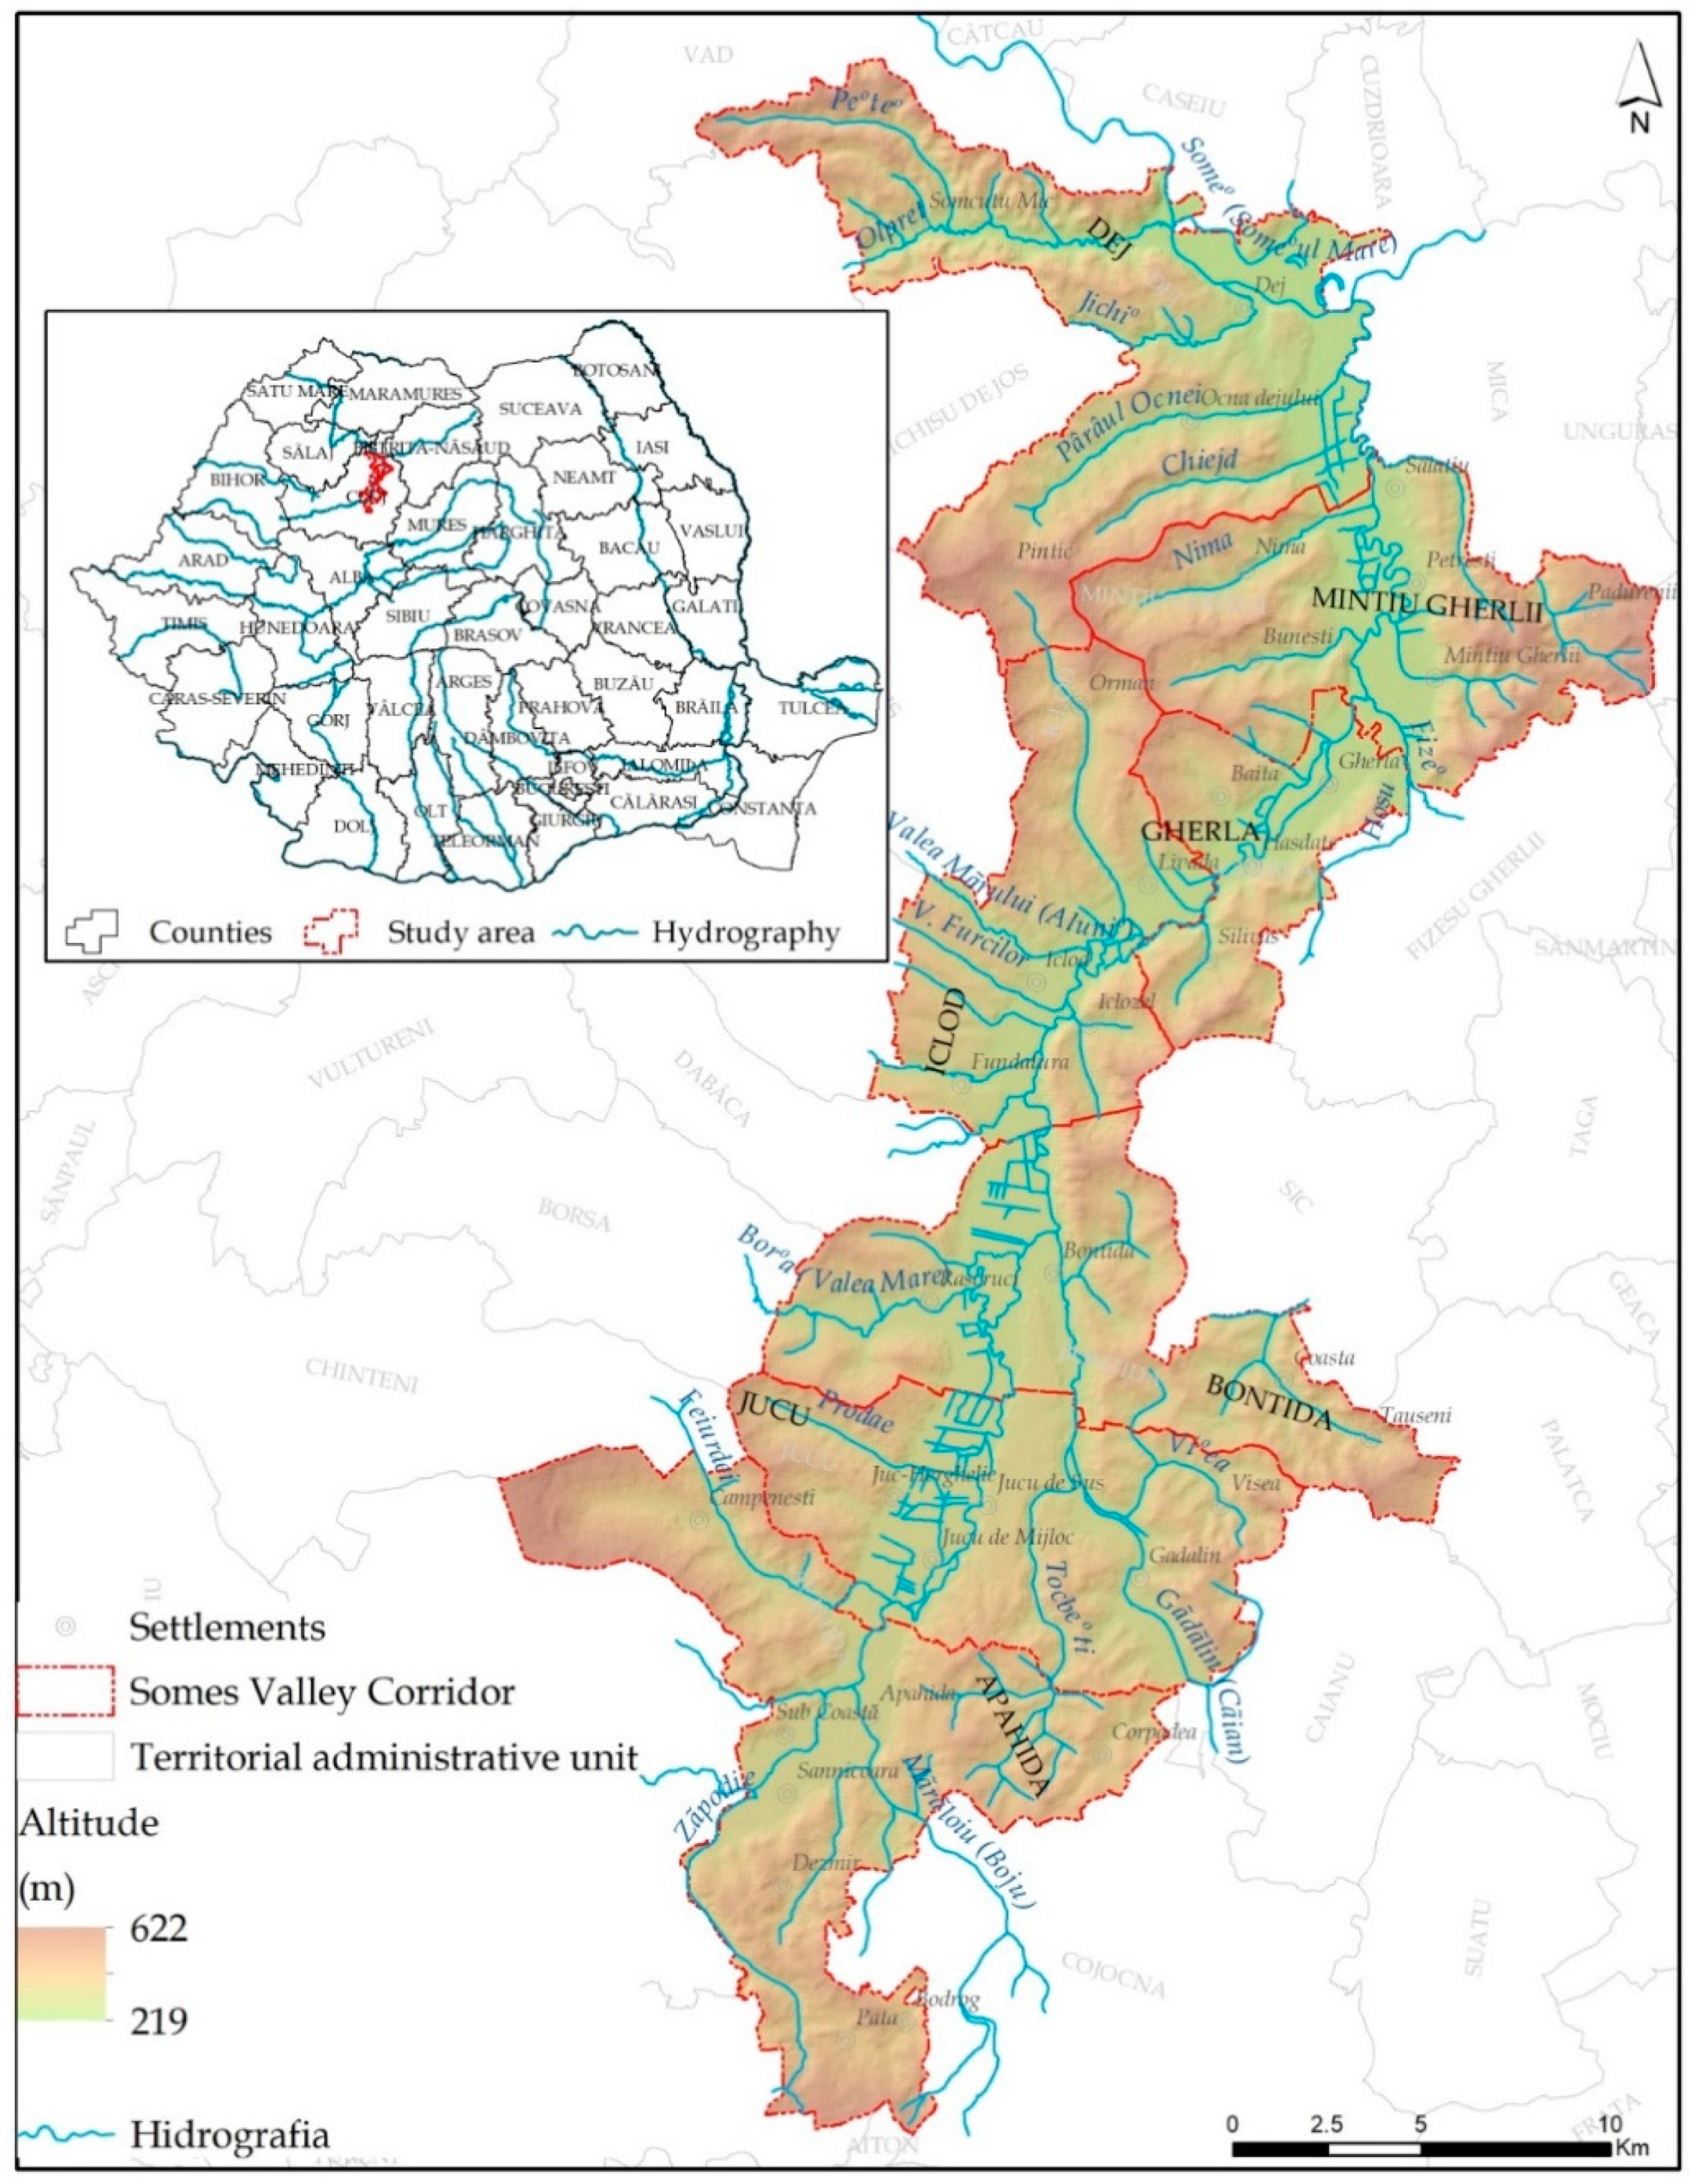
Study Area
2. Materials and Methods
2.1. G.I.S. Determination of Land Suitability for Arable Use
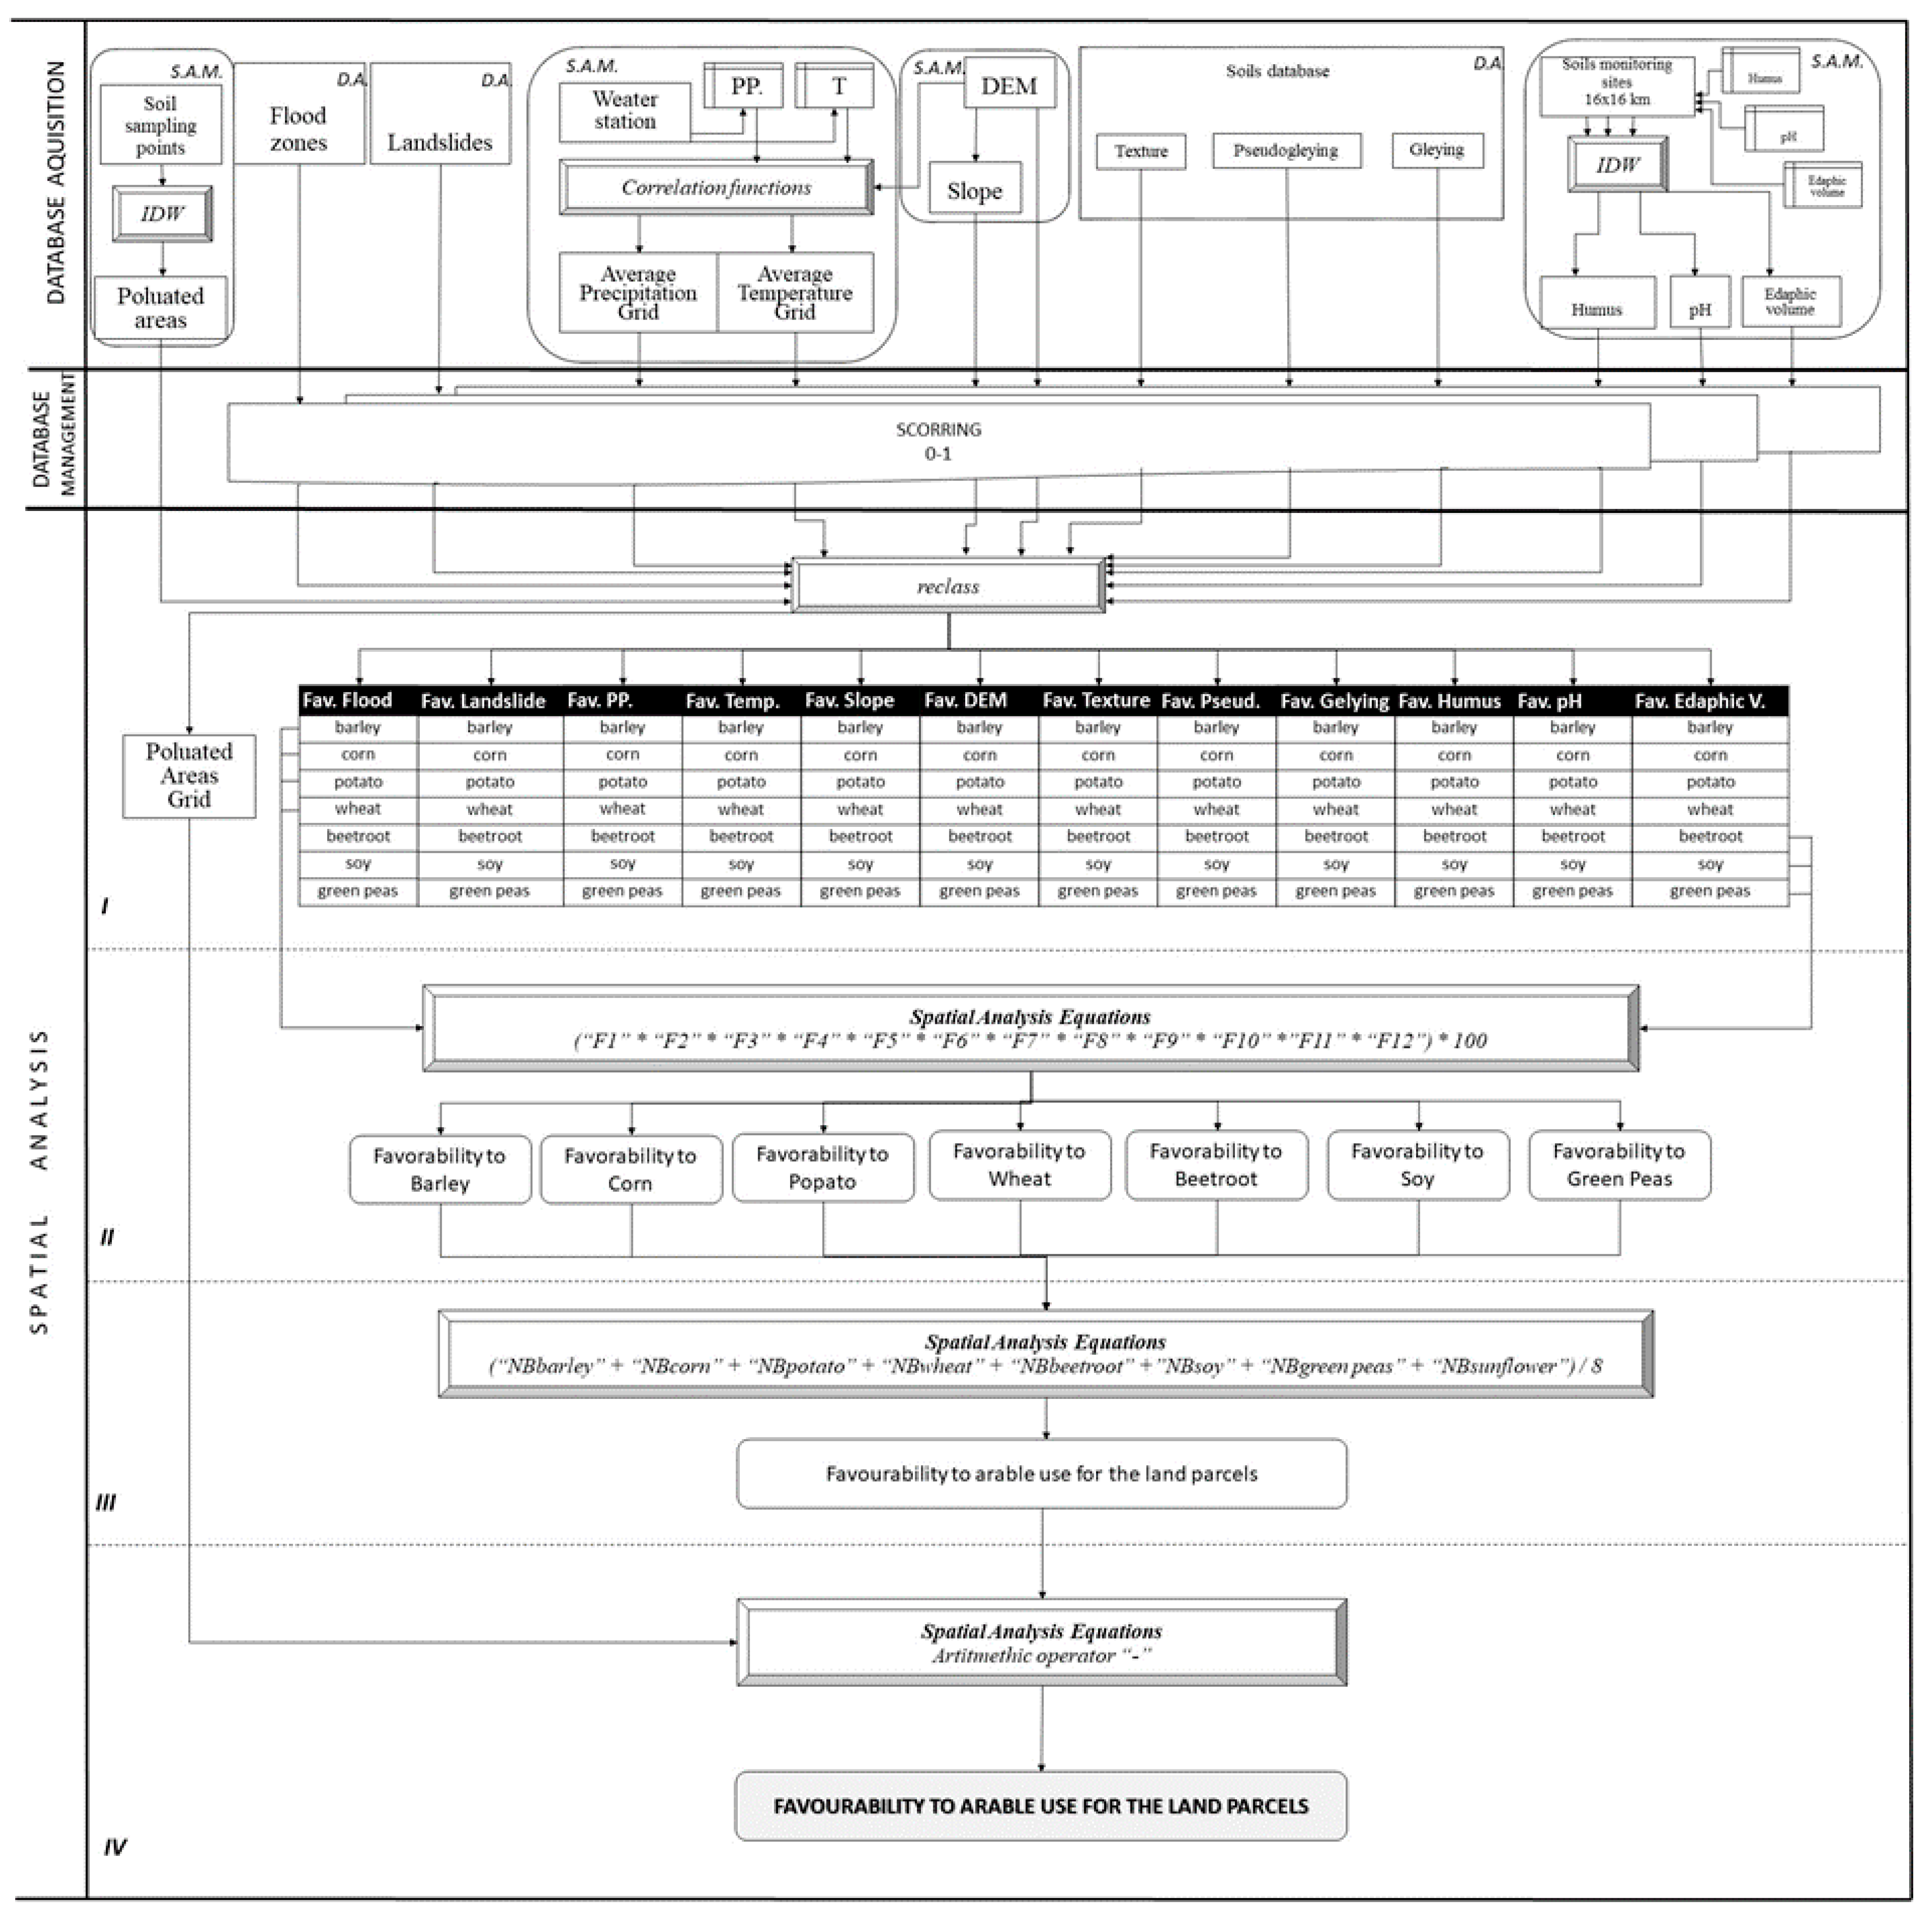
2.2. Methodology
“NBgreen peas” + “NBsunflower”)/8
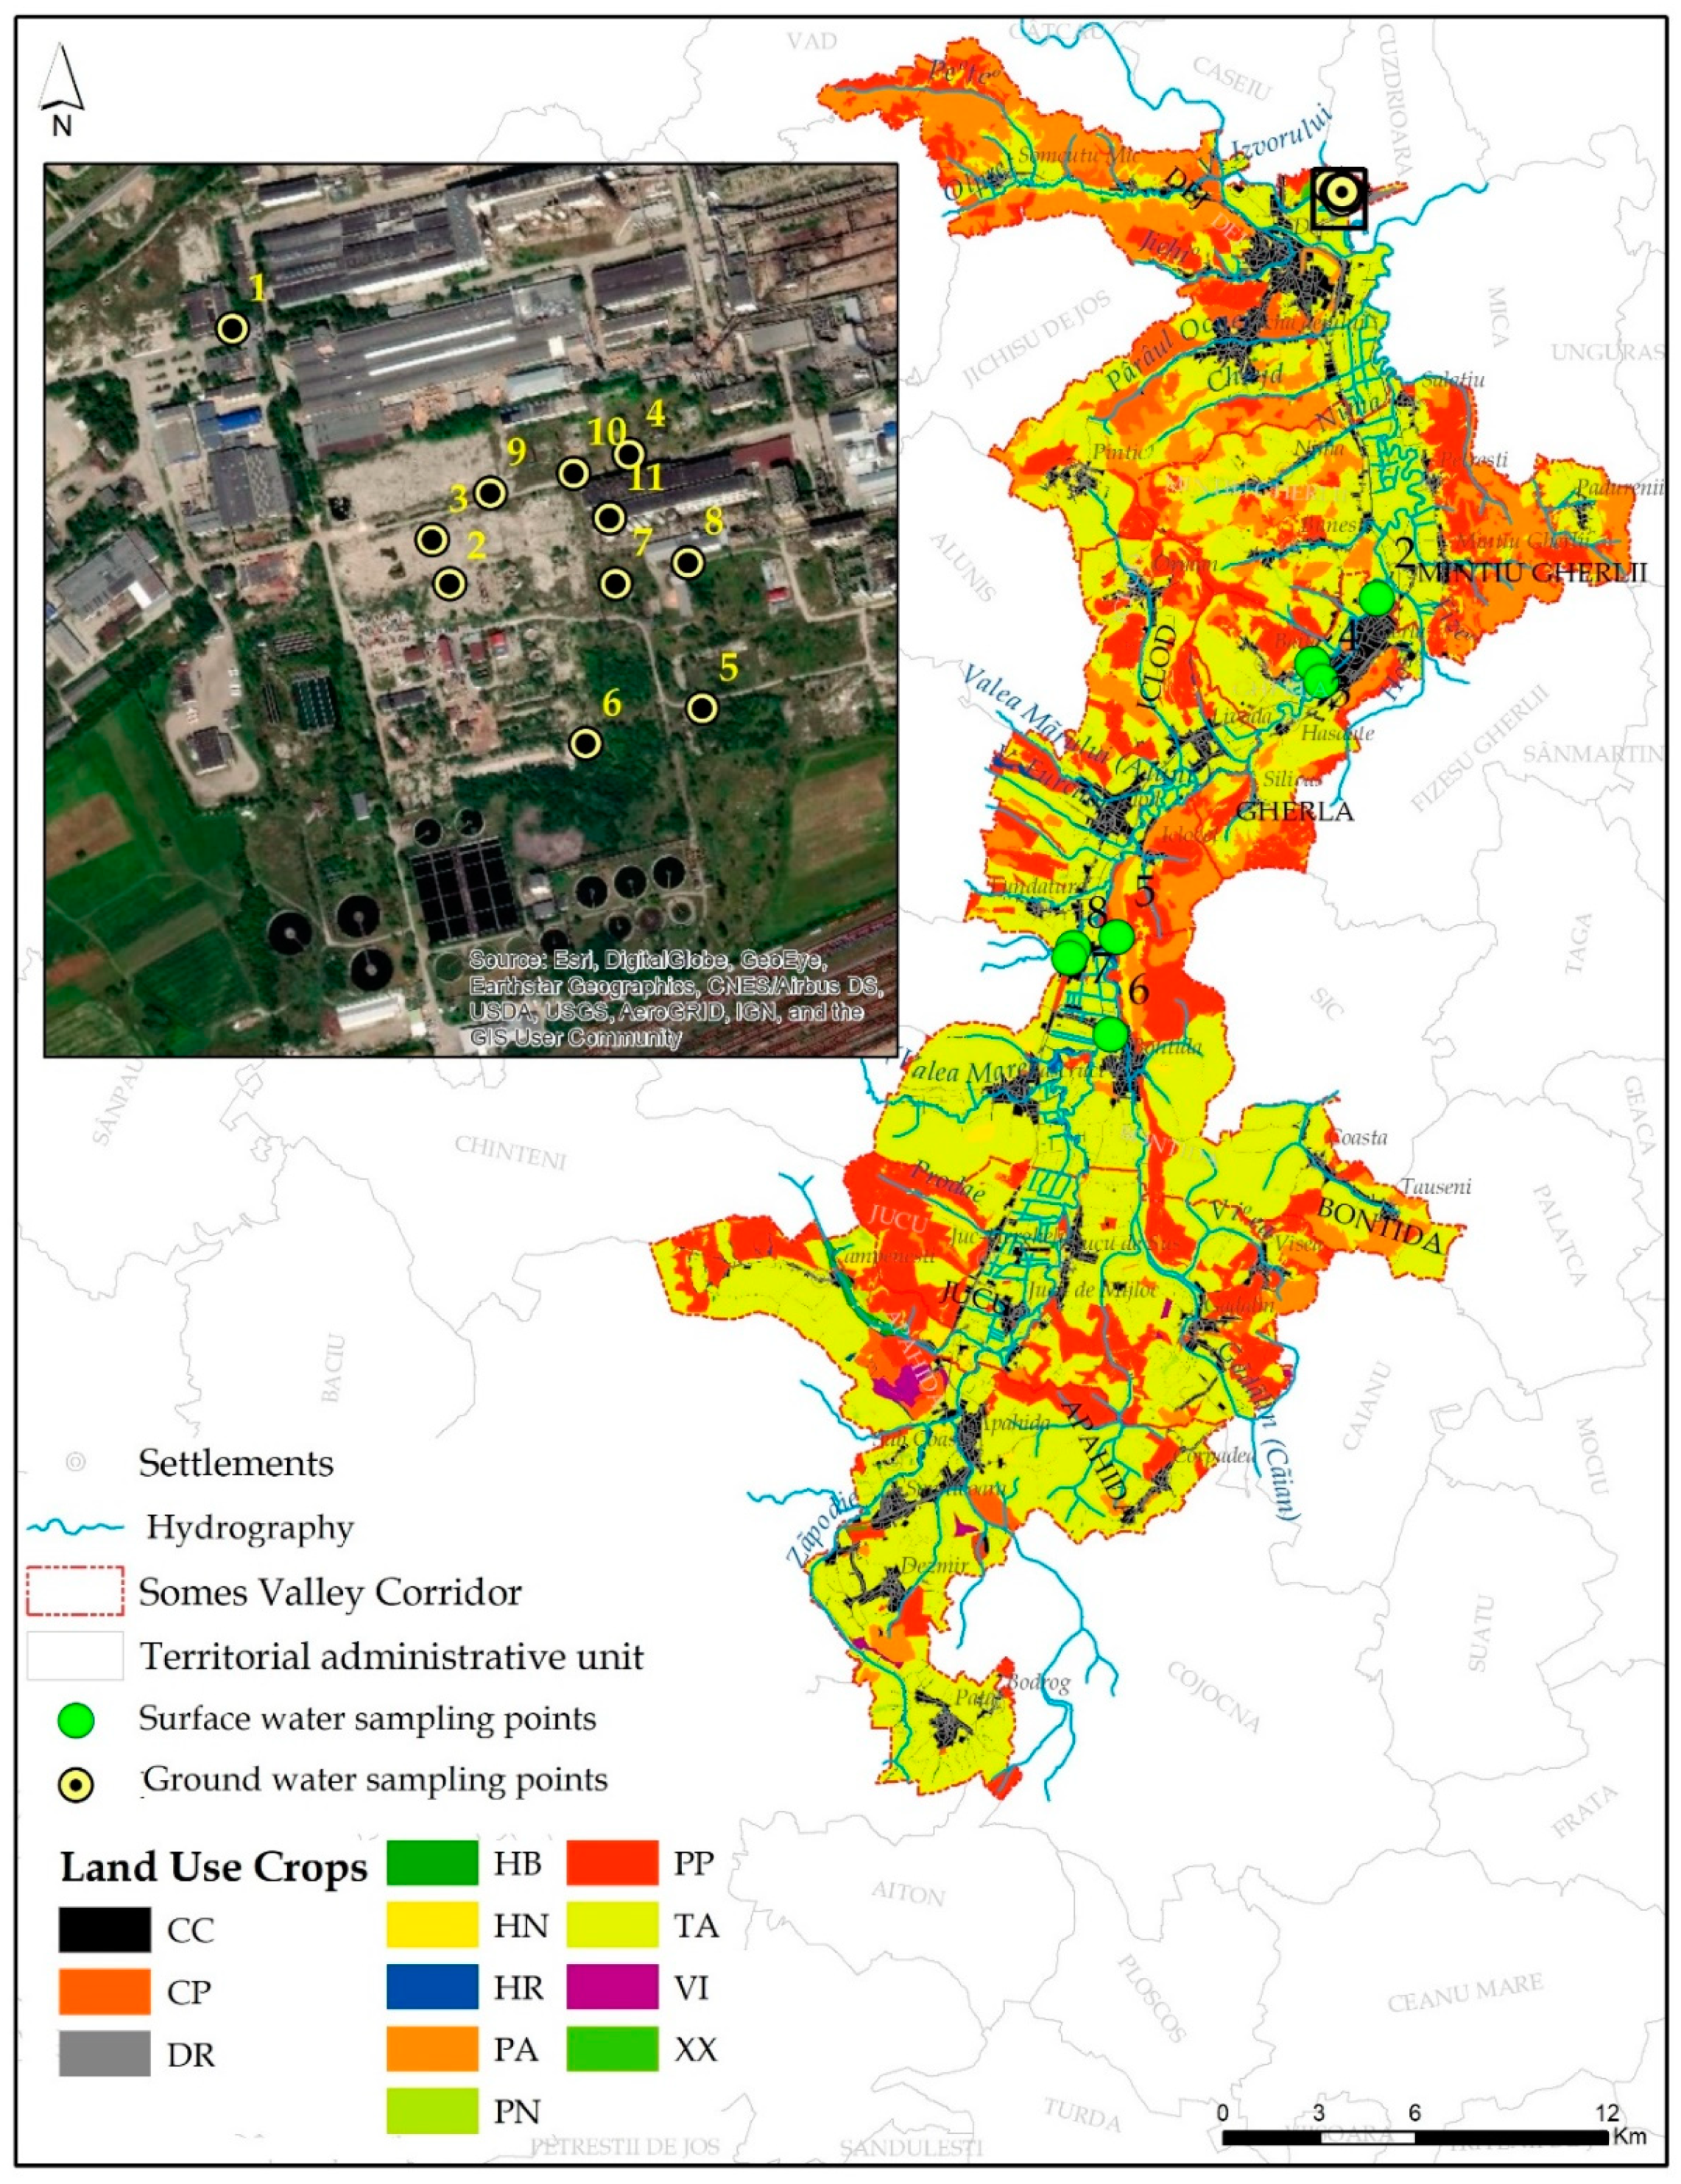
2.3. The Identification of Contaminated Sites
3. Results
3.1. Groundwater and Soil Pollution
3.2. The Modelling of the Parameters Required for the Classification of Agricultural Suitability
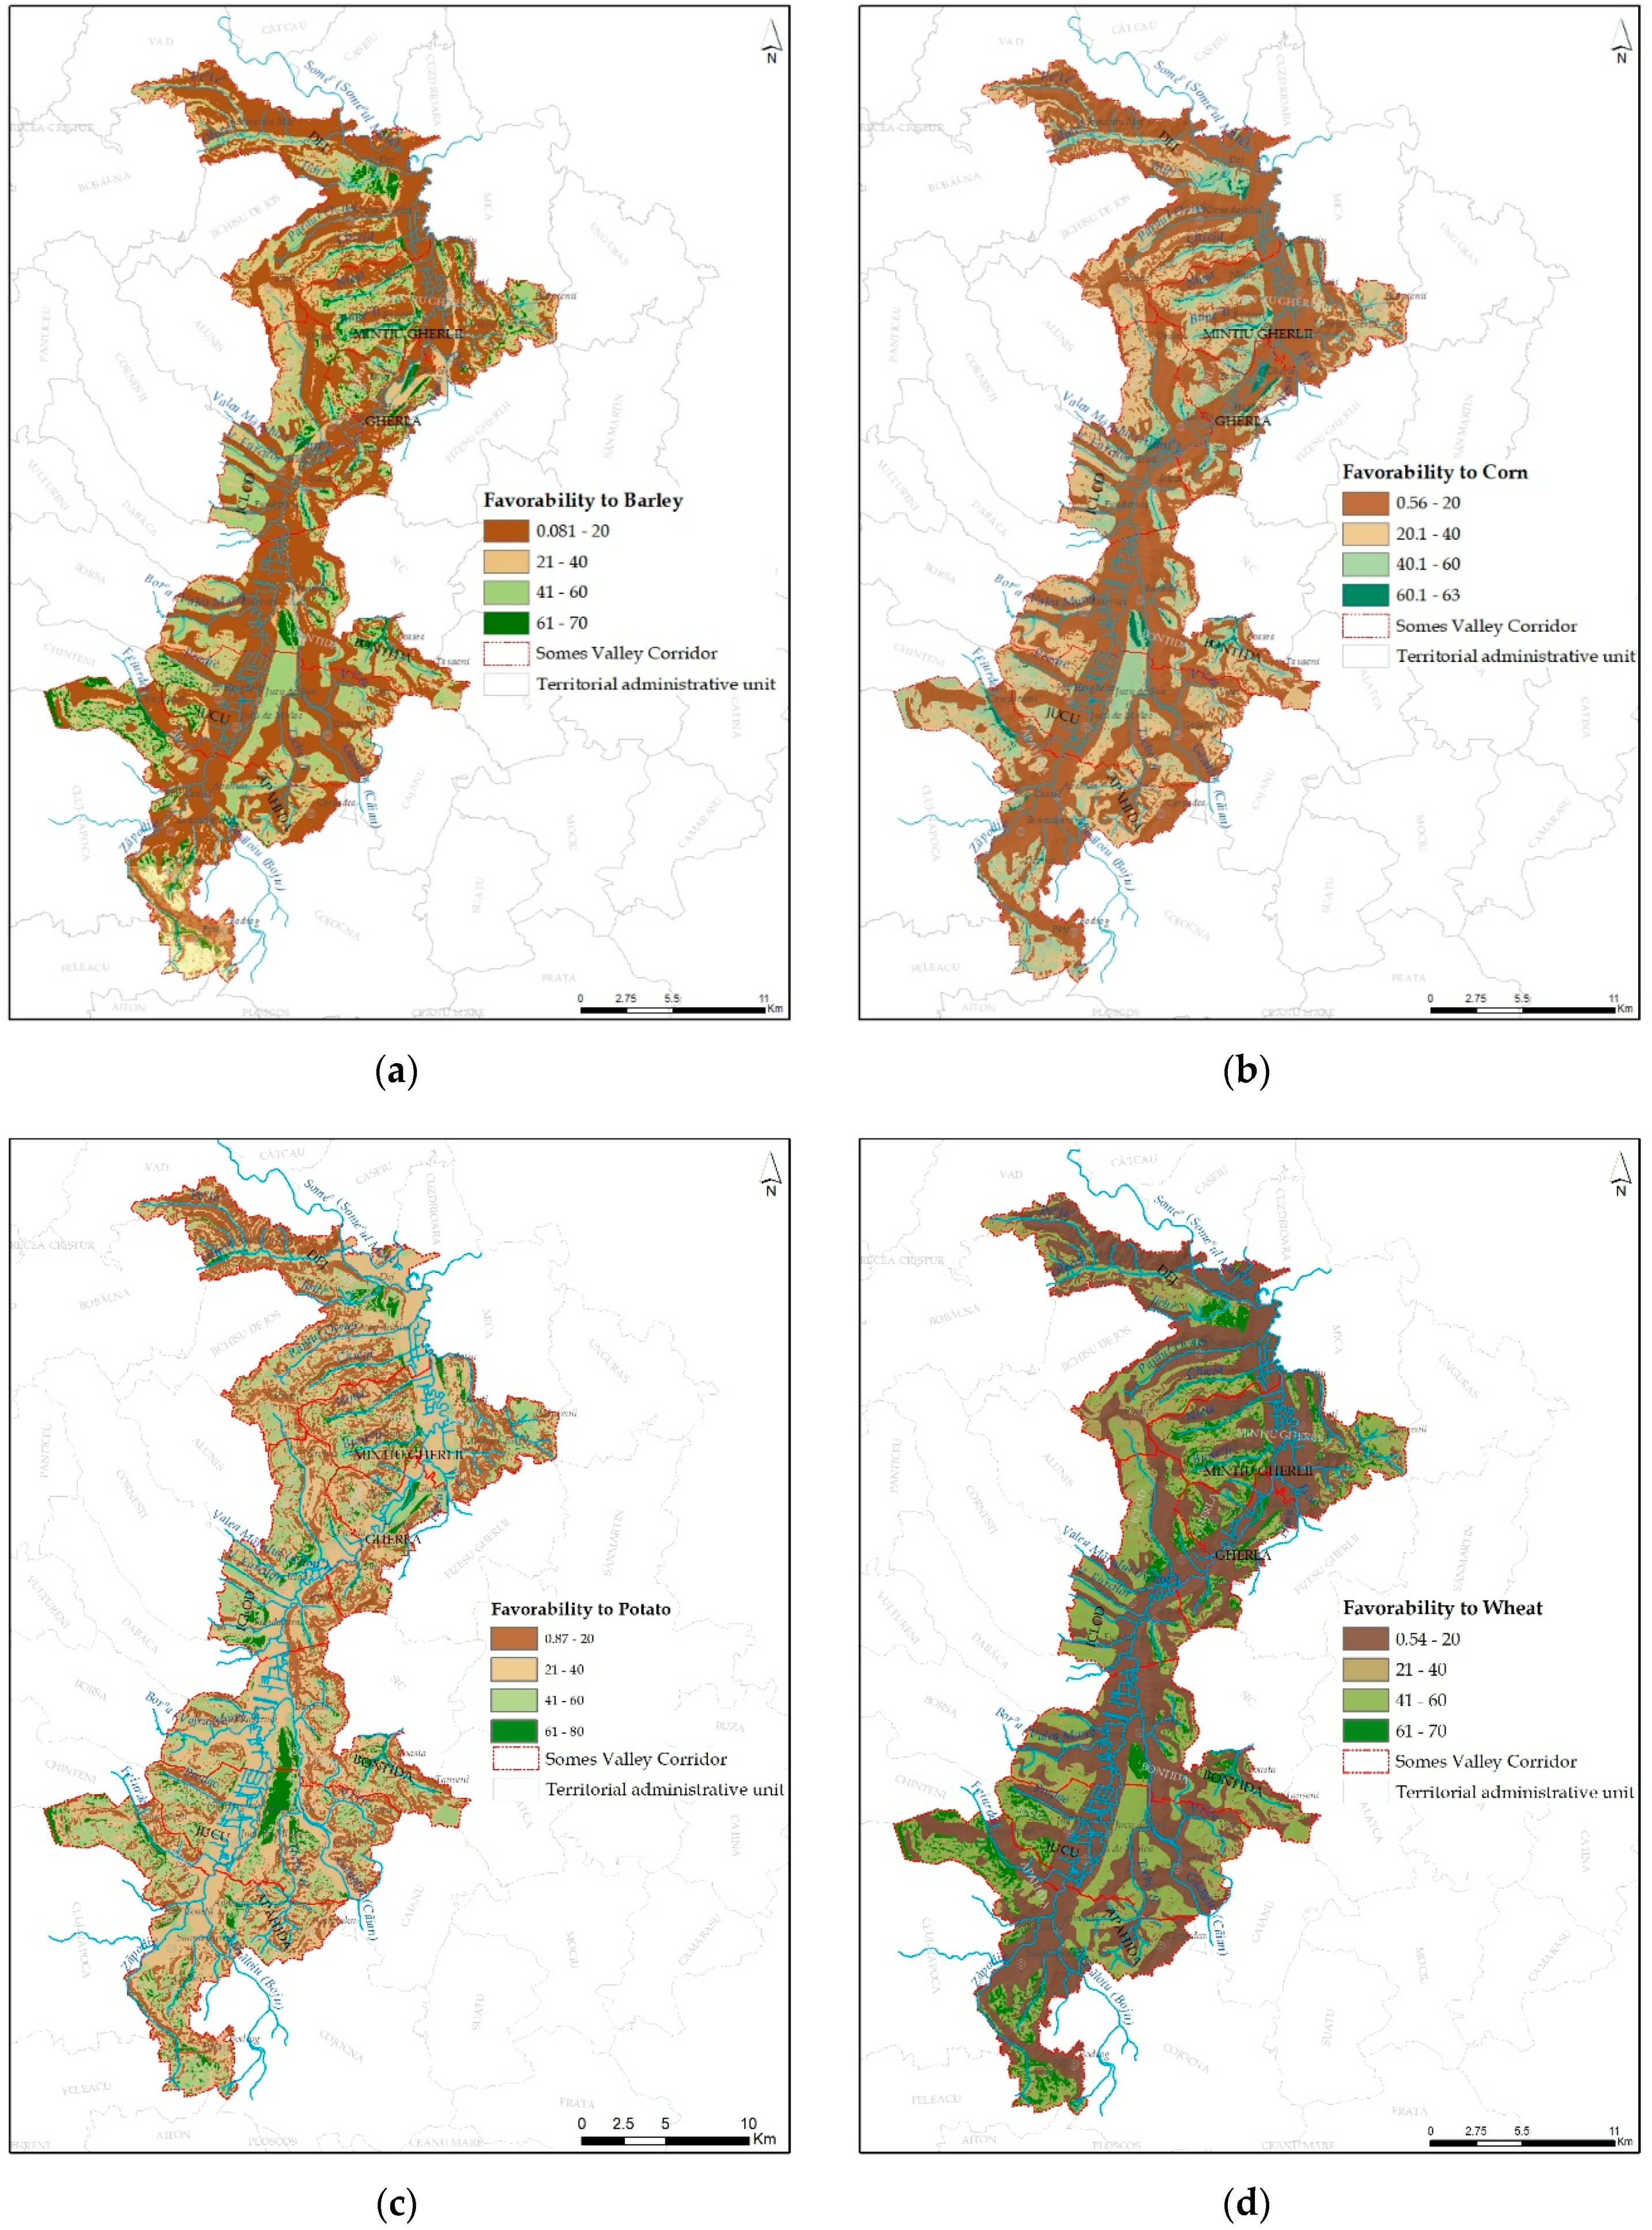
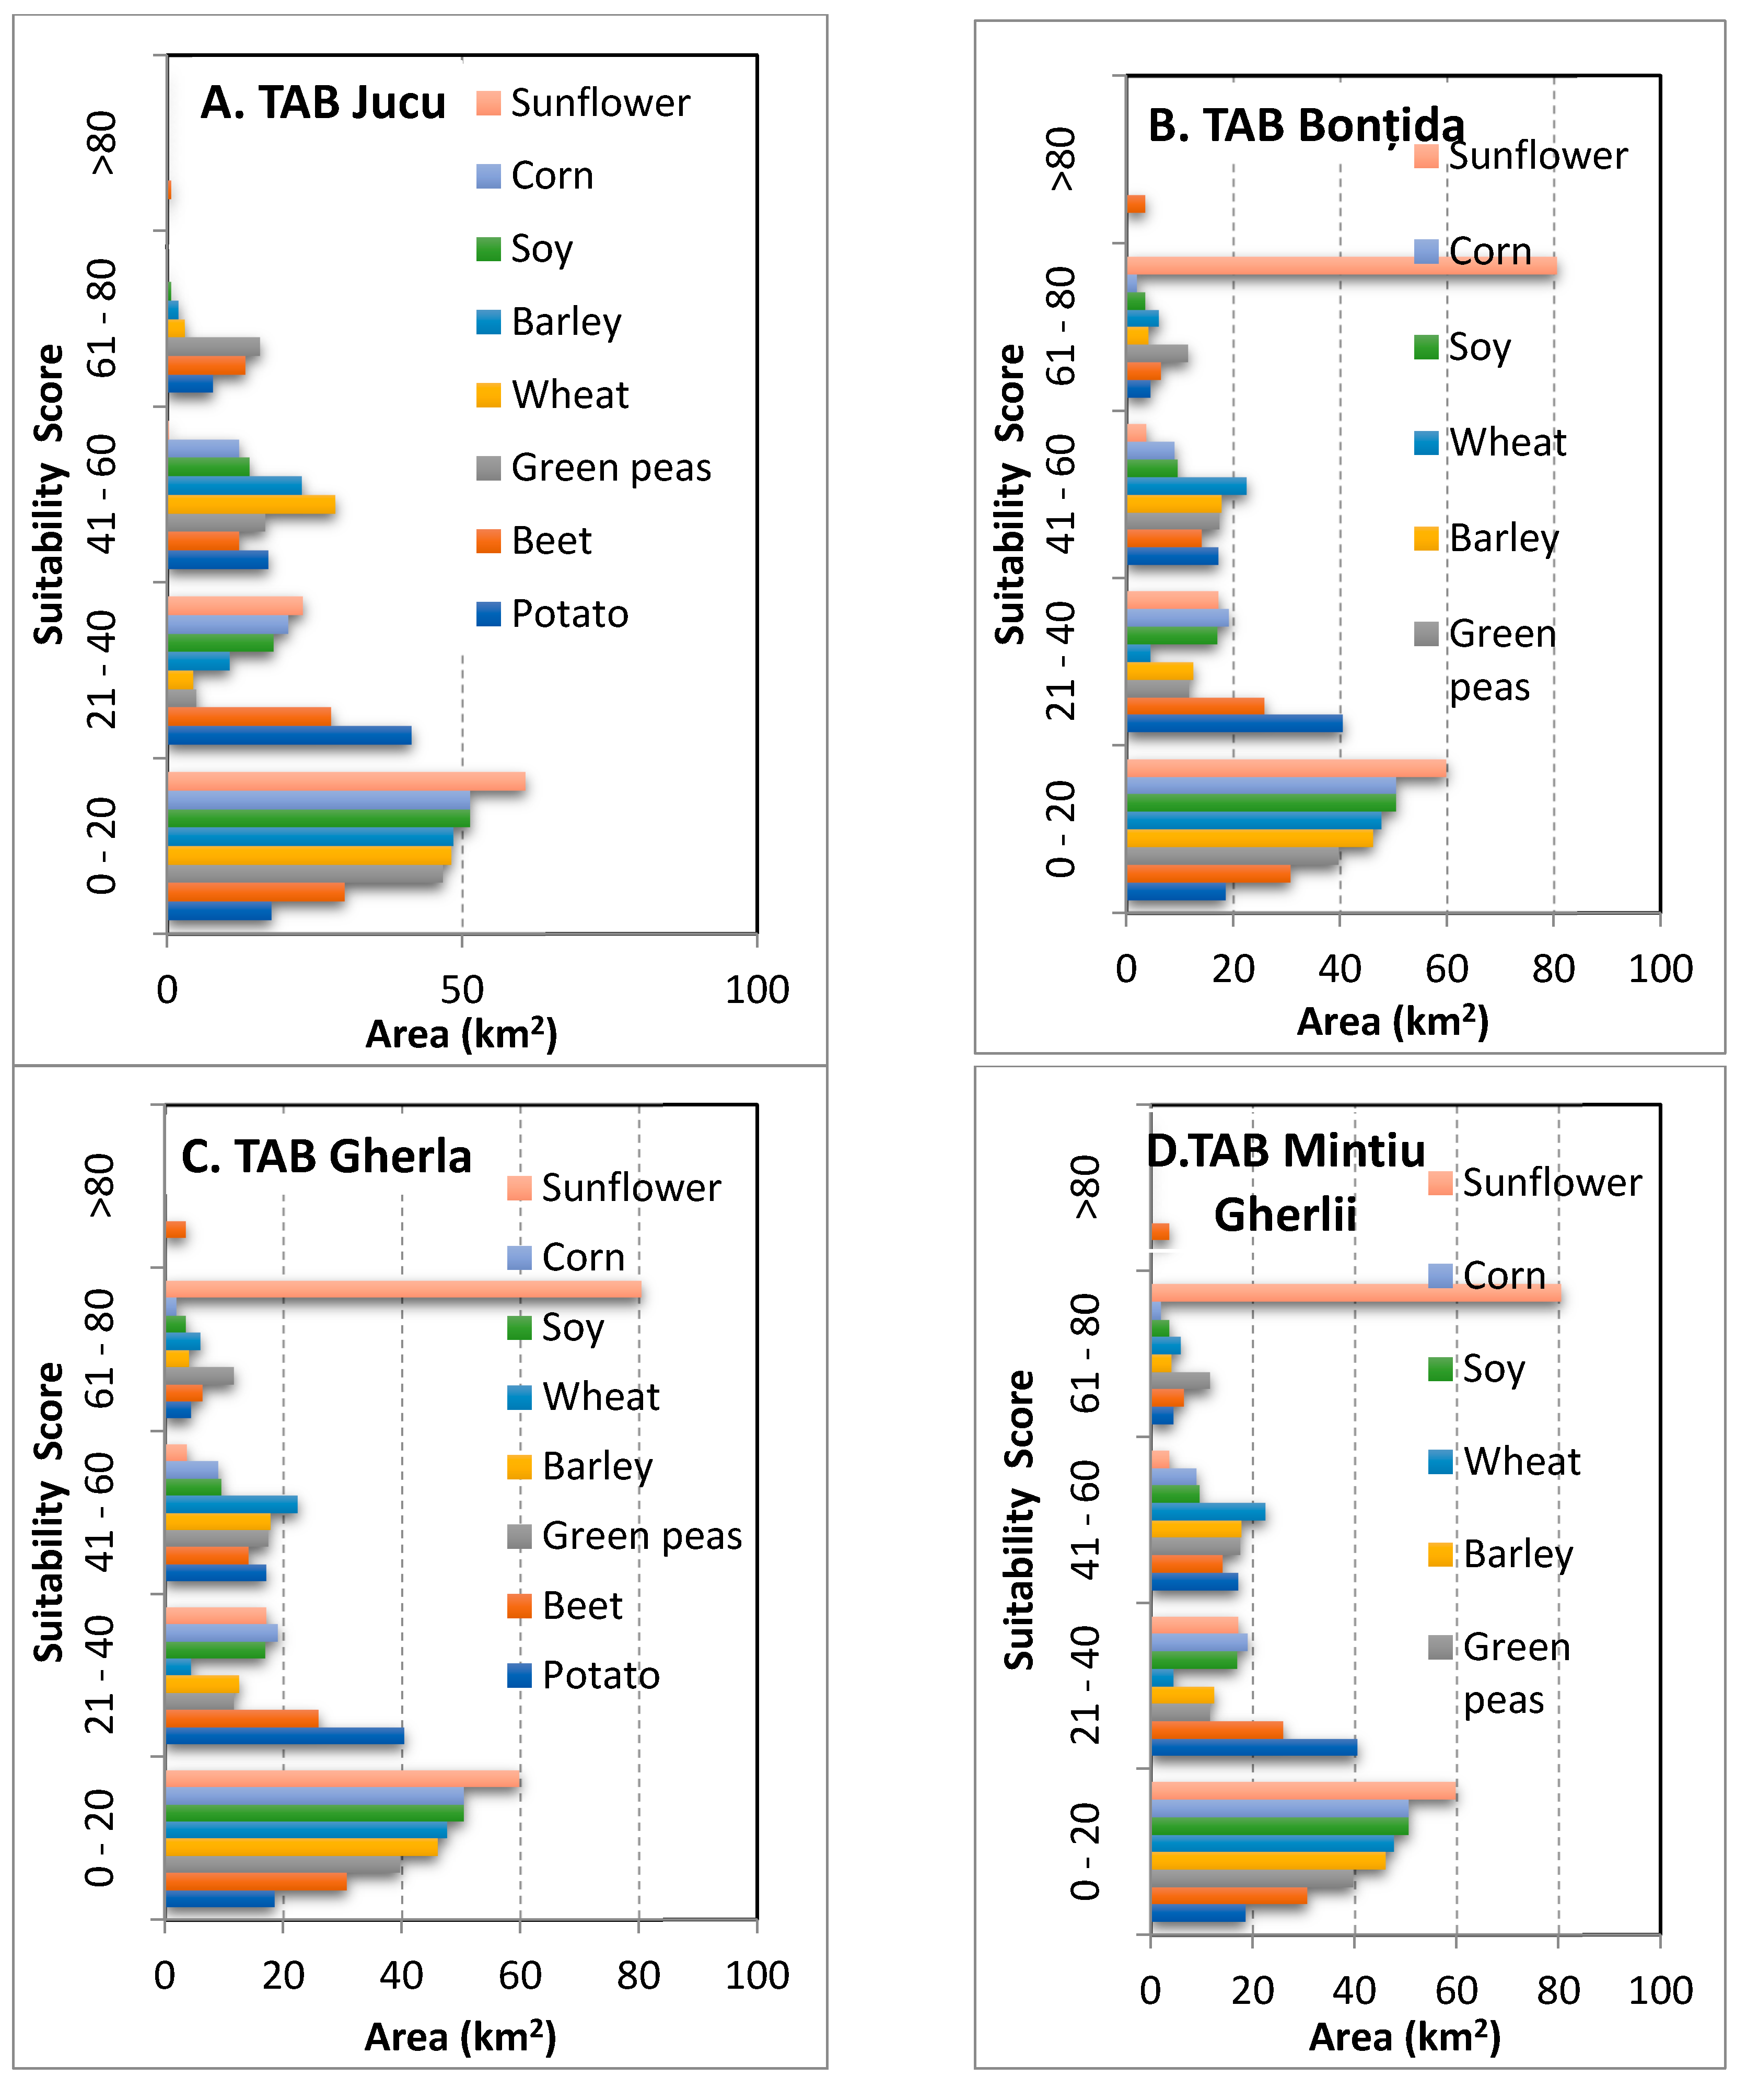
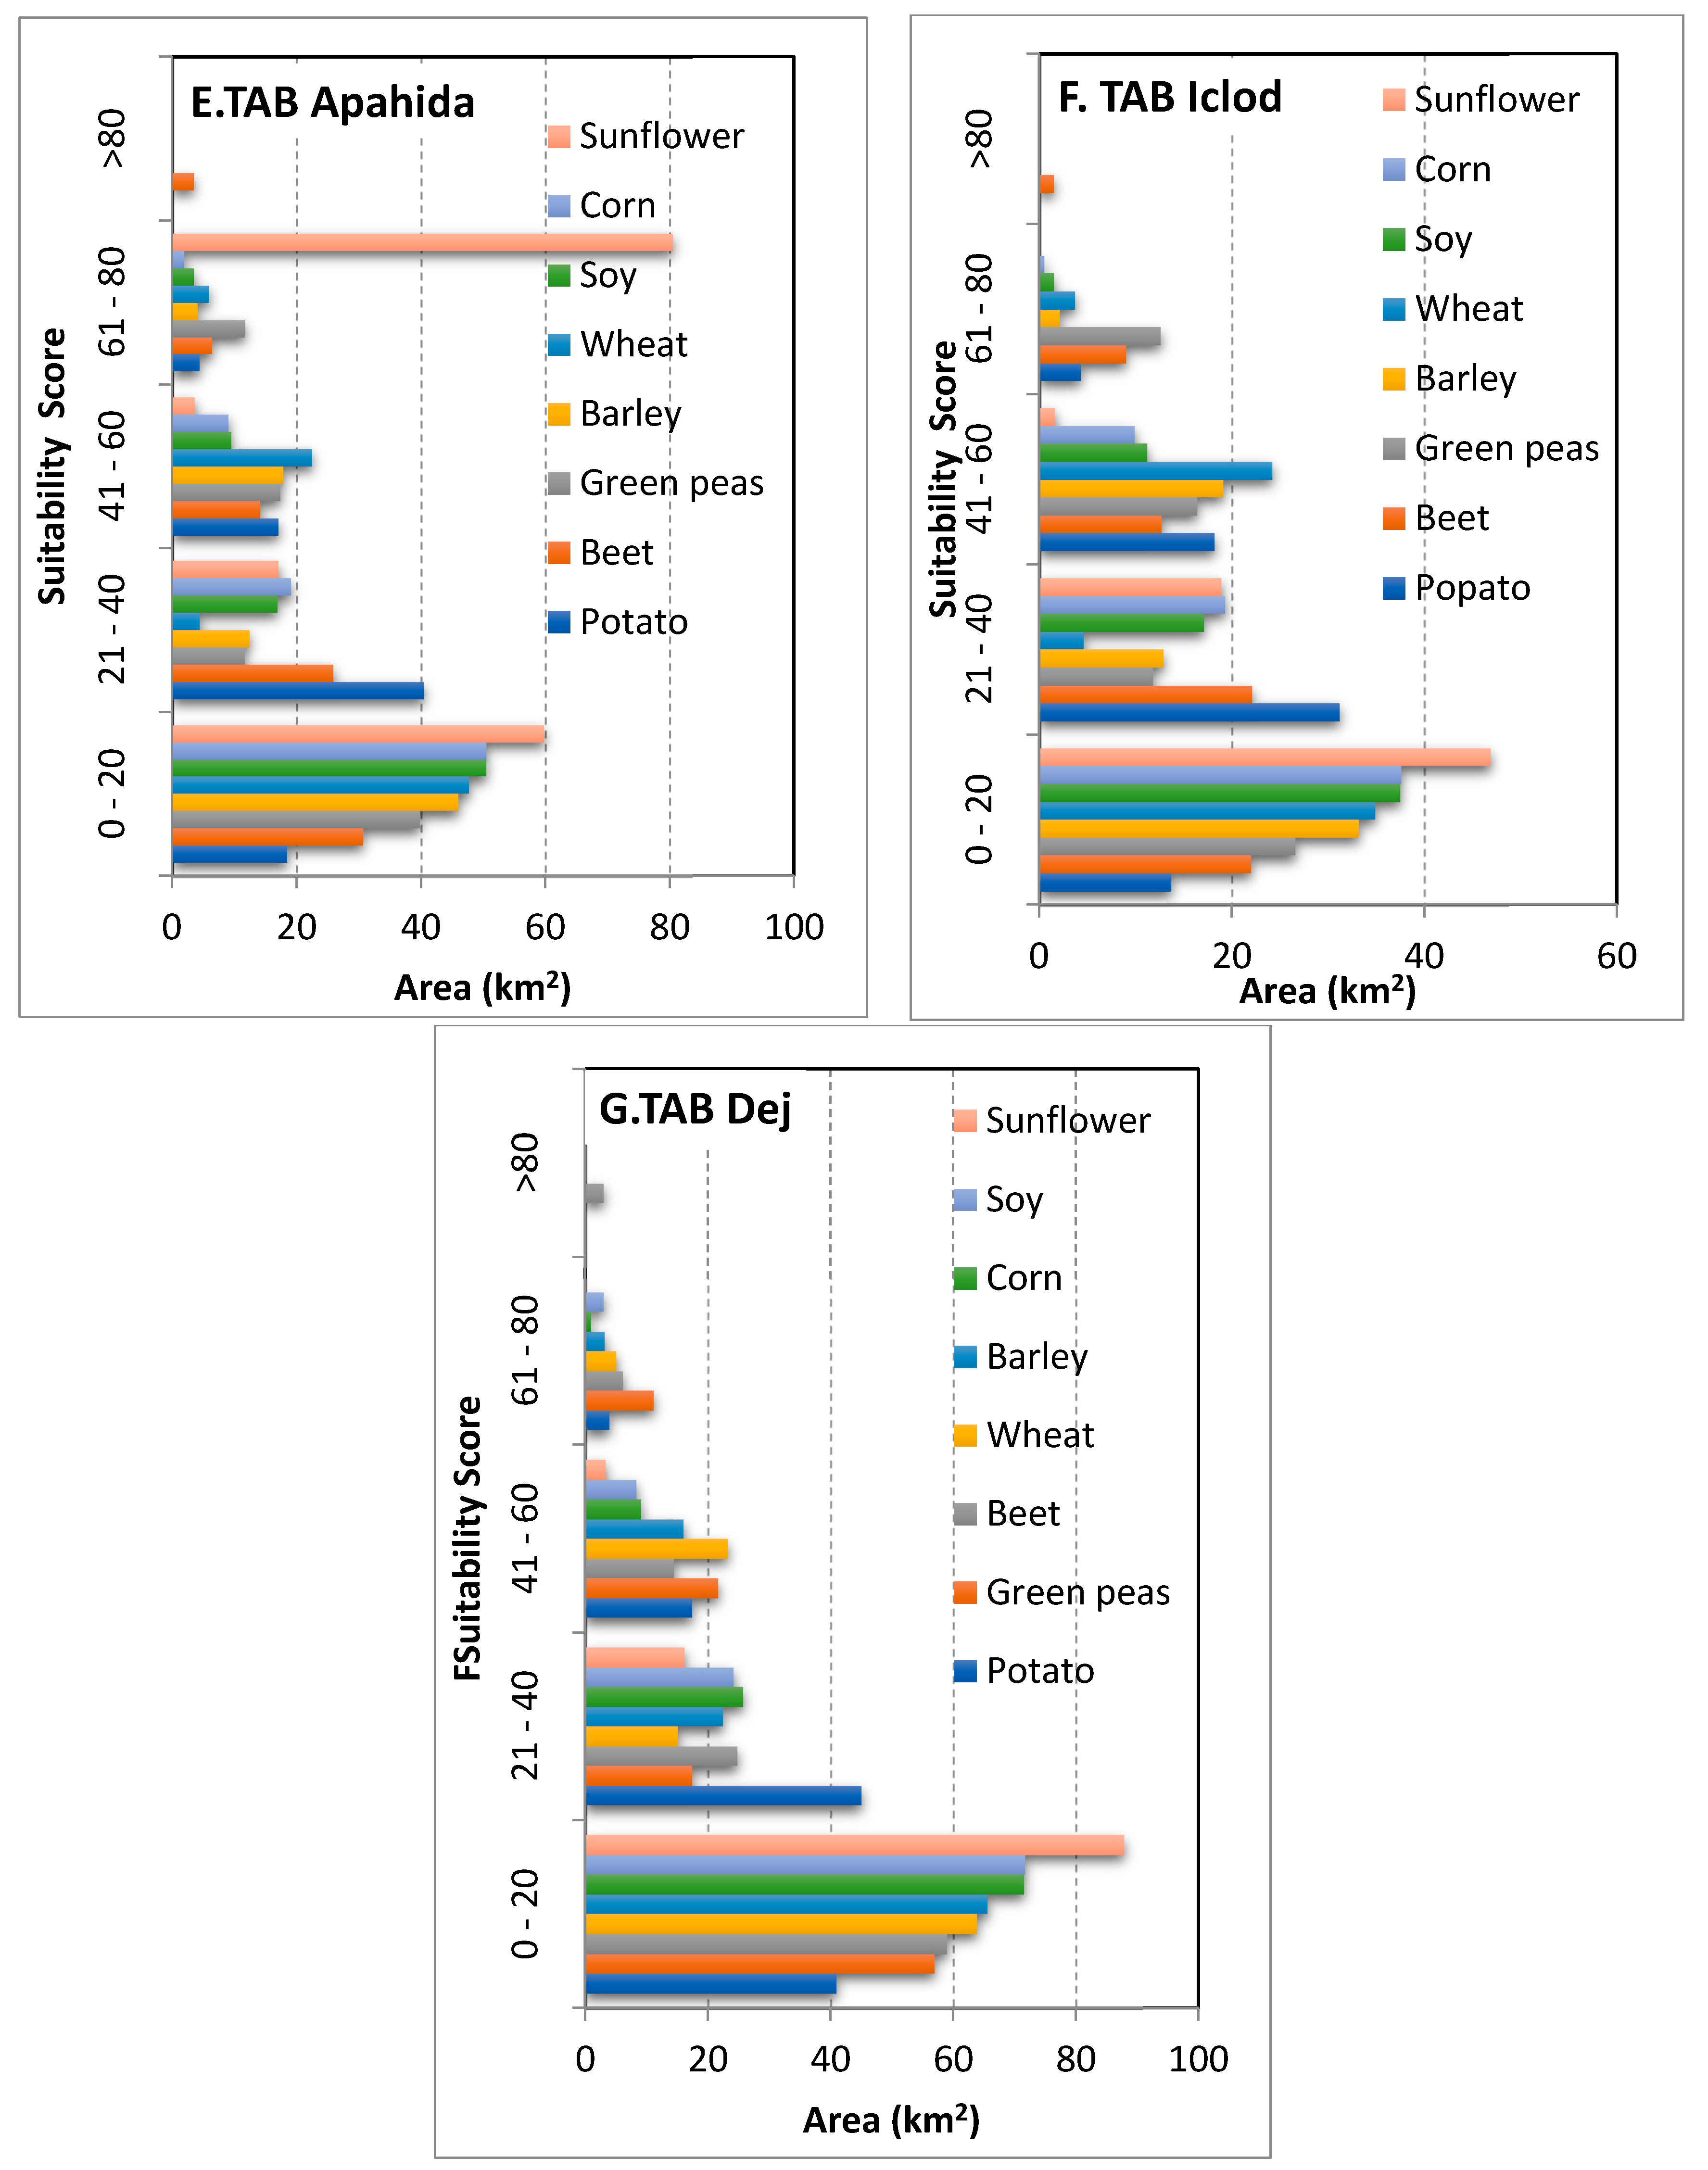
3.3. Favourability for Crops of Barley, Corn, Potato, Wheat, Soy, Green Peas, Beetroot and Sunflower
4. Discussion
5. Conclusions
Supplementary Materials
Author Contributions
Funding
Acknowledgments
Conflicts of Interest
References
- Huang, Y.; Li, T.; Wu, C.; He, Z.; Japenga, J.; Deng, M.; Yang, X. An integrated approach to assess heavy metal source apportionment in peri-urban agricultural soils. J. Hazard. Mater. 2015, 299, 540–549. [Google Scholar] [CrossRef] [PubMed]
- Krishna, A.K.; Mohan, K.R. Distribution, correlation, ecological and health risk assessment of heavy metal contamination in surface soils around an industrial area, Hyderabad, India. Environ. Earth Sci. 2016, 75, 411. [Google Scholar] [CrossRef]
- Hou, D.; O’Connor, D.; Nathanail, P.; Tian, L.; Ma, Y. Integrated GIS and multivariate statistical analysis for regional scale assessment of heavy metal soil contamination: A critical review. Environ. Pollut. 2017, 231, 1188–1200. [Google Scholar] [CrossRef] [PubMed]
- Sestraş, P.; Sălăgean, T.; Bilașco, S.; Bondrea, M.V.; Naș, S.; Fountas, S.; Cîmpeanu, S.M. Prospect of a GIS based digitization and 3D model for a better management and land use in a specific micro-areal for crop trees. Environ. Eng. Manag. J. 2019, 18, 1269–1277. [Google Scholar] [CrossRef]
- Rusu, T.; Coste, C.L.; Moraru, P.I.; Szajdak, L.W.; Pop, A.I.; Duda, B.M. Impact of climate change on agro-climatic indicators and agricultural lands in the Transylvanian Plain between 2008–2014. Carpathian J. Earth Environ. Sci. 2017, 12, 23–34. [Google Scholar]
- FAO. Guidelines for Soil Description, 4th ed.; FAO/UNESCO: Rome, Italy, 2006; p. 108. [Google Scholar]
- PATJCluj.ro. Available online: https://www.patjcluj.ro/rezultatele/studii-de-fundamentare/studiul-de-fundamentare-privind-riscurile-naturale.html?fbclid=IwAR3fAyA2sV-qgb4BQ1dtjanCzsLXSHgo2BhQ2pQCySvyfjvOQhuPNa7vaDM (accessed on 4 March 2020).
- Corpade, C.; Man, T.; Petrea, D.; Corpade, A.M.; Moldovan, C. Changes in landscape structure induced by transportation projects in Cluj-Napoca periurban area usig GIS. Carpathian J. Earth Environ. Sci. 2014, 9, 177–184. [Google Scholar]
- Sestras, P.; Bondrea, M.; Cetean, H.; Sălăgean, T.; Bilaşco, Ş.; Naș, S.; Spalevic, V.; Fountas, S.; Cîmpeanu, S. Ameliorative, ecological and landscape roles of Făget Forest, Cluj-Napoca, Romania, and possibilities of avoiding risks based on GIS landslide susceptibility map. Not. Bot. Horti Agrobo. 2018, 46, 292–300. [Google Scholar] [CrossRef] [Green Version]
- Bilaşco, Ş.; Roşca, S.; Păcurar, I.; Moldovan, N.; Boţ, A.; Negrușier, C.; Sestras, P.; Bondrea, M.; Naș, S. Identification of Land Suitability for Agricultural Use by Applying Morphometric and Risk Parameters Based on GIS Spatial Analysis. Not. Bot. Horti Agrobo. 2016, 44, 302–312. [Google Scholar] [CrossRef] [Green Version]
- Sestras, P.; Roșca, S.; Bilașco, Ș.; Naș, S.; Buru, S.M.; Kovacs, L.; Spalević, V.; Sestras, A.F. Feasibility Assessments Using Unmanned Aerial Vehicle Technology in Heritage Buildings: Rehabilitation-Restoration, Spatial Analysis and Tourism Potential Analysis. Sensors 2020, 20, 2054. [Google Scholar] [CrossRef] [Green Version]
- Valera, C.A.; Valle Junior, R.F.; Varandas, S.G.P.; Sanches Fernandes, L.F.; Pacheco, F.A.L. The role of environmental land use conflicts in soil fertility: A study on the Uberaba River basin, Brazil. Sci. Total Environ. 2016, 562, 463–473. [Google Scholar] [CrossRef]
- Palšová, L.; Melichová, K.; Melišková, I. Modelling Development, Territorial and Legislative Factors Impacting the Changes in Use of Agricultural Land in Slovakia. Sustainability 2019, 11, 3893. [Google Scholar] [CrossRef] [Green Version]
- Szelag-Sikora, A.; Sikora, J.; Niemiec, M.; Gródek-Szostak, Z.; Kapusta-Duch, J.; Kuboń, M.; Komorowska, M.; Karcz, J. Impact of Integrated and Conventional Plant Production on Selected Soil Parameters in Carrot Production. Sustainability 2019, 11, 5612. [Google Scholar] [CrossRef] [Green Version]
- Vilček, J.; Koco, Š.; Litavcová, E.; Torma, S. Characteristics of Soil Parameters of Agricultural Land Use Types, Their Location and Development Forecast. Land 2020, 9, 197. [Google Scholar] [CrossRef]
- Bot, A.I.; Ioan, P.Ä.; Szajdak, L.W.; Viorela, P.L.E.È.; Sanda, R.O.È. Land Suitability Evaluation for Blueberry Crop by Determining the Qualitative Properties of the Identified Soil Type Related with the Antioxidant Capacity of Fruits. Not. Sci. Biol. 2017, 9, 571–576. [Google Scholar] [CrossRef]
- Păcurar, H.; Dîrja, M.; Buta, M.; Păcurar, I.; Roșca, S.; Bilașco, Ș. Identification of Soils Factors Influence in the Distributions of Tuber aestivum in Transylvanian Subcarpathian Hill, Romania. Not. Bot. Horti Agrobo. 2018, 47, 478–486. [Google Scholar] [CrossRef] [Green Version]
- Roşca, S.; Simonca, V.; Bilasco, S.; Vescan, I.; Fodorean, I.; Petrea, D. The Assessment of Favourability and Spatio-Temporal Dynamics of Pinus Mugo in the Romanian Carpathians Using GIS Technology and Landsat Images. Sustainability 2019, 11, 3678. [Google Scholar] [CrossRef] [Green Version]
- Șimonca, V.; Roșca, S.; Colișar, A.; Rebrean, F.; Bilașco, Ș. Favourable and Restrictive Factors for Quercus pubescens in the Transylvanian Basin, Evaluated by GIS Techniques. Not. Bot. Horti Agrobo. 2019, 47, 1299–1307. [Google Scholar] [CrossRef] [Green Version]
- Higgs, B.; Johnston, A.E.; Salter, J.L.; Dawson, C.J. Some Aspects of Achieving Sustainable Phosphorus Use in Agriculture. J. Environ. Q. 2000, 17, 80–87. [Google Scholar] [CrossRef]
- Brevik, E.; Calzolari, C.; Miller, B.; Pereira, P.; Kabala, C.; Baumgarten, A.; Jordán, A. Historical perspectives and future needs in soil mapping, classification and pedological modelling. Geoderma 2016, 264, 256–274. [Google Scholar] [CrossRef]
- Ennaji, W.; Barakat, A.; El Baghdadi, M.; Oumenskou, H.; Aadraoui, M.; Karroum, L.A.; Hilali, A. GIS-based multi-criteria land suitability analysis for sustainable agriculture in the northeast area of Tadla plain (Morocco). J. Earth Syst. Sci. 2018, 127, 14. [Google Scholar] [CrossRef] [Green Version]
- Dong, R.; Jia, Z.; Li, S. Risk assessment and sources identification of soil heavy metals in a typical county of Chongqing Municipality, Southwest China. Process Saf. Environ. Prot. 2018, 113, 275–281. [Google Scholar] [CrossRef]
- El-Aziz, S.H. Evaluation of land suitability for main irrigated crops in the North-Western Region of Libya. Eurasian J. Soil Sci. 2018, 7, 73–86. [Google Scholar] [CrossRef]
- Yang, Q.; Li, Z.; Lu, X.; Duan, Q.; Huang, L.; Bi, J. A review of soil heavy metal pollution from industrial and agricultural regions in China: Pollution and risk assessment. Sci. Total Environ. 2018, 642, 690–700. [Google Scholar] [CrossRef] [PubMed]
- Pacheco, F.A.L.; Varandas, S.G.P.; Sanches Fernandes, L.F.; Valle Junior, R.F. Soil losses in rural watersheds with environmental land use conflicts. Sci. Total Environ. 2014, 485–486, 110–120. [Google Scholar] [CrossRef] [PubMed]
- Roşca, S. Application of soil loss scenarios using the ROMSEM model depending on maximum land use pretability classes. A case study. Studia UBB Geogr. 2014, 59, 101–116. [Google Scholar]
- Bilaşco, Ş.; Roşca, S.; Fodorean, I.; Vescan, I.; Filip, S.; Petrea, D. Quantitative evaluation of the risk induced by dominant geomorphological processes on different land uses, based on GIS spatial analysis models. Front. Earth Sci. 2018, 12, 311–324. [Google Scholar]
- Pacheco, F.A.L. Sustainable Use of Soils and Water: The Role of Environmental Land Use Conflicts. Sustainability 2020, 12, 1163. [Google Scholar] [CrossRef] [Green Version]
- Bilaşco, Ş.G.I.S. model for achieving the spatial correlation between average multi-annual precipitations and altitude. Studia UBB Geogr. 2009, 2, 71–78. [Google Scholar]
- Roşca, S.M.; Bilaşco, Ş.; Păcurar, I.; Oncu, M.; Negrușier, C.; Petrea, D. Land Capability Classification for Crop and Fruit Product Assessment Using GIS Technology. Case Study: The Niraj River Basin (Transylvania Depression, Romania). Not. Bot. Horti Agrobo. 2015, 43, 235–242. [Google Scholar] [CrossRef] [Green Version]
- Salkovic, E.; Djurovic, I.; Knezevic, M.; Popovic-Bugarin, V.; Topalovic, A. Digitization and Mapping of National Legacy Soil Data of Montenegro. Soil Water Res. 2018, 13, 83–89. [Google Scholar] [CrossRef] [Green Version]
- Abd-Elmabod, S.K.; Bakr, N.; Muñoz-Rojas, M.; Pereira, P.; Zhang, Z.; Cerdà, A.; Jordán, A.; Mansour, H.; De la Rosa, D.; Jones, L. Assessment of Soil Suitability for Improvement of Soil Factors and Agricultural Management. Sustainability 2019, 11, 1588. [Google Scholar] [CrossRef] [Green Version]
- Florea, N.; Bălăceanu, V.; Răuţă, C.; Canarache, A. Soil Assessment Study Methodology, Part I and II; Institutul de cercetări pentru Pedologie şi Agrochimie: Bucureşti, Romania, 1986. [Google Scholar]
- Florea, N.; Bălăceanu, V.; Răuţă, C.; Canarache, A. Soil assessment study methodology (MESP). In Part III Ecopedological Indicators; Redacţia de Propagandă Tehnică Agricolă, ICPA: Bucureşti, Romania, 1987. [Google Scholar]
- Wang, G.; Zhang, S.; Xiao, L.; Zhong, Q.; Li, L.; Xu, G.; Deng, O.; Pu, Y. Heavy metals in soils from a typical industrial area in Sichuan, China: Spatial distribution, source identification, and ecological risk assessment. Environ. Sci. Pollut. Res. 2017, 24, 16618–16630. [Google Scholar] [CrossRef] [PubMed]
- Wang, M.; Peng, C.; Chen, W. Impacts of industrial zone in arid area in Ningxia province on the accumulation of heavy metals in agricultural soils. Environ. Sci. 2016, 37, 3532–3539. [Google Scholar]
- Zhang, S.; Liu, Y.; Yang, Y.; Ni, X.; Arif, M.; Charles, W.; Li, C. Trace Elements in Soils of a Typical Industrial District in Ningxia, Northwest China: Pollution, Source, and Risk Evaluation. Sustainability 2020, 12, 1868. [Google Scholar] [CrossRef] [Green Version]
- Hasan, K.; Taner, A.; Enver, K.; Smail, S. Evaluation of grain yield and quality of barley varieties under rainfed conditions. Afr. J. Biotechnol. 2010, 9, 7825–7830. [Google Scholar]
- Rusu, F.; Haș, I.; Munteanu, M. Varieties of Spring Barley for Beer Obtained at Agricultural Research and Development Turda. Bulletin of University of Agricultural Sciences and Veterinary Medicine Cluj-Napoca. Agriculture 2012, 69, 339–341. [Google Scholar]
- Soare, E.; Dobre, I. Changes and trends of corn production in Romania, Scientific Papers Series Management. Econ. Eng. Agric. Rural. Dev. 2016, 16, 511–516. [Google Scholar]
- Chiran, A.; Gîndu, E.; Banu, A.; Ciobotaru, E.A. The Market of Agricultural and Agri-Food Products-Theoretical and Practical Approach; Editura Ceres: Bucureşti, Romania, 2004. [Google Scholar]
- Lazar, C.; Lazar, D.A. Simulation of temperature increase on winter wheat yields and development in South–Eastern Romania. Rom. Agric. Res. 2010, 27, 7–15. [Google Scholar]
- Croitoru, A.E.; Holobaca, I.H.; Lazar, C.; Moldovan, F.; Imbroane, A. Air temperature trend and the impact on winter wheat phenology in Romania. Clim. Chang. 2012, 111, 393–410. [Google Scholar] [CrossRef]
- Moulin, A.P.; Buckley, K.E.; Volkmar, K. Soil quality as affected by amendments in pinto bean-potato rotations. Can. J. Soil Sci. 2011, 91, 533–542. [Google Scholar] [CrossRef]
- Roman, G.V.; Tabara, V.; Pirsan, P.; Axinte, M.; Stefan, M.; Robu, T. Field Crops—Cereals and Grain Legumes; Universitara Publishing House: Bucharest, Romania, 2011. [Google Scholar]
- Dima, D.C. Soybean Crop in Romania, Bulgaria and the Republic of Moldova: Current Situation and Perspectives. Agric. Agric. Sci. Procedia 2015, 6, 3–8. [Google Scholar] [CrossRef]
- Petcu, E.; Arsintescu, A.; Stanciu, D. The effect of drought stress on fatty acid composition in some Romanian sunflower hybrids. Rom. Agric. Res. 2001, 15, 39–43. [Google Scholar]
- Čurović, Ž.; Čurović, M.; Spalević, V.; Janic, M.; Sestras, P.; Popović, S.G. Identification and Evaluation of Landscape as a Precondition for Planning Revitalization and Development of Mediterranean Rural Settlements—Case Study: Mrkovi Village, Bay of Kotor, Montenegro. Sustainability 2019, 11, 2039. [Google Scholar] [CrossRef] [Green Version]
- Vlad, V. Requirements for the decision support systems for land management. Științ. Solului 2002, 36, 88–99. [Google Scholar]
- Manea, A.; Dumitru, M.; Risnoveanu, I.; Dumitru, S. Land Evaluation under Meadows use from Ampoi basin inder natural and Heavy Metal Pollution Conditions. Ann. Univ. Craiova Agric. Mont. Cadastre Ser. 2012, 42, 308–319. [Google Scholar]


© 2020 by the authors. Licensee MDPI, Basel, Switzerland. This article is an open access article distributed under the terms and conditions of the Creative Commons Attribution (CC BY) license (http://creativecommons.org/licenses/by/4.0/).
Share and Cite
Matei, I.; Pacurar, I.; Rosca, S.; Bilasco, S.; Sestras, P.; Rusu, T.; Jude, E.T.; Tăut, F.D. Land Use Favourability Assessment Based on Soil Characteristics and Anthropic Pollution. Case Study Somesul Mic Valley Corridor, Romania. Agronomy 2020, 10, 1245. https://doi.org/10.3390/agronomy10091245
Matei I, Pacurar I, Rosca S, Bilasco S, Sestras P, Rusu T, Jude ET, Tăut FD. Land Use Favourability Assessment Based on Soil Characteristics and Anthropic Pollution. Case Study Somesul Mic Valley Corridor, Romania. Agronomy. 2020; 10(9):1245. https://doi.org/10.3390/agronomy10091245
Chicago/Turabian StyleMatei, Ioan, Ioan Pacurar, Sanda Rosca, Stefan Bilasco, Paul Sestras, Teodor Rusu, Eugen Traian Jude, and Florian Dumitru Tăut. 2020. "Land Use Favourability Assessment Based on Soil Characteristics and Anthropic Pollution. Case Study Somesul Mic Valley Corridor, Romania" Agronomy 10, no. 9: 1245. https://doi.org/10.3390/agronomy10091245