Article

Method of Tillage with the Factor Determining the Quality of Organic Matter

1
Lab of Environmental Chemistry, Department of Biogeochemistry and Soil Science, University of Science and Technology, 6 Bernardynska St., 85-029 Bydgoszcz, Poland
2
Department of Agronomy, University of Science and Technology, 7 Kaliskiego St., 85-796 Bydgoszcz, Poland
*
Author to whom correspondence should be addressed.
Agronomy 2020, 10(9), 1250; https://doi.org/10.3390/agronomy10091250
Submission received: 7 July 2020 / Revised: 20 August 2020 / Accepted: 22 August 2020 / Published: 25 August 2020

Abstract

:
The aim of this paper has been to determine the importance of the strip-till method for the content of carbon and the quality of organic matter as compared with plough and ploughless tillage. The question to answer has been to what extent strip-till can contribute to carbon sequestration and thus be part of the strategy of counteracting climate change. The research involved soil where conventional tillage (CT), strip-till (ST), and reduced tillage (RT) were applied. These systems differ completely in the way they affect the post-harvest residue, i.e., “plant residue management”. For air-dry soil samples, the following analyses were made: the content of total organic carbon (TOC) and total nitrogen (Nt), content of dissolved organic carbon (DOC) and dissolved nitrogen (DNt), and the fractional composition of humus. In the surface layer the content of TOC ranged from 11.96 (CT) to 13.88 g kg−1 (RT) and DOC ranged from 209.9 (CT) to 230.5 mg kg−1 (ST). The share of the fraction of fluvic acids (0–15 cm layer) changed from 15.51% (RT) to 18.81% (ST), the share of the fraction of humic acids was 9.36% (ST) to 11.60%, and humins were 68.90% (CT) to 72.6% (RT). These results demonstrated that the tillage system determines the properties of the organic matter of soil. In the surface layer (0–15 cm) and in the 30–50 cm layer the properties of the soil organic matter under strip-till had a greater similarity to the soil under ploughless tillage than under conventional tillage. Ploughless tillage and strip-till considerably limited the leaching of carbon and nitrogen from the surface layer to the 30–50 cm layer. Strip-till, similarly to ploughless tillage, is the tillage method which can be crucial for the process of carbon sequestration.

1. Introduction

The content of organic matter is an essential indicator of soil quality and fertility. Organic matter is one of the soil components which are crucial for the physicochemical properties of soil, such as its sorptive and buffer abilities, aggregate stability, water infiltration, and energy required for tillage as well as soil biodiversity and biological activity [1,2]. Soils are a significant stock of carbon within the global carbon budget. Maintaining the resources of organic matter is important not only for the production, habitat, and retention functions of soil but also for the role of soil in the processes of sequestration of carbon and the reduction of the impact of the greenhouse effect [3]. Tillage treatments in intensive farming, especially in monoculture, destroy the soil structure and increase its aeration and thus, intensive humus mineralization and the release of carbon dioxide to the atmosphere, increasing the share of agriculture in the total balance of that gas from all the sectors of economy [4,5]. More and more frequently the management of agricultural production space requires taking actions to protect the soil organic matter, which is also one of the key objectives of EU policy [6].
As commonly known, the content of organic matter (OM) depends on many environmental factors (e.g., temperature and humidity) and anthropogenic factors such as tillage, fertilization, and land use (forests, meadows, and arable land) [7,8,9]. Over recent years, as part of the sustainable agriculture development concept, so-called conservation tillage has been more and more common [10,11]. Depending on the tillage method, it can have a positive or negative effect on soil properties, including the soil organic matter [4,12]. As reported by Pittelkow et al. [13], Wezel et al. [14], and Williams et al. [15], limited-to-minimum soil loosening and the presence of mulch on the surface affect the hydrothermal conditions. Soil temperature and water losses are lower, which can enhance the accumulation of organic matter. One of the reduced tillage systems not involving the soil reversing is strip-till. This method combines the advantages of conventional and ploughless tillage. Over recent decades strip-till has been a more and more often applied method of conservation tillage in Europe and globally [16,17]. This method is used for growing plants sown in a wide and narrow row spacing and for the plants to leave a varied amount of plant residue, a potential source of organic matter [18,19,20,21,22,23]. Deeply-aerated soil strips account for less than 1/3 of the field, with 60–75% of plant residue remaining on the surface. A high amount of plant residue and reducing the tillage have a favorable effect on many soil properties, including the properties related to the increasing content of organic carbon. Laufer et al. [24] indicated that strip tillage reduced the runoff by 92% and soil loss by 98%, as compared to plough tillage. Soil loss depends on the presence of mulch on soil surface and on the soil organic carbon (SOC) content in the soil surface layer. After a few years of the application of strip-till the content of organic matter in soil increases. A higher content of organic carbon, as an effect of strip-till and other conservation methods of tillage, increases the stability of soil aggregates [25]. Fernandez et al. [26] indicated that, as a result of strip-till, after five years the content of organic carbon increased by 8.6% and, as a result, the volumetric density and resistance of soil penetration decreased. According to Powlson et al. [27] the average annual increase in SOC derived from reduced tillage was 310 ± 180 kg C ha−1 yr−1. Al-Kaisi and Yin [28] claimed that strip-tillage is an effective tillage method for carbon sequestration and for reducing the emissions of CO2. After three years of applying the method, the content of organic carbon at the depth of 0–5 cm and 5–10 cm increased significantly, as compared with chisel ploughing. Replacing ploughing with less-intensive tillage methods, including strip-till, decreased the emissions of CO2 by about 20–40%. Therefore abandoning plough tillage and introducing a simplified tillage, including strip-till, resulted in the accumulation of OC of soil nutrients [29,30].
The effect of organic matter on the physical, chemical, and biological properties of soil is related not only to the amount but also to its quantitative composition. The most mobile and fast-decomposing OM fraction is the so-called dissolved organic matter (DOM), the content of which is based on the carbon content in extracts—dissolved organic carbon (DOC). The DOM frequently accounts for less than 1% of the total organic matter, even though it plays an essential role e.g., in biogeochemical cycling of carbon, nitrogen, and phosphorus, and it can constitute the source of nutrients and energy for microorganisms [7,8,31,32]. Generally, it is assumed that changes in the DOM content can be an important indicator of changes which occur in soils, especially due to anthropogenic factors [31].
The humified organic matter in soil, which is operationally separated into humic acids (CHAs), fulvic acids (CFAs), and humins (Ch), is considered to be the most microbially-stable reservoir of soil organic matter. Humic acid is the fraction that is soluble under alkaline conditions, fulvic acid is the fraction that is soluble under both alkaline and acidic conditions, and humins are the insoluble fraction of humic substances [33]. It is assumed that the values of the ratio CHAs/CFAs can be an indicator of soil fertility and the degree of humification of organic matter [34]. CHAs/CFAs is a parameter characteristic for various soil types and, less considerably, it depends on the plant cover and the soil use, unlike the content of organic carbon. As reported by e.g., Kalbitz [7], Chantigny [8], Si et al. [30], Orlov [33], Ventorino et al. [35], and Debska et al. [36,37] in soils under agricultural use, the factor that significantly differentiates the content of DOM and the fraction of humic and fluvic acids as well as humins, especially in the surface layer of soils, is the application of agrotechnical practices (fertilization and crop-rotation).
With the above dependencies in mind, the aim of this paper has been to determine the importance of the strip-till method for the content of carbon and the quality of organic matter as compared with the plough and ploughless tillage. The above research will facilitate obtaining the answer to the question as to what extent strip-till can contribute to carbon sequestration and thus be part of the strategy of counteracting the climate change.

2. Materials and Methods

2.1. Materials

The soil was sampled from a single-factor static field experiment located at Smielin (53°09′04″ N; 17°29′11″ E), in the Kujawsko-Pomorskie province, Poland. The experiment was established in 2013. In the following years, winter rapeseed and winter wheat crops were grown in rotation. The treatments in the experiment were the tillage methods and the soil preparation for sowing winter crops in successive years:
Conventional tillage (CT)—plough tillage (medium-deep pre-sowing plough, pre-sowing mineral fertilization, seedbed preparation, and seed-drill sowing). Ploughing was at a depth of about 18–20 cm, three weeks before sowing wheat or two weeks prior to sowing rapeseed using the mouldboard plough. One week before sowing, mineral fertilisers were applied, and 1–2 days prior to sowing the seedbed was prepared at the depth of 2–4 cm for rapeseed or 3–5 cm for wheat.
Strip-till (ST)—strip tillage (pre-sowing mineral fertilization and strip sowing with a single trip of the hybrid machine). In the period from the forecrop harvest to sowing of the successive crop no treatments were performed. Soil strip loosening at the depth of 18–20 cm together with the simultaneous application of fertilisers and sowing were performed with Mzuri Pro-Til 4T. The treatment was made at the optimal date for sowing winter crops. For rapeseed this was around 15–20 August and for wheat, around 15–20 September. On that date plant seeds were sown for CT and RT treatments.
Reduced tillage (RT)—ploughless tillage (entire-space, loosening, medium-deep tillage; pre-sowing mineral fertilization; seed drilling with the cultivator-mounted seed drill). Deep loosening (18–20 cm) after harvesting the forecrop was performed using a cultivator with chisels. One week prior to sowing, mineral fertilisers were applied and these were mixed during sowing using the cultivator-mounted seed drill.
Each successive year of the four-year experiment period the methods of tillage, fertilization, and sowing for respective treatments were the same.
The experiment was set up in four replications (distribution of treatments in the block; one replication is shown in Figure 1A). The experiment was performed with haplic Cambisols, in a 0–15 cm layer, with content of sand, silt, and clay fractions of 41.4%, 52.3%, and 6.3%, respectively.
The soil (from each plot) was sampled from three layers 0–15 cm (1), 15–30 cm (2), and 30–50 cm (3), in the fourth research year immediately after harvesting winter wheat—in mid-August. For each tillage system the soil was sampled separately for each of the four plots—the replications. From each plot, 12 samples were taken along both diagonals with Egner’s sampler (Figure 1B). All the samples from the plot were combined and carefully mixed, after prior removal of undecomposed plant residue. Having dried in room temperature, the samples were sieved. For sample assaying the symbols provided above in brackets were used, e.g., CT1 stands for the soil sampled under conventional tillage from the 0–15 cm layer.

2.2. Methods

For air-dry soil samples, the following analyses were made:
The content of total organic carbon (TOC) and total nitrogen (Nt). The content of TOC and total nitrogen were assayed with the Vario Max CN analyzer (assay sensitivity of 0.01%) provided by Elementar (Germany). The contents of TOC and Nt were expressed in g kg−1 of d.w. of soil.
The content of dissolved organic carbon (DOC) and dissolved nitrogen (DNt). Dissolved organic carbon and dissolved nitrogen were assayed in the solutions from the extraction of the soil sample of 0.004 mol dm−3 CaCl2, at the ratio of soil sample:extractant of 1:10. Extracting took 1 h and then the solution was centrifuged. The content of DOC and DNt were assayed with Muli N/C 3100 Analityk Jena analyzer (Germany, assay sensitivity of 1 μg L−1) and expressed in mg kg−1 d.w. of the soil sample as well as the percentage share in the pool—TOC and Nt, respectively.
The fractional composition of humus was assayed based on the carbon fractions determined in the extracts using a Multi N/C 3100 Analityk Jena analyzer, according to the following procedure:
Decalcification (24 h) with 0.05 M HCl (1:10 w/v), Cd, (Nd)—carbon (nitrogen) in solutions after decalcification.
Extraction (24 h) of the remaining solid with 0.5 M NaOH (1:10 w/v) with occasional mixing, followed by centrifugation; C(N)HAs+CFAs—sum of the carbon (nitrogen) of humic and fulvic acids.
Precipitation (24 h) of humic acids from the resulting alkaline extract with 2 M HCl to pH = 2 and centrifugation; C(N)FAs—carbon of fulvic acids in solutions.
The carbon (nitrogen) in humic acids (C(N)HAs) and carbon (nitrogen) in humins (C(N)h) were calculated from the difference:
C(N)HAs = C(N)HAs+ Fas − C(N)FAs
C(N)h = TOC(Nt) − C(Nt)HAs+ Fas − C(N)d
The fractional composition was expressed in mg kg−1 of dry matter of soil sample and as % share of respective fractions in the TOC (Nt) pool.

2.3. Statistical Analyses

To determine the significance of differences of the parameters, depending on the tillage method (factor I) and depth (factor II) and their interactions, the analysis of variance (ANOVA) for p < 0.05 was applied [38]. The significance of the effect of the factors and interactions was verified with test F, and the significance of differences between the values of respective traits with the post–hoc Tukey test at p = 0.05. Prior to the analysis of variance, a distribution of each variable assuming hypothesis H0 that the variables show a normal distribution was investigated. The evaluation was made using the Shapiro–Wilk test. The results of the analysis of variance, namely the means for variance, means for factors, and LSD (low significant difference) are provided in tables and description of the figures. The effect of the tillage method on all the properties of soils at various depths was defined with cluster analysis. The method involves dividing the data set into groups to produce clusters in which the elements are similar to one another and, at the same time, different from the elements from the other groups. The groups of similar treatments are presented in a form of dendrogram. In a given group the smaller the Euclidean distance, the more similar the objects. Data clustering was performed with the Ward method. The analysis was performed after data standardization. The above relationships were defined using statistics software STATISTICA MS 12.

3. Results and Discussion

3.1. Content of Total Organic Carbon and Total Nitrogen

The content of organic matter in soils depends on two factor groups—habitat (e.g., climate, landform, and bedrock) and anthropogenic factors [7,8,9]. Generally, in Poland, soils with a low content of humus predominate (about 60% of soils have an average humus content of 1.1–2.0% (0.64–1.2% TOC)). Such low content of humus in Polish soils is a consequence of a high share of light soils formed from sands with a low water-holding capacity, naturally determining poor humus accumulation conditions. In the experiment presented in this paper, the content of organic carbon (TOC) ranged from 9.87 (strip-till—ST) to 11.05 g kg−1 (ploughless tillage—RT) (Table 1) and it was highest in the soil sampled from the 0–15 cm layer, and the lowest in the 30–50 cm layer. Soil sampled under conventional tillage, (the interactions (I/II)) did not demonstrate significant differences in the content of TOC between the 0–15 cm layer (11.98 g kg−1) and the 15–30 cm layer (11.43 g kg−1). The content of TOC in the soil surface layer under plough tillage was 11.98 g kg−1, under strip-till it was 12.81 g kg−1, and under ploughless tillage, 13.88 g kg−1. The above dependencies show that strip-till can be the method of tillage which, similarly to ploughless tillage, will enhance the content of TOC. As reported by e.g., Friedrich et al. [10], Busari et al. [22], Laufer et.al. [24], and Powlson et al. [27] simplified tillage systems can lead to carbon sequestration, however, one must remember that the degree of change in the content of TOC can differ depending on the soil type, crop rotation, and/or the amount of post-harvest residue.
The content of nitrogen (Nt) in soil under conventional and ploughless tillage was similar and higher than in the soil under strip-till (Table 1). As for the content of TOC, for conventional tillage, no significant differences were found between the samples from the layers of 0–15 cm (1.22 g kg−1) and 15–30 cm (1.20 g kg−1), whereas in the 0–15 cm layer the content of Nt under ploughless tillage (1.45 g kg−1) and strip-till (1.32 g kg−1) were higher than in the soil under conventional tillage (1.22 g kg−1).
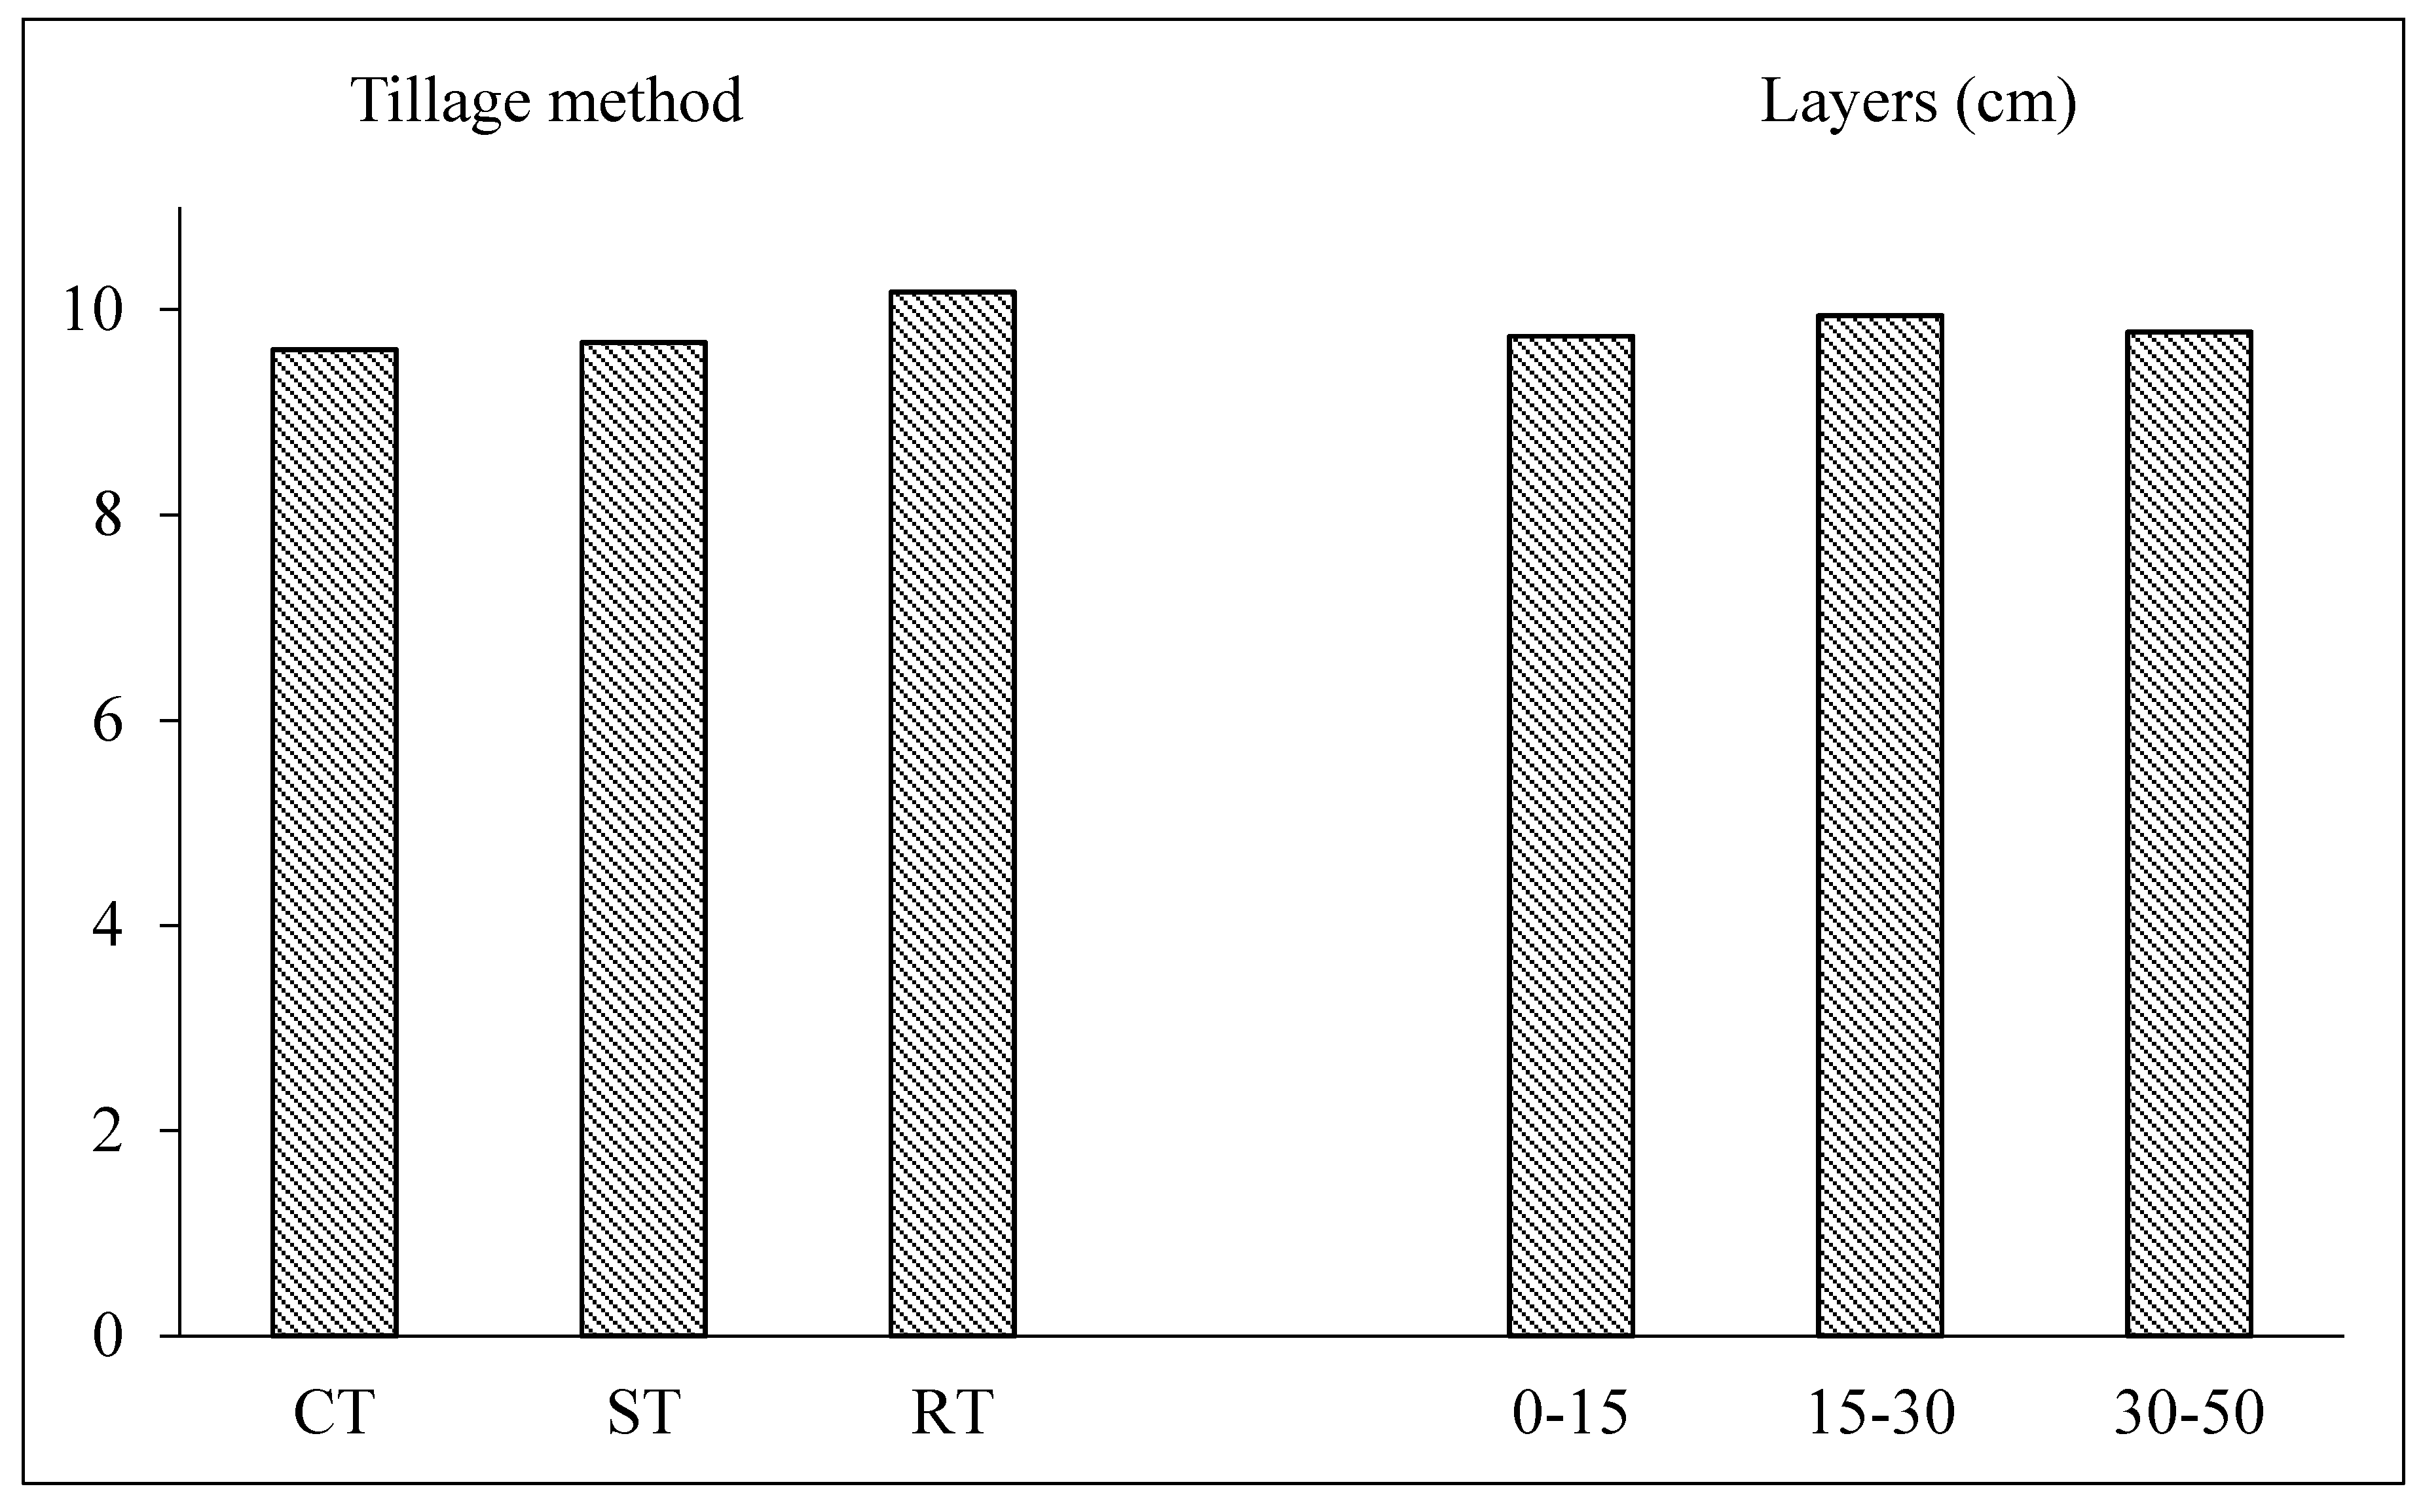
The contents of TOC and Nt affected the values of the ratio TOC/Nt (Figure 2). The value of the ratio TOC/Nt determines the availability of nitrogen and the rate of organic matter decomposition. The values of the ratio TOC/Nt, irrespective of the soil sampling depth, ranged from 9.61 (conventional tillage) to 10.17 (ploughless tillage). Slight changes in the value of the ratio recorded in the present research confirm that the ratio TOC/Nt in soils is a relatively constant value [11,25].

3.2. Content of Dissolved Organic Matter (DOM)

The content of dissolved organic matter was assayed based on the content of organic carbon (dissolved organic carbon, DOC) in the extracts produced after treating the soil samples with 0.004 M CaCl2. The average lowest content and the share of dissolved organic carbon (DOC) were recorded for the soil sampled from the field with ploughless tillage (Table 1). The highest content of DOC was found for the soil under conventional tillage, and the highest share from the soil under strip-till. The content of DOC for the tillage methods investigated, however, depended on the soil sampling depth (a significant interaction) and in the surface layer it was higher for strip-till (230.5 mg kg−1) and ploughless tillage (222.5 mg kg−1), as compared with conventional tillage (209.9 mg kg−1). Andruschkiewitsch et al. [39] have found that in the surface layer of soil (0–5 cm) the content of DOC increases with a decreasing tillage intensity, starting from conventional to ploughless. Wright et.al. [40] have reported, on average, a 28–38% higher content of DOC in the surface layer of soils for ploughless tillage, as compared with conventional tillage. Liu et al. [41] reported a two-fold higher DOC content in the 0–5 cm soil layer with ploughless tillage, as compared with the soil with plough tillage.
As seen from the data presented in Table 1, in general, the greater the depth, the lower the content of DOC. However, the percentage share in deeper soil layers was higher than in the surface layer but only for conventional tillage and strip-till (a significant interaction). As for ploughless tillage, the share of DOC accounted for 0.60%, 0.71% and 0.69%, respectively.
The content of nitrogen in dissolved organic matter, in general, did not depend on the tillage method (Table 1). However, for the 0–15 cm layer a significant difference between conventional tillage (38.4 mg kg−1) and strip-till (46.2 mg kg−1) and ploughless tillage (45.2 mg kg−1) was found. One must also stress that the content of DNt in the layer of 30–50 cm for ploughless tillage accounted for 59.5%, for strip-till, 53.7%, and for conventional tillage, 75.8% of the content of DNt in the 0–15 cm layer. The results demonstrate that an intensive tillage results in intensified leaching of nitrogen, however lower than leaching of carbon. The content of DOC in the 30–50 cm layer accounted for 85.1% of the content of DOC in the surface layer for conventional tillage and 75.0% for strip-till and 71.7% for ploughless tillage. As seen from those dependencies and from literature reports, the tillage practices affect not only the surface layer of soils but also deeper profile layers [7,9,39,40]. Leinweber et al. [42] have shown that ploughing, for example, intensifies the microbiological decomposition of post-harvest residue thus increasing the content of DOM. According to Kalbitz et al. [7], a higher mineralization rate of organic matter due to an intensive tillage can result in an intensified leaching of dissolved organic matter. Wright et al. [40] have noted a decrease in the content of DOC for ploughless tillage from 223 mg kg−1 in the 0–5 cm layer to 43 mg kg−1 in the 85–100 cm layer and for conventional tillage, from 176 mg kg−1 in the 0–5 cm layer to 42 mg kg−1 in the 85–100 cm layer.

3.3. Fraction Composition

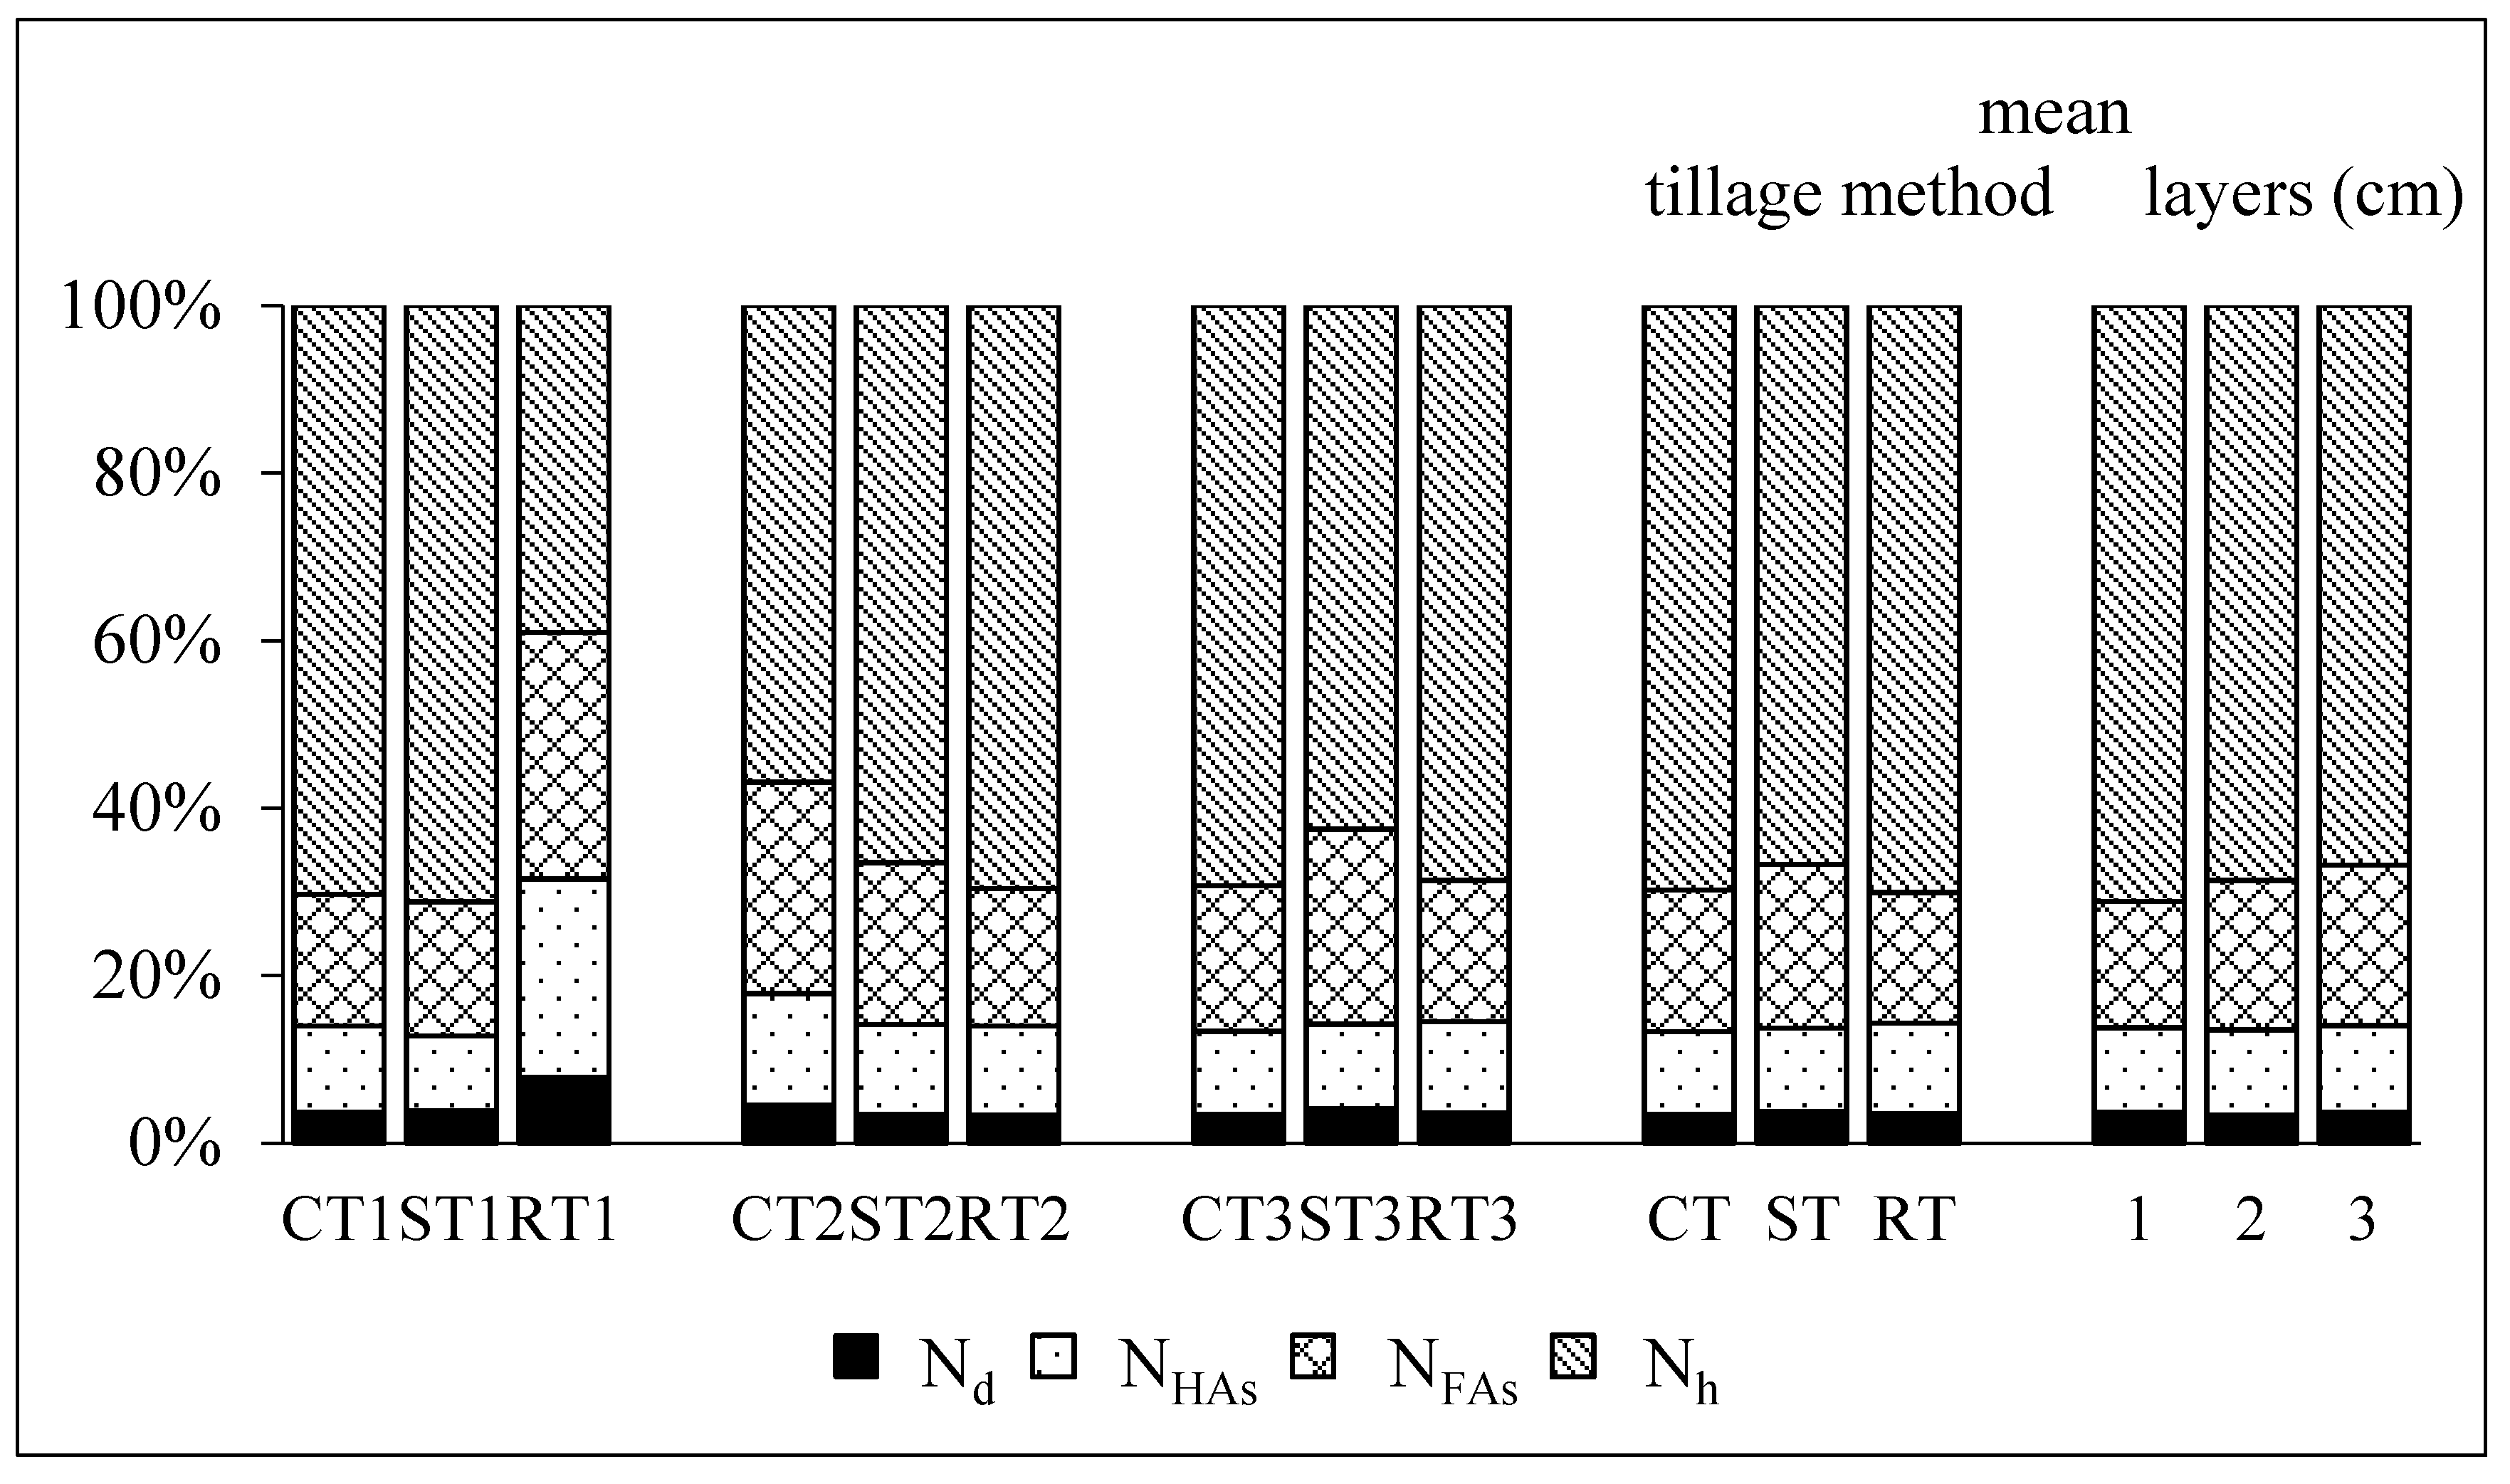
It is common knowledge that the quality of the soil and, indirectly, the soil fertility are considerably determined by the content of humic acids (HAs), fulvic acids (FAs), and humins (h). The content (the share) of those fractions of organic matter is modified by the type of the fertilization applied and by the crop selection for crop rotation [35,36]. The evaluation of the effect of the tillage method has also demonstrated its significant effect on the fraction composition of organic matter (Table 2, Figure 3 and Figure 4).
The content of carbon in the solutions after decalcification (Cd) was highest in the soil sampled from the plots with ploughless tillage and it decreased with depth (Table 2). One must also note (a significant interaction I/II) that for conventional tillage, no significant differences between the layers of 0–15 cm (240.9 mg kg−1) and 15–30 cm (230.5 mg kg−1) were found. The content of carbon of the fraction of humic acids (CHAs) was highest in the soil sampled from the field with conventional tillage. However, no significant differences in the content of CHAs between ploughless tillage and strip-till were identified. Except for strip-till (0–15 cm—1199 mg kg−1; 15–30 cm—1219 mg kg−1; and 30–50 cm—1256 mg k−1), in the surface layer the content of CHAs was higher, as compared with the content of humic acids in the other layers. The content of carbon of the fractions of fulvic acids (CFAs) was lowest for ploughless tillage. Besides, one must note that for strip-till no significant differences in the content of CFAs were found between the layers of 15–30 cm (1807 mg kg−1) and 30–50 cm (1690 mg kg−1).
The contents of the fractions of humic and fulvic acids result in the values of the ratio CHAs/CFAs. It is commonly accepted that humus with higher values of that ratio is characteristic for more fertile soils with a higher degree of organic matter humification [34]. In general, irrespective of the tillage method, the values of the ratio CHAs/CFAs were similar, which means that none of the tillage methods disturbed the state of equilibrium of the soil system, characteristic in specific habitat conditions, drastically [33,34]. The quality of humus, next to parameter CHAs/CFAs, is determined by the percentage share of respective humus fractions (Figure 3). It has been definitely demonstrated that the highest share of Cd, CHAs, and CFAs was found for the soil under strip-till, whereas for ploughless tillage the highest share of carbon of humins fraction was noted. Humins are the fraction of organic matter most resistant to decomposition, which is essential for the process of carbon sequestration. As reported by Guimaras et al. [43] in soils in Brazil, the distributions of the soil organic matter fractions varied from 12 to 32.5% (fulvic acids), from 12 to 34.5% (humic acids), and from 40 to 69.5% (humins). As seen in Figure 3, the share of the fraction of organic matter assayed falls within the ranges above.
Tendencies to changes in the content of nitrogen (Table 2) in the solutions of fluvic acids and humins were very similar to the changes in the content of carbon. The share of fraction NFAs was highest for strip-till (Figure 4). The lowest share of NFAs was found for the soil under conventional tillage. The share of fractions Nd and NHAs was not determined by the tillage method.
To determine the effect of the tillage method on the properties of organic matter, cluster analysis was applied (Figure 5). Data clustering was performed with the Ward method. Cluster analysis facilitates the determination of the similarities of treatments (Euclidean distance evaluation) using their characteristics. The cluster analysis was performed based on the content of TOC, Nt, the content and share of DOC, DNt, and the values of the ratios of TOC/Nt and CHAs/CFAs as well as the share of carbon and nitrogen in all the fractions of humic and fluvic acids and humins and in the solutions after decalcification. The dendrogram identifies two groups (Figure 5). The first group includes the soil under plough tillage from the layers 0–15 (CT1) and 15–30 cm (CT2)—one sub-group, the other sub-group is made up of the soil under strip-till (ST1) and ploughless tillage (RT1) of the surface layer. The similarity of the soil layers 0–15 cm and 15–30 cm under plough tillage is a consequence of the plough depth. The properties of the surface layer of the soil under strip-till were more similar to the soil under ploughless tillage than under plough tillage, similarly to the 30–50 cm layer (one subgroup (RT3, ST3) of the second group). The properties of soil under strip-till in the 15–30 cm layer (ST2) showed the greatest similarity to the soil layer of 30–50 cm under plough tillage (CT3).
The results show unambiguously that strip-till is the method which changes the soil properties by changing the contents and the quality composition of OM, both for plough and ploughless tillage. As reported in literature [15,44,45], strip-till creates favorable conditions for plant growth and yielding. One of the factors enhancing the plant growth and development conditions is an increase in the content of organic matter [1,2]. As demonstrated in this paper the tillage method is a factor affecting not only the content but also the properties of organic matter, the factors determining the soil fertility.

4. Conclusions

The results demonstrated that the tillage system determines the properties of organic matter of soil. As presented on the dendrogram, in the surface layer (0–15 cm) and in the 30–50 cm layer the properties of the organic matter of soil under strip-till have a greater similarity to the soil under ploughless tillage than under conventional tillage.
In the surface layer the contents of carbon and nitrogen, dissolved organic matter expressed as DOC, and DNt, were higher in the soil under strip-till and under ploughless tillage than under conventional tillage. Ploughless tillage and strip-till limited the leaching of carbon and nitrogen from the surface layer to the layer of 30–50 cm considerably. The highest share of CHAs and CFAs was found for the soil under strip-till, whereas for the ploughless tillage, the highest share of carbon of humins fraction was noted.
The above parameters show that strip-till, similarly to ploughless tillage, is the tillage method which can play an important role in the process of carbon sequestration.

Author Contributions

Conceptualization, I.J., B.D. and D.J.; methodology, B.D., I.J. and D.J.; investigation, B.D. and I.J.; data curation—compiled and analyzed the results, B.D., I.J. and D.J.; writing—original draft preparation, B.D., I.J. and D.J.; review and editing, B.D., I.J. and D.J. All authors have read and agreed to the published version of the manuscript.

Funding

This work was supported by the University of Science and Technology under Grant BS 42/2014 and 3/2017.

Conflicts of Interest

The authors declare no conflict of interest.

References

  1. Blair, N.; Faulkner, R.D.; Till, A.R.; Poulton, P.R. Long-term management impacts on soil C, N and physical fertility. Part 1. Broadbalk experiment. Soil Tillage Res. 2006, 91, 30–38. [Google Scholar] [CrossRef]
  2. Lal, R. Sequestering carbon in soils of agro-ecosystems. Food Policy 2011, 36, 533–539. [Google Scholar] [CrossRef]
  3. Smith, P.; Falloon, P. Carbon sequestration in European croplands. SEB Exp. Biol. Ser. 2005, 47–55. [Google Scholar] [CrossRef]
  4. Blanco-Canqui, M.; Ruis, S.J. No-tillage and soil physical environment. Geoderma 2018, 326, 164–200. [Google Scholar] [CrossRef]
  5. Wiesmeier, M.; Urbanski, L.; Hobley, E.; Lang, B.; von Lutzow, B.; Marin-Spiotta, E.; van Wesemael, B.; Rabot, E.; Ließ, M.; Garcia-Franco, N.; et al. Soil organic carbon storage as a key function of soils—A review of drivers and indicators at various scales. Geoderma 2019, 333, 149–162. [Google Scholar] [CrossRef]
  6. COM (2006) 231 Final, Brussels, 22.9.2006. Communication from the Commission to the Council, the European Parliament, the European Economic and Social Committee and the Committee of the Regions Thematic Strategy for Soil Protection. Commission of the European Communities. 2006. Available online: http://eur-lex.europa.eu/legal-content/EN/TXT/PDF/?uri=CELEX:52006DC0231&from=EN (accessed on 25 August 2020).
  7. Kalbitz, K.; Solinger, S.; Park, J.H.; Michalzik, B.; Matzner, E. Controls on the dynamics of organic matter in soils: A review. Soil Sci. 2000, 165, 277–304. [Google Scholar] [CrossRef]
  8. Chantigny, M.H. Dissolved and water-extractable organic matter in soils: A review on the influence of land use and management practice. Geoderma 2003, 113, 357–380. [Google Scholar] [CrossRef]
  9. Rosa, E.; Debska, B. Seasonal changes in the content of dissolved organic matter in arable soils. J. Soils Sediments 2018, 18, 2703–2714. [Google Scholar] [CrossRef] [Green Version]
  10. Friedrich, T.; Derpsch, R.; Kassam, A.H. Global overview of the spread of conservation agriculture. J. Agric. Sci. Technol. 2012, 6, 1–7. [Google Scholar]
  11. Lozano-Garcia, B.; Parras-Alcantara, L. Land use and management effects on carbon and nitrogen in Mediterranean Cambisols. Agric. Ecosyst. Environ. 2013, 179, 208–214. [Google Scholar] [CrossRef]
  12. Busari, A.M.; Kukal, S.S.; Kaur, A.; Bhatt, R.; Dulazi, A.A. Conservation tillage impacts on soil, crop and the environment. Int. Soil Water Conserv. Res. 2015, 3, 119–129. [Google Scholar] [CrossRef] [Green Version]
  13. Pittelkow, C.M.; Linquist, B.A.; Lundy, M.E.; Liang, X.; van Groenigen, K.J.; Lee, J.; van Gestel, N.; Six, J.; Venterea, R.T.; van Kessel, C. When does no-till yield more? A global meta-analysis. Field Crop. Res. 2014, 183, 156–168. [Google Scholar] [CrossRef] [Green Version]
  14. Wezel, A.; Casagrande, M.; Celette, F.; Vian, J.F.; Ferrer, A.; Peigne, J. Agroecological practices for sustainable agriculture. A review. Agron. Sustain. Dev. 2014, 34, 1–20. [Google Scholar] [CrossRef] [Green Version]
  15. Williams, A.; Davis, A.S.; Ewing, P.M.; Grandy, A.S.; Kane, D.A.; Koide, R.T.; Mortensen, D.A.; Smith, R.G.; Snapp, S.S.; Spokas, K.A.; et al. A comparison of soil hydrothermal properties in zonal and uniform tillage systems across the US Corn Belt. Geoderma 2016, 273, 12–19. [Google Scholar] [CrossRef] [Green Version]
  16. Reicosky, D.C. Conservation tillage is not conservation agriculture. J. Soil Water Conserv. 2015, 70, 103A–108A. [Google Scholar] [CrossRef] [Green Version]
  17. Jaskulska, I.; Jaskulski, D. Strip-till one-pass technology in Central and Eastern Europe: A MZURI Pro-Til Hybrid Machine Case Study. Agronomy 2020, 10, 925. [Google Scholar] [CrossRef]
  18. Celik, A.; Altikat, S.; Way, T.R. Strip tillage width effects on sunflower seed emergence and yield. Soil Tillage Res. 2013, 131, 20–27. [Google Scholar] [CrossRef]
  19. Leskovar, D.; Othman, Y.; Dong, X. Strip tillage improves soil biological activity, fruit yield and sugar content of triploid watermelon. Soil Tillage Res. 2016, 163, 266–273. [Google Scholar] [CrossRef]
  20. Jaskulska, I.; Galezewski, L.; Piekarczyk, M.; Jaskulski, D. Strip-till technology—A method for uniformity in the emergence and plant growth of winter rapeseed (Brassica napus L.) in different environmental conditions of Northern Poland. Ital. J. Agron. 2018, 13, 194–199. [Google Scholar] [CrossRef]
  21. Jaskulska, I.; Galazka, A.; Jaskulski, D. Strip-till as a means of decreasing spatial variability of winter barley within a field scale. Acta Agric. Scand. Sect. B Plant Soil Sci. 2019, 69, 516–527. [Google Scholar] [CrossRef]
  22. Idowu, O.J.; Sultana, S.; Darapuneni, M.; Beck, L.; Steiner, R. Short-term conservation tillage effects on corn silage yield and soil quality in an irrigated, arid agroecosystem. Agronomy 2019, 9, 455. [Google Scholar] [CrossRef] [Green Version]
  23. Jaskulska, I.; Jaskulski, D.; Rozniak, M.; Radziemska, M.; Galezewski, L. Zonal tillage as innovative element of the technology of growing winter wheat: A field experiment under low rainfall conditions. Agriculture 2020, 10, 105. [Google Scholar] [CrossRef] [Green Version]
  24. Laufer, D.; Loibl, B.; Marlander, B.; Koch, H.J. Soil erosion and surface run-off under strip tillage for sugar beet (Beta vulgaris L.) in Central Europe. Soil Tillage Res. 2016, 162, 1–7. [Google Scholar] [CrossRef]
  25. Islam, A.K.M.S.; Saleque, M.A.; Hossain, M.M.; Islam, A.K.M.A. Effect of conservation tillage on soil chemical properties in rice-maize cropping system. Agriculturists 2015, 13, 62–73. [Google Scholar] [CrossRef]
  26. Fernandez, F.G.; Sorensen, B.A.; Villamil, M.B. A comparison of soil properties after five years of no-till and strip-till. Agron. J. 2015, 107, 1339–1346. [Google Scholar] [CrossRef]
  27. Powlson, D.S.; Bhogal, A.; Chambers, B.J.; Coleman, K.; Macdonald, A.J.; Goulding, K.W.T.; Whitmore, A.P. The potential to increase soil carbon stocks through reduced tillage or organic material additions in England and Wales: A case study. Agric. Ecosyst. Environ. 2012, 146, 23–33. [Google Scholar] [CrossRef]
  28. Al-Kaisi, M.; Yin, X. Tillage and crop residue effects on soil carbon and carbon dioxide emission in corn–soybean rotations. J. Environ. Qual. 2005, 34, 437–445. [Google Scholar] [CrossRef]
  29. Strickland, T.C.; Scully, B.T.; Hubbard, R.K.; Sullivan, D.G.; Abdo, Z.; Savabi, M.R.; Lee, R.D.; Olson, D.M.; Hawkins, G.L. Effect of conservation practices on soil carbon and nitrogen accretion and crop yield in a corn production system in the southeastern coastal plain, United States. J. Soil Water Conserv. 2015, 70, 170–181. [Google Scholar] [CrossRef] [Green Version]
  30. Si, P.; Liu, E.; He, W.; Sun, Z.; Dong, W.; Yan, C.; Zhang, Y. Effect of no-tillage with straw mulch and conventional tillage on soil organic carbon pools in Northern China. Arch. Agron. Soil Sci. 2017, 64, 398–408. [Google Scholar] [CrossRef]
  31. Bolan, N.S.; Adriano, D.C.; Kunhikrishnan, A.; James, T.; McDowell, R.; Senesi, N. Dissolved organic matter: Biogeochemistry, dynamics, and environmental significance in soils. Adv. Agron. 2011, 110, 1–75. [Google Scholar] [CrossRef]
  32. Gonet, S.S.; Debska, B. Dissolved organic carbon and dissolved nitrogen in soil under different fertilization treatments. Plant Soil Environ. 2006, 52, 55–63. [Google Scholar] [CrossRef] [Green Version]
  33. Orlov, D.S. Humus Acids of Soils; AA Balkema: Rotterdam, The Netherlands, 1986. [Google Scholar]
  34. Yang, Z.H.; Singh, B.R.; Sitaula, B.K. Soil organic carbon fractions under different land uses in Mardi Watershed of Nepal. Commun. Soil Sci. Plant Anal. 2004, 35, 615–629. [Google Scholar] [CrossRef]
  35. Ventorino, V.; De Marco, A.; Pepe, O.; De Santo, A.V.; Moschetti, G. Impact of innovative agricultural practices of carbon sequestration on soil microbial community. In Carbon Sequestration in Agricultural Soils; Piccolo, A., Ed.; Springer: Berlin/Heidelberg, Germany, 2011; pp. 145–179. [Google Scholar] [CrossRef] [Green Version]
  36. Debska, B.; Drag, M.; Tobiasova, E. Effecf of post-harvest residue of maize, rapeseed, and sunflower on humic acids properties in various soils. Pol. J. Environ. Stud. 2012, 21, 603–613. [Google Scholar]
  37. Debska, B.; Dlugosz, J.; Piotrowska-Dlugosz, A.; Banach-Szott, M. The impact of a bio- fertilizer on the soil organic matter status and carbon sequestration—Results from a field-scale study. J. Soils Sediments 2016, 16, 2335–2343. [Google Scholar] [CrossRef] [Green Version]
  38. Gomez, K.A.; Gomez, A.A. Statistical Procedures for Agricultural Research; John Wiley and Sons: New York, NY, USA, 1983. [Google Scholar]
  39. Andruschkiewitsch, R.; Geisseler, D.; Koch, H.J.; Ludwig, B. Effects of tillage on contents of organic carbon, nitrogen, water-stable aggregates and light fraction four different long-term trials. Geoderma 2013, 192, 368–377. [Google Scholar] [CrossRef]
  40. Wright, A.; Dou, F.; Hons, M.F. Soil organic C and N distribution for wheat cropping systems after 20 years of conservation tillage in central Texas. Agric. Ecosyst. Environ. 2007, 121, 376–382. [Google Scholar] [CrossRef]
  41. Liu, E.; Teclemariam, S.G.; Yan, C.; Yu, J.; Gu, R.; Liu, S.; He, W.; Liu, Q. Long-term effects no-tillage management practice on soil organic carbon and its fractions in the northern China. Geodema 2014, 213, 379–384. [Google Scholar] [CrossRef]
  42. Leinweber, P.; Schulten, H.R.; Kalbitz, K.; Meissner, R.; Jancke, H. Fulvic acid composition in degraded fenlands. J. Plant Nutr. Soil Sci. 2001, 164, 371–379. [Google Scholar] [CrossRef]
  43. Guimaraes, D.V.; Gonzaga, M.I.S.; da Silva, T.O.; da Silva, T.L.; da Silva Dias, N.; Matias, M.I.S. Soil organic matter pools and carbon fractions in soil under different land uses. Soil Tillage Res. 2013, 126, 177–183. [Google Scholar] [CrossRef] [Green Version]
  44. Zibilske, L.M.; Bradford, J.M. Soil aggregation, aggregate carbon and nitrogen, and moisture retention induced by conservation tillage. Soil Sci. Soc. Am. J. 2007, 71, 793–802. [Google Scholar] [CrossRef] [Green Version]
  45. Zhu, L.; Hu, N.; Yang, M.; Zhan, X.; Zhang, Z. Effects of different tillage. and straw return on soil organic carbon in a rice-wheat rotation system. PLoS ONE 2014, 9, e88900. [Google Scholar] [CrossRef] [PubMed] [Green Version]
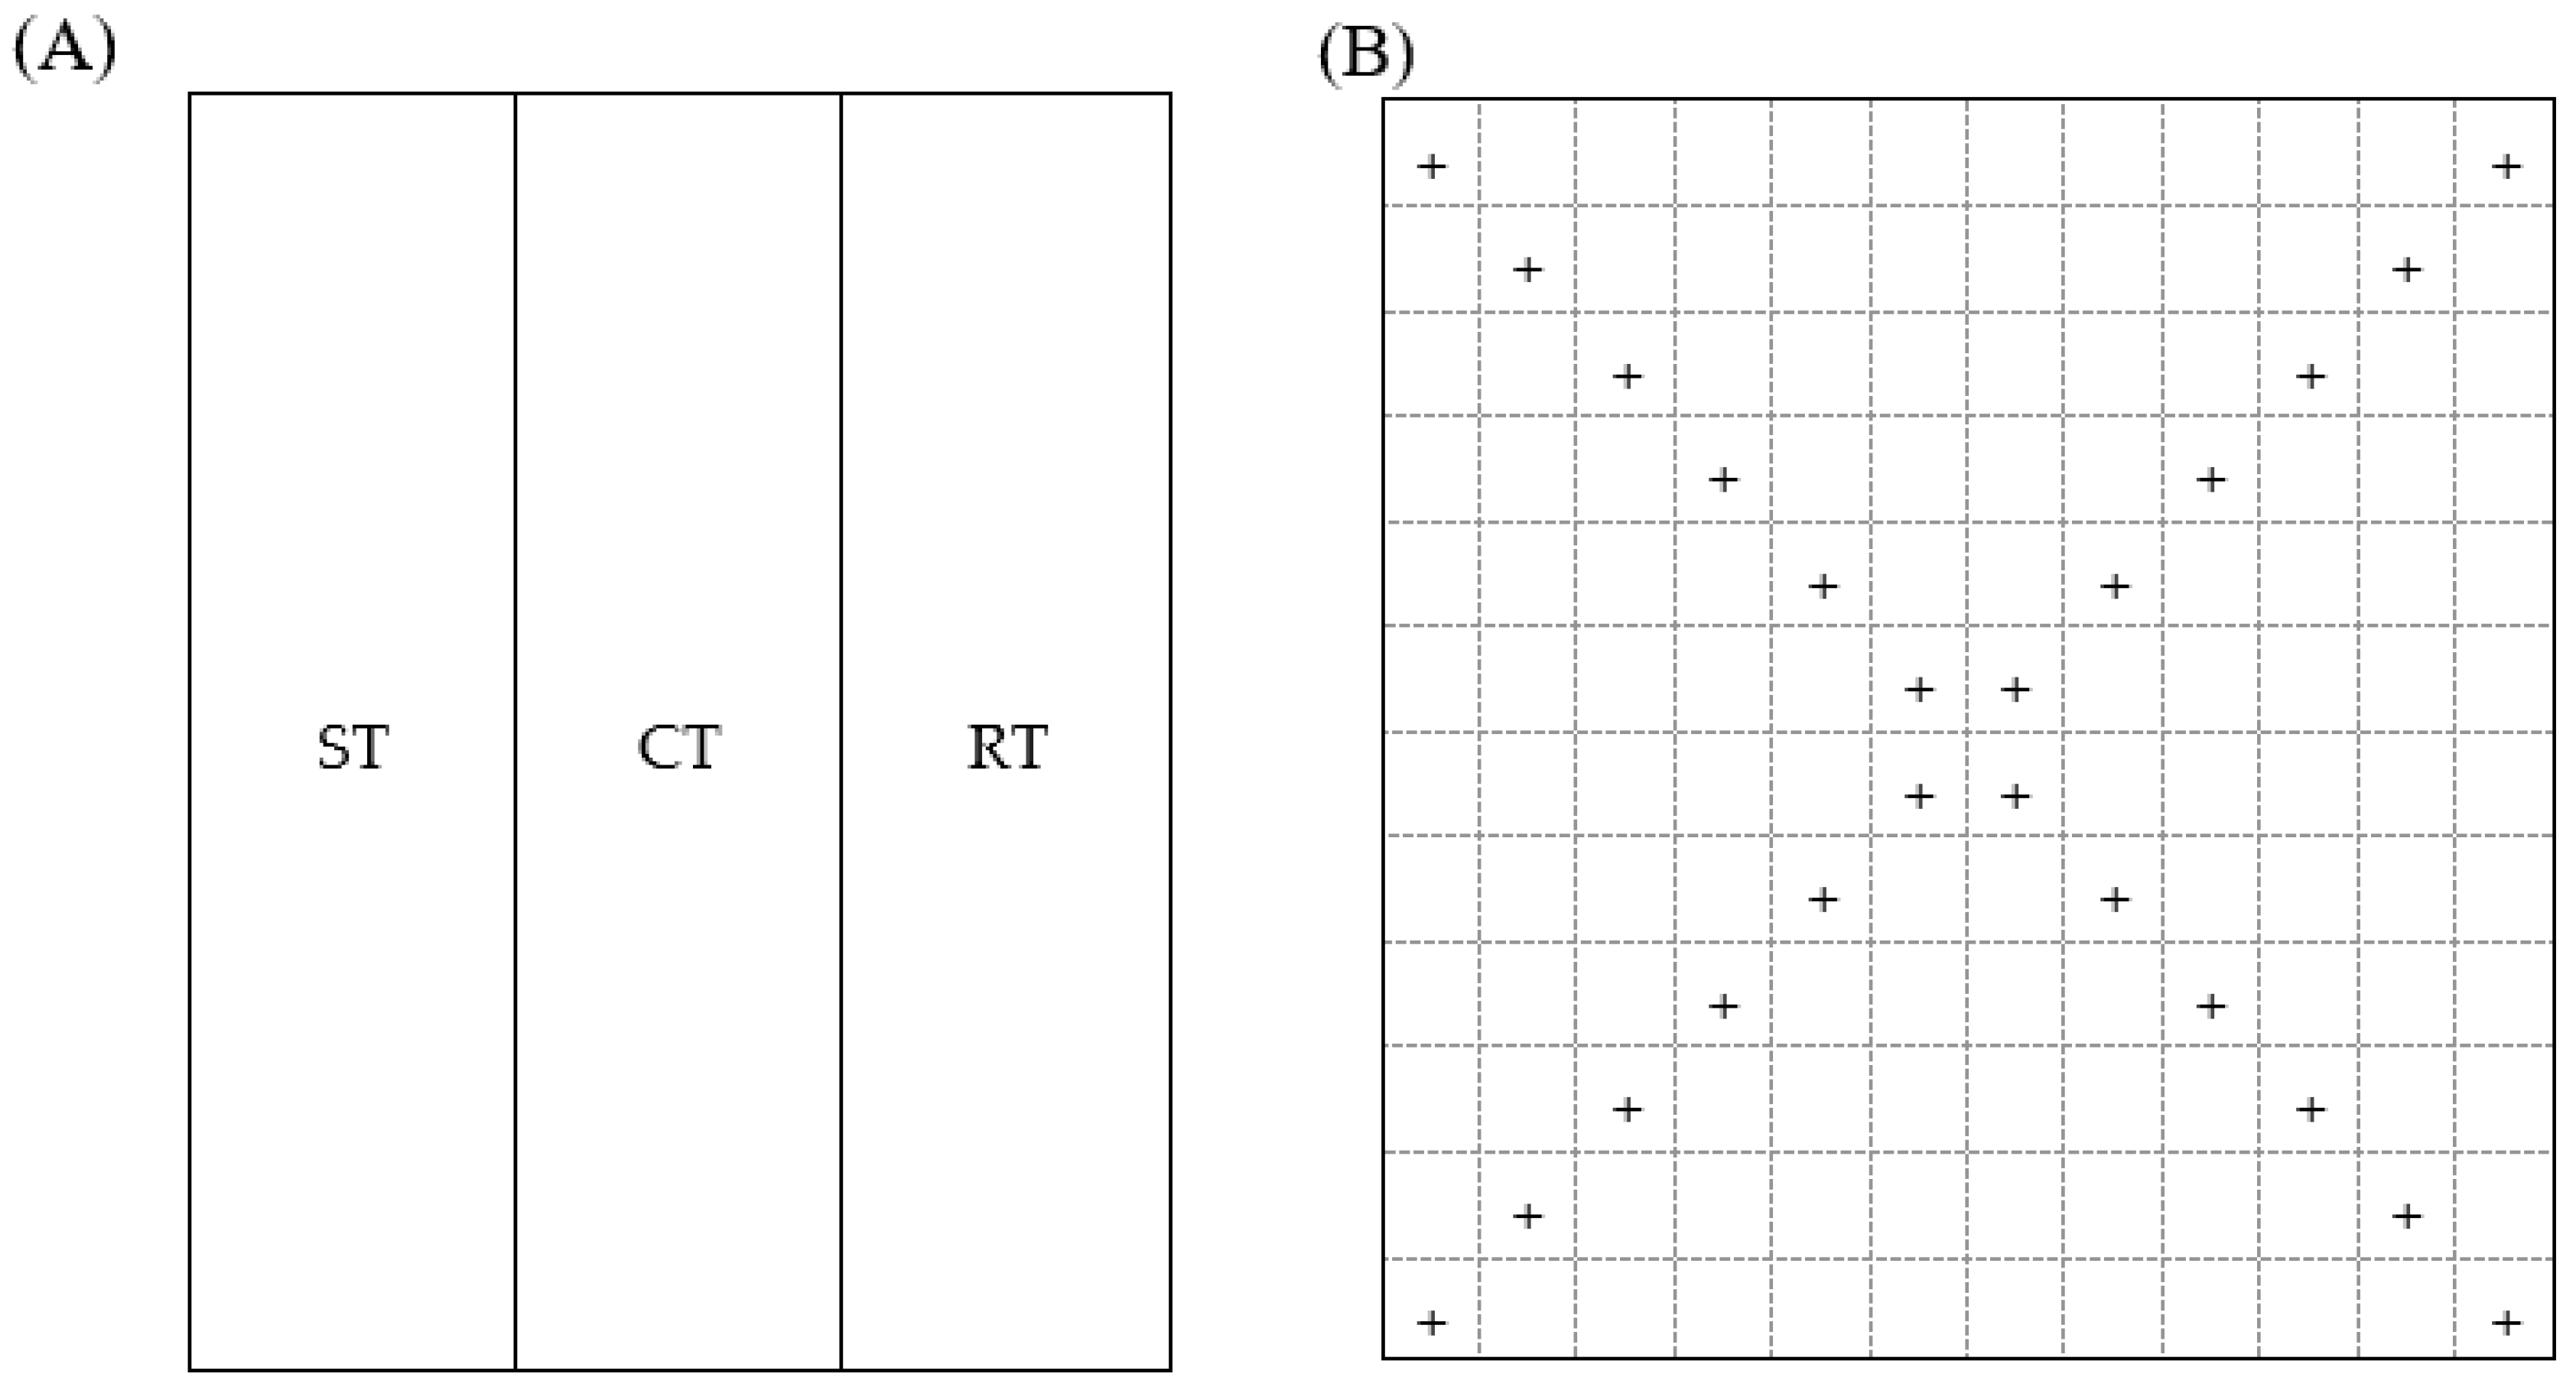
Figure 1. Treatment arrangement for the field experiment block. (A) One of four replications and the pattern of soil sampling from the plot and (B) (+) site for soil collection using Egner’s sampler. CT, conventional tillage; ST, strip-till; and RT, reduced tillage.
Agronomy 10 01250 g001
Figure 2. TOC/Nt ratio values.
Agronomy 10 01250 g002
Figure 3. Share of carbon in organic matter fractions and average values for factors (LSD for: Cd—factor I, 0.14 and factor II, 0.08; interaction—I/II, 0.18 and II/I, 0.14; CHAs—factor I, 0.59 and factor II, 1.14; interaction—I/II, 1.72 and II/I, 1.98; CFAs—factor I, 0.33 and factor II, 0.94; interaction—I/II, 1.37 and II/I, 1.63; Ch—factor I, 1.28 and factor II, 1.36; interaction—I/II, 2.17 and II/I, 2.10.
Agronomy 10 01250 g003
Figure 4. Share of nitrogen in organic matter fraction and average values for factors (LSD for: Nd—factor I, n.s. and factor II, 0.24; interaction—I/II, n.s. and II/I, n.s.; NHAs—factor I, n.s. and factor II, n.s; interaction—I/II, 1.86 and II/I, 0.87; NFAs—factor I, 0.47 and factor II, 1.08; interaction—I/II, 1.87 and II/I, 1,59; Nh—factor I, 1.48 and factor II, 1.56; interaction—I/II, 2.57 and II/I, 2.21.
Agronomy 10 01250 g004
Figure 5. Cluster analysis determined from the following parameters: content of TOC, Nt, DOC, and DNt and the share of DOC, DNt, C(N)d, C(N)HAs, C(N)FAs, C(N)h, and the TOC/Nt and CHAs/CFAs ratios.
Agronomy 10 01250 g005
Table 1. Content of total organic carbon (TOC) and total nitrogen (Nt), content and share of dissolved organic carbon (DOC) and nitrogen DNt, and the results of the analysis of variance.
Tillage MethodLayers
(cm)
TOC
(g kg−1)
Nt
(g kg−1)
DOC
(mg kg−1)
DOC
(%)
DNt
(mg kg−1)
DNt
(%)
CT0–1511.981.22209.91.7638.43.16
15–3011.431.20224.91.9632.72.75
30–509.000.92178.71.9929.13.06
ST0–1512.811.33230.51.8046.23.52
15–309.641.09189.41.9731.33.16
30–507.150.88173.02.4224.83.44
RT0–1513.881.32222.51.6045.23.15
15–3011.221.03192.11.7130.12.94
30–509.420.72159.61.6926.92.83
Results of the analysis of variance
Factor ICT10.801.13204.51.9033.42.99
TillageST9.871.02197.61.6734.13.37
methodRT11.501.15191.42.0634.12.97
LSD 0.7330.0843.880.040n.s.*0.294
Factor II0–1512.891.33221.01.7243.33.28
Layers15–3010.761.09202.11.8831.42.95
(cm)30–508.520.88170.42.0326.93.11
LSD 0.6090.1126.370.0802.330.262
Interactions
I/II 1.130.1789.790.1203.54n.s.
II/I 1.0540.19311.040.1394.04n.s.
* Non-significant difference.
Table 2. Content of carbon and nitrogen (mg kg−1) in the humus fraction and the results of the analysis of variance.
Tillage MethodLayers
(cm)
CdCHAsCFAsCHAs/
CFAs
NdNHAsNFAsNHAs/
NFAs
CT0–15240.9138220930.6644.9124.1190.40.66
15–30230.5122022570.5436.3106.9201.60.53
30–50198.0124517820.7032.994.2165.20.57
ST0–15255.5119924130.5050.7117.9211.10.56
15–30217.4121921280.5735.4111.0199.50.55
30–50192.4125617100.7429.472.5166.00.44
RT0–15290.0136021520.6352.0157.9195.60.81
15–30211.0113218070.6334.8109.1168.90.64
30–50189.6111216900.6634.399.8159.20.63
Results of the analysis of variance
Factor ICT223.1128220440.6338.0108.4185.70.59
TillageST221.8122520840.6038.5100.5192.20.52
methodRT230.2120118830.6440.4122.3174.60.69
LSD 8.6827.3110.92.155.1415.31
Factor II0–15262.1131422200.6049.2133.3199.00.68
Layers15–30219.6119020640.5835.5109.0190.00.57
(cm)30–50193.3120417270.7032.288.8163.50.55
LSD 13.1772.7103.91.928.447.29
Interactions
I/II 20.51106.3183.53.4512.9718.38
II/I 22.81126.0180.03.3214.6112.62