Article

Phenology-Adjusted Stress Severity Index to Assess Genotypic Responses to Terminal Drought in Field Grown Potato

1
University of Hohenheim, Institute for Agricultural Sciences in the Tropics (Hans-Ruthenberg-Institute), Crop Water Management in the Tropics and Subtropics, Garbenstr. 13, 70599 Stuttgart, Germany
2
Plant Pathology and Plant-Microbe Biology Section, Cornell University, Geneva, NY 14456, USA
3
Genetic Resources Program, International Potato Center (CIP), Avenida La Molina 1895, Lima 12, Peru
*
Author to whom correspondence should be addressed.
Agronomy 2020, 10(9), 1298; https://doi.org/10.3390/agronomy10091298
Submission received: 25 July 2020 / Revised: 27 August 2020 / Accepted: 27 August 2020 / Published: 1 September 2020

Abstract

:
Potato is a drought susceptible, often rain-fed crop suffering strongly from even short periods of soil water deficit. With global environmental conditions changing, potato clones resistant to variable water supply are needed and identifying them is a major task. Many indices assessing potato tolerance to water deficit have been proposed, albeit none of them takes into account the severity of the stress or the sensitivity of the developmental stage during which the stress occurs. As a result, data obtained on genotypes in one location or season are normally not useful in another location or in a different season. We have developed an index evaluating yield response of potato to water deficit based on the soil tension the genotype was subjected to for the duration of the stress modified by the development stage of the genotype. The sum of the daily values was combined in a stress severity index (SSI). In total thirteen genotypes differing in duration and sensitivity to drought were subjected to four levels of deficit irrigation on two soil types at different development stages over two years. Early drought (early tuber filling) reduced yields up to 95% whereas late drought (late tuber bulking) reduced yields significantly less. SSI depended on the genotypic phenological development and on the soil tension values and ranges between 25 and 3500. The index differentiated genotypic responses well across treatments and soil types, even with these relatively advanced development stages, up to a value of 1000. Beyond 1000, yields were generally reduced by more than 60% and a differentiation between genotypes was not possible anymore. SSI constitutes a method that renders site, location, year, season, and soil type effects comparable for responses of potato clones to soil water deficit. Combining this measure of stress severity with other proposed indices may improve upon their current weaknesses in finding or identifying the underlying traits of drought tolerance in potato.

1. Introduction

Potato (Solanum tuberosum L.) is the most important vegetable staple crop worldwide and is grown in more than 100 countries [1]. Potato varieties maturing between 120 and 150 days require between 500–700 mm water on average [2]. Potato is a drought sensitive crop, commonly grown on light sandy soils, with 65–80% of its root mass concentrated in the upper 0.4 m of the soil [3]. Even short drought spells or infrequent irrigation during stolon formation, tuber initiation, or tuber bulking can reduce tuber yields significantly [4,5,6,7,8,9]. Efforts are being made to (1) decrease potatoes water requirements to reduce irrigation water requirements in systems with seasonal water shortages [10,11], and (2) to increase genotypic resistance to soil moisture deficit in predominantly rainfed systems with little or no irrigation facilities [12]. A number of morphological traits have been described that potentially improve genotypic performance of potato under moisture deficit conditions. Genotypes with deeper and larger roots systems maintain better access to soil stored moisture [13,14]. Varieties forming a smaller number of tubers perform better than those forming many [15]. Reduction of leaf growth and area reduces transpirational water loss [16,17], changes in canopy architecture influence the canopy microclimate [18], or stay green traits improve the water use efficiency [19]. These morphological traits develop during different phenological stages and whereas some are generally phenotypically expressed, others are triggered only under water deficit conditions, which may not concur with the appropriate phenological stages of the genotype. In addition, genotypes may perceive the same level of soil moisture deficit differently, depending on their level of resistance to soil moisture deficit and on the phenological stage they are in when the water deficit occurs. The phenological cycles vary from 80 to 150 days for early, intermediate, and late maturing potato genotypes [20,21]. In a large set of genotypes sown at the same date, various phenological stages occur simultaneously. During a drought spell, therefore, different varieties will be subjected to soil moisture deficit in different phenological stages, resulting in genotypic responses that depend on the sensitivity of the respective phenological stage and the overall resistance strategy expressed in the respective genotype. Thus, in order to evaluate the performance of individual genotypes the severity of the stress needs to be expressed as a function of plant available soil moisture and the sensitivity of the respective phenological stage.
The irrigation amount or soil moisture measurements alone are not sufficient to describe the severity of the stress at plant level, as plant available water content varies among soil types. Several authors have shown that soil matrix potential rather than soil moisture content affects plant physiological responses to soil moisture deficit, for example in oil seed rape [22], wheat [23], maize [24], and potato [14,15]. Mould and Rutherfoord (1980, [25]) observed negative effects on potato quality and yield beyond a threshold in the soil matrix potential of 700 hPa. Since roots take up water and the aboveground biomass loses water through transpiration, evolution of soil matrix potential during a drought spell is not only determined by the soil type but also by the water use of the crop, which in turn depends on the prevailing climatic conditions and on the adaptation mechanisms of the genotype [26]. Adaptation mechanisms, such as leaf area reduction or increased rooting depth are triggered by the stress itself, thus, the potential of maintaining a marketable yield under suboptimal conditions depends on the effectiveness of resistance mechanisms of a genotype in a specific stress situation during a specific development stage. Therefore, the comparative evaluation of genotypic performance needs to be based on a comparable stress severity indicator considering not only the abiotic stressor but also the biotic response to it.
Many studies on drought tolerance of potato report on performance of individual cultivars under a given set of environmental parameters (e.g., [8,27,28]) without quantifying soil borne stress severity or the phenological stage during which the stress occurs. This renders comparisons of genotypic responses to water deficit across sites or years almost impossible.
We propose a stress severity index (SSI) that takes into account the changes in the soil matrix potential during water deficit, the sensitivity of the respective phenological stage, and the duration of the stress, allowing assessing genotypic performance over a range of climatic conditions, soil types, and water deficit intensities.

2. Materials and Methods

2.1. Site Description

Field trials were conducted over two years at an experimental station of the “Instituto Nacional de Innovacion Agraria” in St. Rita de Siguas (16°28′35″ S; 72°6′18″ W), Peru, from July to November 2013 and from August to December 2014.
The environmental conditions at the experimental site are characterized as arid climate with little inter-annual variation. Air temperature, air humidity, wind speed, and photosynthetically active radiation at 2 m height were recorded in 15 min intervals with a HOBO® Weather station close to the experimental plots (Table 1). No rainfall occurred during the field trials. Two neighboring fields differing in soil texture were selected. Soil samples were taken with a cylindrical auger (Delta T-Device) as bulk samples from 0–15 and 15–30 cm along a diagonal transect with five replications for each field and depth before planting. Soil samples were analyzed at the soil laboratory at the Universidad Agraria La Molina, Lima, Peru. Soil texture, pH, and organic matter content are given in Table 2. For the full soil analyses, including electrical conductivity, nutrients, and exchangeable cations, refer to Appendix A. The soil type was defined according to the IUSS Working Group (WRB 2006) as Arenosol.

2.2. Genotypes, Experimental Setup, and Crop Management

Thirteen genotypes from the International Potato Center (CIP) breeding program were planted on 17 July 2013 and 13 August 2014 for the first and second year, respectively. For reasons of simplicity, genotypes are named G1–G13 in the text. A list of all genotypes and CIP identification codes is given in Appendix B. Before planting, seed tubers were disinfected with Homai (BASF) and afterwards with Decis (Bayer) against potato beetle (Leptinotarsa decemlineata).
The experiments were laid out in a strip plot design with three replications. The size of the experimental subplots was 8.1 m2 (3 × 2.7 m). Plants were arranged in three rows of 11 plants each with 0.9 m between and 0.3 m within the rows for all genotypes. Observations, measurements, and samplings were conducted in the middle row and the neighboring rows served as border plants. Before planting, 1000 kgha−1 Guano was applied into the furrows and pre-sprouted seed tubers were placed by hand with the spouts upside. The mineral fertilizer mixture of 160 kgha−1 potassium sulfate (50% K2O, 18% S, INTI), 80 kgha−1 stabilized ammonium nitrate (33% N; 3% P2O5; 0% K2O, MISTI S.A.), and 250 kgha−1 Fertiphos®-Plus (20% P2O5; 36% CaO; 6% S; 17% SiO2; 1.08% Fe2O3; 0.9% MgO; Micronutrients Zn, Mn, Cu, B) was placed manually between the seed tubers. A second nitrogen dose was top-dressed manually as ammonium nitrate (120 kgha−1) during hilling. Fungicides and insecticides were applied in approximately 20-day intervals according to the instructions of the suppliers. The following products were used: Sorba 50 EC (Syngenta), Ultra Pegasol (Farmagro S.A.), Rover (Sipcam Pacific), Pentacloro Farmex, Cipermex (Farmex), Confidor 350 SC Fitoraz (Bayer), Evisect 50 SP (Arysta). Insecticides with changing functional groups were applied to avoid build-up of resistances in the field. Manual weeding was done in 14-day intervals.

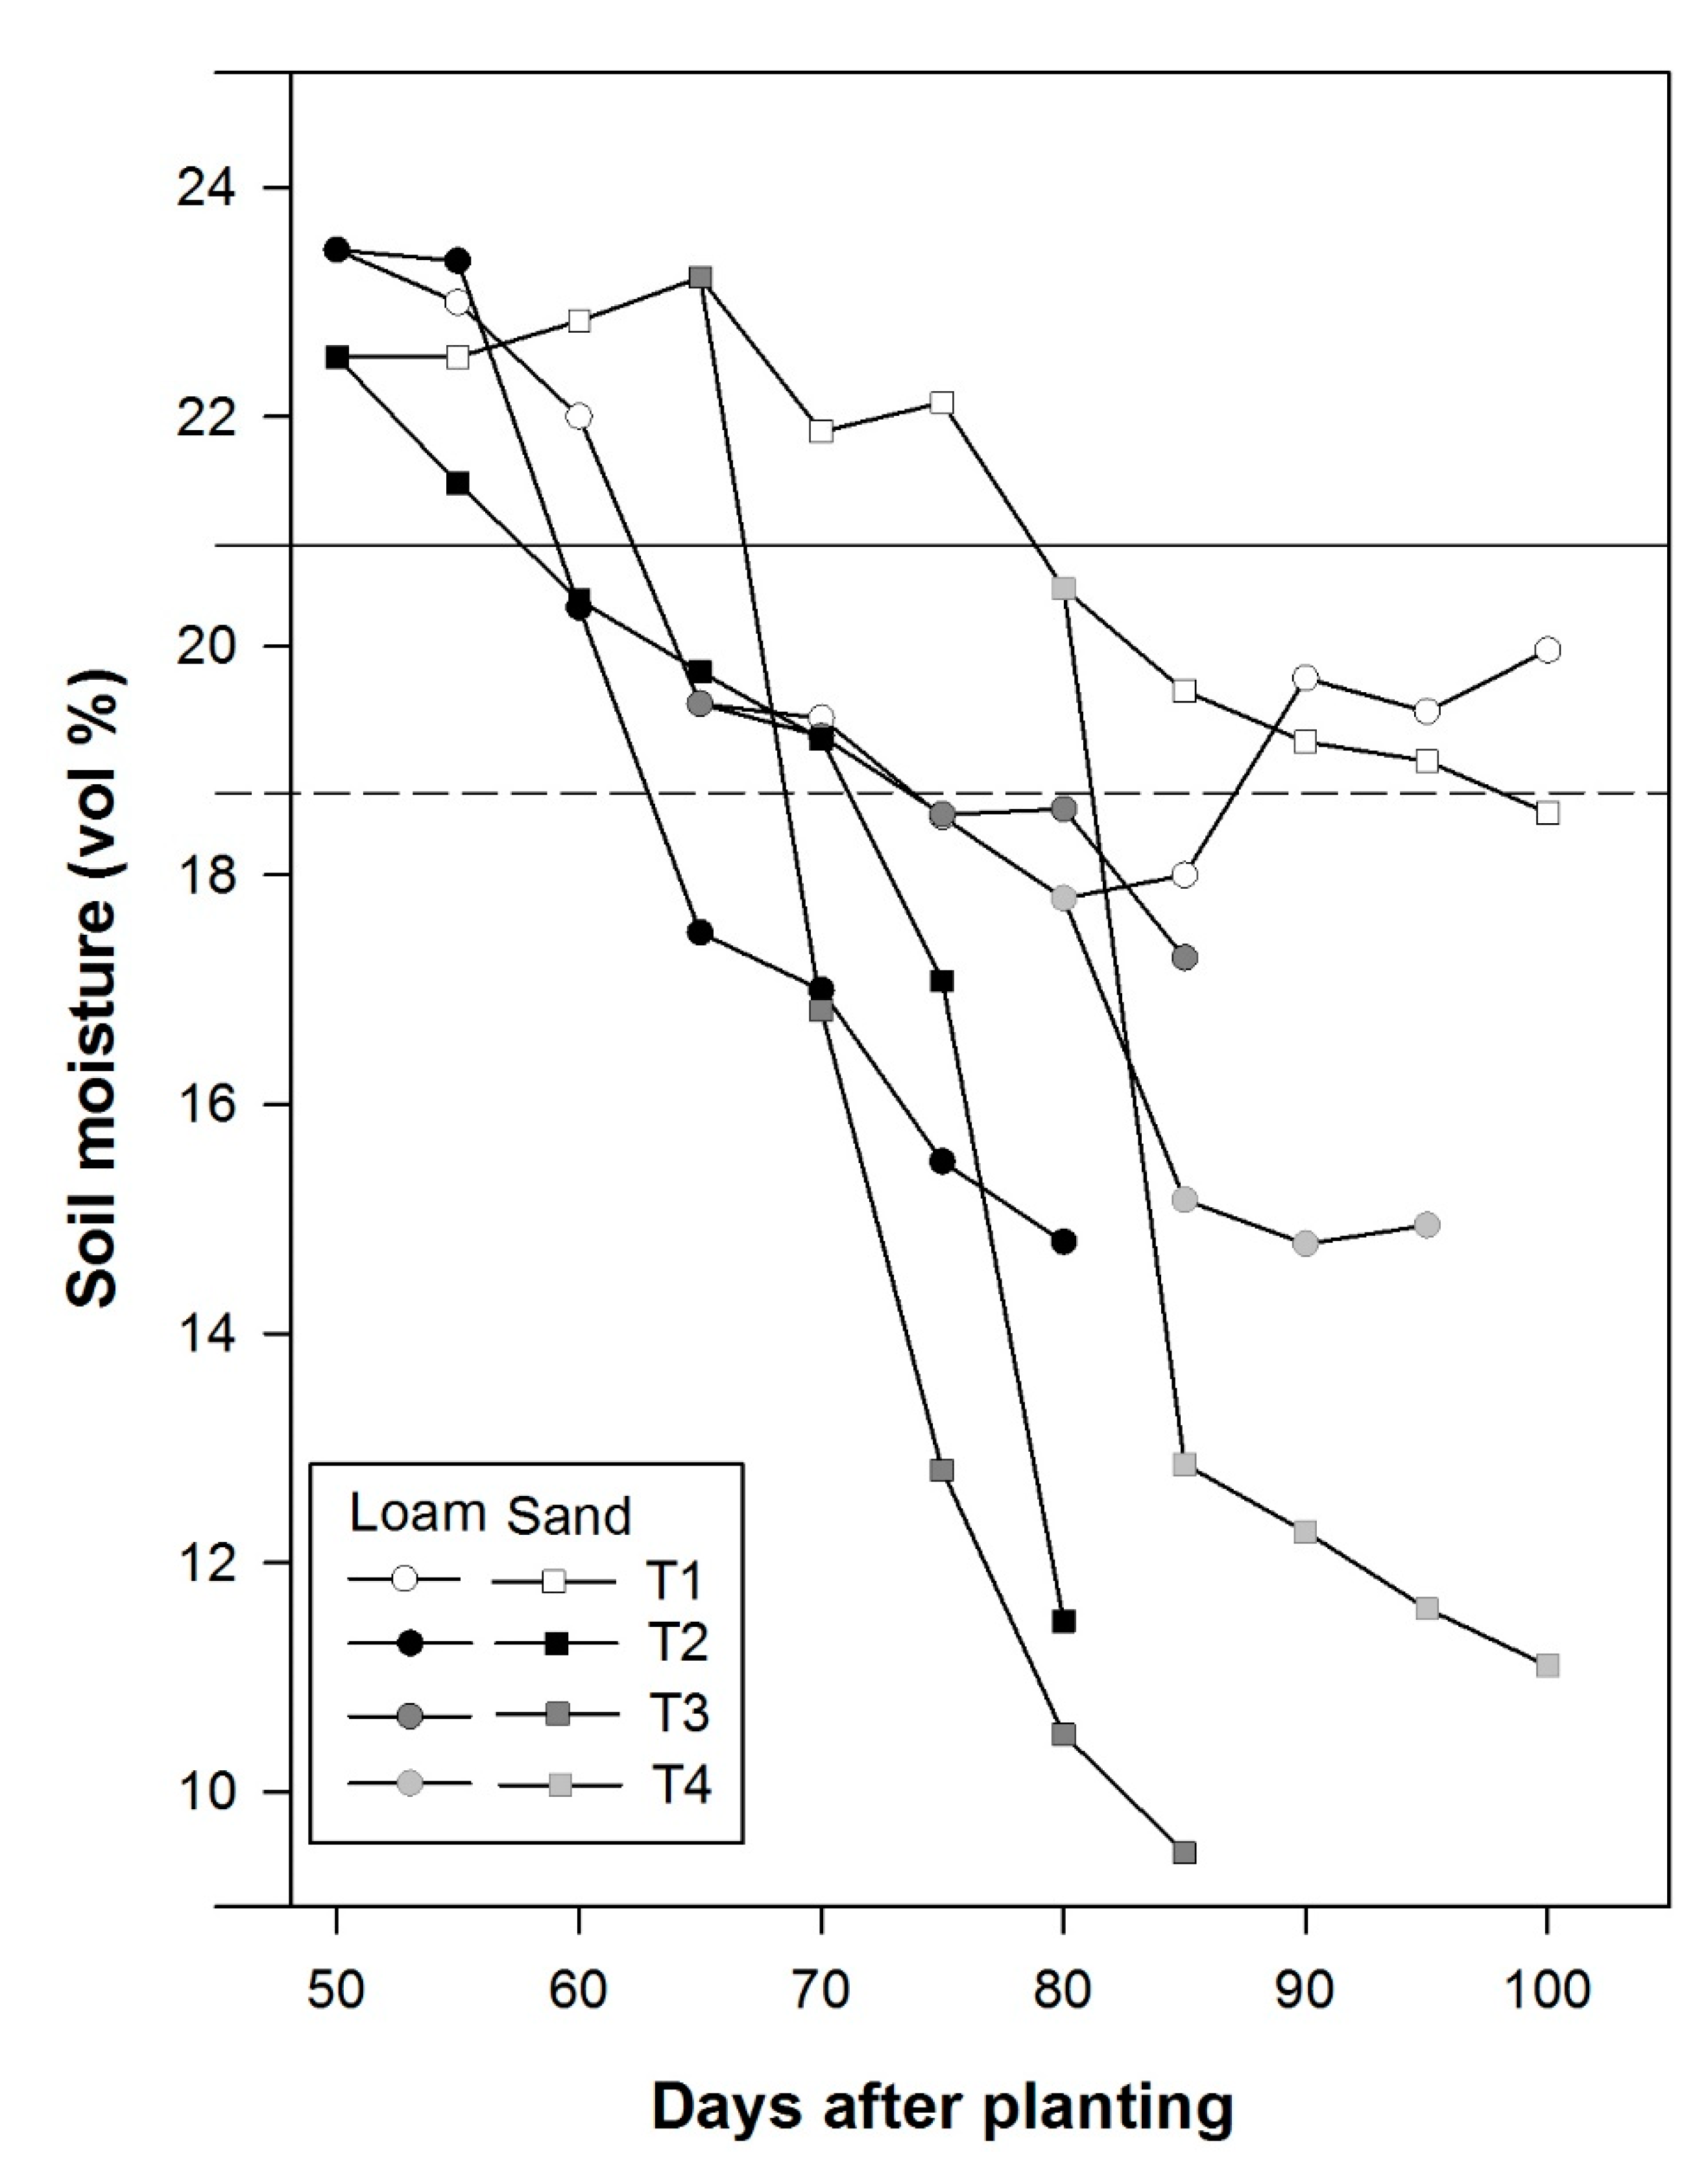
2.3. Irrigation Treatments and Soil Moisture Measurements

Irrigation of the experimental plots was established via drip irrigation with a 0.3 m distance between individual drips and one dripline per row until hilling and two driplines per row thereafter. The full irrigation treatments were targeted to 85% field capacity of the respective fields (T1). Irrigation was withheld at 50 days after planting (DAP) for T2, at 65 DAP for T3, and at 80 DAP for T4. The total amount of irrigation for each treatment is given in Table 3.
Soil moisture was measured in the plots planted with G1-G5 for each treatment and replication in three to five-day intervals via frequency domain reflectometry (FDR, PR2 Soil Moisture Profile Probe, Delta T-Device). The four sensors of the profile probe measure in 10 cm increments in 0–40 cm depth via access tubes were made of fiberglass. For each value, three measurements were taken with the probe rotated by approximately 120 degrees for each measurement to account for suboptimal soil contact of the access tube and the gap in the sensor ring. The upper 10 cm were excluded in further presentation, as the soil dried down very fast in this horizon and the FDR probe did not measure adequately at soil moisture content under 5 vol %.
Soil moisture dynamics under the different irrigation treatments and soil types are shown for the experimental period in Figure 1.

2.4. Samplings, Yield, and Yield Components

One randomly selected plant per genotype, replication, and treatment was sampled destructively at 10, 20, and 30 days after withholding water. Care was taken that each sampled plant was in the center of eight neighboring plants to avoid border effects. Roots and tubers were carefully excavated, adhering soil removed, average root length was measured, and tubers were counted. Leaves, stems, and roots were separated and dried in paper bags for three days at 80 °C until constant weight. Dry matter and fresh tuber weight were determined with a fine balance (KERN und Sohn, Type 440). Differences in tuber yield relative to the fully watered treatment (ΔTY; %) were calculated as:
Δ TY   ( % )   = 100 ( TY TD * 100 TY FI )
with TYTD and TYFI, for fresh tuber yield in grams per plant under water deficit and fully irrigated control.
Leaf area index (LAI, m2 m−2) was measured non-destructively before each destructive sampling with AccuPAR LP-80 (Decagon Device, Inc. Pullman, WA, USA). The external PAR sensor to measure incoming radiation was installed at 2 m height on a portable rack.

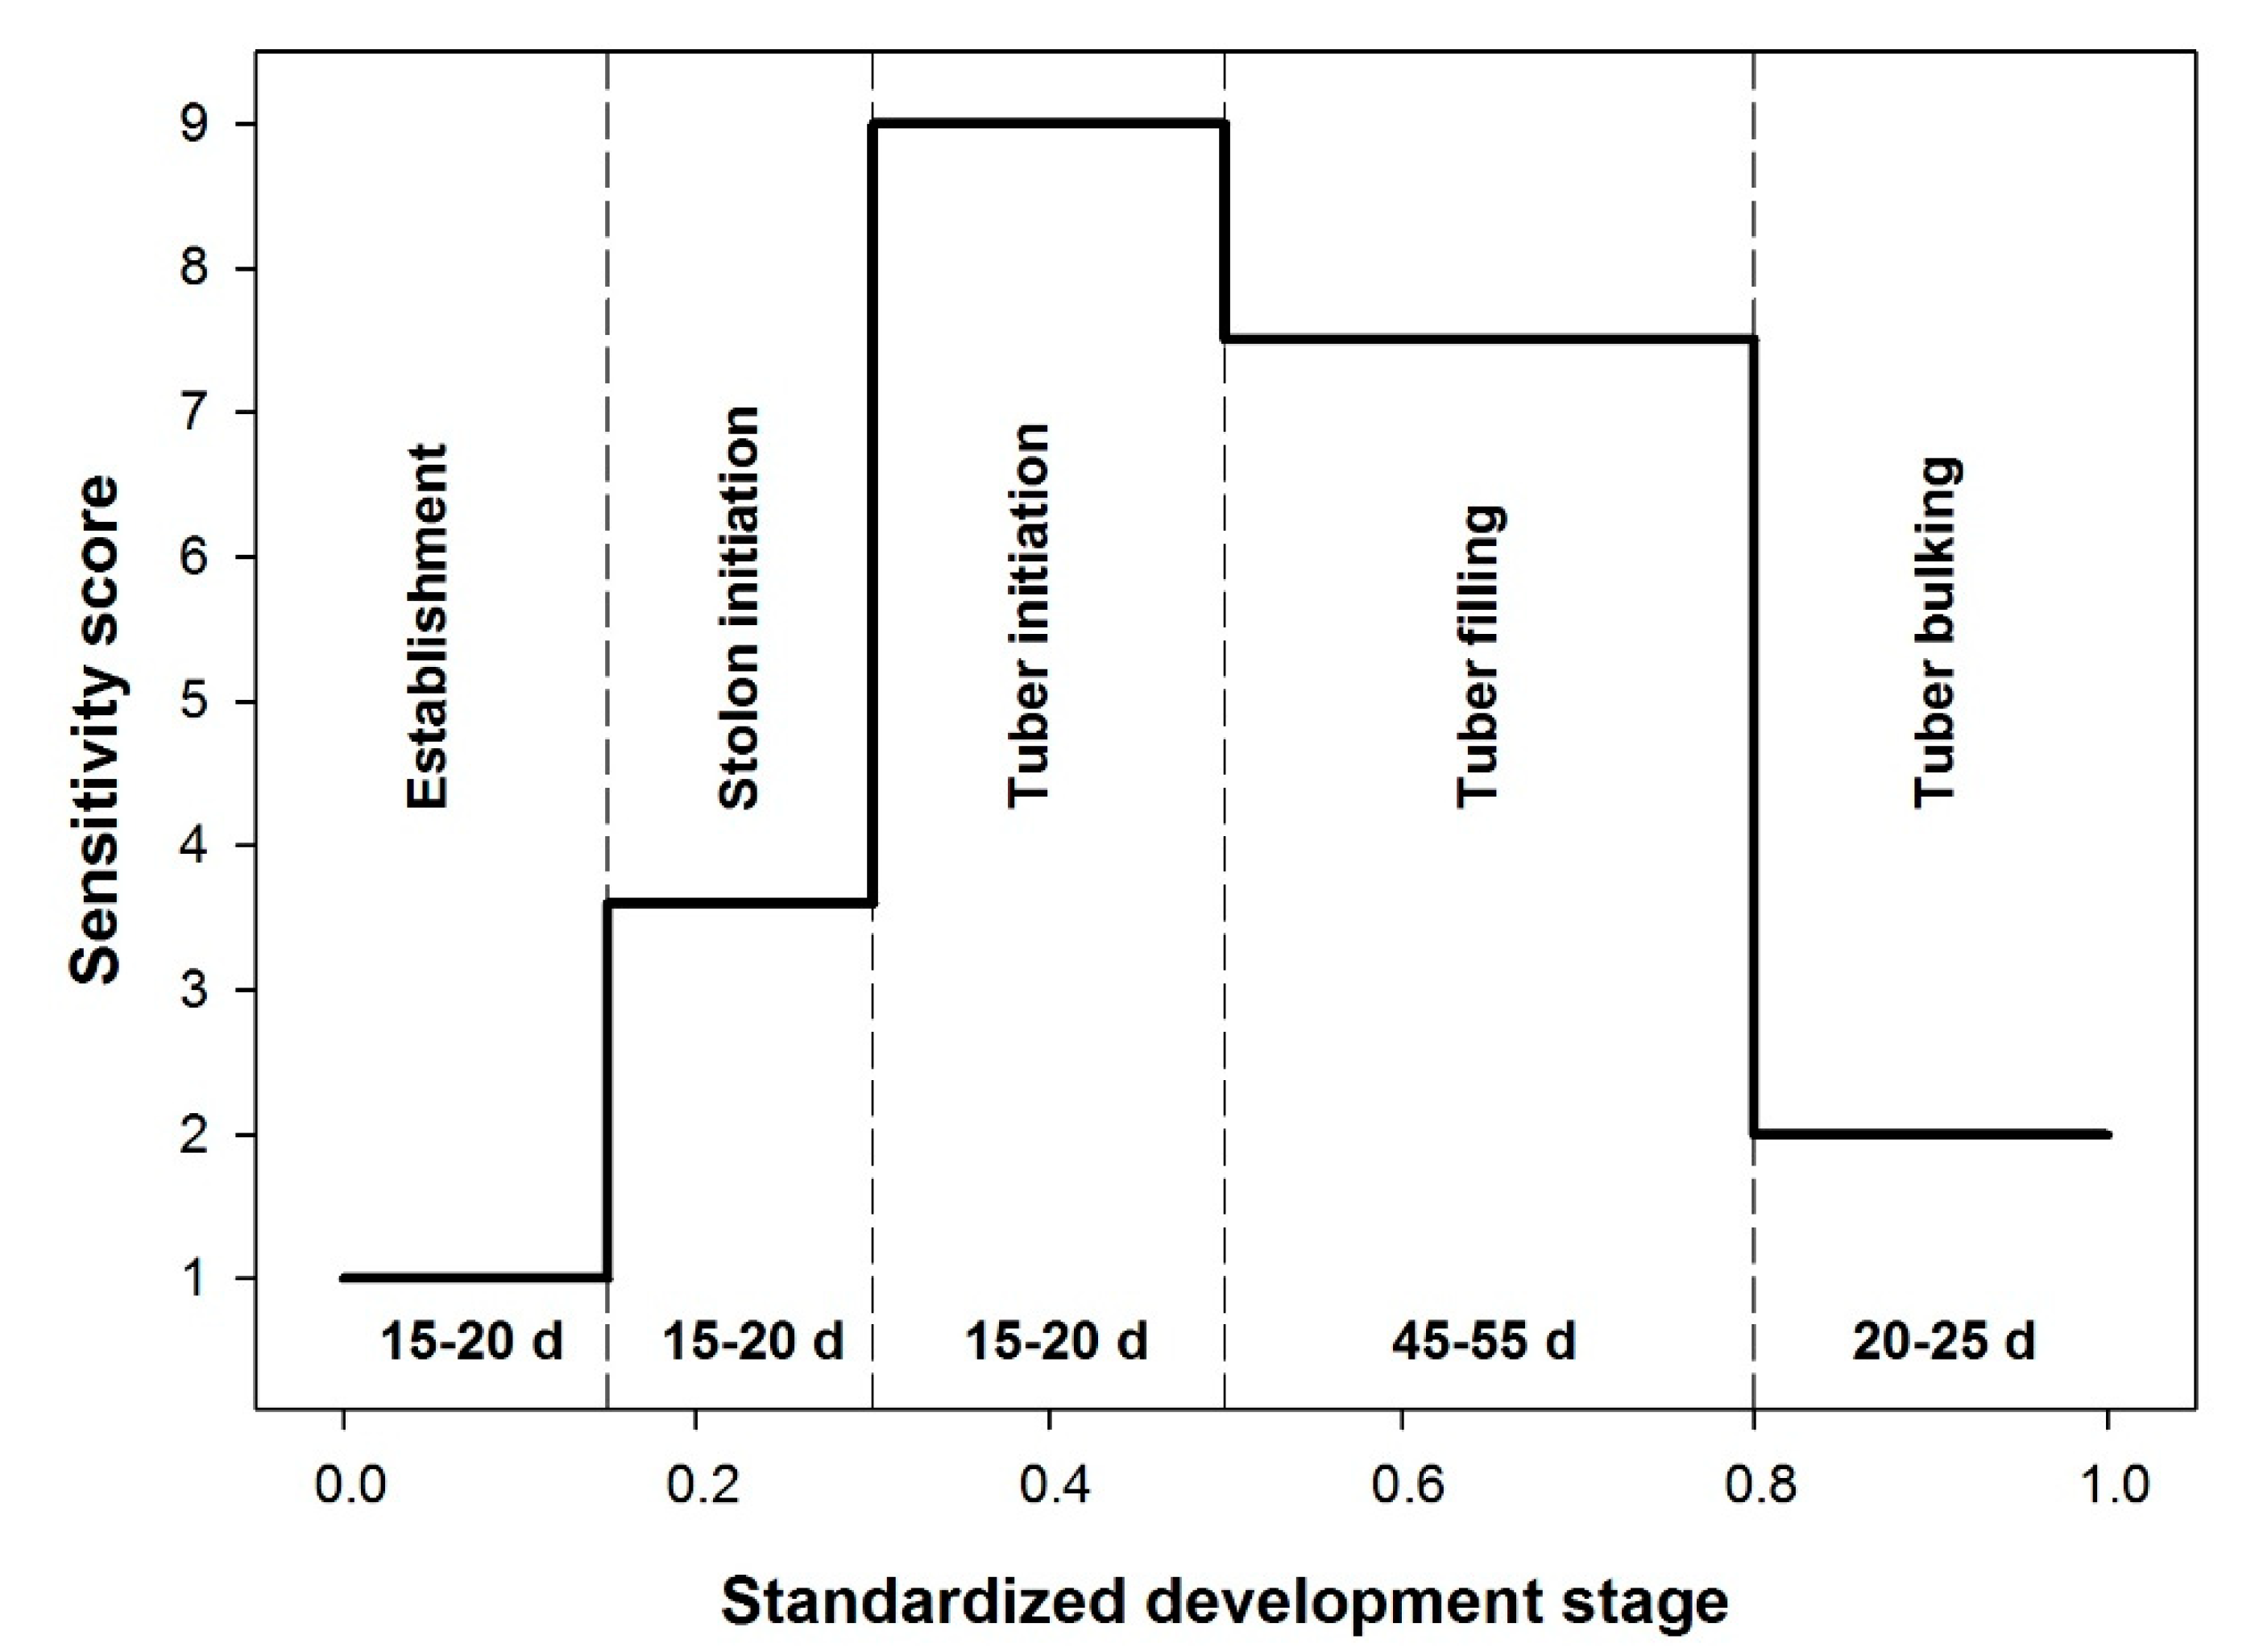
2.5. Phenology and Development Stage Specific Sensitivity to Moisture Deficit Stress

Belowground phenology was evaluated non-destructively in 10-day intervals from planting to physiological maturity from one plant per genotype and replication (n = 3) in five genotypes (G1–G5, Appendix B).
In order to be able to compare genotypic responses across development stages, genotypic development was standardized to range between 0 (planting) and 1 (physiological maturity). Based on the scales for development proposed by Doorenbos and Kassam (1979) [29] and Obidiegwu et al. (2015) [5], cardinal points in genotypic development were set as: 50% of the plants germinated = 0.1, 50% of the plants at stolon initiation = 0.2, 50% of the plants at tuber initiation = 0.4, 50% of the plants at the tuber filling stage = 0.65, and 50% of the tubers were physiologically mature = 1. Physiological maturity/end of tuber bulking was defined as tuber skin connected to tuber flesh and not removable by peeling. The below ground development rate was calculated as the difference between two standardized development stages divided by the number of days required to reach from one stage to the next.
A sensitivity score for the different development stages was developed based on results on yield and growth responses in potato under drought published earlier by Doorenbos and Kassam (1979) [29], van Loon (1981) [30], and other researchers [5,15,31,32]. The sensitivity score ranges from 1 (not sensitive) to 9 (highly sensitive), reciprocally corresponding to the drought response score developed by Boguszewska-Mankowska et al. (2017) [33], with tuber initiation and tuber filling being the most sensitive development stages (Figure 2).

2.6. Soil Water and Stress Severity Index

Soil water retention curves with corresponding field capacity and plant available water were modelled with the van-Genuchten-Mualem function. The parameters for the van-Genuchten-Mualem function were estimated with “RosettaLite” in HYDRUS-1D [34]. The soil texture and soil density used in “RosettaLite” is given in Table 2. With the van-Genuchten-Mualem function, the field capacity and permanent wilting point were calculated at 23.2% and 8.5% for the loamy sand and 20.8 and 5% for the sandy soil, respectively (Table 2).
Irrigation was targeted to 0.85 * field capacity, however, since irrigation was based on time and not volume, variability in the drip points resulted in a varying moisture level for irrigated plots for both soils (Figure 1). Withholding irrigation resulted in all treatments in rapid soil drying and, depending on the treatment and the soil type, resulted in a loss of plant available water of 30 to 80%, thus, creating relatively severe stress levels for the plants. Taking into account the varying sensitivity to water deficit of the different development stages (Figure 2) a stress severity index was calculated.
The stress severity index (SSI) comprises of the soil water tension experienced by the plant weighted by the relative genotypic sensitivity of the respective phenological stage (Figure 2), cumulated for the duration of the water deficit treatment (Equation (2)).
n = 1 N S S I = ( Ψ n * S C n ) + ( Ψ ) n + 1 * S C n + 1
SC is the sensitivity score for standardized development stages of potato (Figure 2). Ψ is the soil water tension at time n.

2.7. Data Analyses

Statistical analysis was performed with the R Statistical Program (R Foundation for Statistical Computing, Vienna, Austria, 2008). All data were tested for normal distribution and homogeneity of variances using the Bartlett’s test and outliers were removed. We used an ANOVA-pairwise comparison with Bonferroni adjustment for a completely randomized block design. All statistical analyses used a nominal alpha of p < 0.05. Graphs and regressions were generated with SigmaPlot 12.5, Systat Software, Inc., Erkrath, Germany.

3. Results

3.1. Genotypic Performance under Water Deficit

Table 4 shows the agronomic and morphological results exemplary for five potato clones subjected to four irrigation treatments on two contrasting soil types. Under fully irrigated conditions tuber yields ranged on loam and sand between 1080 and 622 gpl−1 and 1282 and 472 gpl−1, respectively. Withholding irrigation significantly reduced tuber yields across genotypes by 77%, 50%, and 22% for early, medium, and late drought treatments, respectively, on loam and 86%, 85%, and 62%, respectively, for the same treatments on sand. Aboveground biomass, mean root length, and leaf area index (LAI) were strongly negatively affected by withholding irrigation and in all instances the effects were most severe under early drought and more pronounced in sand than in loam. Whereas, the tuber number was also reduced by about 50% under early drought on both soil types. The stronger yield losses on sand were mainly due to a reduced tuber size, whereas, on average under drought, the tuber number was less affected. The mean tuber size in sand under the drought treatments was only about 50% of that in loam.
Genotypes responded differently to both soil type and drought treatments. Whereas, genotypes 1 and 2 yielded above average in loam, genotypes 3 and 4 out yielded the others in sand under full irrigation. Early drought reduced yields in loam by about 72%–78% except for genotype 5 with 92% and in sand by 79%–85% except for genotypes 5 and 4 with 91% and 94%, respectively. Withholding irrigation later resulted in a better genotypic performance, however, genotype 5 always performed worse than the other four, particularly in sand (Table 4).

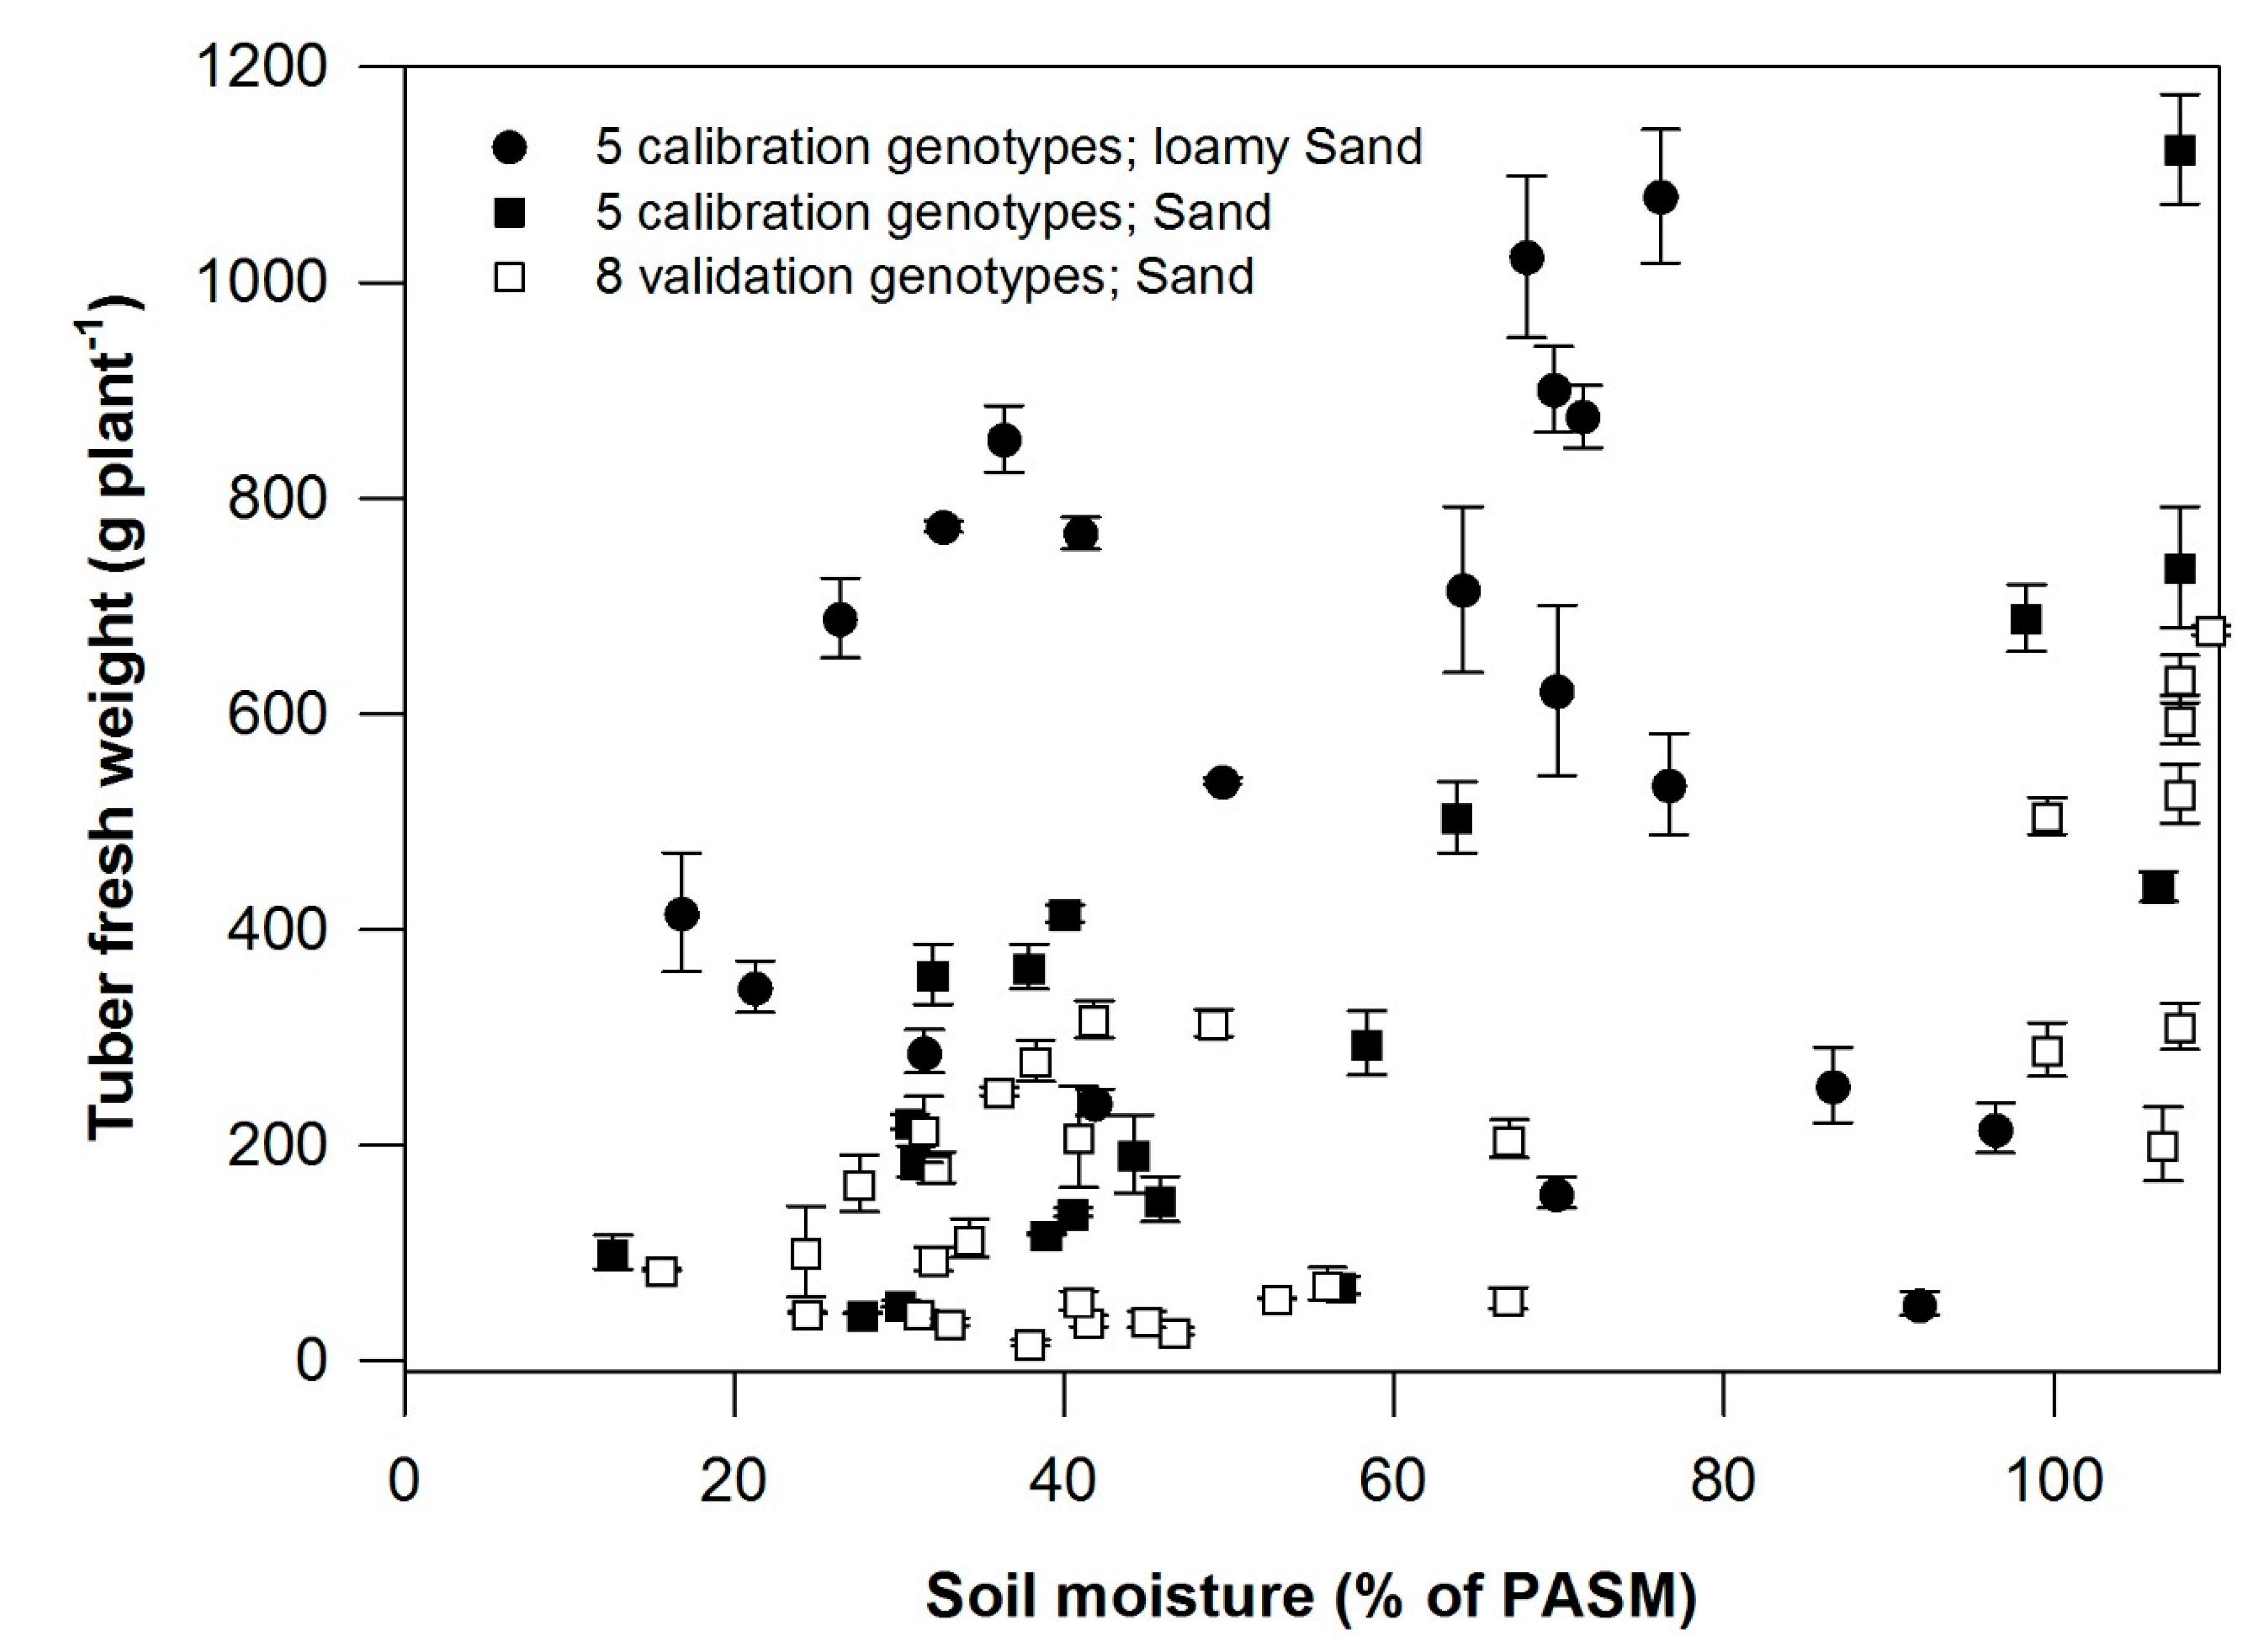
3.2. Plant Available Soil Moisture and Tuber Yield

Figure 3 shows the effects of reduced plant available soil moisture (PASM) on tuber yield of all genotypes under the four applied irrigation treatments. Of the thirteen genotypes used in this study, five were tested on both soil types whereas eight were only grown in sand. Thus, the stress severity index (SSI) was developed on the results of five genotypes and then applied to all. The first step in the development of the SSI was to relate the tuber yield to the stress. The stress is here defined as the reduction in available soil moisture and its effect on tuber yield. No clear pattern or relationship was found between the two parameters (Figure 3). There seems to be a slight tendency of tuber yield decreasing with the decreasing PASM but the correlation is not significant.

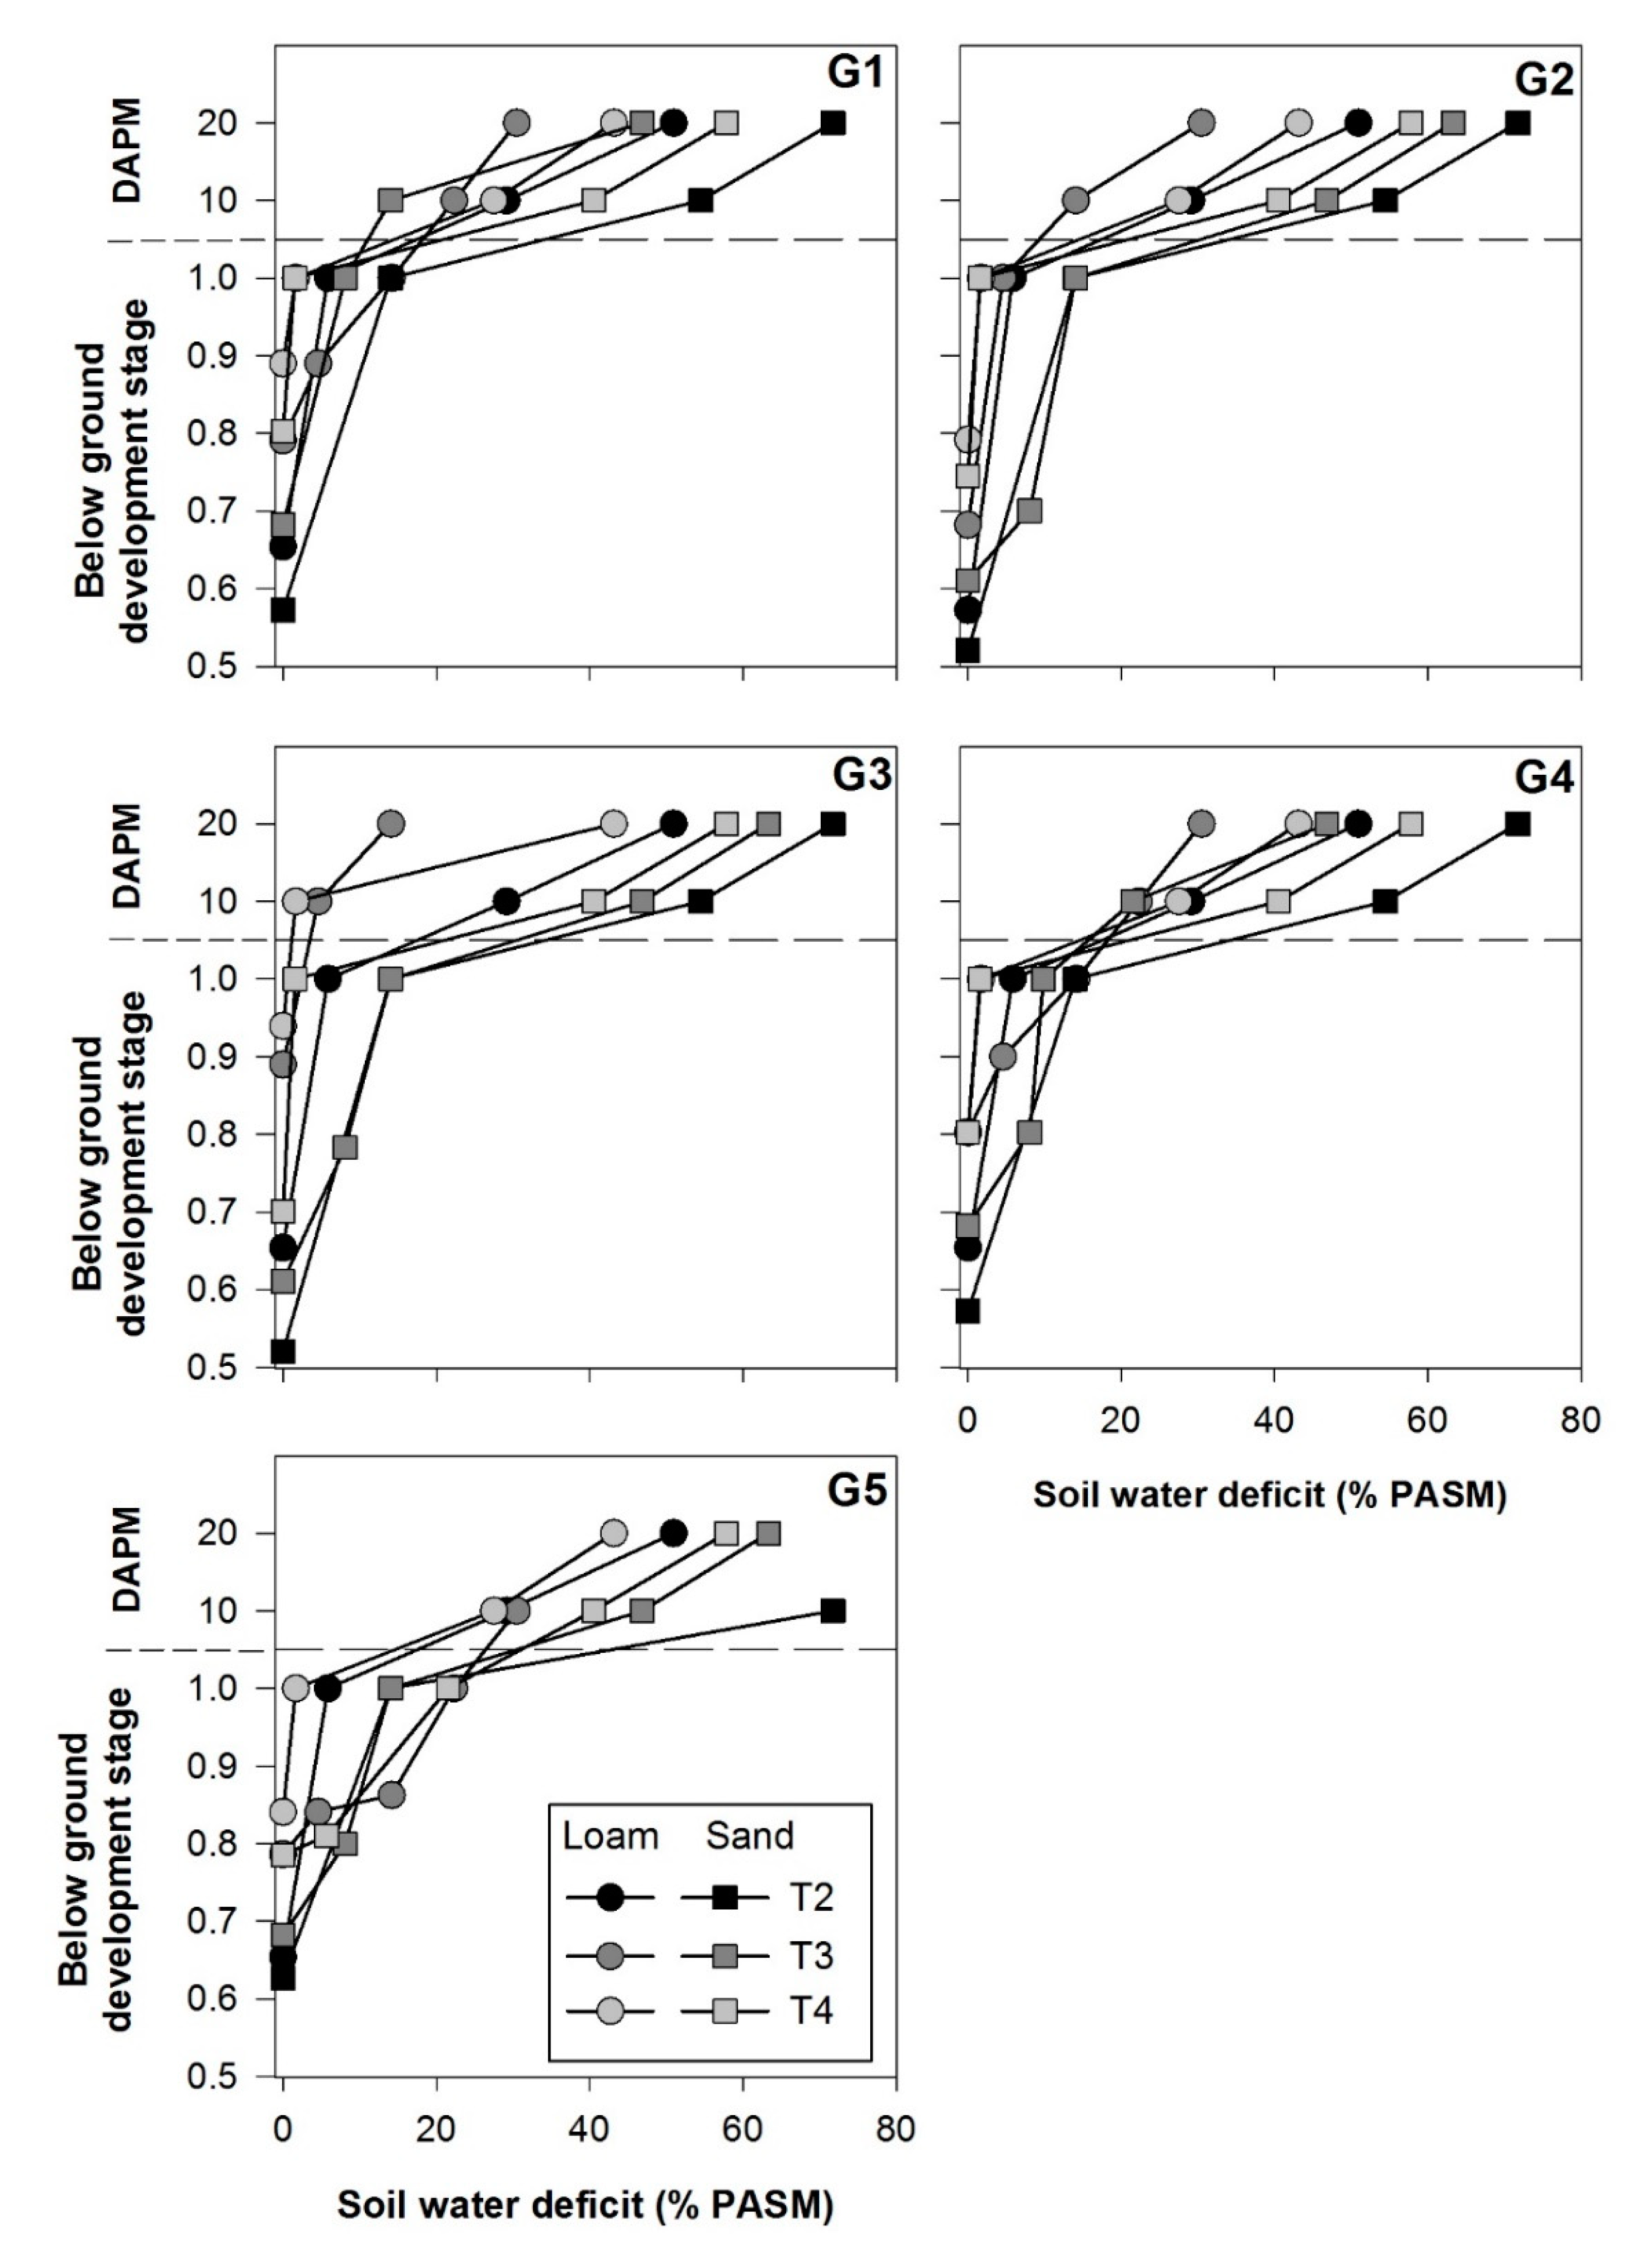
3.3. Soil Moisture Deficit and Below-Ground Development

The increasing deficit in plant available soil moisture after withholding irrigation strongly slowed the plant belowground development in the early and medium drought treatments. Due to this, some sensitive development stages (Figure 2) were subjected to the lower available soil moisture in the early treatments as compared to later treatments. Particularly in sand, the soil moisture deficit developed faster and affected sensitive development stages even more severely (Figure 4).

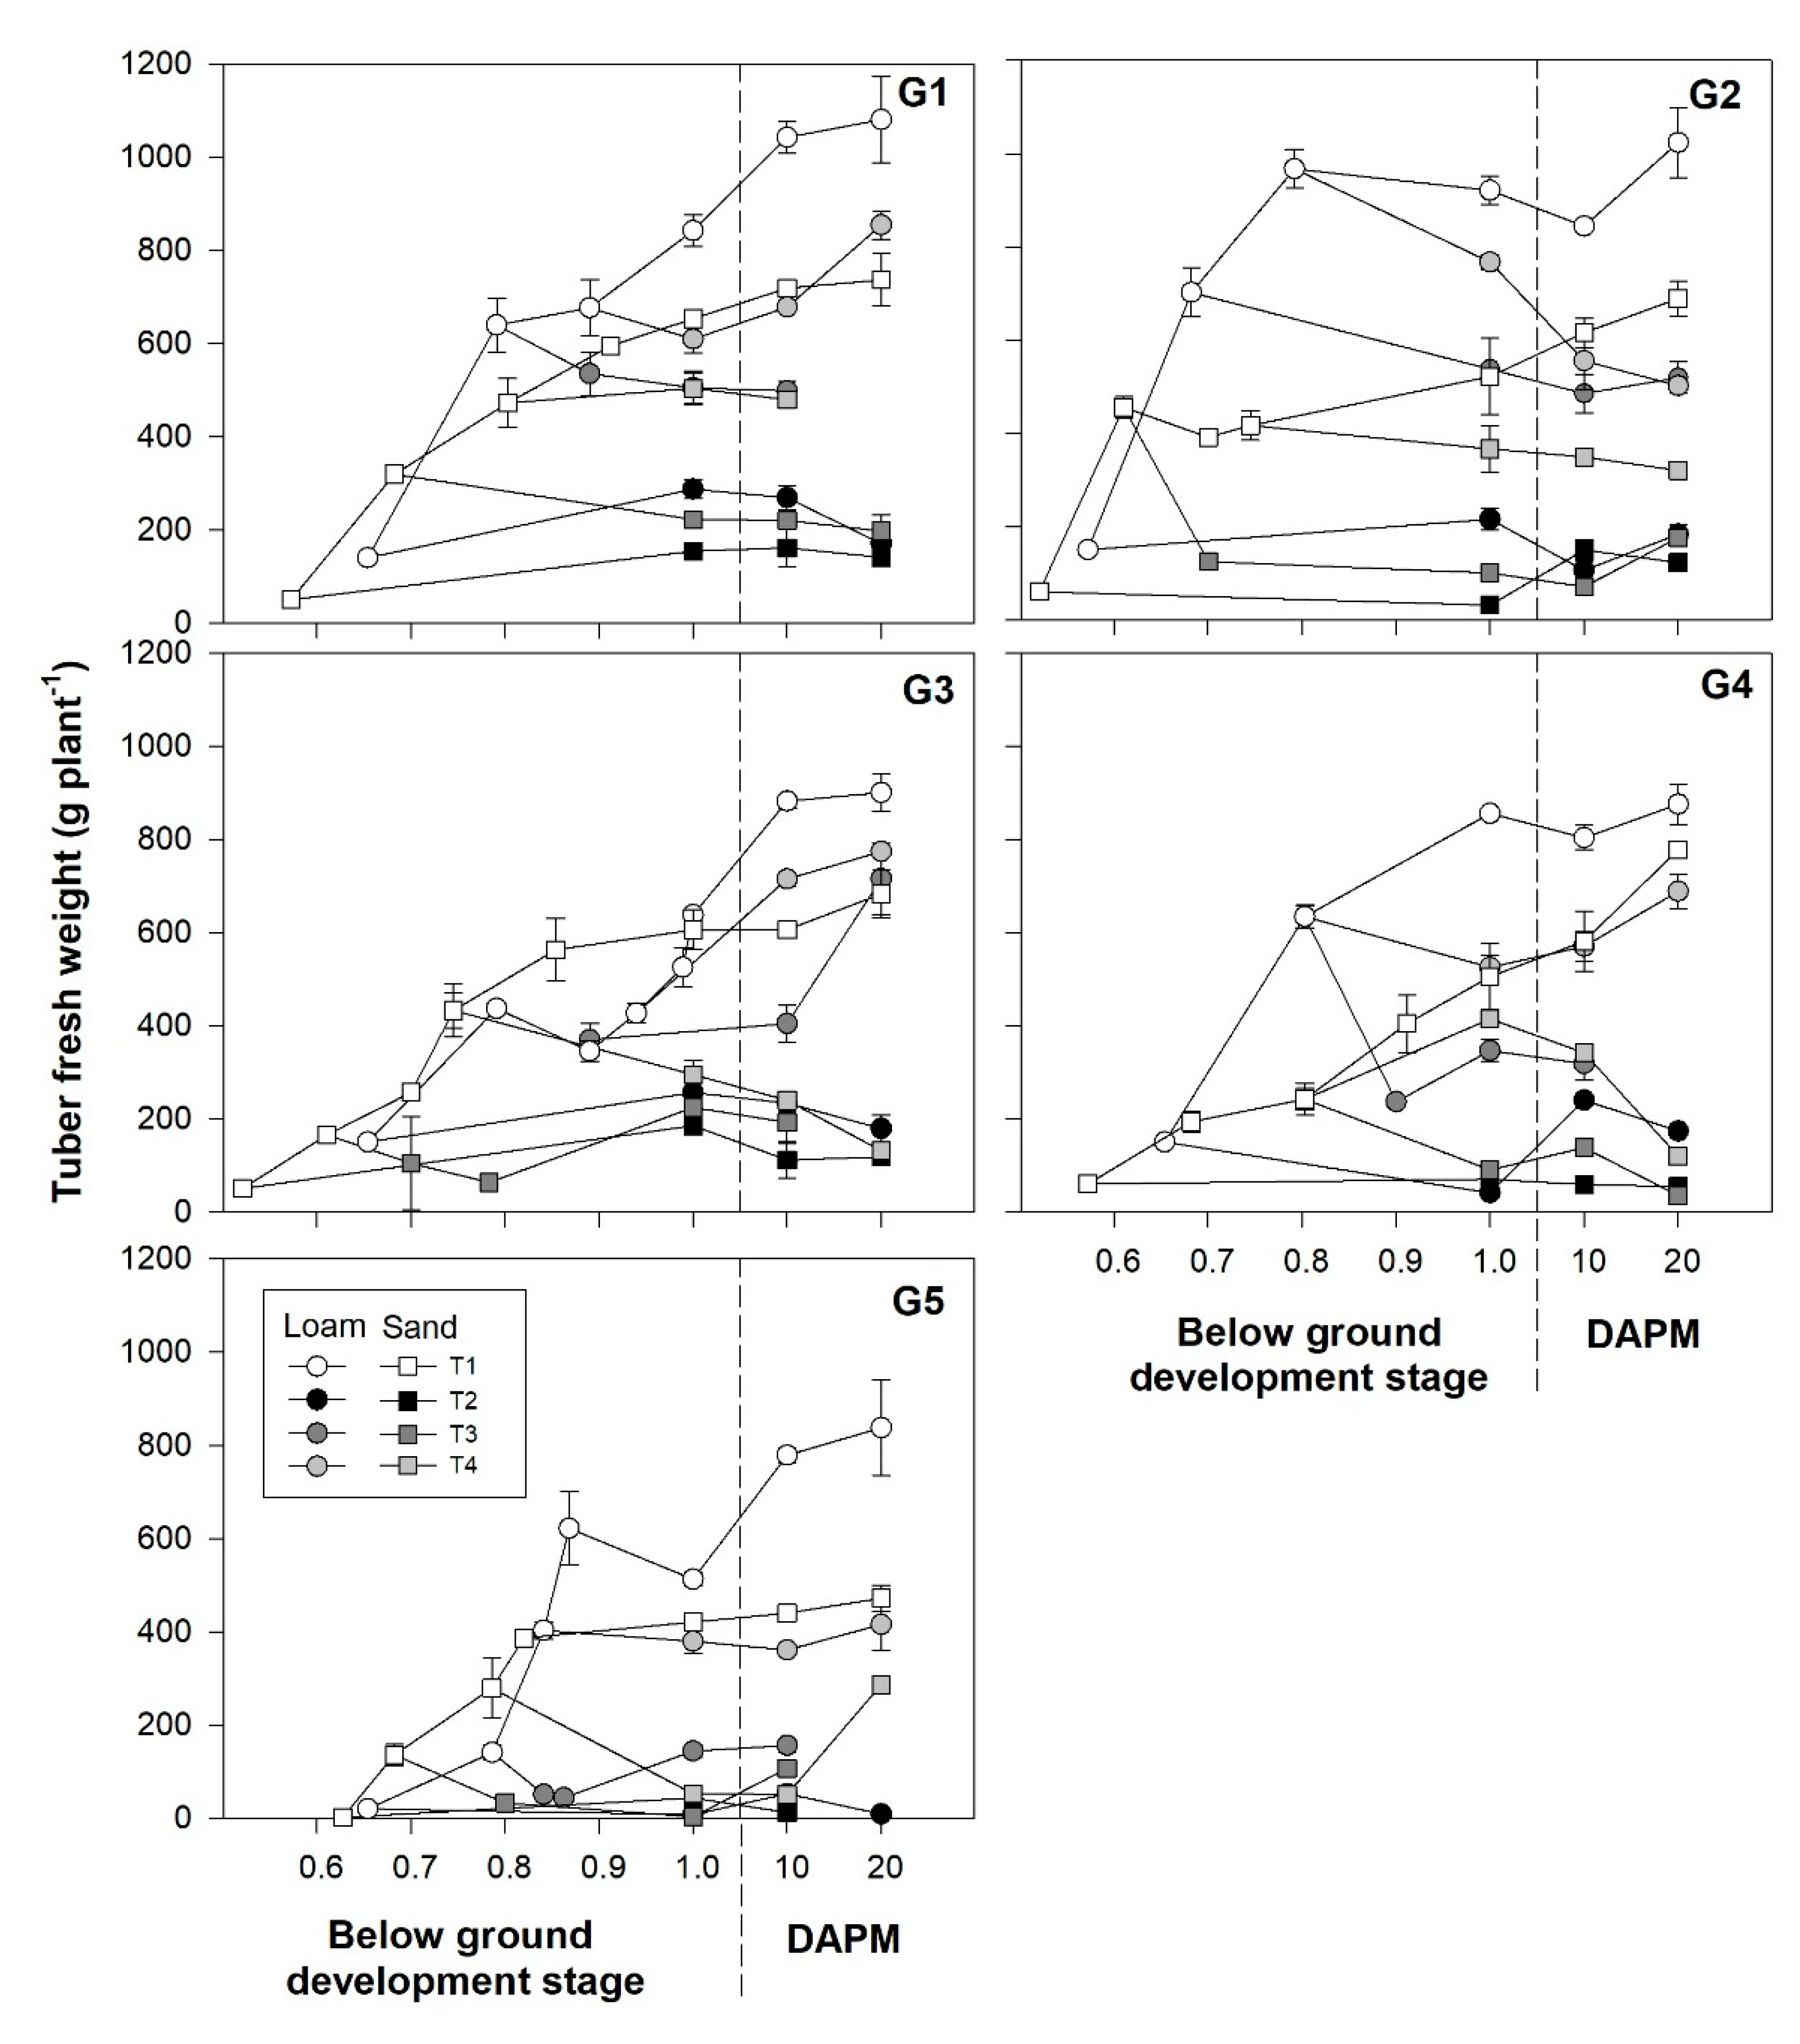
3.4. Below Ground Development and Tuber Fresh Weight

Belowground development marks the initiation, filling, and bulking of tubers (Figure 2). Water deficit treatments in combination with soil type resulted in genotypic specific changes in phenology and tuber formation (Figure 5). Tuber weights in the fully irrigated control increased constantly until maximum yield. In all other treatments, tuber weight development was reduced as compared to the control and the final tuber weight was reached earlier with the effect being directly related to the severity of the water deficit in both soils. Initiating soil water deficit early resulted in stagnation of already reached tuber weights (T2) or in an immediate reduction of tuber weights (T3). Initiating the water deficit in the bulking stage (T4) led to a strong reduction in the final tuber yield and abortion of already formed tubers. In general, stress effects on tuber weight development were more severe in sand than in loam. In all treatments and for all genotypes, tubers that were not aborted reached physiological maturity, albeit strongly influenced by water deficit resulting in a variable final tuber weight.

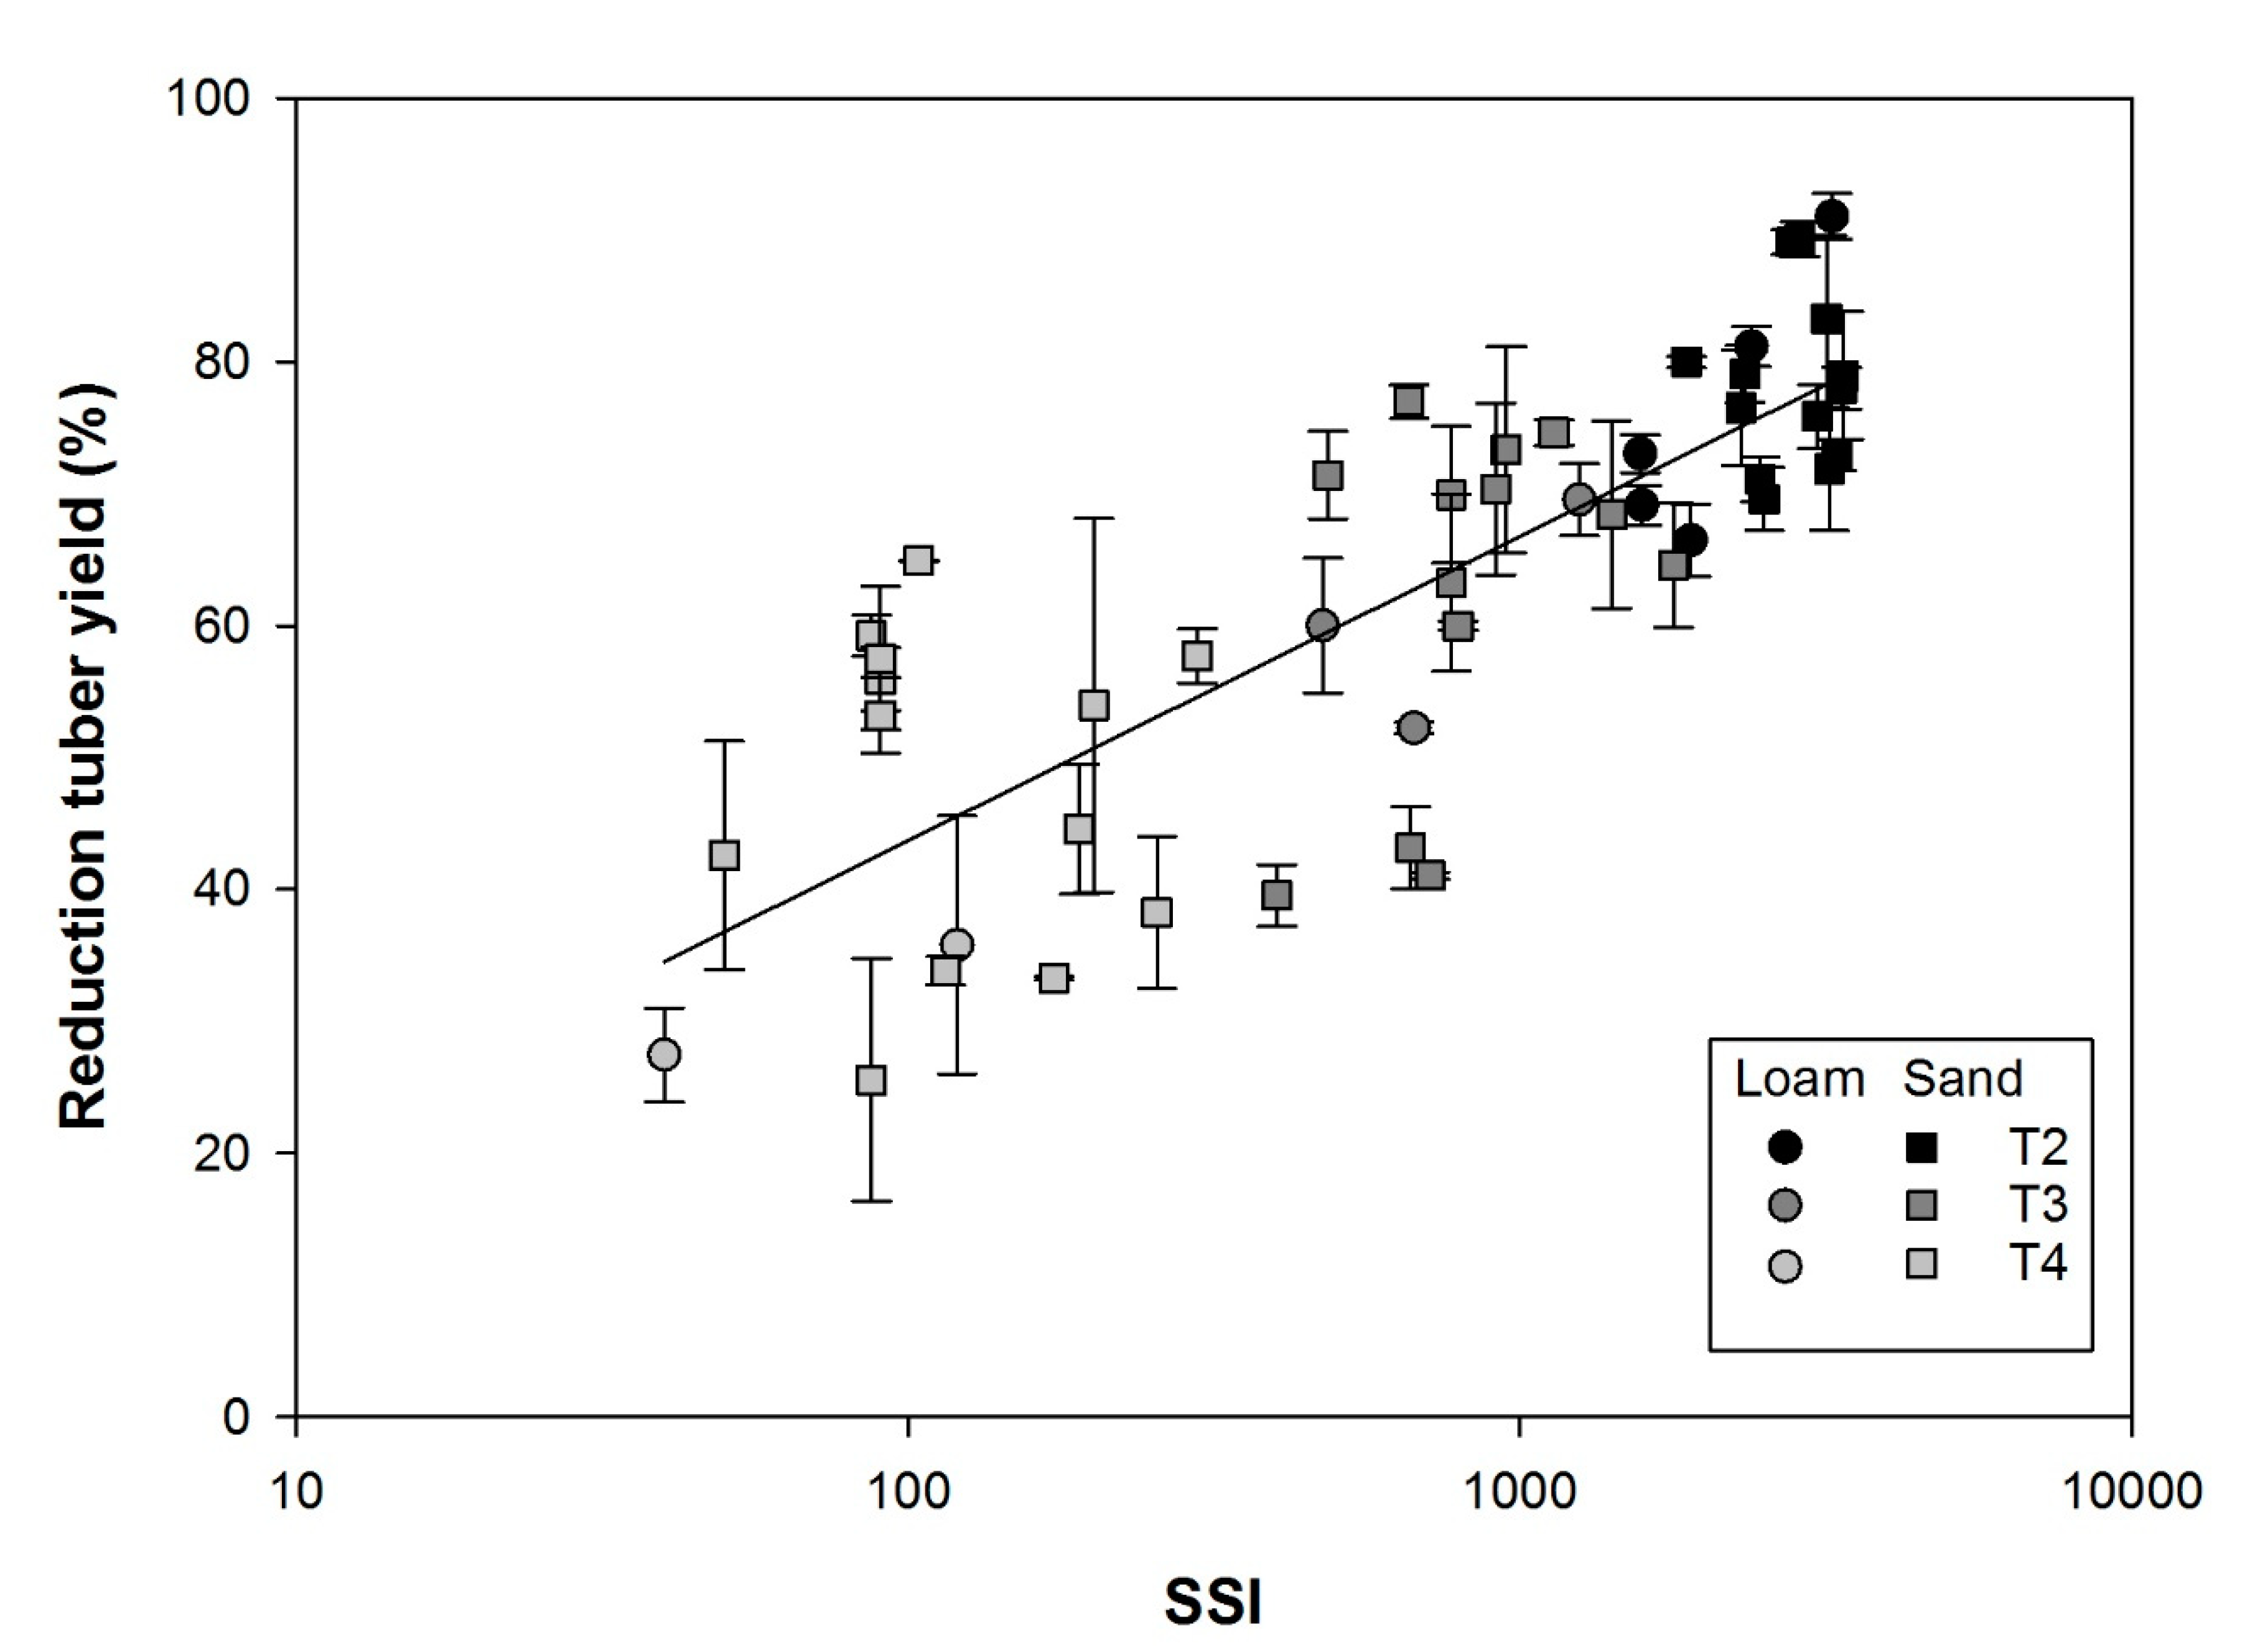
3.5. Stress Severity Index and Tuber Yield Reduction

Combining the stressor (soil moisture deficit and its duration) with the sensitivity of the respective development stage (phenology) to soil moisture deficit, allows calculating a stress severity index that reflects the genotypic response to soil moisture deficit in terms of tuber yield effects. Figure 6 shows the log-linear relationship between SSI and the resulting reduction in tuber yield. SSI values beyond 1000 indicate severe drought stress in a range that the plant can maybe survive but cannot be productive anymore. Those genotypes that show relatively little tuber yield reduction at relatively high SSI values (below the regression line for T3 and T4 for SSI between 100 and 1000), may possess interesting traits for drought tolerance. Those above the regression line can be classified as drought sensitive.

4. Discussion

In this study, the potato clones subjected to different irrigation treatments on two different soil types in general responded to the water deficit with a reduction in dry mass, tuber yield, root length, and leaf area (Table 4). Genotypes differed in their responses as a function of soil type, stress severity, and development stage during which they were subjected to the treatment. Withholding irrigation at an early stage (T1—tuber filling) triggered the strongest responses, whereas withholding irrigation at later stages (T4—end tuber filling/tuber bulking) resulted in less severe reductions. Yields on sand were generally lower and drought responses more pronounced. Under full irrigation, the highest yields were recorded for genotypes 1 and 2 on loam and genotypes 3 and 4 on sand. However, in stress conditions such genotypic differentiation between soil types was not observed and yields on sand were always lower than on loam, an effect recently also observed for Dutch potato production systems [35]. The treatments significantly differed in their effects on yield (Table 4). Yield and biomass production were most strongly reduced by treatment 2 on sand with no significant differences between the genotypes on either soil type. Many studies on drought tolerance of potato try assessing drought tolerance using above ground indices (e.g., [36,37,38]) or below ground indices (e.g., [19,28,39]) but ignore soil type and soil moisture. Assessing genotypic responses to the water deficit, based on yield or yield-derived indices varied strongly between locations and years [19] but stress severity was never defined and soil properties were not included in the stress analyses. The importance of including soil moisture and soil matrix potential in the evaluation of stress severity was pointed out by Jensen et al. [40]. Jensen et al. [41] showed that different development stages of potato varied in their responses to water deficit.
We evaluated the yield performance of 13 potato clones under varying supply of plant available soil moisture (Figure 3) and showed that the total amount of water available to the plant is not directly related to the final tuber yield, which is in line with the arguments of Jensen et al. (1998). We could also show, that the soil moisture deficit developed at different speeds in the two soils (Figure 1), which resulted in different water deficit–belowground development stage combinations (Figure 4) leading to different stress severities at different development stages and, thus, different effects on tuber yield for the individual genotypes (Figure 5). Combining the sensitivity of the individual development stages (Figure 2) with the drying effects on the soil matrix potential (Table 2) allowed us to calculate a daily stress severity value. Summing up this value for the duration of the crop until physiological maturity of the tubers resulted in a stress severity index (SSI) describing the intensity the individual genotypes were subjected to. Values of the stress severity index varied between 25 for T4 on loam and 3500 for T2 on sand. The highest SSI was calculated for early and intermediate drought. On loam and sand under early drought, G1 and G9, respectively, showed the highest SSI and the highest tuber yield reductions. SSI values above 1000 did not distinguish the individual responses of the varieties anymore as in all cases yield reductions of more than 60% technically rendered all genotypes susceptible. The SSI we calculated here allows assessing the actual severity of the stress the plant is subjected to, independent of the duration of the stress. Since it is based on soil functions and the level of water loss in these soils, it is location, year, and genotype independent as an index. Combining it with physiological traits such as chlorophyll concentration [42] or remote sensing-based indices [43] would increase the accuracy in assessing drought resistance and tolerance traits in large numbers of genotypes non water losses. In this study, we focused on relatively late development stages and still found a good relationship between soil moisture losses (calculated as changes in soil tension) and the sensitivity of the individual development stage, to come to a fair assessment of the water deficit effects on yield. In the future, we will concentrate on earlier development stages in order to evaluate to what extent existing indices can benefit from our stress severity approach.

5. Conclusions

The SSI is not exact, but sufficient to separate sensitive genotypes from more resistant genotypes at low stress levels. The SSI indicates drought stress responses across genotypes and environments as seen by the coinciding results of yield reductions at similar SSI values in sand and in loam. The SSI allows comparing results from drought treatments across sites and environments since it provides an independent indicator for the stress a plant is subjected to which allows evaluating the responses on a site independent basis.
To identify drought tolerant potato genotypes under field conditions is one of the major tasks to ensure food security in the future. However, the more environments and drought scenarios are tested, the more complicated becomes the data comparison. The results of this study showed that the same drought conditions resulted in different drought stress severities for various potato genotypes. Phenological differences and varying soil water content are the driving factors of the differences in drought stress experienced by plants. Simply comparing tuber yield or tuber yield reductions does not allow identifying drought tolerant genotypes. Since yield is built in phases that coincide with development stages, the sensitivity of the respective phenological phase as well as the soil tension experienced during this phase determine the impact of the water deficit on yield. SSI allows cumulating stress severity and thus, the higher the yield at a high SSI the stronger are the plants defense and adaptation mechanisms. Therefore, other indices that have looked into stay-green syndrome, rooting depth adaptations, leaf surface temperature, or canopy reflectance indices with only medium success, may benefit from including SSI in their indices to identify the underlying mechanisms of drought tolerance in potato.

Author Contributions

J.H. elaborated the field trials, analyzed the data, and wrote the first draft. F.A. developed the concept, supervised the research work and finalized the draft. A.K. provided supervision at CIP and was instrumental in designing the main field trials. M.B. provided the financial support and supervision of the project. All authors have read and agreed to the published version of the manuscript.

Funding

This research received no external funding.

Acknowledgments

This research was undertaken as part of the CGIAR Research Program on Roots, Tubers, and Bananas (RTB). Financial support by the German Ministry for Collaboration and Development (GIZ No. 11.7860.9-001.00-Improved potato varieties and water management technologies to enhance water use efficiency, resilience, cost-effectiveness, and productivity of smallholder farms in stress-prone Central Asian environments) is gratefully acknowledged. The authors thank INIA-Arequipa for providing facilities. We are grateful to Jesus Zumaran and Leah Kuppinger for their support during the field trials. Competent technical assistance by Jorge Vega, Anthony Quello, Elisabeth Torreblanca, and Trinidad Unda is gratefully acknowledged.

Conflicts of Interest

We have no conflict of interest to declare.

Appendix A

Table A1. Chemical soil analyses.
TextureDepth (cm)E.C. (1:1, dS/m)CaCO3 (%)P (ppm)K (ppm)
Loam0–150.840.1416.88499.2
15–300.620.123.52321.4
Sand0–152.81019.82447.4
15–301.01011.66325.8
Exchangeable Cations (meg/100 g)
CECCa2+Mg2+K+Na+
Loam0–156.793.361.671.310.44
15–306.083.291.420.910.46
Sand0–154.862.581.330.720.23
15–303.841.811.130.670.24

Appendix B

Table A2. Genotype tested in this study. The duration to physiological maturity as determined in Majes is classified as follows: Very early <70 days, early 70–80 days, intermediate 80–90 days, and late >90 days.
No.CIP NumberGroupDuration-MajesVariety Name
G1CIP 392797.22Lowland tropic virus-resistantEarlyUnica
G2CIP 397078.12Lowland tropic virus-resistantIntermediate
G3CIP 392025.7Lowland tropic virus-resistantIntermediate
G4CIP 397073.16 Early
G5CIP 301040.63Lowland tropic virus and late blight resistantLate
G6CIP 720088 LateAchirana
G7CIP 397077.16Lowland tropic virus-resistantEarly
G8CIP 394034.7Lowland tropic virus-resistantEarly
G9CIP 301056.54 Early
G10CIP 393227.66 Very early
G11CIP 301024.95Lowland tropic virus and late blight resistantEarly
G12CIP 397055.2 Late
G13CIP 397069.5Virus resistanceEarly

References

  1. Levy, D.; Veilleux, R.E. Adaptation of potato to high temperatures and salinity—A review. Am. J. Potato Res. 2007, 84, 487–506. [Google Scholar] [CrossRef]
  2. Food and Agriculture Organization of the United Nations (FAO). Crop Water Information: Potato. Available online: http://www.fao.org/nr/water/cropinfo_potato.html (accessed on 13 July 2020).
  3. Stalham, M.A.; Allen, E.J. Effect of variety, irrigation regime and planting date on depth, rate, duration and density of root growth in the potato (Solanum tuberosum) crop. J. Agric. Sci. 2001, 137, 251–270. [Google Scholar] [CrossRef]
  4. Costa, L.D.; Vedove, G.D.; Gianquinto, G.; Giovanardi, R.; Peressotti, A. Yield, water use efficiency and nitrogen uptake in potato: Influence of drought stress. Potato Res. 1997, 40, 19–34. [Google Scholar] [CrossRef]
  5. Obidiegwu, J.E.; Bryan, G.J.; Jones, H.G.; Prashar, A. Coping with drought: Stress and adaptive responses in potato and perspectives for improvement. Front. Plant Sci. 2015, 6, 1–23. [Google Scholar] [CrossRef] [Green Version]
  6. Onder, S.; Caliskan, M.E.; Onder, D.; Caliskan, S.; Çalışkan, M.E. Different irrigation methods and water stress effects on potato yield and yield components. Agric. Water Manag. 2005, 73, 73–86. [Google Scholar] [CrossRef]
  7. Ramirez, D.A.; Yactayo, W.; Rens, L.R.; Rolando, J.; Palacios, S.; De Mendiburu, F.; Mares, V.; Barreda, C.; Loayza, H.; Monneveux, P.; et al. Defining biological thresholds associated to plant water status for monitoring water restriction effects: Stomatal conductance and photosynthesis recovery as key indicators in potato. Agric. Water Manag. 2016, 177, 369–378. [Google Scholar] [CrossRef]
  8. Saravia, D.; Farfán-Vignolo, E.R.; Gutierrez, R.; De Mendiburu, F.; Schafleitner, R.; Bonierbale, M.; Khan, M.A. Yield and Physiological Response of Potatoes Indicate Different Strategies to Cope with Drought Stress and Nitrogen Fertilization. Am. J. Potato Res. 2016, 93, 288–295. [Google Scholar] [CrossRef] [Green Version]
  9. Schafleitner, R.; Gutierrez, R.; Espino, R.; Gaudin, A.; Pérez, J.; Martinez, M.; Dominguez, A.; Tincopa, L.; Alvarado, C.; Numberto, G.; et al. Field Screening for Variation of Drought Tolerance in Solanum tuberosum L. by Agronomical, Physiological and Genetic Analysis. Potato Res. 2007, 50, 71–85. [Google Scholar] [CrossRef]
  10. Carli, C.; Yuldashev, F.; Khalikov, D.; Condori, B.; Mareš, V.; Monneveux, P. Effect of different irrigation regimes on yield, water use efficiency and quality of potato (Solanum tuberosum L.) in the lowlands of Tashkent, Uzbekistan: A field and modeling perspective. Field Crop. Res. 2014, 163, 90–99. [Google Scholar] [CrossRef]
  11. Reddy, J.M.; Jumaboev, K.; Bobojonov, I.; Carli, C.; Eshmuratov, D. Yield and water use efficiency of potato varieties under different soil-moisture stress conditions in the Fergana Valley of Central Asia. Agroecol. Sustain. Food Syst. 2016, 40, 407–431. [Google Scholar] [CrossRef]
  12. Rauf, S.; Al-Khayri, J.M.; Zaharieva, M.; Monneveux, P.; Khalil, F. Breeding Strategies to Enhance Drought Tolerance in Crops. Adv. Plant Breed. Strateg. Agron. Abiotic Biot. Stress Trait. 2016, 2, 397–445. [Google Scholar] [CrossRef]
  13. Puértolas, J.; Ballester, C.; Elphinstone, E.D.; Dodd, I.C.; Ballester, C. Two potato (Solanum tuberosum) varieties differ in drought tolerance due to differences in root growth at depth. Funct. Plant Biol. 2014, 41, 1107–1118. [Google Scholar] [CrossRef] [PubMed] [Green Version]
  14. Lahlou, O.; Ledent, J.-F. Root mass and depth, stolons and roots formed on stolons in four cultivars of potato under water stress. Eur. J. Agron. 2005, 22, 159–173. [Google Scholar] [CrossRef]
  15. MacKerron, D.K.L.; Jefferies, R.A. The influence of early soil moisture stress on tuber numbers in potato. Potato Res. 1986, 29, 299–312. [Google Scholar] [CrossRef]
  16. Vos, J.; Haverkort, A.J. Water availability and potato crop performance. In Potato Biology and Biotechnology: Advances and Perspectives; Elsevier: Amsterdam, The Netherlands, 2007; pp. 333–351. [Google Scholar]
  17. Tourneux, C.; Devaux, A.; Camacho, R.M.; Mamani, P.; Ledent, J.-F. Original article Effect of water shortage on six potato genotypes in the highlands of Bolivia (II): Water relations, physiological parameters. Agronomie 2003, 23, 181–190. [Google Scholar] [CrossRef] [Green Version]
  18. Schittenhelm, S.; Sourell, H.; Löpmeier, F.-J. Drought resistance of potato cultivars with contrasting canopy architecture. Eur. J. Agron. 2006, 24, 193–202. [Google Scholar] [CrossRef]
  19. Cabello, R.; Monneveux, P.; Mendiburu, F.; Bonierbale, M. Comparison of yield based drought tolerance indices in improved varieties, genetic stocks and landraces of potato (Solanum tuberosum L.). Euphytica 2013, 193, 147–156. [Google Scholar] [CrossRef]
  20. Wang, X.; Cai, J.; Jiang, N.; Liu, F.; Dai, T.; Cao, W. Pre-anthesis high-temperature acclimation alleviates damage to the flag leaf caused by post-anthesis heat stress in wheat. J. Plant Physiol. 2011, 168, 585–593. [Google Scholar] [CrossRef]
  21. Rodríguez, P.L.; Sanjuanelo, C.D.; Ñústez, L.C.E.; Moreno-Fonseca, L.P. Growth and phenology of three Andean potato varieties (Solanum tuberosum L.) under water stress. Agron. Colomb. 2016, 34, 141. [Google Scholar] [CrossRef]
  22. Jensen, C.; Mogensen, V.; Mortensen, G.; Fieldsend, J.; Milford, G.; Andersen, M.N.; Thage, J. Seed glucosinolate, oil and protein contents of field-grown rape (Brassica napus L.) affected by soil drying and evaporative demand. Field Crop. Res. 1996, 47, 93–105. [Google Scholar] [CrossRef]
  23. Ali, M.; Jensen, C.R.; Mogensen, V.O.; Bahrun, A. Drought adaptation of fleld grown wheat in relation to soil physical conditions. Plant Soil 1999, 208, 149–159. [Google Scholar] [CrossRef]
  24. Rivera-Hernández, B.; Carrillo-Avila, E.; Obrador-Olán, J.J.; Juárez-López, J.F.; Aceves-Navarro, L.A.; García-López, E. Soil moisture tension and phosphate fertilization on yield components of A-7573 sweet corn (Zea mays L.) hybrid, in Campeche, Mexico. Agric. Water Manag. 2009, 96, 1285–1292. [Google Scholar] [CrossRef]
  25. Mould, R.D.; Rutherfoord, R.J. The effect of moisture stress during consecutive growth stages on tuber yield and quality of BP1 potatoes (Solanum tuberosum L.). Crop Prod. 1980, 9, 89–92. [Google Scholar] [CrossRef]
  26. Asch, F.; Bahrun, A.; Jensen, C.R. Root-shoot communication of field-grown maize drought-stressed at different rates as modified by atmospheric conditions. J. Plant Nutr. Soil Sci. 2009, 172, 678–687. [Google Scholar] [CrossRef]
  27. Stark, J.C.; Love, S.L.; King, B.A.; Marshall, J.M.; Bohl, W.H.; Salaiz, T. Potato Cultivar Response to Seasonal Drought Patterns. Am. J. Potato Res. 2013, 90, 207–216. [Google Scholar] [CrossRef]
  28. Haverkort, A.J.; Van De Waart, M.; Bodlaender, K.B.A. The effect of early drought stress on numbers of tubers and stolons of potato in controlled and field conditions. Potato Res. 1990, 33, 89–96. [Google Scholar] [CrossRef]
  29. Doorenbos, J.; Kassam, A.H. Yield response to water. FAO Irrig. Drain. Pap. 1979, 33. [Google Scholar]
  30. Van Loon, C.D. The effect of water stress on potato growth, development, and yield. Am. J. Potato Res. 1981, 58, 51–69. [Google Scholar] [CrossRef]
  31. Spitters, C.J.T.; Schapendonk, A.H.C.M. Evaluation of breeding strategies for drought tolerance in potato by means of crop growth simulation. Plant Soil 1990, 123, 193–203. [Google Scholar] [CrossRef]
  32. Muthoni, J.; Kabira, J. Potato Production under Drought Conditions: Identification of Adaptive Traits. Int. J. Hortic. 2016, 6. [Google Scholar] [CrossRef]
  33. Boguszewska-Mańkowska, D.; Zarzyńska, K.; Nosalewicz, A. Drought Differentially Affects Root System Size and Architecture of Potato Cultivars with Differing Drought Tolerance. Am. J. Potato Res. 2019, 97, 54–62. [Google Scholar] [CrossRef]
  34. Simunek, J.; Sejna, M.; van Genuchten, M.T. The Hydrus-1D Software Package for Simulating the Movement of Water, Heat, and Multiple Solutes in Variably Saturated Media, Version 4.17, HYDRUS Software Series 3; Department of Environmental Sciences, University of California Riverside: Riverside, CA, USA, 2018. [Google Scholar]
  35. Maestrini, B.; Matthijs, B.; Thomas, B.; Lambertus, A.P.L. Can We Use the Relationship Between Within-Field Elevation and NDVI as an Indicator of Drought-Stress? In Environmental Software Systems. Data Science in Action—13th IFIP WG 5.11 International Symposium. In Proceedings of the International Symposium on Environmental Software Systems, Wageningen, The Netherlands, 5–7 February 2020; pp. 122–131, ISBN 9783030398156F. [Google Scholar]
  36. Li, X.; Ramirez, D.A.; Qin, J.; Dormatey, R.; Bi, Z.; Sun, C.; Wang, H.; Bai, J. Water restriction scenarios and their effects on traits in potato with different degrees of drought tolerance. Sci. Hortic. 2019, 256, 108525. [Google Scholar] [CrossRef]
  37. Qin, J.; Bian, C.; Liu, J.; Zhang, J.; Jin, L. An efficient greenhouse method to screen potato genotypes for drought tolerance. Sci. Hortic. 2019, 253, 61–69. [Google Scholar] [CrossRef]
  38. Nouri, A.; Nezami, A.; Kafi, M.; Hassanpanah, D. Growth and yield response of potato genotypes to deficit irrigation. Int. J. Plant Prod. 2016, 10, 139–158. [Google Scholar] [CrossRef]
  39. Sprenger, H.; Rudack, K.; Schudoma, C.; Neumann, A.; Seddig, S.; Peters, R.; Zuther, E.; Kopka, J.; Hincha, D.K.; Walther, D.; et al. Assessment of drought tolerance and its potential yield penalty in potato. Funct. Plant Biol. 2015, 42, 655–667. [Google Scholar] [CrossRef]
  40. Jensen, C.R.; Mogensen, V.O.; Poulsen, H.-H.; Henson, I.E.; Aagot, S.; Hansen, E.; Ali, M.; Wollenweber, B. Soil water matric potential rather than water content determines drought responses in field-grown lupin (Lupinus angustifolius). Aust. J. Agric. Res. 1998, 25, 353–363. [Google Scholar] [CrossRef]
  41. Jensen, C.; Battilani, A.; Plauborg, F.; Psarras, G.; Chartzoulakis, K.; Janowiak, F.; Stikic, R.; Jovanovic, Z.; Li, G.; Qi, X.; et al. Deficit irrigation based on drought tolerance and root signalling in potatoes and tomatoes. Agric. Water Manag. 2010, 98, 403–413. [Google Scholar] [CrossRef]
  42. Ramirez, D.A.; Yactayo, W.; Gutierrez, R.; Mareš, V.; De Mendiburu, F.; Posadas, A.; Quiroz, R.A. Chlorophyll concentration in leaves is an indicator of potato tuber yield in water-shortage conditions. Sci. Hortic. 2014, 168, 202–209. [Google Scholar] [CrossRef]
  43. Ray, S.S.; Daş, G.; Singh, J.P.; Panigrahy, S. Evaluation of hyperspectral indices for LAI estimation and discrimination of potato crop under different irrigation treatments. Int. J. Remote Sens. 2006, 27, 5373–5387. [Google Scholar] [CrossRef]
Figure 1. Evolution of mean soil moisture by treatment in volume percentage for the four irrigation treatments (T1–T4) in loamy sand (Loam) and sandy soil (Sand). Measurements were taken in five-day intervals per genotype (G1–G5, Appendix B), treatment, and replication. Each data point represents a mean of 15 measurements of the average soil moisture from 10–40 cm depth. Error bars have been omitted for readability. Solid horizontal line: Irrigation target loam; broken horizontal line: Irrigation target sand.
Agronomy 10 01298 g001
Figure 2. Literature based sensitivity score for standardized development stages (0 = planting; 1 = physiological maturity) of potato. Development stages and durations adapted from Doorenbos and Kassamm (1979) [29] and Obidiegwu et al. (2015) [5].
Agronomy 10 01298 g002
Figure 3. Effects of reduced plant available soil moisture (PASM) on tuber yield of all genotypes under the four applied irrigation treatments for both soil types. Calibration genotypes were employed to develop the stress severity index; validation genotypes were used to apply and analyze the stress severity index. The percent of PASM values above 100 indicate irrigation over the irrigation target due to variations in the drip system.
Agronomy 10 01298 g003
Figure 4. Below ground phenology and soil water deficit in the percent of plant available soil moisture (PASM) of five potato clones grown on two soil types (loamy sand: Loam; sandy soil: Sand) under the three drought treatments. Treatment details are given in Section 2.3 and Table 4. Additional destructive samplings 10 or 20 days after the stage of physiological maturity (DAPM) were included where applicable.
Agronomy 10 01298 g004
Figure 5. Tuber fresh weight dynamics and below ground phenology of five potato clones grown on two soil types under four irrigation treatments. Treatment details are given Table 2. Additional destructive samplings 10 or 20 days after the stage of physiological maturity (DAPM) were included where applicable. Error bars = Standard error (n = 3).
Agronomy 10 01298 g005
Figure 6. Stress severity index and tuber yield reduction relative to fully irrigated yields for all genotypes (Appendix B), both soil types (Appendix A, and all irrigation treatments (details in Table 2). Linear regression on log transformed x values r2 = 0.65.
Agronomy 10 01298 g006
Table 1. Weather conditions during the experimental periods in 2013 and 2014 in St. Rita de Siguas, Arequipa, Peru. Data are shown as monthly averages of daily mean values. VPD: Vapor pressure deficit; PPFD: Photosynthetic photon flux density; SD: Standard deviation.
Month/YearMean Air TemperatureMean Relative Air HumidityMean VPDMean Daily PPFDMean Wind Speed
(°C) ± SD(%) ± SD(kPa) ± SD(mol m−2 s−1) ± SD(m s−1) ± SD
Jul ‘1317.0 ± 1.837.6 ± 9.91.36 ± 0.33833 ± 1090.88 ± 0.25
Aug ‘1315.7 ± 1.939.2 ± 14.81.25 ± 0.371005 ± 1280.75 ± 0.14
Sep ‘1317.3 ± 1.245.8 ± 9.41.24 ± 0.271189 ± 400.81 ± 0.21
Oct ‘1317.9 ± 1.340.2 ± 7.81.37 ± 0.181203 ± 1150.74 ± 0.13
Nov ‘1317.4 ± 1.748.1 ± 14.01.22 ± 0.371233 ± 591.03 ± 0.26
Aug ‘1418.4 ± 2.031.1 ± 11.31.63 ± 0.391058 ± 731.17 ± 0.24
Sep ‘1418.0 ± 1.943.3 ± 13.11.33 ± 0.391168 ± 831.23 ± 0.22
Oct ‘1419.0 ± 1.639.8 ± 11.41.49 ± 0.361275 ± 2371.55 ± 0.32
Nov ‘1417.9 ± 2.054.4 ± 14.31.11 ± 0.381309 ± 961.34 ± 0.34
Dec ‘1418.9 ± 1.053.3 ± 13.01.17 ± 0.321333 ± 601.23 ± 0.11
Table 2. Soil analyses and water relations for the two experimental fields. Sand: Sandy soil; Loam: Loamy sand; OM: Organic matter; BD: Bulk density; FC: Field capacity (pF 1.8); PW: Permanent wilting point (pF 4.2); PASM: Plant available soil moisture.
Soil TypeDepth (cm)pHSoil TextureBD g cm−3Soil Water
Sand (%)Clay (%)Silt (%)OM (%)FC (vol %)PW (vol %)PASM (mm)
Sand0–157.4 ± 0.2494.0 ± 3.464.4 ± 0.890.4 ± 0.890.9 ± 0.181.1520.85.063.2
15–307.5 ± 0.4196.0 ± 1.414.0 ± 1.410.0 ± 0.000.7 ± 0.13
Loam0–158.1 ± 0.1880.8 ± 1.7911.2 ± 1.798.0 ± 1.411.5 ± 0.491.1823.28.558.8
15–307.9 ± 0.1981.6 ± 1.6710.0 ± 1.418.4 ± 1.671.0 ± 0.25
Table 3. Water supply for irrigation treatments 1–4 (T1–T4) to individual plants during the experimental period.
Loamy SandSand
(L plant−1)
T115283
T24837
T37142
T48947
Table 4. Tuber yield, number of tubers per plant, above ground biomass, mean rooting depth, and maximum leaf area index for five genotypes subjected to four irrigation treatments on two contrasting soil types. Treatment 1 (T1) to Treatment 4 (T4), see Table 3; genotypes 1–5, see Appendix B.
GTMax. Tuber YieldTuber NumberAbove Ground BiomassMean Root LengthMax. Leaf Area Index
LoamSandLoamSandLoamSandLoamSandLoamSand
g pl−1SEg pl−1SESESEg pl−1SEg pl−1SEcmSEcmSEm2 m−2SEm2 m−2SE
111080 ± 93736 ± 8314 ± 0.515 ± 1.935 ± 0.729 ± 0.820 ± 2.013 ± 1.43.0 ± 0.12.1 ± 0.2
211024 ± 113689 ± 5527 ± 0.722 ± 2.177 ± 1.064 ± 2.019 ± 0.616 ± 0.24.0 ± 0.23.3 ± 0.2
31901 ± 601282 ± 6513 ± 1.118 ± 1.574 ± 5.025 ± 0.021 ± 0.211 ± 0.23.5 ± 0.12.2 ± 0.0
41876 ± 431124 ± 7723 ± 0.520 ± 0.747 ± 2.053 ± 2.017 ± 0.514 ± 0.93.7 ± 0.32.5 ± 0.2
51838 ± 1029472 ± 4223 ± 0.522 ± 1.483 ± 4.0101 ± 4.021 ± 0.222 ± 3.03.5 ± 0.33.0 ± 0.2
12287 ± 20141 ± 1215 ± 1.410 ± 2.310 ± 0.324 ± 1.810 ± 0.76 ± 0.02.3 ± 0.12.1 ± 0.1
22216 ± 23150 ± 218 ± 0.921 ± 2.619 ± 3.019 ± 1.011 ± 0.715 ± 0.72.4 ± 0.31.5 ± 0.1
32256 ± 35185 ± 1410 ± 0.012 ± 2.526 ± 2.012 ± 0.014 ± 0.76 ± 0.22.2 ± 0.11.4 ± 0.2
42240 ± 1270 ± 810 ± 0.95 ± 1.213 ± 2.016 ± 1.013 ± 0.79 ± 1.03.2 ± 0.32.1 ± 0.1
5253 ± 1144 ± 17 ± 0.52 ± 0.533 ± 1.019 ± 2.016 ± 0.813 ± 1.42.2 ± 0.21.7 ± 0.2
13535 ± 47222 ± 77 ± 1.24 ± 0.241 ± 0.215 ± 1.713 ± 1.22 ± 0.21.3 ± 0.10.6 ± 0.1
23538 ± 3101 ± 1617 ± 0.715 ± 1.724 ± 4.020 ± 1.013 ± 0.58 ± 1.72.4 ± 0.31.4 ± 0.3
33716 ± 77192 ± 4512 ± 1.915 ± 0.744 ± 2.018 ± 4.016 ± 2.22 ± 0.22.1 ± 0.11.6 ± 0.1
43347 ± 24138 ± 416 ± 1.27 ± 2.021 ± 2.011 ± 2.017 ± 0.32 ± 0.72.1 ± 0.30.7 ± 0.1
53156 ± 1433 ± 523 ± 1.66 ± 0.512 ± 0.017 ± 4.011 ± 1.211 ± 2.32.6 ± 0.01.4 ± 0.2
14855 ± 31504 ± 335 ± 0.88 ± 1.427 ± 1.918 ± 0.77 ± 0.55 ± 1.21.4 ± 0.10.8 ± 0.2
24768 ± 15366 ± 2121 ± 0.724 ± 1.246 ± 1.032 ± 7.016 ± 1.213 ± 0.72.4 ± 0.41.6 ± 0.1
34774 ± 5295 ± 308 ± 2.18 ± 1.924 ± 1.013 ± 2.012 ± 0.74 ± 1.21.6 ± 0.10.5 ± 0.2
44689 ± 37415 ± 813 ± 1.212 ± 0.523 ± 2.014 ± 2.015 ± 1.412 ± 1.61.9 ± 0.11.2 ± 0.2
54416 ± 5553 ± 322 ± 1.74 ± 0.756 ± 1.011 ± 2.013 ± 1.214 ± 1.22.6 ± 0.21.1 ± 0.3
Means
1901 ± 57a861 ± 42a20 ± 0.7a19 ± 1.5a63 ± 2.5a54 ± 1.8a20 ± 0.7a15 ± 1.1a3.5 ± 0.2a2.6 ± 0.2a
2210 ± 20d118 ± 11c10 ± 0.7c10 ± 1.8b20 ± 1.7c18 ± 1.2b13 ± 0.7bc10 ± 0.7b2.5 ± 0.2b1.8 ± 0.2b
3458 ± 33c137 ± 15bc15 ± 1.3b9 ± 1.0b28 ± 1.6b16 ± 2.5b14 ± 1.1c5 ± 1.0c2.1 ± 0.2b1.1 ± 0.2c
4700 ± 29b327 ± 19b14 ± 1.3bc11 ± 1.1b35 ± 1.4b18 ± 2.7b13 ± 1.0b10 ± 1.2a2.0 ± 0.2b1.0 ± 0.2c
LSD1761613.54.22.52.10.80.80.50.47
Different letters between lines denote that mean values are significantly different (p ≤ 0.05) by Tukey’s test.

