Article

Spatial Distribution of Available Trace Metals in Four Typical Mediterranean Soils: The Caia Irrigation Perimeter Case Study

by
José Telo da Gama
1,2,*,
Luis Loures
1,2,
António López-Piñeiro
3 and
José Rato Nunes
1,2
1
VALORIZA—Research Centre for Endogenous Resource Valorization, 7300-110 Portalegre, Portugal
2
Polytechnic Institute of Portalegre (IPP), 7300-110 Portalegre, Portugal
3
Área de Edafología y Química Agrícola, Facultad de Ciencias—IACYS, Universidad de Extremadura, Avda. de Elvas s/n, 06071 Badajoz, Spain
*
Author to whom correspondence should be addressed.
Agronomy 2021, 11(10), 2024; https://doi.org/10.3390/agronomy11102024
Submission received: 30 August 2021 / Revised: 27 September 2021 / Accepted: 4 October 2021 / Published: 9 October 2021

Abstract

:
There is a small sample of edaphic geochemistry studies over large geographic areas, especially studies that consider major reference soil groups (RSG) that evaluate both native concentrations of elements and anthropogenically contaminated soils in agricultural settings, considering the long-term effect of agricultural practices on landscape sustainability. In this study, four RSGs were analyzed for the available trace elements Ni, Cr, Cd, Pb, Cu, Mn, and Zn, including other edaphic properties from 2002 to 2012. The main objectives were to assess the range of concentrations of the selected elements in the four typical Mediterranean soils, Cambisols, Luvisols, Calcisols, and Fluvisols, with heavy anthropogenic input (HAI) and compare them to minimal anthropogenic input (MAI). For MAI, the background levels of Pb, Ni, Cd, and Cr were highest in Calcisols, differing from those of Cambisols, Luvisols, and Fluvisols (p < 0.01), Cu is highest both in Calcisols and Luvisols while Mn is higher in Cambisols and Fluvisols (p < 0.05). The background concentration of Zn was the same in all RSGs (p > 0.05). For HAI, the reference levels of Pb, Ni, Cd, Mn, and Cr were highest in the Calcisols, and Cu was high in all RSGs except Fluvisols, while Zn presented the lowest concentrations in the Luvisol RSG, with all these results considering a confidence interval of 95%. Predictive maps for the sampled elements, as well as the edaphic bioavailability, are provided. This environmental impact assessment suggests that the land use is departing from sustainable ecosystem service development and that territorial management practices, with conservation goals in mind, should be adopted.

1. Introduction

Cadmium (Cd) and chromium (Cr) are both toxic heavy metals, and although copper (Cu), lead (Pb), manganese (Mn), nickel (Ni), and zinc (Zn) are plant nutrients (i.e., cation micronutrients), when they are added in excess through organic amendments, inorganic fertilizers, sludges, etc., they can also be detrimental to crop growth [1,2,3]. According to Kumpiene et al. [2], excessive exposure to trace elements poses a permanent threat to ecosystem services and humans worldwide because of the ability of metals and semi-metals to cross the cell membranes of living organisms and human epithelia and their interference with cellular metabolism. The composition of heavy metals and semimetals of agricultural soils tends to be closely governed by the source material. According to authors such as Jebreen et al. [4] and Rambeau et al. [5], carbonate rocks are generally composed of three main minerals: calcite, with common constituents of Al, Cd, Co, Cr, Cu, Fe, Mg, Mn, Mo, Ni, Pb, Sr, V, and Zn; dolomite, with common constituents of Cd, Co, Fe, Mn, Pb, and Zn; and aragonite, with common constituents of Ba, Pb, Sr, and Zn. In general, it is accepted that determining the total content of heavy metals in a soil is not sufficient to understand their relative mobility and ecological availability as pollutants, nor is it a particularly useful tool to estimate potential risks, although it is useful to determine whether the concentration of a given element is either increasing or decreasing [6]. As a general rule, low total concentrations indicate that a soil has developed from an original material with a low total content of a given element, or that it has been depleted during the processes of edaphogenesis and that it is thus relatively free of contamination. According to Alloway [6], the most important factor in determining the toxicity or deficiency of trace elements and heavy metals is the amount available in the soil for crops. This amount depends on the total content of the element, the soil texture, the adsorption capacity of the soil, and physicochemical factors such as pH and redox potential, which control the balance between the adsorbed fractions and those of the soil solution, presenting the concept of ‘critical load’, which represents the maximum concentration of heavy metals semi-metals in soils and the environment that can be maintained without harmful effects on them; thus, metal toxicity to biological life, including human life, depends not only on their total concentrations but also on their mobility and relationship with other components of the ecosystem, with their bioavailability (i.e., the accessibility of a chemical element to be absorbed by crops) being the most important parameter to analyze [7,8,9]. It is necessary to obtain sufficient samples from uncontaminated locations in the study area to be able to determine whether the local background level for each metal or semimetal provides a basis for comparison. A study by Nunes et al. [10] determined the background levels in 2002 in the study area, but with an assumption that could lead to error that the bioavailability of metals and semimetals was identical to the availability of the elements measured in the laboratory at a pH of 7.3 (Cd = 0.240 ± 0.230 mg kg−1, Cr = 0.850 ± 0.790 mg kg−1, Cu = 1.23 ± 1.15 mg kg−1, Ni = 1.95 ± 1.30 mg kg−1, Pb = 3.16 ± 2.33 mg kg−1, and Zn = 0.640 ± 0.580 mg kg−1). In this study, the soil organic matter (SOM) values were positively correlated with the content of available heavy metals, which reflects their affinity for this constituent [11,12,13,14]. All concentrations of available heavy metals were positively correlated with pH, which the authors did not expect since most of the literature reports that an increase in pH leads to a decrease in heavy metal content [6,15]. Another study by Afifi et al. [16] was performed in the Mediterranean basin in El-Mansoura, Nile Delta, Egypt in a clay soil with pH = 7.87, EC = 4.22 dS m−1, SOM = 0.65%, and content of CaCO3 = 1.18% (in the soil surface horizon) where the cultivation of sugar beet (Beta vulgaris L.) was implemented between 2008 and 2009 under two treatments (T1: good quality water from the Nile River; T2: wastewater with secondary treatment); by analyzing some physical and chemical properties of the soil, it was found that after 2 years of irrigation, regardless of the water source used, the values of Fe, Mn, Zn, Cu, Cd, Pb, Ni, Cr, Co, N, P, and K increased significantly by 28, 60, 48, 6, 110, 88, 52, 64, 58, 12, 30, and 13%, respectively, considering the average of both treatments. This study concluded that intensification through irrigation led to an increase in the elements studied in the surface layer of the soil, and to avoid the accumulation of edaphic heavy metals, it was recommended to use additional processes, such as the incorporation of plant waste or organic matter into the soil.
In the Mediterranean basin, some field studies on metals and heavy metals have been conducted [15,17,18,19,20], but mid- to long-term experiments are needed for better predictions of future metal accumulation and soil environment interactions that are independent of new approaches, such as sensing techniques through aerial monitoring [21]. In this paper, we assess a range of concentrations of selected elements and discuss their critical load risk value in four typical Mediterranean soils—Cambisols, Luvisols, Calcisols, and Fluvisols—with heavy anthropogenic input (HAI) through agricultural intensification, comparing them to a minimal anthropogenic input (MAI) and considering the distinct bioavailability of each RSG in the Mediterranean Campo Maior and Elvas District, Portugal.

2. Materials and Methods

2.1. Study Area and Sampling

The study area is located in the NUTS II Alentejo region between the townships of Campo Maior and Elvas, Portugal, in the Mediterranean basin region, as described in Telo da Gama et al. [22]. The study area includes the 7240 ha of the Caia irrigation perimeter and surrounding areas. This Mediterranean region is characterized by hot dry summers and cool wet winters, where the average annual rainfall in the area (climate normals 1991–2020) is approximately 457.4 mm, most of which coincides with the coolest temperatures from October to March. The maximum average monthly temperature occurs in August (34.9 °C) and the minimum occurs in January (4.5 °C). The current climatic classification systems state that the climate is Csa according to Koppen and DB2db4—mesothermal semiarid climate with little or no excess water in the winter and very low thermal efficiency in the summer—according to Thornthwaite.
The geology is heterogeneous but mainly consists of quaternary conglomerates, Palaeogene sandstones, Neoproterozoic phyllites, Devonian gabbros, Carboniferous granites, and Cambrian limestones (Figure 1a). The soils were classified according to the World Reference Base (WRB) of the FAO Soil Resource [23], and there are four main first-level reference soil groups (RSG) in the study area: Fluvisols, Luvisols, Calcisols, and Cambisols. The most important crops are olive (Olea europaea L.) (35%), maize (Zea mays L.) (20%), tomato (Lycopersicon esculentum Mill.) (15%), and garlic (Allium sativum L.) (15%). The irrigation water available in the perimeter is classified by FAO as C1S1 [22], meaning that it is of very good quality with low salinity and sodicity. This classification has remained over the years.
A total area of 15,030 ha was studied, where 1428 topsoil samples were collected in 2002 and another 1451 were collected in 2012, both sampled universes were georeferenced. For each sampling unit, ten soil subsamples were collected with a stainless-steel auger probe at a depth of 20 cm. The sampling points were selected to cover some of the existing variability in the sample area. The ten soil samples were carefully mixed into a single composite sample that, once properly cataloged and labeled, was sent to the laboratory. Subsequently, in the laboratory, the sample was air-dried and then sieved through a 2 mm stainless steel rectangular mesh sieve. After this phase, the corresponding analyses were carried out. Figure 1b reveals the sampling map for both periods. Please refer to Loures et al. [24] and Telo da Gama et al. [22] for more details on the study area.

2.2. Analytical Methods

The chemical soil analyses were determined by the method described by Lindsay and Norvell [25]: extraction with DTPA + CaCl2 + triethanolamine and quantification by atomic absorption spectrophotometry via flame atomization with a Perkin Elmer Analyzer A300 apparatus, (PerkinElmer, Waltham, MA, USA) [26,27,28].

2.3. Statistical Analysis

Statistical analyses were performed using the software package SPSS (v25), with which tests of normality (Shapiro–Wilk) [29,30]; inspection of kurtosis, skewness, and standard errors [31,32,33]; and visual inspection of the histograms, normal Q-Q plots, and box plots were performed in the 2002 and 2012 sample data in order to assess if they were normally distributed. Tests for homogeneity of variance (Levene’s) [34,35] were also performed in this subset in order to assess the homoscedasticity/heteroscedasticity. In the 2002 and 2012 sample data, for all normally distributed data with homogeneity of variance, we performed independent sample t-tests, and we applied the Central Limit Theorem when we had more than 30 samples per subgroup in our non-normally distributed data with homogeneity of variances. Data that showed a non-normal distribution and with no homogeneity of variance were directly analyzed by mean rank (MR) through the Mann–Whitney U Test (U) or the Kruskal–Wallis H test (H). Given the nature of the studied heavy metals, it is pertinent to define the background values of the element (i.e., the median in the minimal anthropogenic input (MAI) or rainfed soils) so that they can be compared with the reference values (i.e., the 95th percentile, which represents the heavy anthropogenic input (HAI) or the maximum concentration of the element). This procedure coincides with that used by most of the authors who have studied the concentration of heavy metals in soils, such as Ferreira [36], Harmens et al. [37], Afifi et al. [16], Alloway [6], Tóth et al. [3], and Kumpiene et al. [2]. The mean values of the elements were also analyzed in order to obtain their trends and the respective predictive maps. All null hypotheses were rejected for p < 0.05. Geographic information system analyses were performed using the ArcGIS v10.5 software package and the predictive maps created with an ordinary kriging interpolation, which was adjusted for a logarithmic factor equation and, when available, aided by ancillary variables [19,38,39,40,41,42,43,44,45]. Non-predictive maps were created with the software package QGIS 2.18.27 ‘Las Palmas’ [46].

3. Results

3.1. Heavy Metals

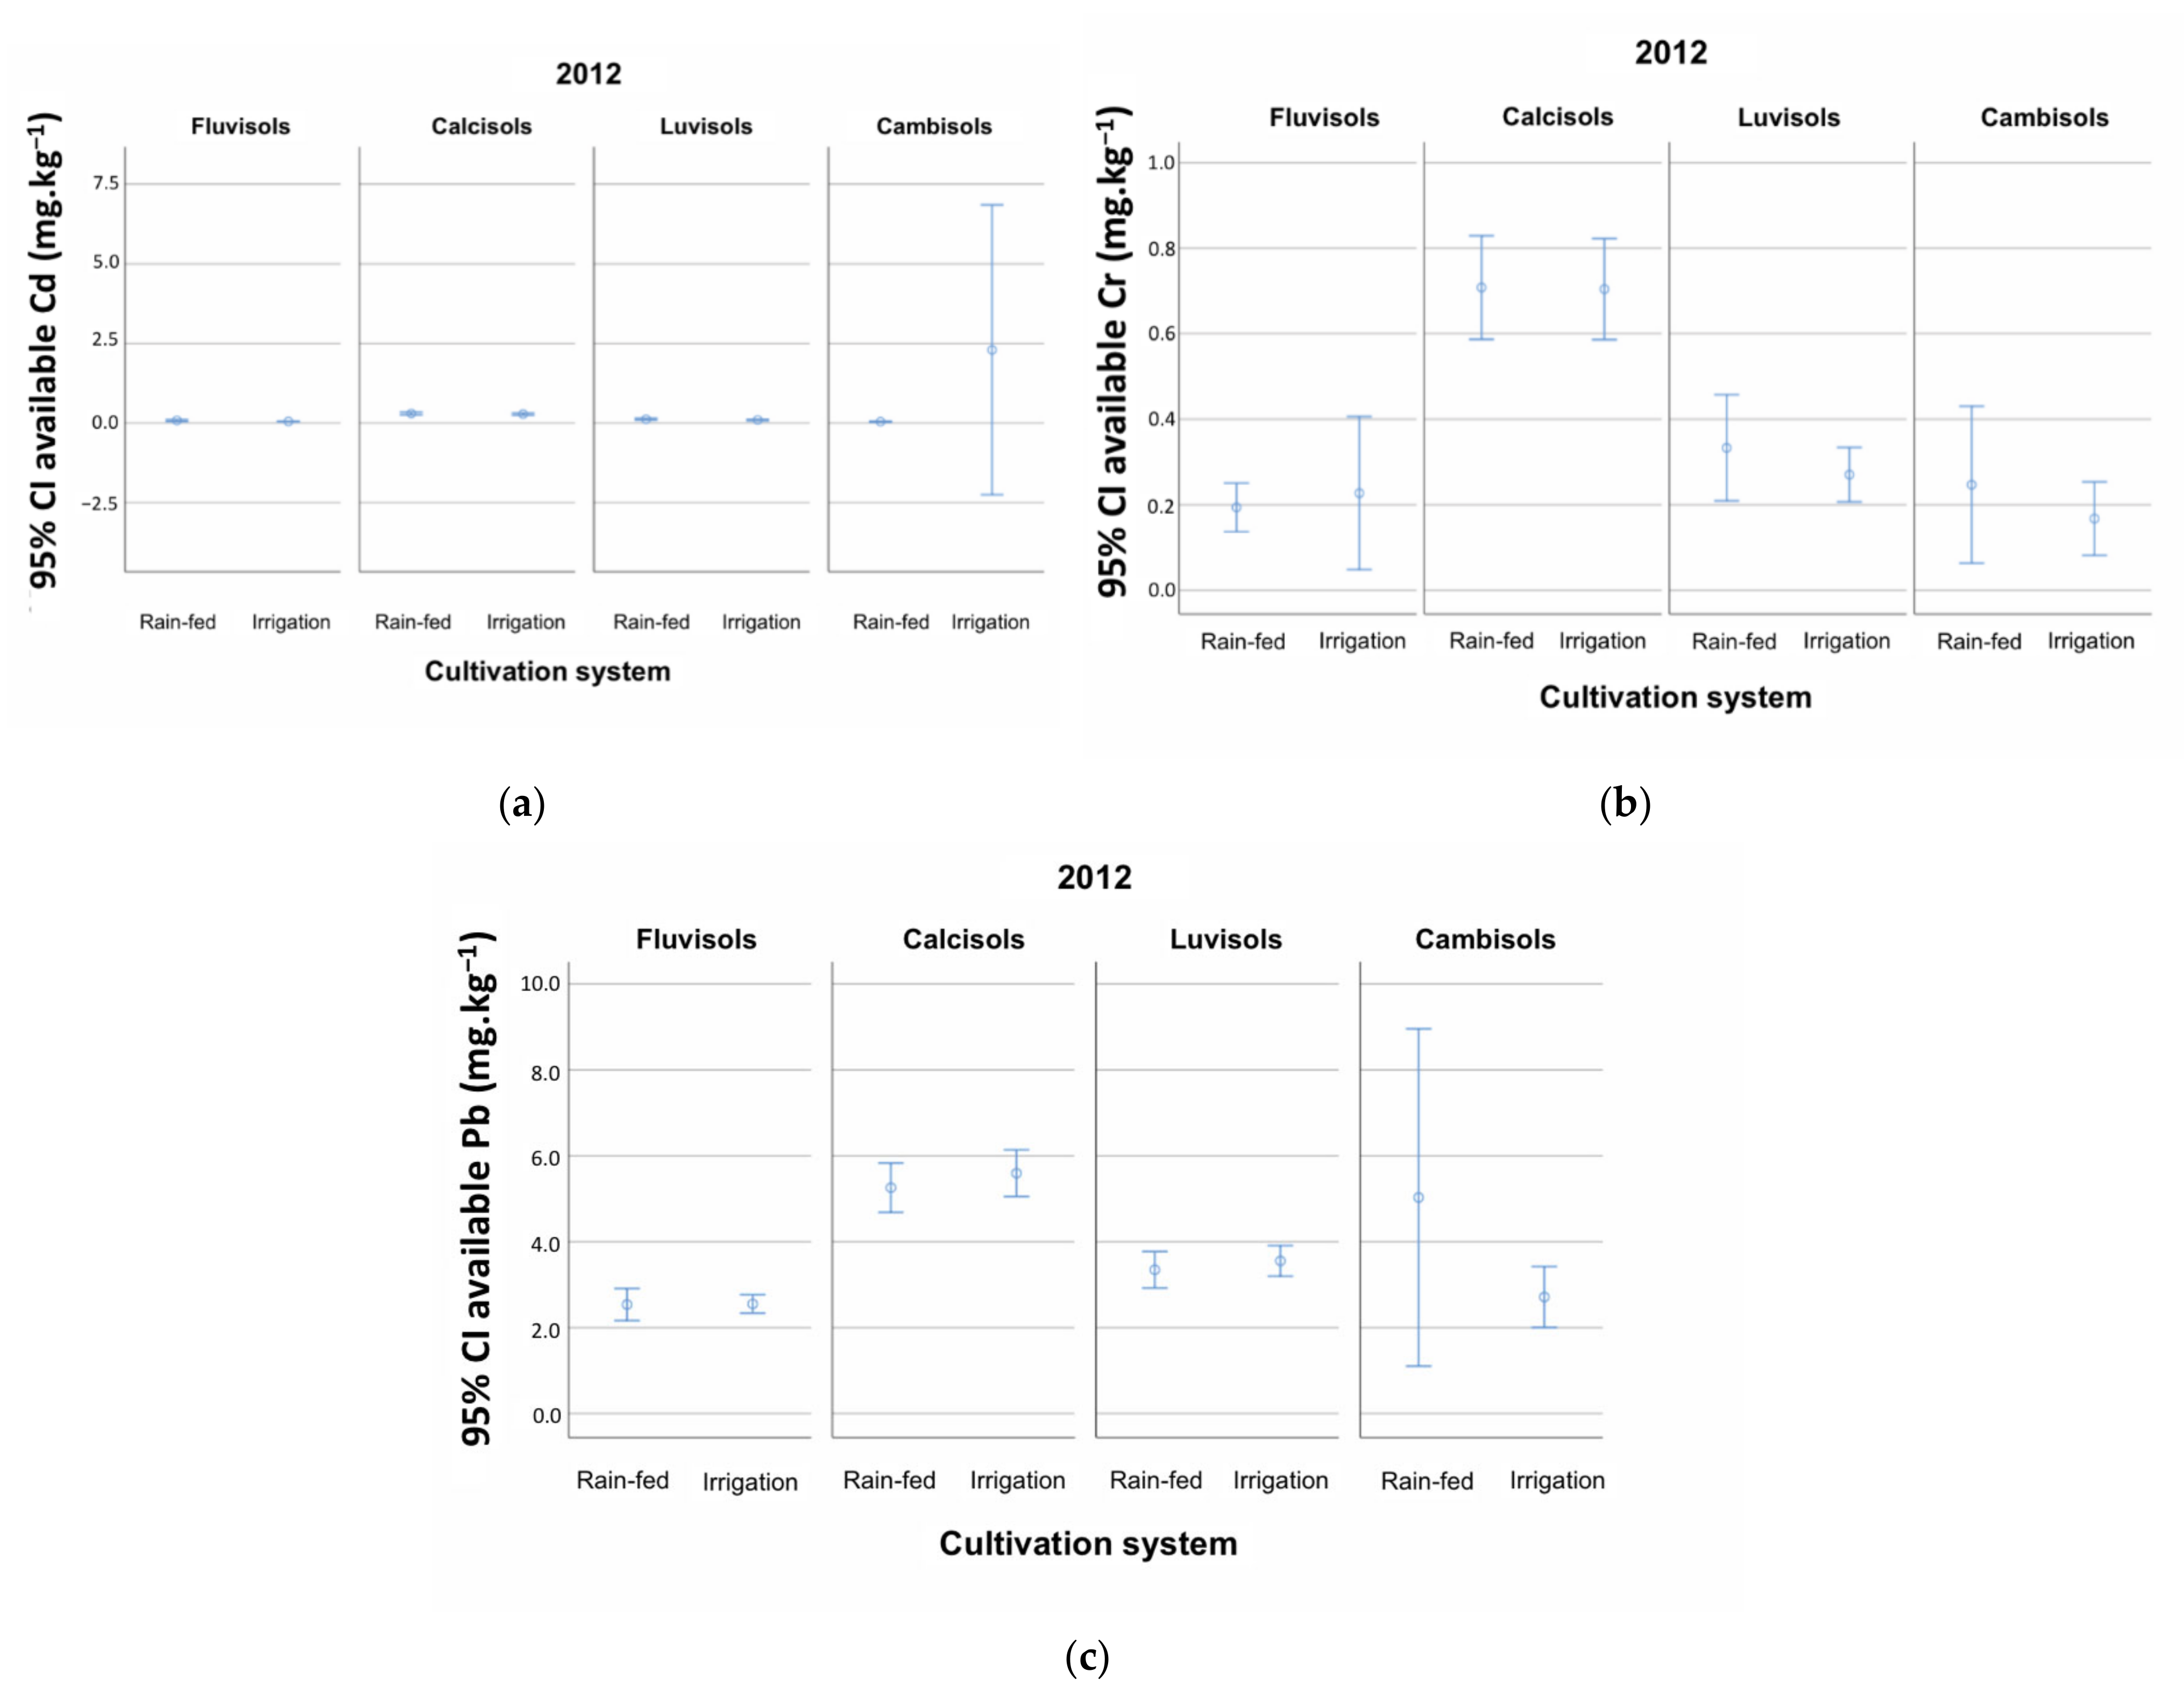
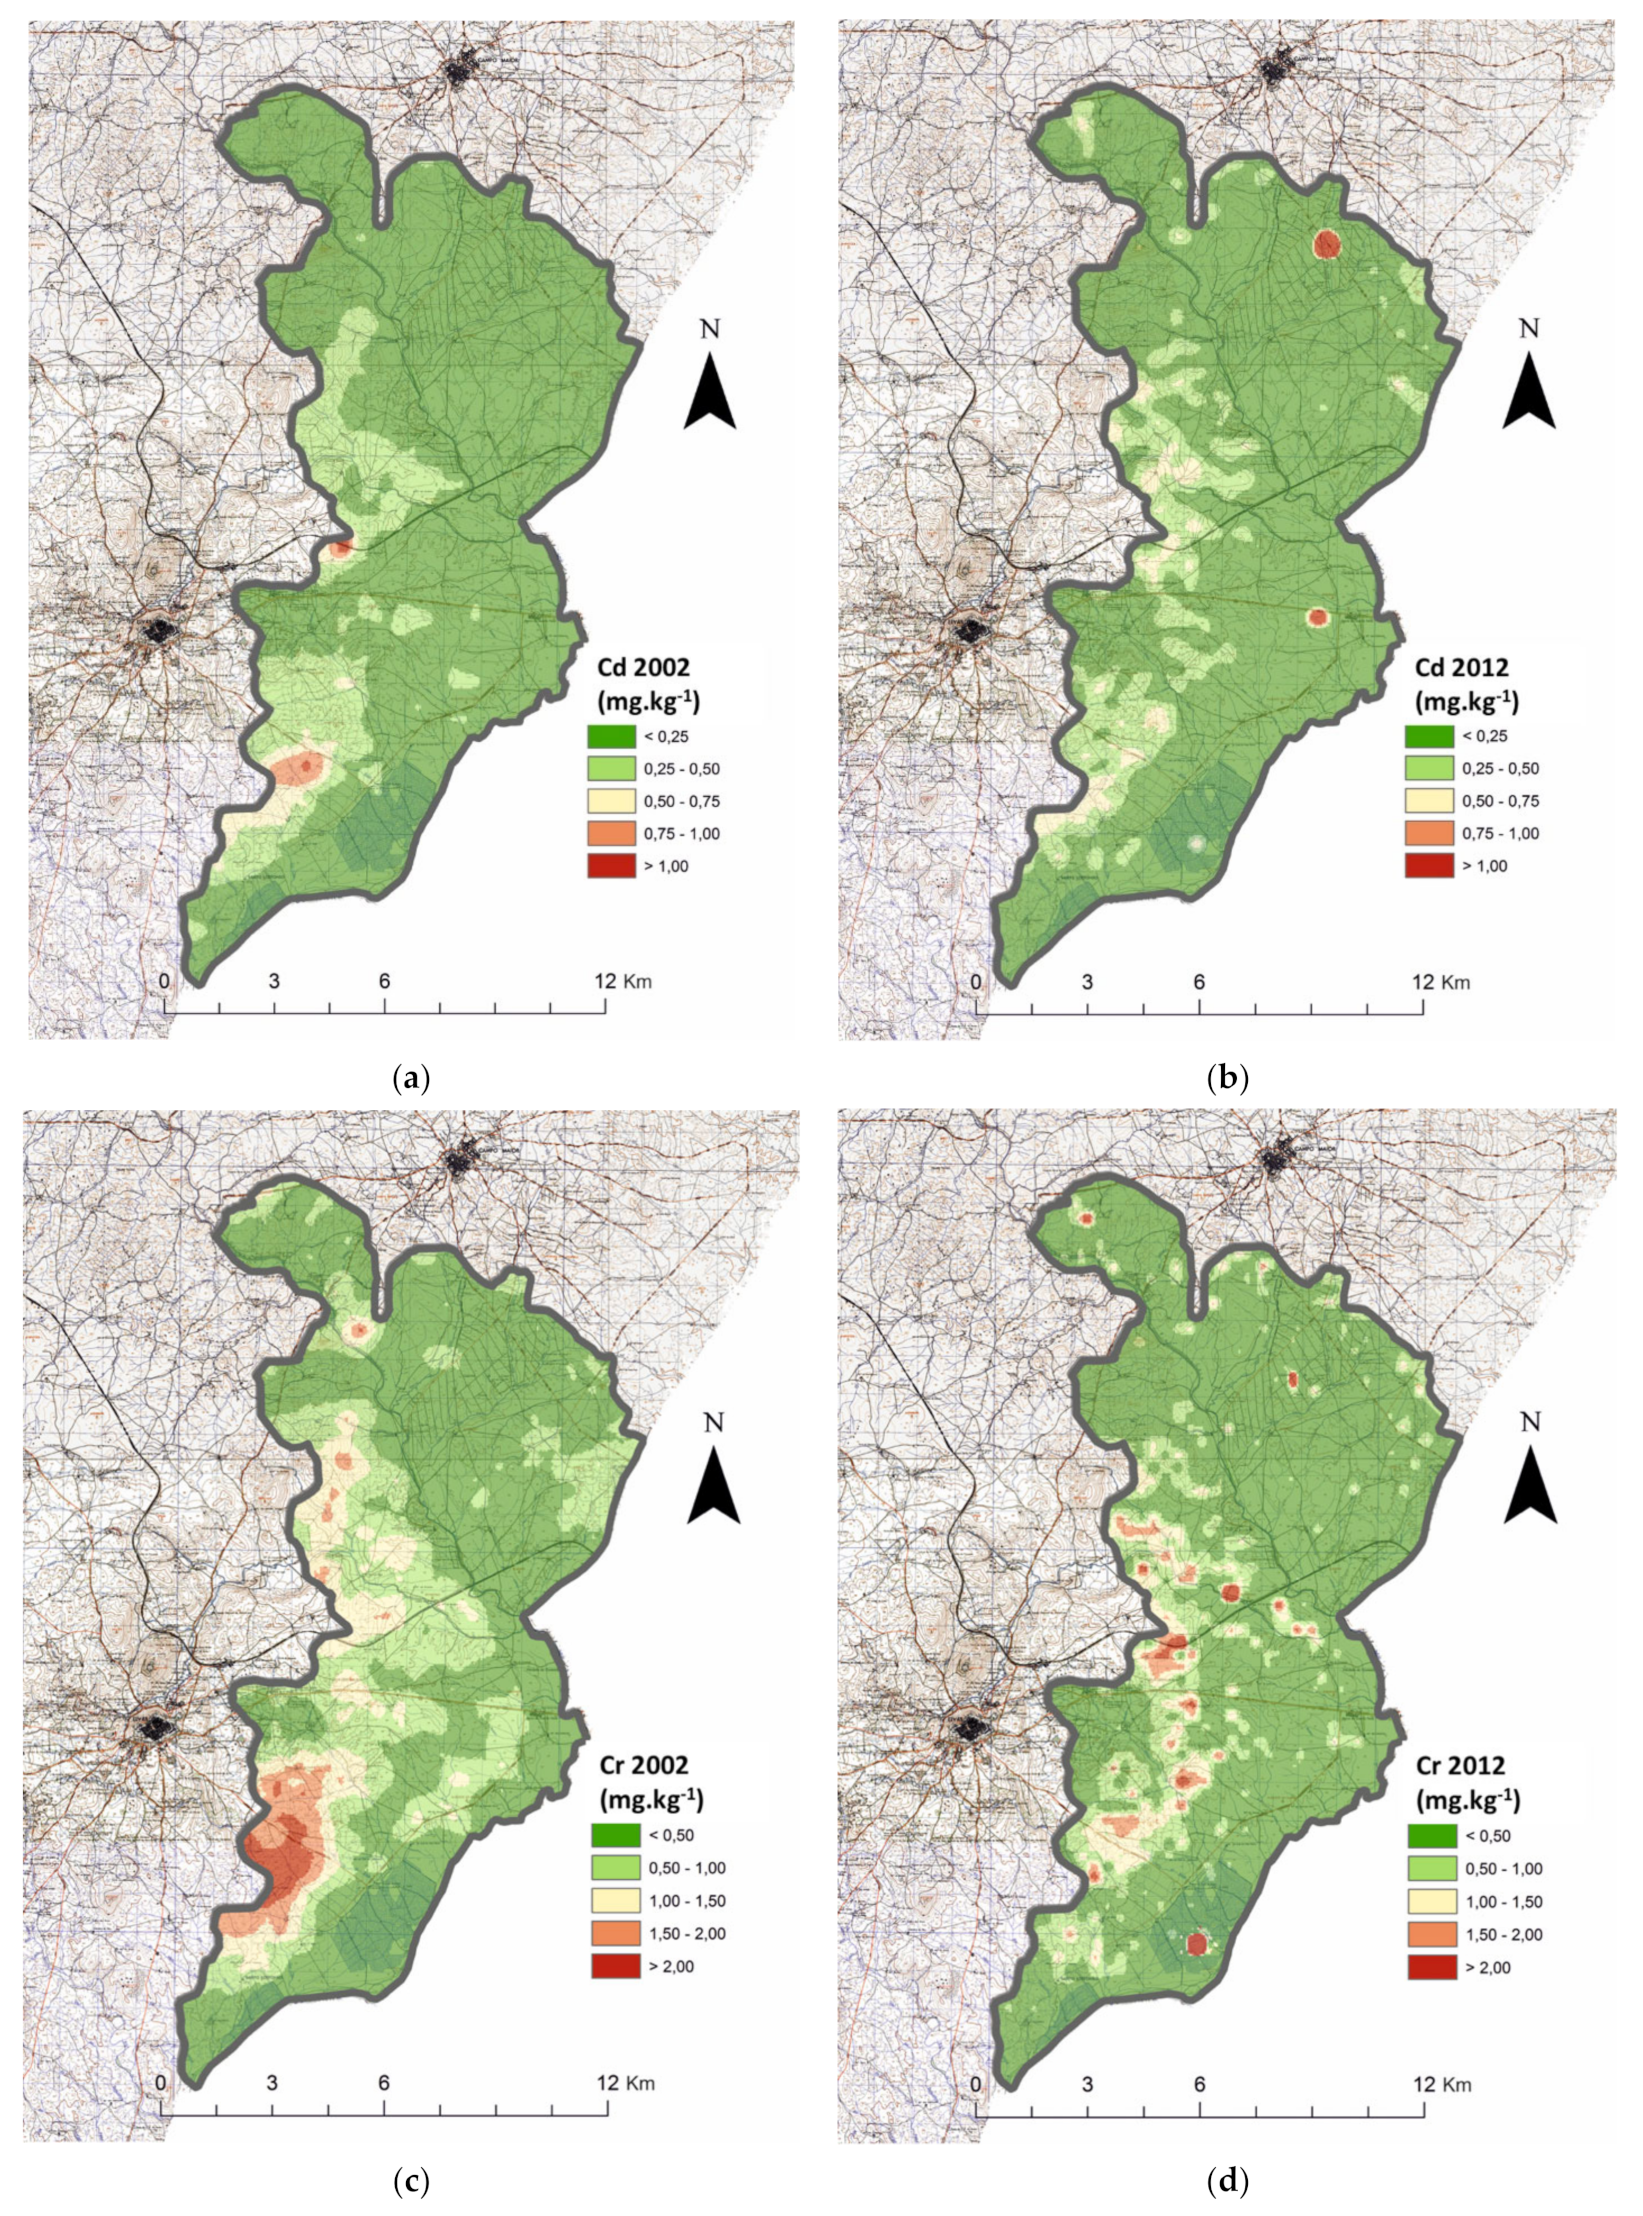
The average available Cd content remained constant in the study area (p > 0.05), but we registered a significant decrease of 69% (p < 0.01) in the available Cd background values (MAI) in the same period and maintenance of the reference values (HAI) circa 0.500 mg kg−1 (Table 1a). The analysis of Table 1b reveals that the available Cd MAIs for Fluvisols, Luvisols, and Cambisols were not significantly different (p > 0.05; results obtained through pairwise comparisons), with very low edaphic concentrations of the parameter even though the HAI for Cambisols appeared very high. Calcisols were the RSG presenting the highest concentration of MAI available Cd, and its values were significantly different (p < 0.01) from the other RSGs. The HAI for all RSGs except for the aforementioned Cambisols were all very low (Table 1b, Figure 2a). From the observation of Table 1c, we can deduce that there were no significant differences (p > 0.05) between the average concentrations of this metal in the soils subjected to a rainfed or an irrigated agricultural system. An analysis of the mean concentrations by RSG (Table 1d) also revealed that there were no significant differences (p > 0.05) in any of the RSGs when rainfed and irrigated systems were compared and that the element concentration was higher in Calcisols and lower in Fluvisols (p < 0.01; test performed by pairwise comparisons). Referring to Figure 3a,b, we confirmed that in rainfed areas, the available Cd accumulated in the range of 0.000–0.750 mg kg−1, while in irrigated areas, it was relatively stable at concentrations lower than 0.500 mg kg−1, although it was observed that two locations were present with values greater than 1.00 mg kg−1.
From the beginning of this study in 2002 to 2012, we registered an overall edaphic decrease of 49% (p < 0.01) in the average concentrations of available Cr (Table 1a). This overall decrease was registered in both the background values (MAI; p < 0.01) and reference values (HAI), for which the maximum concentrations decreased by 16% (Table 1a). The analysis of Table 1b reveals that there were no significant differences between the MAI values of Fluvisols, Luvisols, or Cambisols (p > 0.05), with only Calcisols presenting a statistically significantly greater concentration of the element (p < 0.01; test performed by pairwise comparisons). The HAI values were very similar between RSGs, for which the Calcisols also presented the higher concentrations (Figure 2b). From the observation of Table 1c, we can deduce that there are no statistically significant differences between the concentrations of this metal in the soils subjected to a rainfed or an irrigated agricultural system (p > 0.05). An analysis of the mean concentrations by reference soil groups (Table 1d; Figure 2b) also revealed that, when rainfed and irrigated systems were compared, there were no significant differences in any of the RSGs (p > 0.05) and that the element concentration was higher in Calcisols and lower in Fluvisols and Cambisols (p < 0.01; test performed by pairwise comparisons). From the predictive maps (Figure 3c,d), it was confirmed that it is in the west of the study area where the available Cr content is higher. From Figure 3c,d, it was confirmed that in the rainfed and irrigated areas to the west of the study area, the available Cr content is increasing with time, and the concentrations are higher than those of the irrigated land in the east.
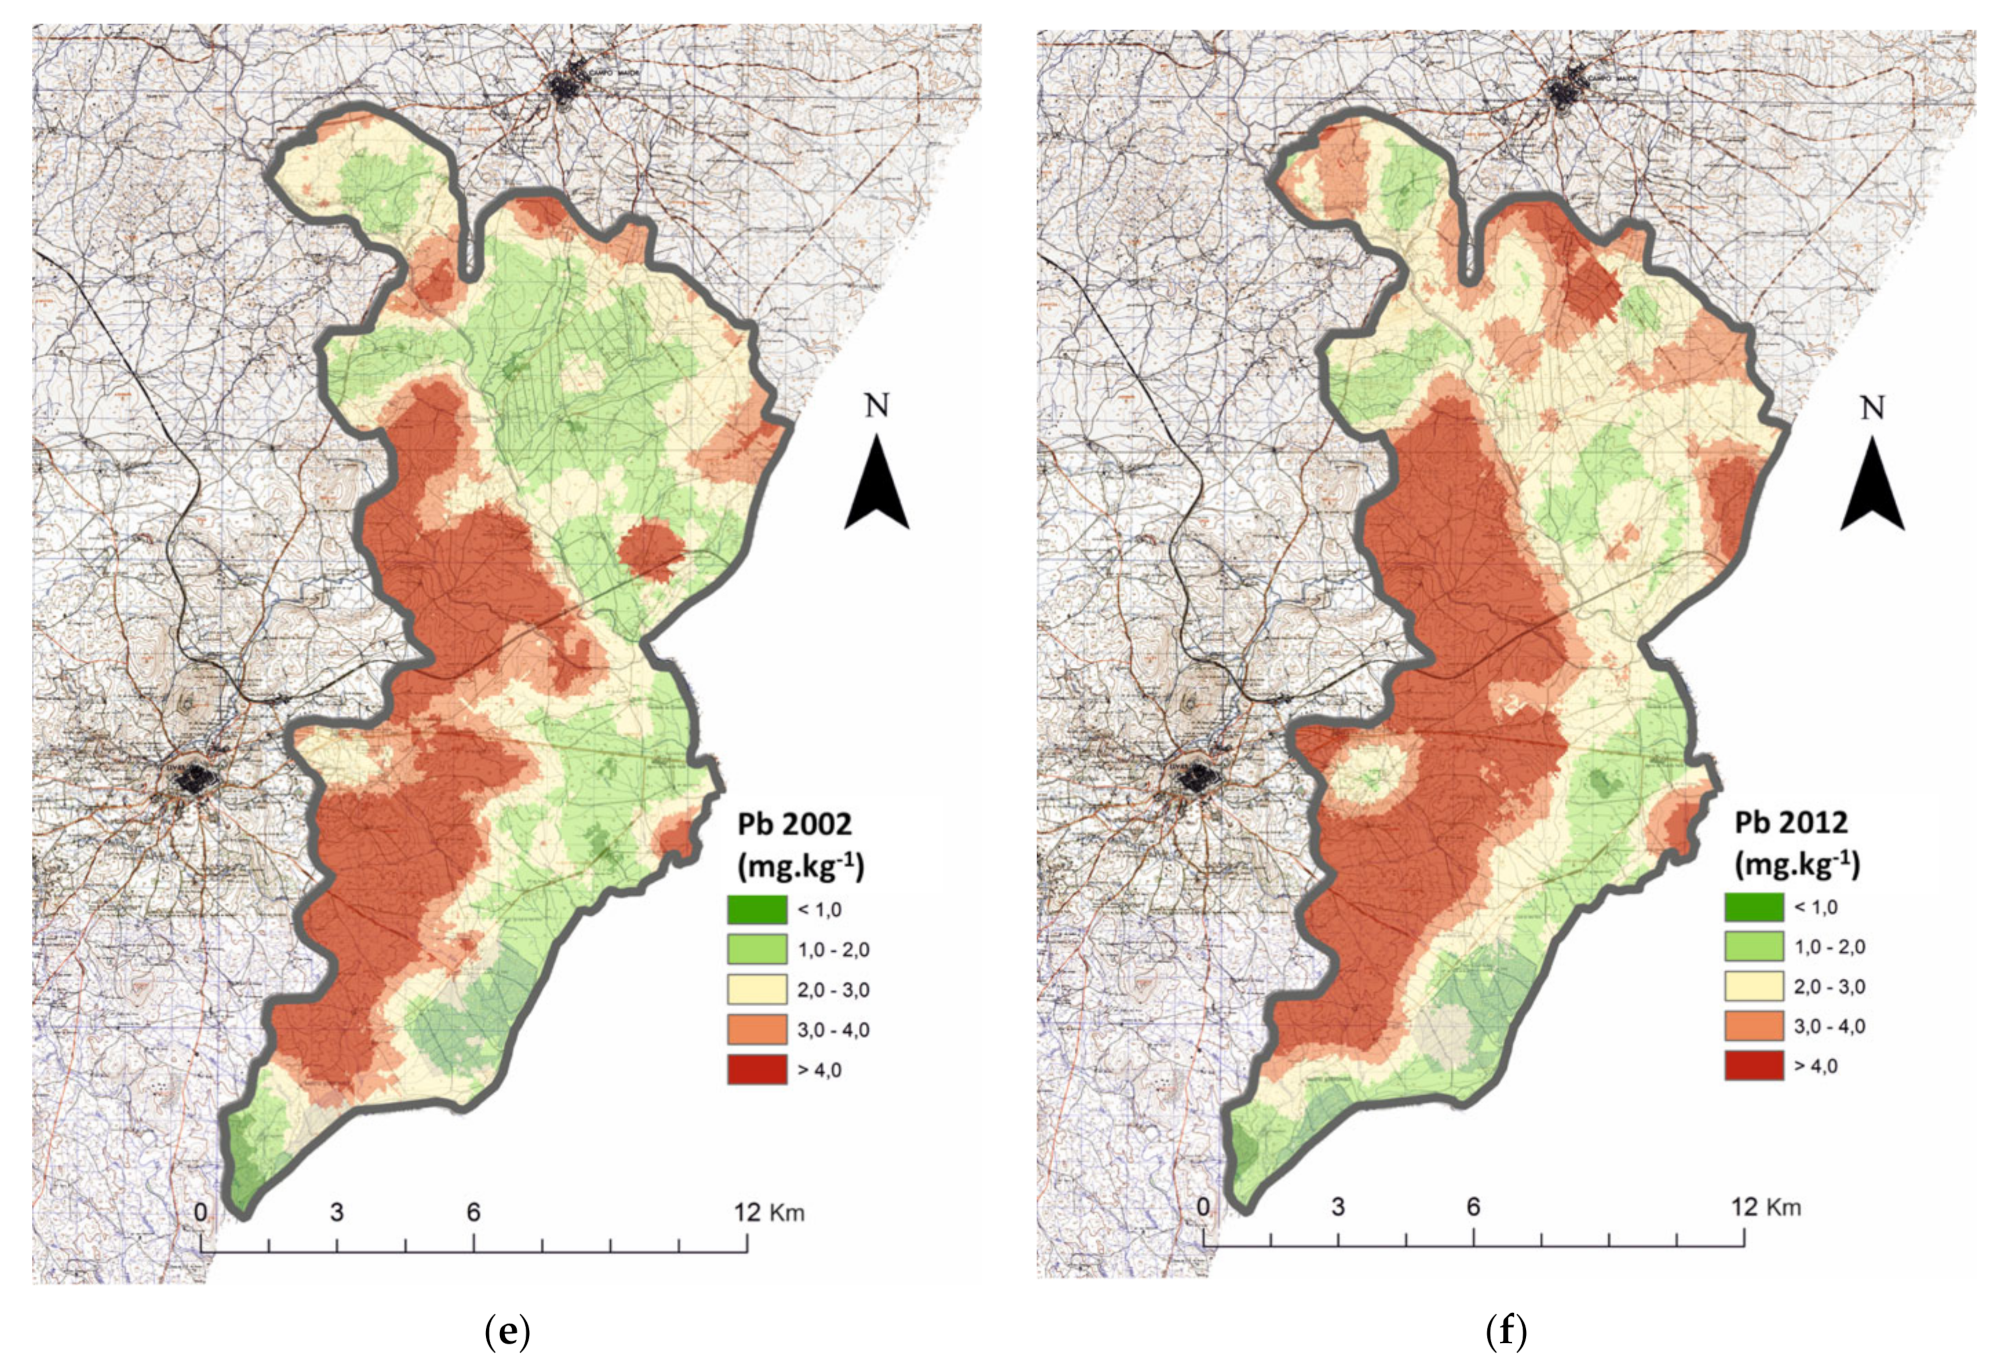
From the observation of Table 1a, it can be deduced that, from the beginning of this study to 2012 in the entire study area, the average concentrations of available Pb increased significantly by 14% (p < 0.05). This overall increase was registered in both the background values (MAI; p < 0.01) and reference values (HAI), where they increased by 6% and 20%, respectively. A more detailed analysis revealed that there were significant differences (p < 0.01) in the HAI concentrations between RSG pairs, except between Cambisols and Fluvisols and between Cambisols and Luvisols, (test performed by pairwise comparisons; Table 1b; Figure 2c), with Calcisols presenting the highest concentrations. The HAI concentrations were 258%, 186%, 117%, and 253% higher than the MAIs for Fluvisols, Luvisols, Calcisols, and Cambisols, respectively. A comparison of the mean Pb contents between the rainfed and irrigated cropping systems for the entire study area (Table 1c) revealed that the concentrations were similar for both cropping systems (p > 0.05), and analysis of Table 1d indicates that this was true for all studied RSGs. However, a study on the evolution of the element from 2002 to 2012 by the cultivation system revealed that in the irrigation system, the average values increased by 26.8% (i.e., the average Pb content increased from 2.415 (N = 675) to 3.063 (N = 784, U test: 219,261,000, p value = 0.000) mg.kg−1 from 2002 to 2012), while in the rainfed system, they remained stable (i.e., 3.03 (N = 620), to 3.11 (N = 513, T-test (1131): −0.976, p value = 0.329) mg.kg−1 from 2002 to 2012). Similar to Cr, the element concentration was higher in Calcisols and lower in Fluvisols and Cambisols (p < 0.01; test performed by pairwise comparisons). Figure 3e,f confirms that the increase in available Pb levels in the study area was more pronounced in the areas with an edaphic pH of >8.0, with this effect occurring in rainfed and irrigated areas alike.

3.2. Cation Micronutrients

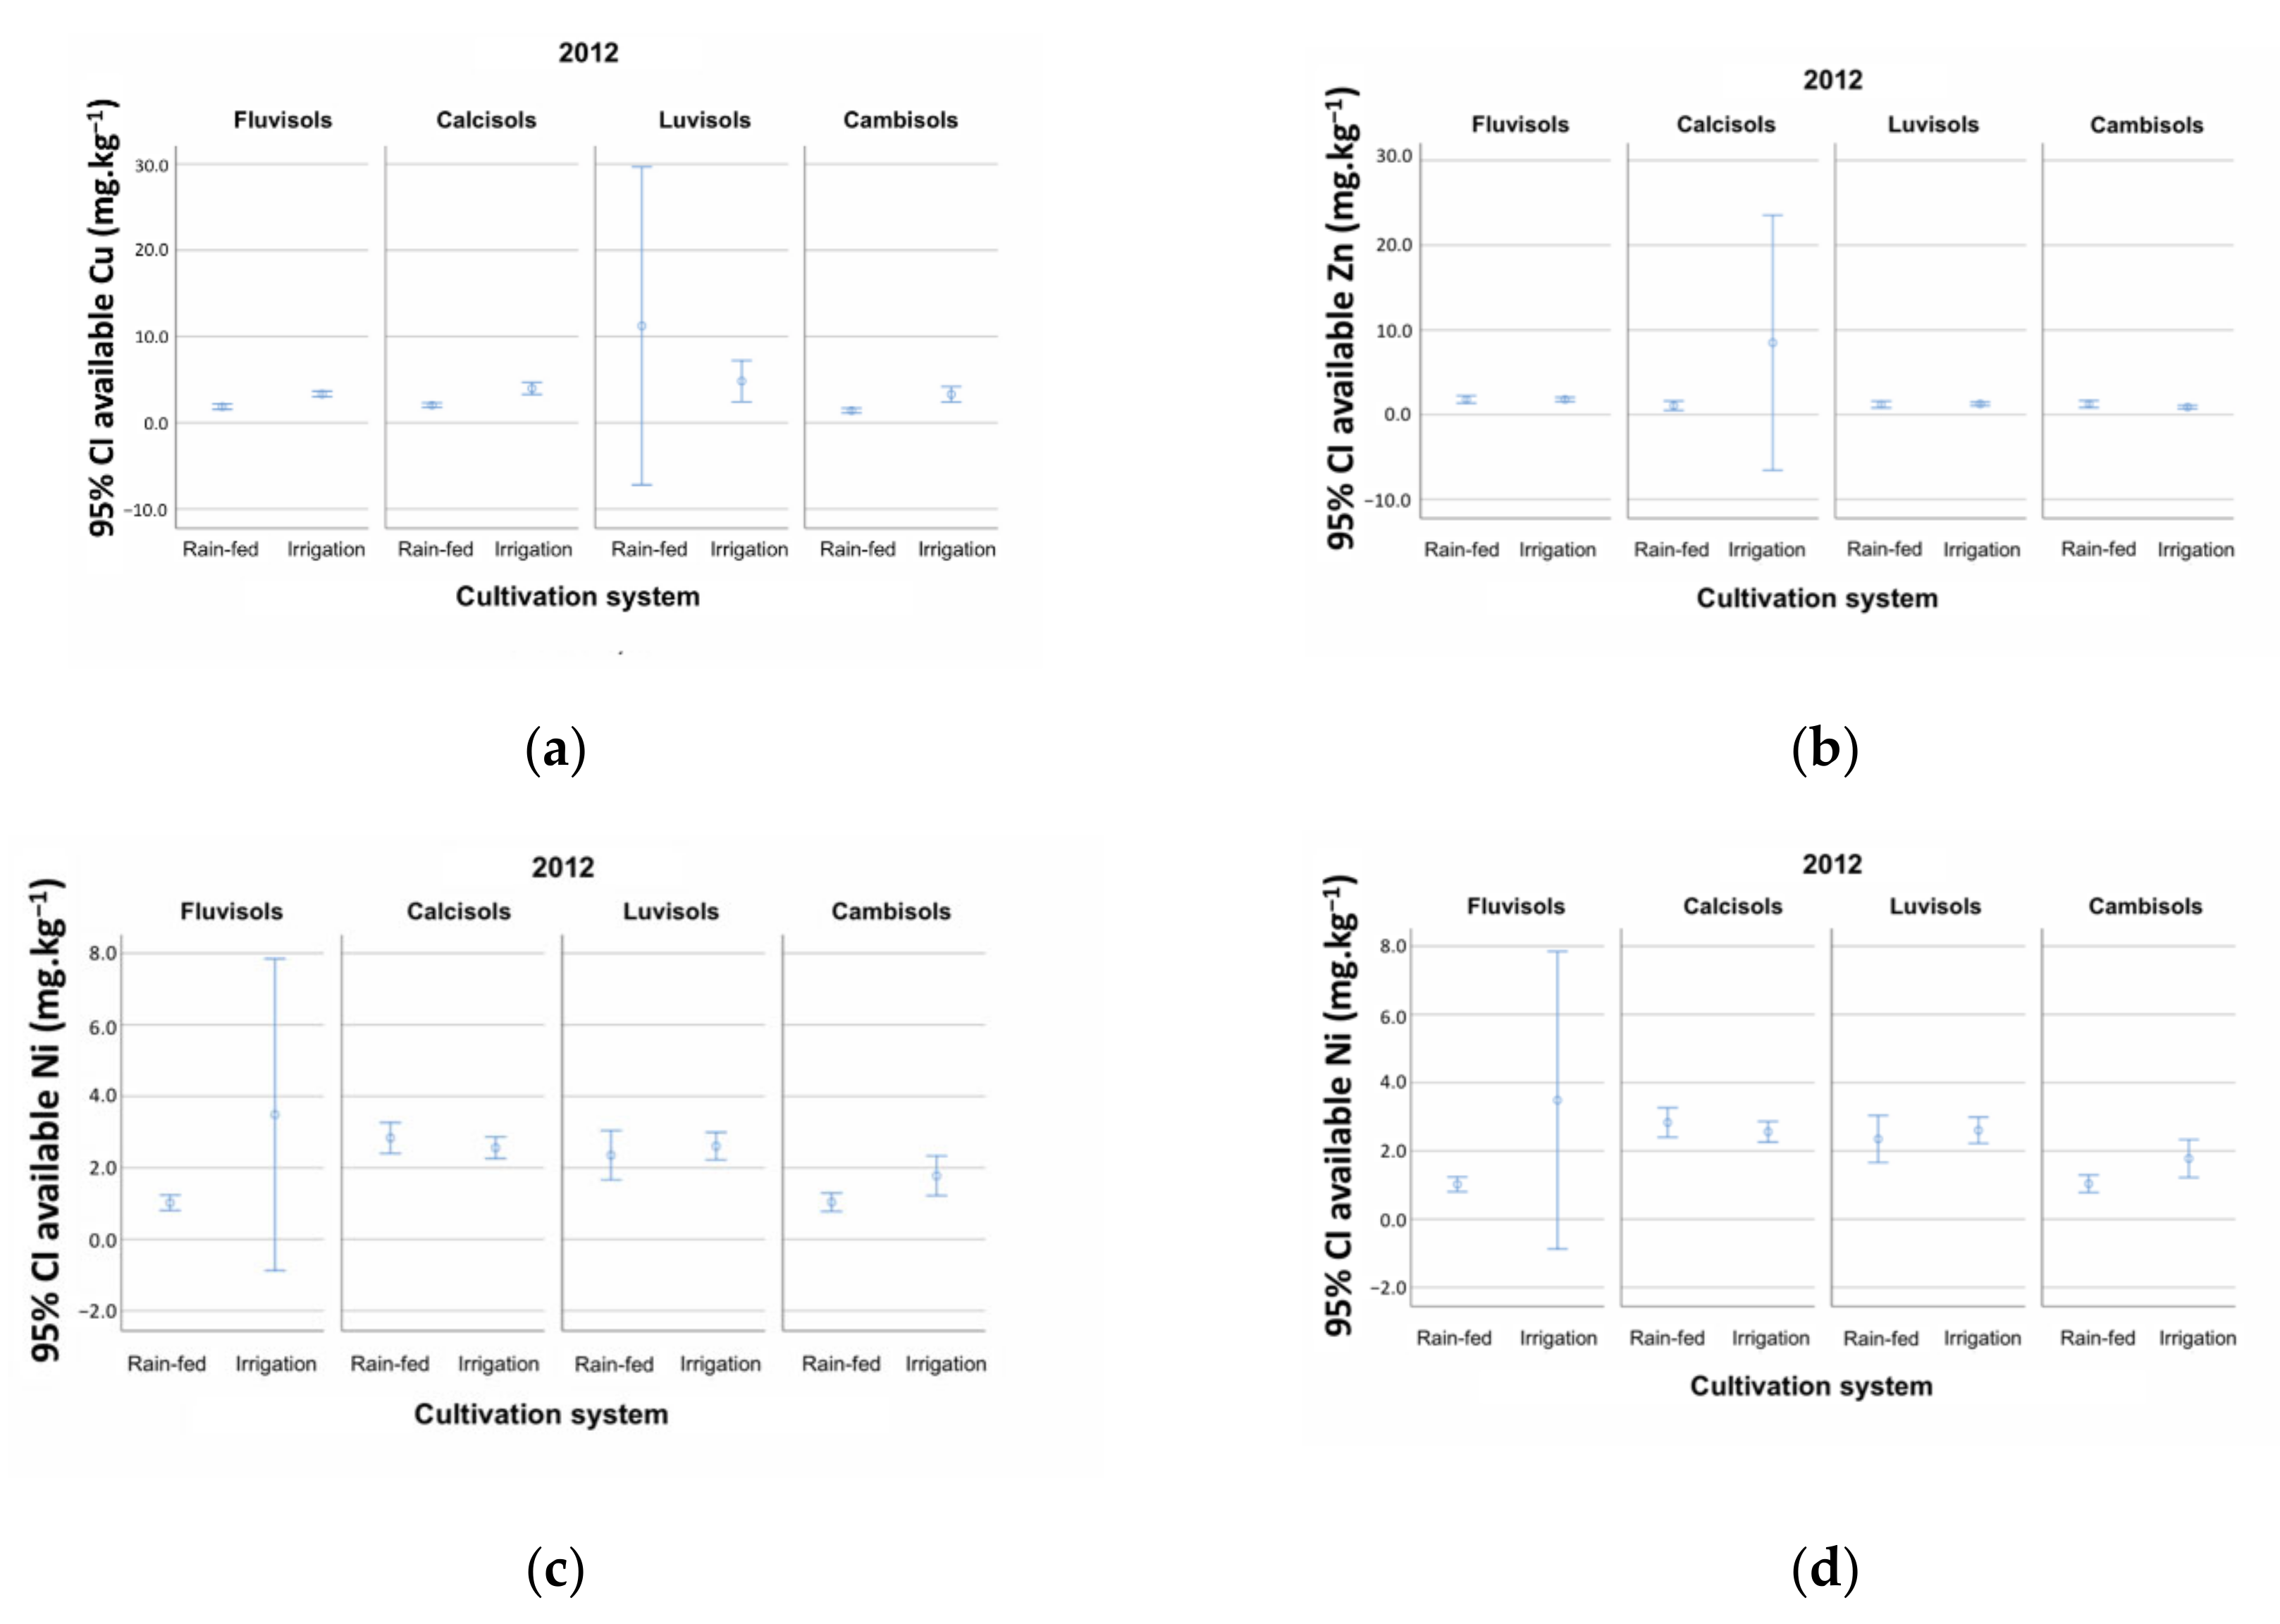
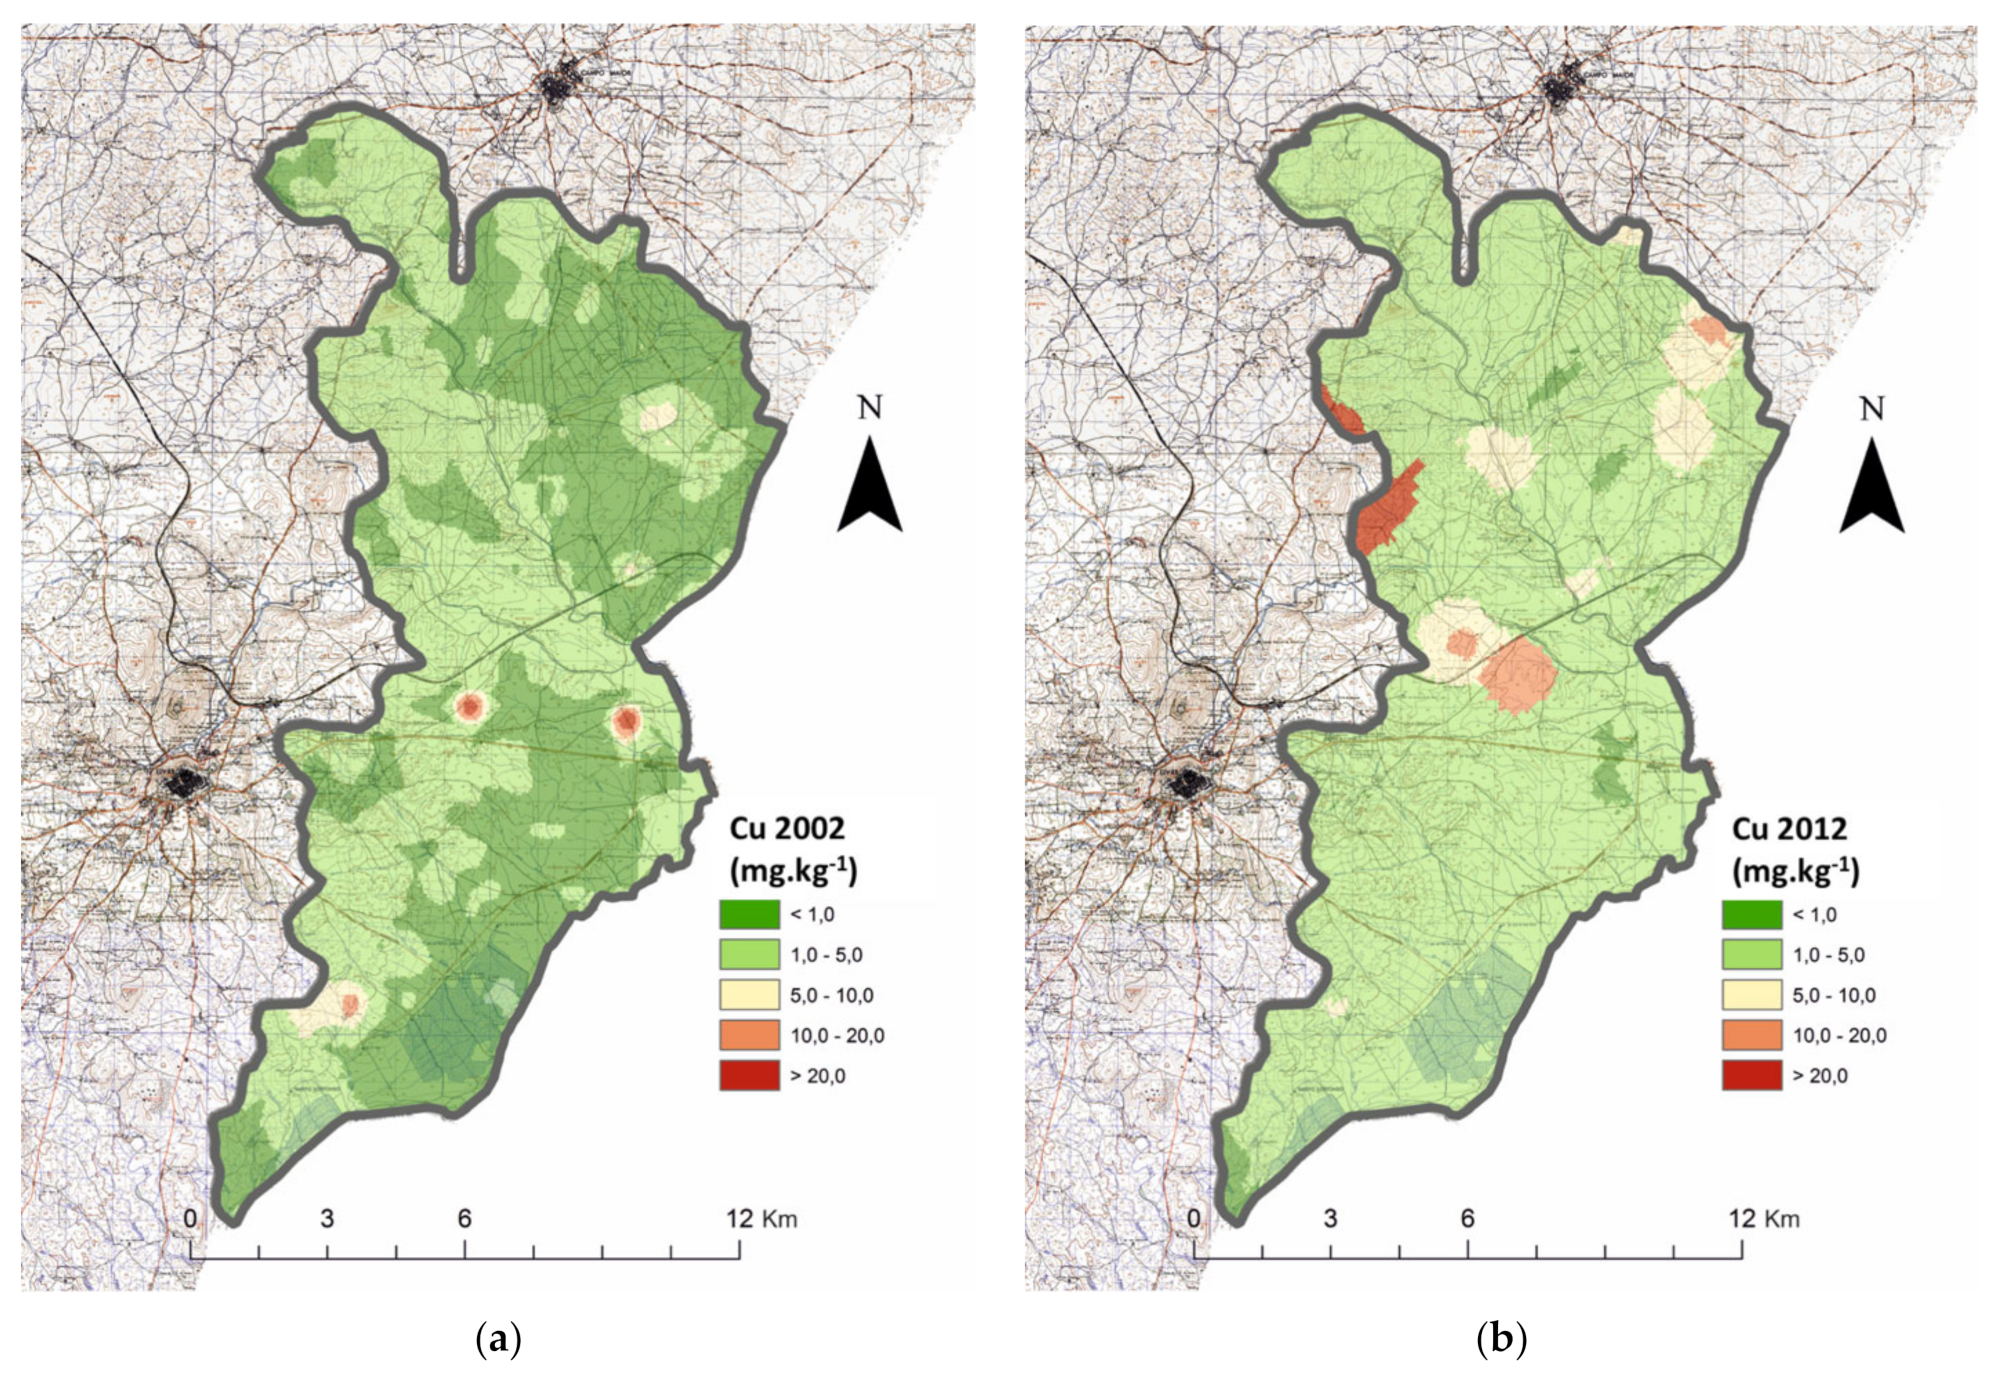
During the study timespan, the average available Cu content increased significantly by 123% (Table 2a; p < 0.01). This overall increase was registered in both the background values (MAI; p < 0.01) and reference values (HAI), for which they increased by 62% and 179%, respectively. A more detailed analysis revealed that there were significant statistical differences between the background values of Fluvisols and Calcisols and between those of Calcisols and Cambisols (Table 2b; p <0.05; test performed by pairwise comparisons), with no differences between the remaining pairs of soils (p > 0.05). It can also be deduced that the available Cu reference values by RSG were well below the concentrations allowed in Portuguese soils (50.0–200 mg kg−1), which can be confirmed in Figure 4a. A comparison of the mean Cu contents between the rainfed and irrigated cropping systems for the entire study area (Table 2c) revealed that the concentrations were similar for both cropping systems (p > 0.05), but when the analysis was carried out by RSG (Table 2d), there are significant differences between the contents of the element in rainfed and irrigated areas, with the concentrations of available Cu 82.7%, 76.9%, and 133% higher in irrigated than in rainfed Fluvisols, Calcisols, and Cambisols, respectively, all with p < 0.01. In Luvisols, the concentrations for both cultivation systems remained constant (p > 0.05). A study on the evolution of the element from 2002 to 2012 by cultivation system revealed that in the irrigation system, the average values increased by 184% (i.e., the average Cu content increased from 1.04 (N = 675) to 2.95 (N = 783, U test: 98,542,000, p = 0.000) mg.kg−1 from 2002 to 2012), while in the rainfed system, they remained stable (i.e., 1.09 (N = 620) to 1.68 (N = 513, T-test (1131): −6.872, p = 0.197) mg.kg−1 from 2002 to 2012). Figure 5a,b confirms that the increase in available Cu concentrations in the study area was generalized.
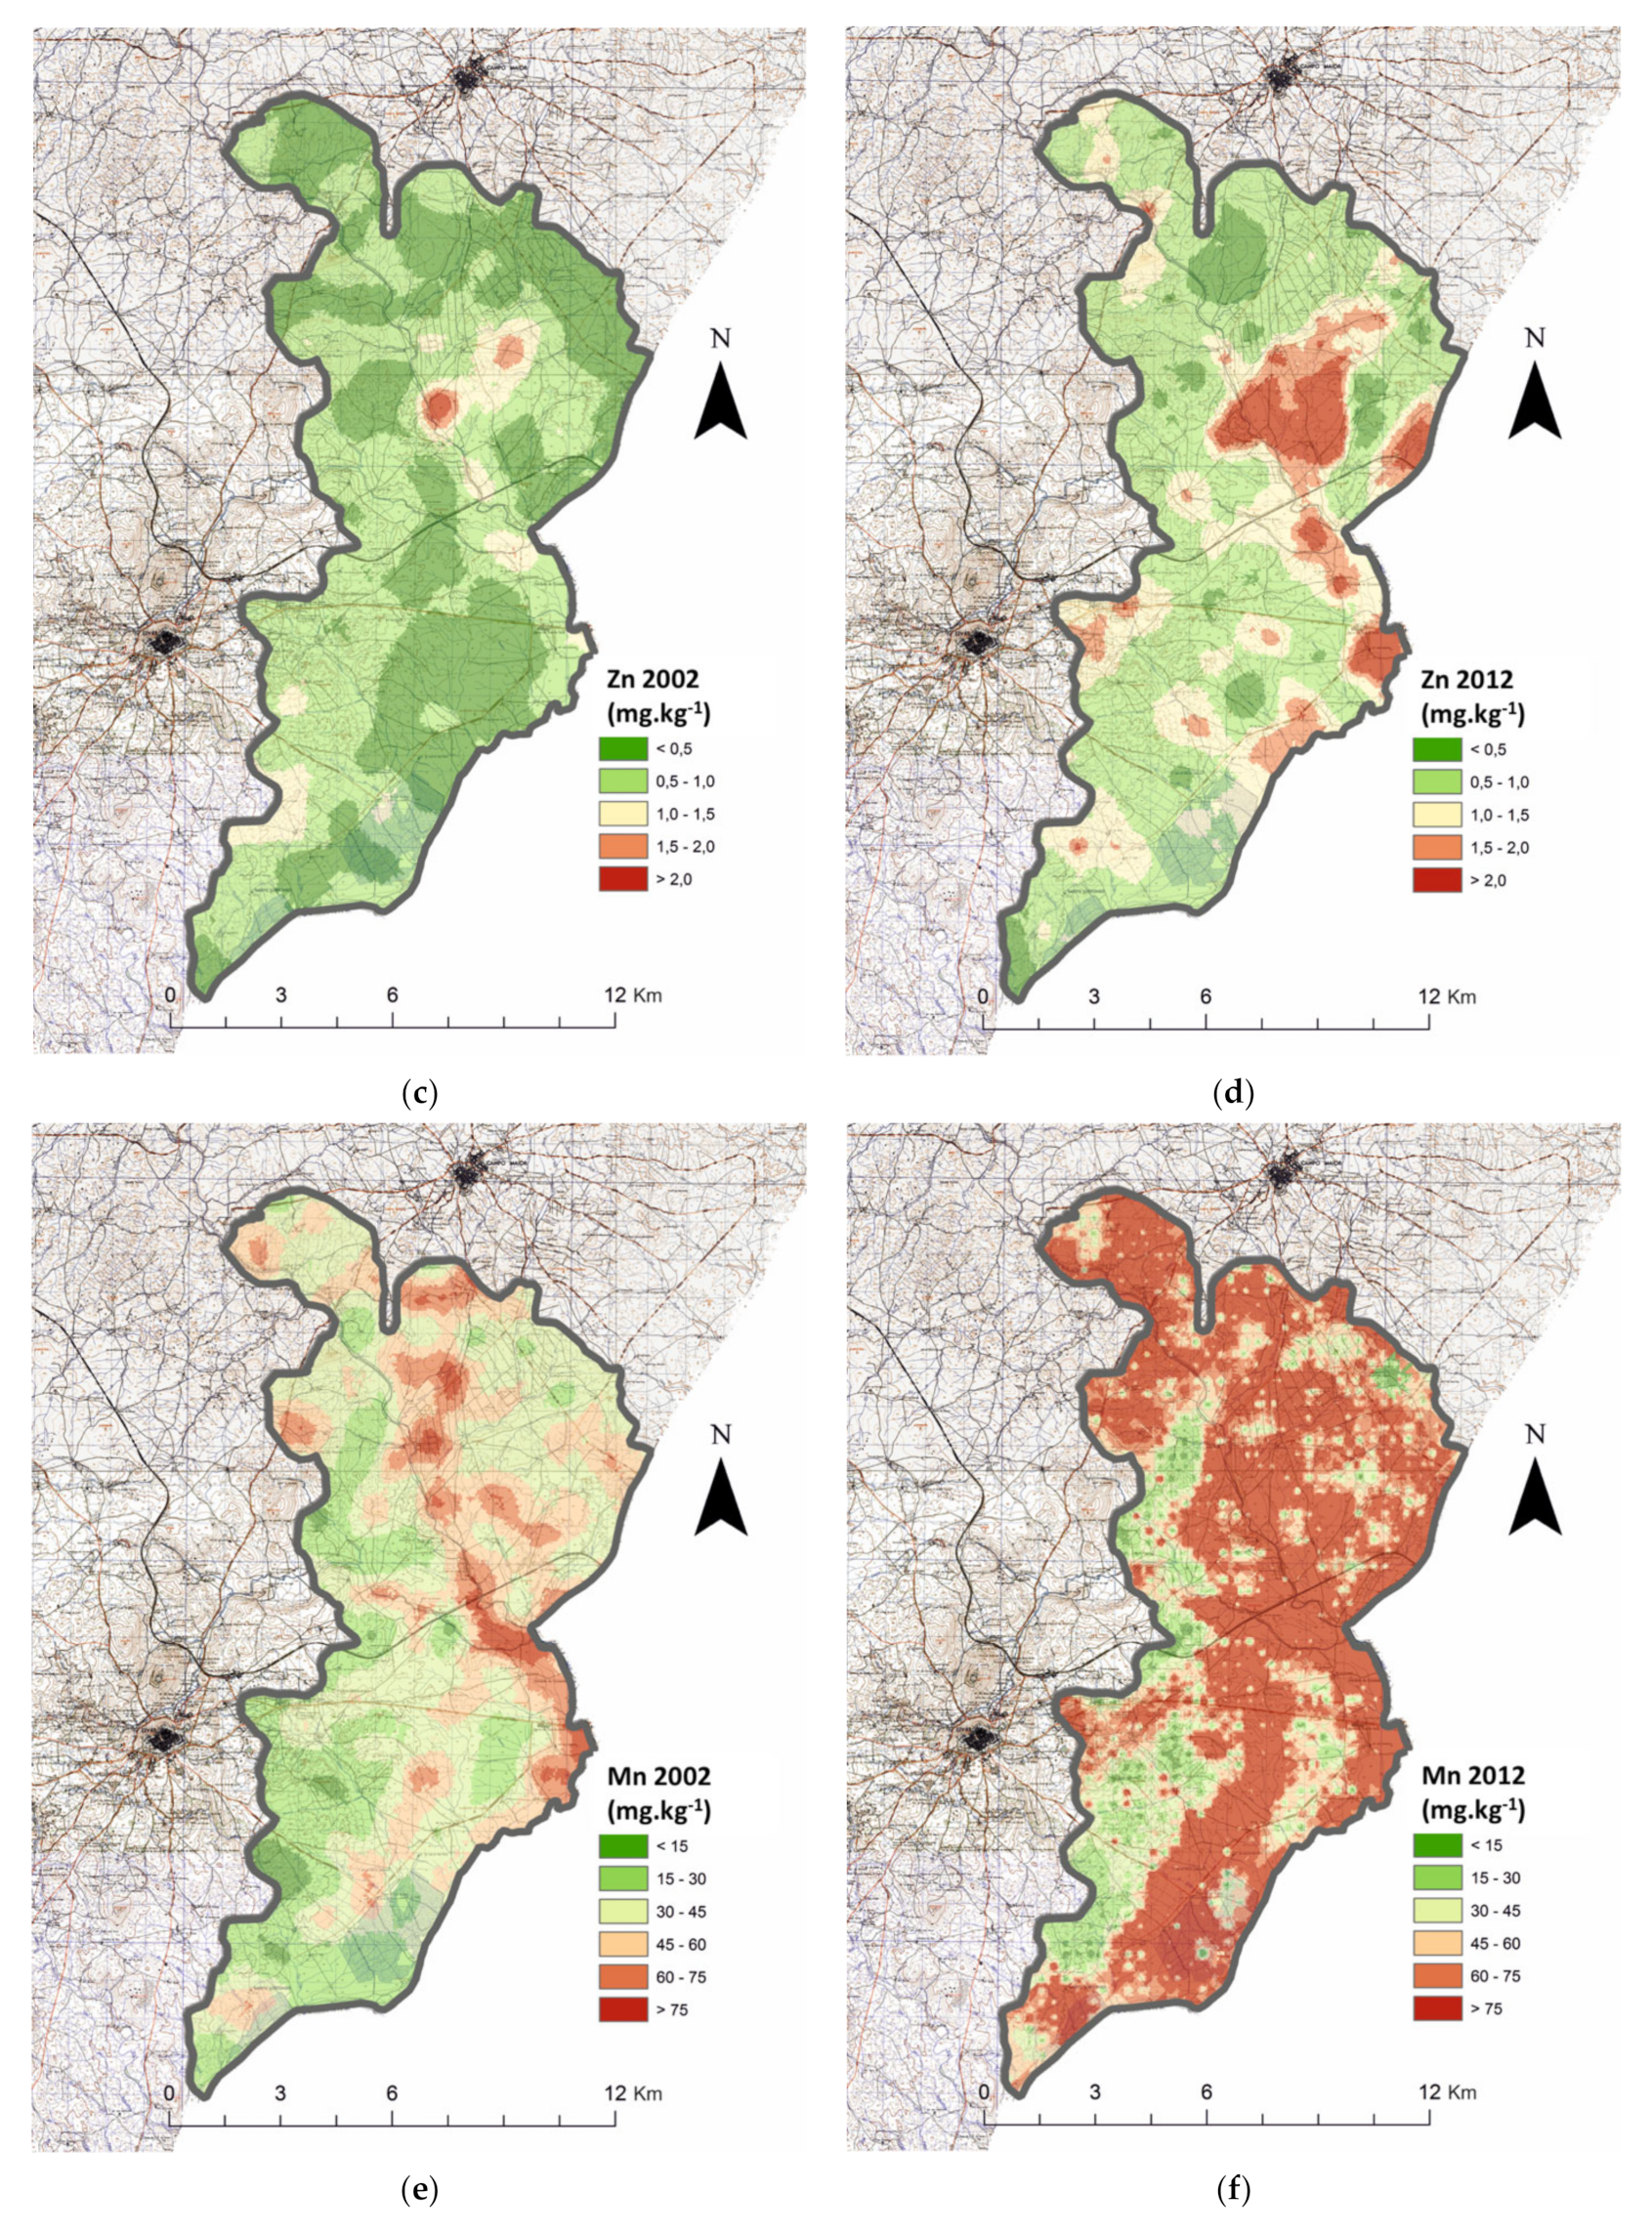
Identically to what we registered for Cu, the overall average concentrations of available Zn (Table 2a) increased by 64% (p < 0.01) from the beginning of this study. This overall increase was registered in both the MAI (p < 0.01) and HAI values, for which the concentrations increased by 42% and 86%, respectively. The analysis of Table 1b reveals that there were no significant differences between the MAI Zn concentrations in all RSGs (p > 0.05; test performed by pairwise comparisons) and that the HAI values were low and very similar, which can be confirmed in the Figure 4b and the observation of Table 2c, from which we may deduce that there were no significant differences between the concentrations of this metal in the soils subjected to a rainfed or an irrigated agricultural system (p > 0.05). An analysis of the mean concentrations by reference soil groups (Table 1d; Figure 2b) also revealed that, when rainfed and irrigated systems are compared, there are no significant differences in any of the RSG (p > 0.05). From the predictive maps (Figure 5c,d), it was confirmed that the increase in the average zinc content of the soils in the study area is generalized, being slightly higher in the older irrigated areas.
From the beginning of this study to 2012, the average edaphic available Mn content increased significantly by 40% (p < 0.01) throughout the study area (Table 2a), which was corroborated by the 33% increase in MAI concentrations (p < 0.01) in the same period and maintenance of the HAI concentrations around 157 mg kg−1. The analysis of Table 2b reveals that there were no statistical differences (p > 0.05) in the background values between Luvisols and Fluvisols, Luvisols and Cambisols, and Fluvisols and Cambisols, while for the rest of the relationships between RSGs, there were significant differences (p < 0.05; test performed by pairwise comparisons), with the Calcisols RSG presenting the lowest MAI concentrations for this parameter. The HAI concentrations for all RSGs were all very similar. Contrary to what we registered for the other cation micronutrients, the overall available Mn concentrations were 15% higher in the irrigation agricultural system when compared with the rainfed ones (Table 2c; p < 0.01). An analysis of the mean concentrations by RSG (Table 2d; Figure 4c) revealed that the higher concentrations were significant in the Fluvisols (p < 0.01) and Luvisols (p < 0.01) RSGs. The irrigated Fluvisols and Luvisols presented, respectively, concentrations 17% and 25% higher than those of the rainfed agricultural system, while all the other RSGs maintained their concentrations between agricultural systems (p > 0.05). The Calcisols presented the lowest concentration (p < 0.05) of available Mn of all RSGs, while the concentrations of Fluvisols, Luvisols, and Cambisols did not differ (p > 0.05; test performed by pairwise comparisons). Referring to Figure 5e,f, we confirmed that the increase in Mn content in time was generalized but related to the edaphic pH, presenting the lowest values in Calcisols, in which the pH was higher than 8.0.
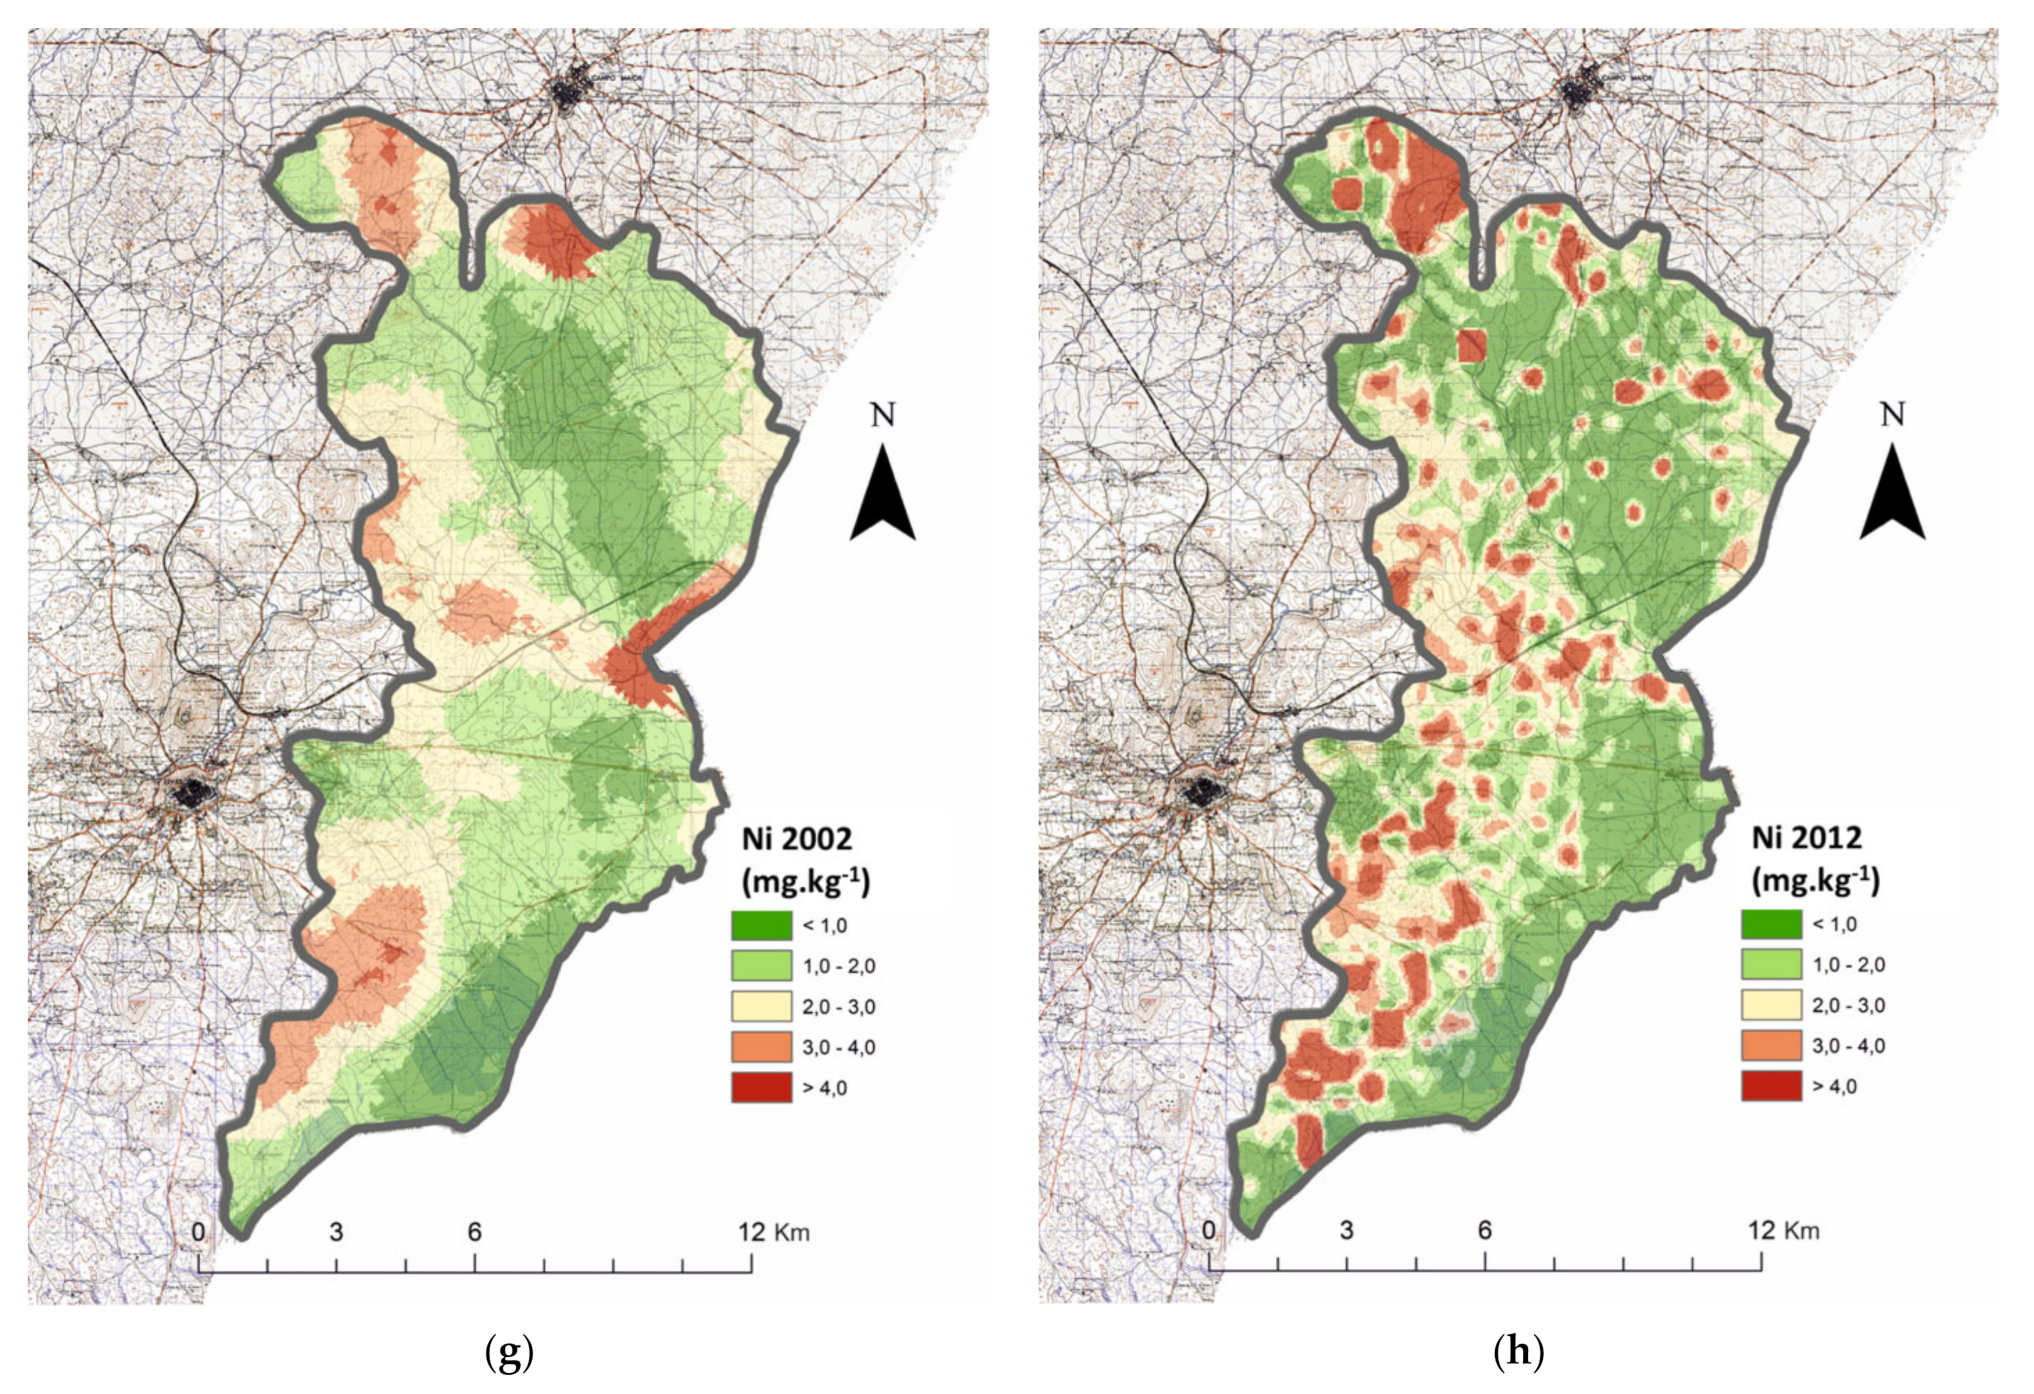
From the beginning of this study to 2012, the overall average concentrations of available Ni remained constant (Table 2a; p > 0.05), while the MAI values decreased significantly by 25% (Table 2a; p < 0.01), and the HAI remained very similar between the sampled years. A more detailed analysis by RSG (Table 2b) revealed that there were significant differences (p < 0.01) between the RSG HAI values, except for Cambisols and Fluvisols (p > 0.05; test performed by pairwise comparisons). A comparison of the average Ni contents in the overall study area between the rainfed and irrigated agricultural systems (Table 2c) revealed that there were no significant differences (p > 0.05) between the concentrations of both cultivation systems. An analysis by RSG (Table 2d) indicated that there were no significant differences between the average Ni contents in both cultivation systems for all RSGs except for Cambisols, in which the average contents in irrigated soils were 68% higher than those in the rainfed ones (p < 0.05). Figure 4d shows that the values in the different RSGs were very close, except for the peak observed in Fluvisols under irrigation. The observation of Figure 5g,h confirms the heterogeneity of the distribution of available Ni with time, regardless of the cultivation system.

3.3. Bioavailability

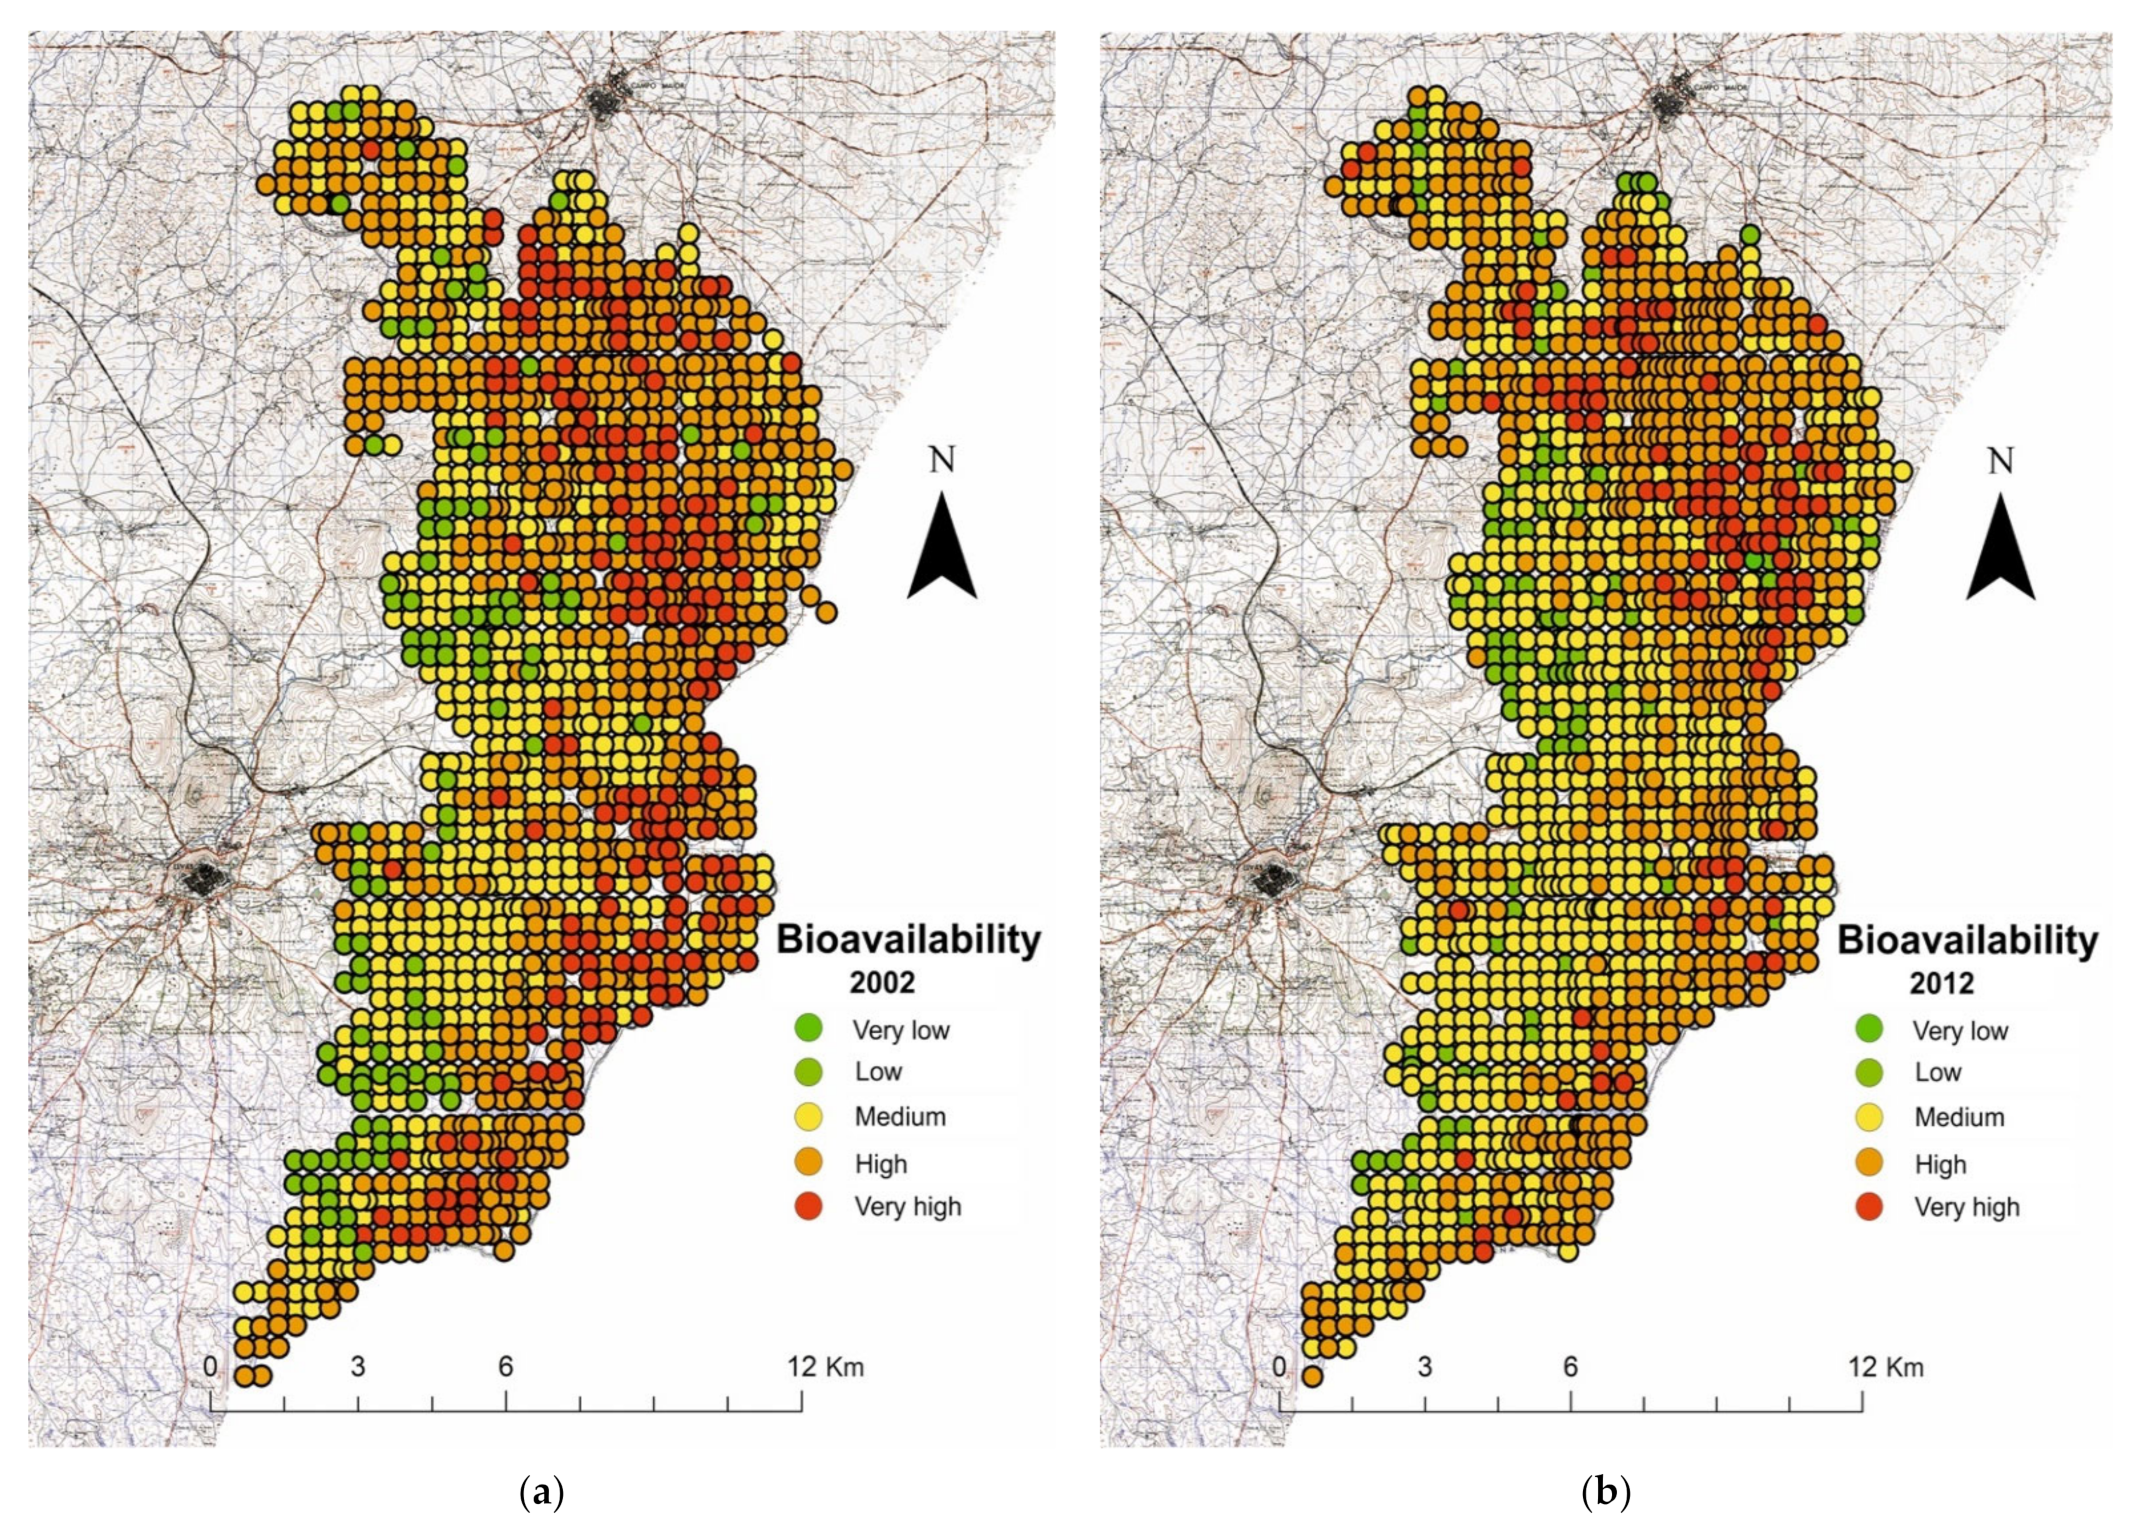
From the analysis of Table 3, we can conclude that the metal bioavailability varies between high and medium (according to the Fairbrother et al. [47] classification system), depending on the RSG. Thus, 51% of the study area soils have a high bioavailability (Fluvisols and Cambisols), and 49% have a medium bioavailability (Luvisols and Calcisols). From Figure 6a,b, we can verify that the metal bioavailability is increasing in the western soils of the study area, where most of the rainfed cultivation systems are practiced.

4. Discussion

The overall low levels of available Cd coincided with the studies carried out in Portugal by authors such as Dias et al. [18]. The fact that the Cambisol RSG showed excessively high concentrations of available Cd could, in our opinion, be related to the intensification to which this type of soil has been subjected in recent years, as demonstrated by Telo da Gama et al. [22]. As for background concentrations, the higher MAI in Calcisols in relation to the other RSGs may be attributed to the soil’s naturally rich cadmium content [5], where Cd is released in more soluble forms because of carbonate-rich soil weathering, as presented by Robson et al. [48]. In addition, the high amounts of carbonates in these soils may further promote the formation of insoluble compounds with this ion, hindering its possible leaching, which agrees with the study carried out in Iranian in soils with a pH of 7–8 by Khodaverdiloo and Samadi [49], in which soils with relatively high concentrations of free and active carbonates provided that the available Cd precipitated in solid phase as otavite (CdCO3). The fact that the average concentrations of available Cd remained constant between the rainfed and irrigation agricultural system contradicts the observations by Afifi et al. [16], who obtained a significant accumulation of edaphic available Cd after only two years of irrigation. In our study, available Cd concentrations in irrigated soils were lower than rainfed ones. This result in rainfed soils may be related to the Calcisol RSG (pH > 8) since this metal may become immobile in alkaline soils where low solubility compounds predominate (e.g., higher OH- concentrations allow for FeOOH precipitation that may adsorb Cd), thus facilitating the cadmium to remain in the soil, inaccessible to plants and safe from potential leaching. Even though this metal tends to precipitate with FeOOH to a lesser degree than with Cr, Cu, Ni, Pb, or Zn, it precipitates more than Mn, and when low solubility compounds are formed, they are of extremely low solubility according to Alloway [6].
Contrary to what we registered for the available Cd, the concentrations of available Cr diminished with time. This decrease in the concentration of the element in the soil solution over time may occur due to the element being leached, to a lesser utilization of agrochemicals with Cr in its constitution, or even to the ability of Cr to form phosphates or hydroxides of very low solubility, as this is a very immobile element and tends to promptly bind to edaphic solid phases. These results seem to contradict those obtained by Afifi et al. [16], who, along with an increase in available Cd, also observed an edaphic accumulation of available Cr after irrigation for only 2 years. Jebreen et al. [4] concluded in their study that Cr is a common constituent of carbonate rocks and, according to the study by Alcântara and Camargo [50], it would not be the edaphic pH that would influence the available Cr contents; thus, the higher content of available Cr in the Calcisol RSG may indicate that industrial residues rich in Cr (e.g., slurry or ash) are being applied for corrective purposes to the soils of the study area [51], that micronutrient-rich fertilizers are being used [52], or that the application of agrochemicals with Cr in their composition is being highly used [53]. When analyzing the average content of the available Cr, we could conclude that the soils’ reduced values could be related to the registered decrease in the SOM [22] that, by retaining lower amounts of Cr, would allow the greater leaching of the element from the soil solution. Similar to what has already been explained for cadmium, the variation in Cr content between the different RSGs could be attributed to the intrinsic characteristics of these soils, that is, the constituents in the parent material, the content and the type of clays, and the content of carbonates and salinity factors that, in their entirety, condition the concentration of the element in the soil, which is in accordance with the studies by Micó et al. [17], Rodríguez-Martín et al. [54], and Kelepertzis [20]. Thus, these results are related, above all, with the carbonate nature of these soils (pH 8.0) in which Cr can be present. This metal forms compounds of low solubility in alkaline soils, thus making it inaccessible to plants and preventing its leaching.
The available Pb was the only heavy metal whose average concentrations increased in time in the study area, coinciding with the studies carried out in the Mediterranean basin by Inácio et al. [19], Acosta et al. [15], and Kelepertzis [20], who related the increase in edaphic concentrations of available Pb with anthropogenic activities. The higher MAI and HAI concentrations in the Calcisol RSG could be explained by their naturally high pH since the hydroxide content promotes the formation of lead complexes of low solubility, which prevents its loss by leaching and, therefore, could induce the higher content of this element in the soil [6]. In addition, as explained for Cd and Cr, these soils have high concentrations of carbonates that, in addition to promoting higher pH values, tend to precipitate most of the heavy metals, retaining these elements and, consequently, preventing them from being lost by leaching. Therefore, these results may also be attributable to this element being strongly adsorbed by FeOOH, and thus the highest Pb concentrations appear where the pH is highest. The distinct characteristics of the soils with different crops and agricultural practices carried out in them also contribute to these results. We may conclude that, indeed, the irrigation factor influences the content of this element in the soil, coinciding with the results of Inácio et al. [19]. However, the concentrations presented in the results section are still far below the maximum limits allowed for soils in Portugal (i.e., the D.L. nº 276/2009 that states limits between 50 mg kg−1 and 450 mg kg−1, depending on the edaphic pH), and, therefore, they do not present toxicity problems.
The average increase in available Cu concentrations over time can be explained because this element is frequently part of phytosanitary products (e.g., fungicides), which are applied in large quantities and almost exclusively in irrigation, leading to a higher content of this element in this agricultural system [18]. Another reasonable justification could be the fact that irrigated crops often receive more complete fertilizers, such as ones composed with micronutrients, applied to the soil or directly to the above-ground vegetative part of the crop with the purpose that no nutrient can be the limiting factor, thus promoting rapid growth as well as better flowering and grain formation of the crop, as demonstrated by Obrador et al. [55]. Yet another reason may be the lower SOM concentrations in the irrigated soils of the study area, as this micronutrient forms stable complexes with the organic matter so that only a small fraction is available for crops, as demonstrated in a study by Telo da Gama et al. [22]. These fertilizers contain copper, among many other elements, which inevitably leads to a higher content of the nutrient in the crops and the soil. These results agree with the studies by Acosta et al. [15], Micó et al. [17], Kelepertzis [20], and Romic et al. [56], who also recorded increases in the available Cu in agricultural soils due to anthropogenic activities related to agricultural practices. Our results indicate that the irrigation cultivation system is a great promoter of the increase in levels of available Cu in the soils of the study area, which aligns with the aforementioned studies [15,17,20,56]. The difference in the average MAI and HAI concentrations between RSGs is attributable to the characteristics of the soil (e.g., its capacity to retain cations), as well as to the different crops and agricultural practices carried out. As we already stated, it is the number of treatments with copper-based fungicides, along with the addition of certain fertilizers, that leads to an increase of this element in the soils of the study area. We may conclude that, indeed, the irrigation factor influences the content of this element in the soil, which coincides with the results of Inácio et al. [19]. However, the concentrations presented in the results section are still far below the maximum limits allowed for soils in Portugal (i.e., the D.L. nº 276/2009 that states limits between 50 mg kg−1 and 450 mg kg−1, depending on the edaphic pH), and, therefore, they do not present toxicity problems.
Identically to what was registered for Cu, the concentrations of available Zn increased with time. This increase in the concentration of the element in the soil solution over time indicates that the element is accumulating in the studied soils, coinciding with the results obtained by Alloway [6]. According to Watts et al. [57], this increase is linked to the application of Zn-containing fertilizers. It can also be attributed to the application of pesticides, especially insecticides, that contain this element (both applications of fertilizers and insecticides occur more often, or almost exclusively, in irrigation, according to Jameel et al. [1]). Finally, the increase in this element could be related to the increase in available phosphorus in these soils, which, because of the ionic antagonism effect, could prevent the Zn+ ion from being absorbed by the crops and remaining in the soil, as demonstrated in a study by Safaya [58] that observed that an excess in edaphic available phosphorus inhibited Zn uptake (by lowering its rate of uptake in the outer cell membrane of the radicula). Our results point to an overall and generalized (i.e., non RSG or agricultural system-related) increase in available Zn.
Our results seem to indicate that Mn, in most soils, is accumulating. This increase, contrary to what happened with the micronutrients discussed above, cannot be attributed to the application of agrochemicals since Mn is not an element that, in general, appears in the composition of these agrochemicals. Since the availability of Mn essentially depends on the edaphic pH and the redox potential, as demonstrated by Alloway [6], and considering that most of the soils in the study area have a pH greater than 5.5, as long as the soil has adequate aeration, which occurs mainly in the rainfed soils, the available Mn would transit to higher oxidation states, losing solubility. On the contrary, in irrigated soils, the most oxidized forms decrease their concentration, thus increasing the solubility of the element and, consequently, its content in the available form [59]. These results are also related to the distinct edaphic characteristics, especially the different ability of each RSG to adsorb and leach nutrients and to the degree to which the different crops are present in the different soils and the agricultural practices carried out in them. Additionally, the lower Mn background value in Calcisols is attributable to the high carbonate content in this RSG [15,17], which may contribute to reducing its solubility through the formation of MnCO3 or precipitation as MnOOH.
The available Ni is the only micronutrient whose average concentrations remained constant in the study area, with even the MAI values decreasing. The highest concentrations in Fluvisols and Cambisols could be attributed to the intensification produced in this RSG, as demonstrated in Telo da Gama et al. [22], as well as the presence in the parent material, as demonstrated by the studies of Acosta et al. [15] and Micó et al. [17], who related the available Ni concentrations with a lithogenic control. As stated before, these results are linked to the intrinsic differences between the RSG and are contrary to the study of Brooks [60], who found the highest concentrations of available Ni in Fluvisols and Cambisols, particularly if the Cambisols were developed on gabbro. However, the concentrations in these soils are way below the maximum allowed in Portuguese soils (i.e., between 30.0 mg kg−1 and 110 mg kg−1); therefore, agricultural toxicity problems are not expected in relation to Ni, which agrees with another study carried out in Portugal by Dias et al. [18].
Most of the edaphic concentrations of the analyzed metals in this study were relatively low and below the risk values for soils, but because their bioavailability is medium/high, the risk of food chain contamination and reaching the critical load is also medium/high. Given that the SOM is very similar between the different RSGs, whether in a rainfed or an irrigated agricultural system, the differences in bioavailability are clearly related to the edaphic pH, with the lower bioavailability coinciding with the highest pH. However, these results must be approached carefully, as the bioavailability of trace elements in soils cannot be attributed to a single value, nor can it be measured with a chemical or even biological method, according to Alloway [6]. This is a process that, like any other in nature, is dynamic and varies in space and time. Bioavailability is affected by many factors, including pH, soil texture, redox potential, SOM, CEC, macronutrient levels, available water content, temperature, etc. [7]. A study by Fairbrother et al. [47] pointed out the qualitative bioavailability of metal ions in soils by relating their availability to pH and SOM. The adsorption capacity of the soil has a profound effect on the bioavailability of metals, as shown by Adriano [7], Abollino et al. [8], and Vig et al. [9], but a complete understanding of the intrinsic edaphic mechanisms that influence the metal’s solubility has not yet been achieved, although generally, the main adsorption sites for vestigial metals are found in humus and Fe oxides.
According to Alloway [6], there are many factors affecting metal bioavailability (e.g., copper has a higher affinity for humic and fulvic acids, while lead is retained almost exclusively by Mn oxides at low a pH and by Fe oxides at a pH of >7; cadmium is the metal with the weakest bond, so for a pH of <5, there is still a substantial, non-specific binding to the aluminosilicate-clayey fraction. However, the adsorption of cadmium in soils with a pH of >7 is dominated by the iron oxide fraction).

5. Conclusions

As a conclusion of this multi-year study, the overall available cadmium and chromium concentrations decreased over time, but an overall increase in the available lead was registered, even though it could not be related to any particular RSG or agricultural system. Regardless, all heavy metals revealed 2× to 25× higher concentrations when comparing the MAI with the HAI agricultural system. Not surprisingly, the soils nearer to the rivers and irrigation points that are under irrigation most of the time, or the ones that were recently intensified (e.g., converted from a rainfed to an irrigated agricultural system), present the greatest increases in available cation micronutrient concentrations. As for the heavy metals, we registered 2× to 9× higher concentrations in the HAI than the MAI agricultural system for micronutrients. Even though most of the edaphic concentrations of the analyzed metals were relatively low, and for the most part below the critical load risk values for soils, there is clear evidence pointing to very high concentrations in intensified agricultural systems when compared to the non-intensified ones. In addition, because the edaphic bioavailability is relatively high, the risk of food chain contamination may also be high. These results are but one more account of the anthropological impact on ecosystem services that jeopardizes their sustainability and proper conservation.

Author Contributions

Conceptualization, J.R.N., L.L., and A.L.-P.; methodology, J.R.N., L.L., and A.L.-P.; software, J.T.d.G.; validation, J.T.d.G.; formal analysis, J.T.d.G.; investigation, J.T.d.G., J.R.N., L.L., and A.L.-P.; resources, J.R.N., L.L., and A.L.-P.; data curation, J.T.d.G.; writing—original draft preparation, J.T.d.G.; writing—review and editing, J.T.d.G., J.R.N., L.L., and A.L.-P.; visualization, J.T.d.G., J.R.N., L.L., and A.L.-P.; supervision, J.R.N., L.L., and A.L.-P.; project administration, J.R.N.; funding acquisition, J.R.N. and L.L. All authors have read and agreed to the published version of the manuscript.

Funding

Support for this work was provided by the Spanish Ministry of Science, Innovation and Universities (RTI2018-095461-B-I00), and by the Extremadura Regional Government (GR18011; IB16075) with co-financing from the European Regional Development Fund.

Institutional Review Board Statement

Not applicable.

Informed Consent Statement

Not applicable.

Data Availability Statement

Not applicable.

Acknowledgments

The authors would like to express their gratitude to the ‘Caia Beneficiaries Association’, a non-profit organization under the supervision of the Portuguese Ministry of Agriculture, which is in charge of the management, exploitation, and conservation of the Caia Hydro-agriculture Project and Irrigation Perimeter for the administrative support and data provided.

Conflicts of Interest

The authors declare no conflict of interest. The funders had no role in the design of the study; in the collection, analyses, or interpretation of data; in the writing of the manuscript; or in the decision to publish the results.

References

  1. Jameel, M.; Shoeb, M.; Khan, M.T.; Ullah, R.; Mobin, M.; Farooqi, M.K.; Adnan, S.M. Enhanced insecticidal activity of thiamethoxam by zinc oxide nanoparticles: A Novel nanotechnology approach for pest control. ACS Omega 2020, 5, 1607–1615. [Google Scholar] [CrossRef]
  2. Kumpiene, J.; Giagnoni, L.; Marschner, B.; Denys, S.; Mench, M.; Adriaensen, K.; Vangronsveld, J.; Puschenreiter, M.; Renellal, G. Assessment of methods for determining bioavailability of trace elements in soils: A review. Pedosphere 2017, 27, 389–406. [Google Scholar] [CrossRef]
  3. Tóth, G.; Hermann, T.; Da Silva, M.R.; Montanarella, L. Heavy metals in agricultural soils of the European Union with implications for food safety. Environ. Int. 2016, 88, 299–309. [Google Scholar] [CrossRef] [PubMed]
  4. Jebreen, H.; Wohnlich, S.; Banning, A.; Wisotzky, F.; Niedermayr, A.; Ghanem, M. Recharge, geochemical processes and water quality in karst aquifers: Central west bank, palestine. Env. Earth Sci. 2018, 77, 261. [Google Scholar] [CrossRef]
  5. Rambeau, C.M.C.; Baize, D.; Saby, N.; Matera, V.; Adatte, T.; Föllmi, K.B. High cadmium concentrations in Jurassic limestone as the cause for elevated cadmium levels in deriving soils: A case study in Lower Burgundy, France. Env. Earth Sci. 2010, 61, 1573–1585. [Google Scholar] [CrossRef] [Green Version]
  6. Alloway, B.J. Heavy Metals in Soils: Trace Metals and Metalloids in Soils and Their Bioavailability. In Environmental Pollution, 2nd ed.; Springer Science & Business Media: Berlin/Heidelberg, Germany, 2012; Volume 22, pp. 11–50. [Google Scholar]
  7. Adriano, D.C. Trace Elements in Terrestrial Environments: Biogeochemistry, Bioavailability and Risks of Metals, 2nd ed.; Springer: New York, NY, USA, 2001; p. 867. [Google Scholar]
  8. Abollino, O.; Aceto, M.; Malandrino, M.; Mentasti, E.; Sarzanini, C.; Petrella, F. Heavy metals in agricultural soils from Piedmont, Italy. Distribution, speciation and chemometric data treatment. Chemosphere 2002, 49, 545–557. [Google Scholar] [CrossRef]
  9. Vig, K.; Megharaj, M.; Sethunathan, N.; Naidu, R. Bioavailability and toxicity of cadmium to microorganisms and their activities in soil: A review. Adv. Environ. Res. 2003, 8, 121–135. [Google Scholar] [CrossRef]
  10. Nunes, J.; Ramos-Miras, J.; Lopez-Piñeiro, A.; Loures, L.; Gil, C.; Coelho, J.; Loures, A. Concentrations of available heavy metals in mediterranean agricultural soils and their relation with some soil selected properties: A case study in typical Mediterranean soils. Sustainability 2014, 6, 9124–9138. [Google Scholar] [CrossRef] [Green Version]
  11. Vega, F.A.; Covelo, E.F.; Andrade, M.L.; Marcet, P. Relationships between heavy metals content and soil properties in minesoils. Anal. Chim. Acta 2004, 524, 141–150. [Google Scholar] [CrossRef]
  12. Businelli, D.; Massaccesi, L.; Said-Pullicino, D.; Gigliotti, G. Long-term distribution, mobility and plant availability of compost-derived heavy metals in a landfill covering soil. Sci. Total. Environ. 2009, 407, 1426–1435. [Google Scholar] [CrossRef]
  13. Römkens, P.F.; Guo, H.-Y.; Chu, C.-L.; Liu, T.-S.; Chiang, C.-F.; Koopmans, G.F. Characterization of soil heavy metal pools in paddy fields in Taiwan: Chemical extraction and solid-solution partitioning. J. Soils Sediments 2009, 9, 216–228. [Google Scholar] [CrossRef]
  14. Tarvainen, T.; Jarva, J.; Kahelin, H. Geochemical baselines in relation to analytical methods in the Itä-Uusimaa and Pirkanmaa regions, Finland. Geochem. Explor. Environ. Anal. 2009, 9, 81–92. [Google Scholar] [CrossRef]
  15. Acosta, J.A.; Faz, A.; Martinez-Martinez, S. Identification of heavy metal sources by multivariable analysis in a typical Mediterranean city (SE Spain). Environ. Monit. Assess. 2010, 169, 519–530. [Google Scholar] [CrossRef]
  16. Afifi, A.A.; El-Rheem, K.M.A.; Youssef, R.A. Influence of sewage water reuse application on soil and the distribution of heavy metals. Nat. Sci. 2011, 4, 9. [Google Scholar]
  17. Micó, C.; Recatalá, L.; Peris, M.; Sánchez, J. Assessing heavy metal sources in agricultural soils of an European Mediterranean area by multivariate analysis. Chemosphere 2006, 5, 863–872. [Google Scholar] [CrossRef]
  18. Dias, R.M.S.; Simões, A.M.O.; Soveral-Dias, J.C.; Oliveira, R.; Rodrigues, P.C. Cádmio, Cobre, Níquel e Zinco em solos com ocupação agrí- cola em Portugal. Rev. De Ciências Agrárias 2007, 30, 358–368. [Google Scholar]
  19. Inácio, M.; Pereira, V.; Pinto, M. The soil geochemical atlas of Portugal: Overview and applications. J. Geochem. Explor. 2008, 98, 22–33. [Google Scholar] [CrossRef]
  20. Kelepertzis, E. Accumulation of heavy metals in agricultural soils of Mediterranean: Insights from Argolida basin, Peloponnese, Greece. Geoderma 2014, 221–222, 82–90. [Google Scholar] [CrossRef]
  21. Bakó, G.; Molnár, Z.; Bakk, L.; Horváth, F.; Fehér, L.; Ábrám, Ö.; Morvai, E.; Biro, C.; Pápay, G.; Fűrész, A.; et al. Toward a high spatial resolution aerial monitoring network for nature conservation—How can remote sensing help protect natural areas? Sustainability 2021, 13, 8807. [Google Scholar] [CrossRef]
  22. Telo da Gama, J.; Rato Nunes, J.; Loures, L.; Lopez Piñeiro, A.; Vivas, P. Assessing spatial and temporal variability for some edaphic characteristics of Mediterranean rainfed and irrigated soils. Agronomy 2019, 9, 132. [Google Scholar] [CrossRef] [Green Version]
  23. Food and Agriculture Organization (FAO). World Reference Base for Soil Resources 2014: International Soil Classification System for Naming Soils and Creating Legends for Soil Maps; FAO: Rome, Italy, 2015. [Google Scholar]
  24. Loures, L.; Gama, J.; Nunes, J.; Lopez-Piñeiro, A. Assessing the sodium exchange capacity in rainfed and irrigated soils in the Mediterranean basin using GIS. Sustainability 2017, 9, 405. [Google Scholar] [CrossRef] [Green Version]
  25. Lindsay, W.L.; Norvell, W.A. Development of a DTPA soil test for zinc, iron, manganese, and copper. Soil Sci. Soc. Am. J. 1978, 42, 421–428. [Google Scholar] [CrossRef]
  26. Hooda, P.S.; Alloway, B.J. The plant availability and DTPA extractability of trace metals in sludge-amended soils. Sci. Total. Environ. 1994, 149, 39–51. [Google Scholar] [CrossRef]
  27. Soriano-Disla, J.M.; Gómez, I.; Guerrero, C.; Jordan, M.M.; Navarro-Pedreño, J. Soil factors related to heavy metal bioavailability after sewage sludge application. Fresenius Environ. Bull. 2008, 17, 8. [Google Scholar]
  28. Hao, X.-Z.; Zhou, D.-M.; Huang, D.-Q.; Cang, L.; Zhang, H.L.; Wang, H. Heavy metal transfer from soil to vegetable in southern Jiangsu Province, China. Pedosphere 2009, 19, 305–311. [Google Scholar] [CrossRef]
  29. Shapiro, S.S.; Wilk, M.B. An analysis of variance test for normality (complete samples). Biometrika 1965, 52, 591. [Google Scholar] [CrossRef]
  30. Razali, N.M.; Wah, Y.B. Power comparisons of shapiro-wilk, kolmogorov-smirnov, lilliefors and anderson-darling tests. J. Stat. Modeling Anal. 2011, 2, 21–33. [Google Scholar]
  31. Cramer, D. Fundamental Statistics for Social Research: Step-by-Step Calculations and Computer Techniques Using SPSS for Windows; Routledge: Abingdon, UK, 1988. [Google Scholar]
  32. Cramer, D.; Howitt, D.L. The Sage Dictionary of Statistics: A Practical Resource for Students in the Social Sciences; Sage: London, UK, 2004. [Google Scholar]
  33. Doane, D.P.; Seward, L.E. Measuring skewness: A forgotten statistic? J. Stat. Educ. 2011, 19, 1–18. [Google Scholar] [CrossRef]
  34. Nordstokke, D.W.; Zumbo, B.D. A new nonparametric Levene test for equal variances. Psicol. Int. J. Methodol. Exp. Psychol. 2010, 31, 401–430. [Google Scholar]
  35. Nordstokke, D.W.; Zumbo, B.D.; Cairns, S.L.; Saklofske, D.H. The operating characteristics of the nonparametric Levene test for equal variances with assessment and evaluation data. Pract. Assess. Res. Eval. 2011, 16, 5. [Google Scholar]
  36. Ferreira, M. Dados Geoquímicos de Base de Solos de Portugal Continental, Utilizando Amostragem de Baixa Densidade. Ph.D. Thesis, University of Aveiro, Aveiro, Portugal, 19 December 2004. [Google Scholar]
  37. Harmens, H.; Norris, D.A.; Koerber, G.R.; Buse, A.; Steinnes, E.; Rühling, Å. Temporal trends (1990–2000) in the concentration of cadmium, lead and mercury in mosses across Europe. Environ. Pollut. 2008, 151, 368–376. [Google Scholar] [CrossRef] [Green Version]
  38. Hengl, T.; Heuvelink, G.B.M.; Stein, A. A generic framework for spatial prediction of soil variables based on regression-kriging. Geoderma 2004, 120, 75–93. [Google Scholar] [CrossRef] [Green Version]
  39. Baxter, S.J.; Oliver, M.A. The spatial prediction of soil mineral N and potentially available N using elevation. Geoderma 2005, 128, 325–339. [Google Scholar] [CrossRef]
  40. Li, Y. Can the spatial prediction of soil organic matter contents at various sampling scales be improved by using regression kriging with auxiliary information? Geoderma 2010, 159, 63–75. [Google Scholar] [CrossRef]
  41. Sun, W.; Minasny, B.; McBratney, A. Analysis and prediction of soil properties using local regression-kriging. Geoderma 2012, 171–172, 16–23. [Google Scholar] [CrossRef]
  42. Behera, S.K.; Shukla, A.K. Spatial distribution of surface soil acidity, electrical conductivity, soil organic carbon content and exchangeable potassium, calcium and magnesium in some cropped acid soils of India. Land Degrad. Dev. 2015, 26, 71–79. [Google Scholar] [CrossRef]
  43. Chen, T.; Chang, Q.; Liu, J.; Clevers, J.G.P.W.; Kooistra, L. Identification of soil heavy metal sources and improvement in spatial mapping based on soil spectral information: A case study in northwest China. Sci. Total Environ. 2016, 565, 155–164. [Google Scholar] [CrossRef] [PubMed]
  44. Hou, D.; O’Connor, D.; Nathanail, P.; Tian, L.; Ma, Y. Integrated GIS and multivariate statistical analysis for regional scale assessment of heavy metal soil contamination: A critical review. Environ. Pollut. 2017, 231, 1188–1200. [Google Scholar] [CrossRef]
  45. Tziachris, P.; Metaxa, E.; Papadopoulos, F.; Papadopoulou, M. Spatial modelling and prediction assessment of soil iron using Kriging interpolation with pH as auxiliary information. ISPRS Int. J. Geo-Inf. 2017, 6, 283. [Google Scholar] [CrossRef] [Green Version]
  46. Team QD. QGIS Geographic Information System. Open Source Geospatial Foundation Project, Versão. 2015, 2. Available online: https://www.qgis.org/en/site/ (accessed on 1 March 2021).
  47. Fairbrother, A.; Wenstel, R.; Sappington, K.; Wood, W. Framework for metals risk assessment. Ecotoxicol. Environ. Safety 2007, 68, 145–227. [Google Scholar] [CrossRef]
  48. Robson, T.C.; Braungardt, C.B.; Rieuwerts, J.; Worsfold, P. Cadmium contamination of agricultural soils and crops resulting from sphalerite weathering. Environ. Pollut. 2014, 184, 283–289. [Google Scholar] [CrossRef] [PubMed] [Green Version]
  49. Khodaverdiloo, H.; Samadi, A. Batch equilibrium study on sorption, desorption, and immobilisation of cadmium in some semi-arid zone soils as affected by soil properties. Soil Res. 2011, 49, 444. [Google Scholar] [CrossRef]
  50. Alcântara, M.A.K.; De Camargo, O.A. Transporte de crômio trivalente influenciado pelo pH, horizonte do solo e fontes do crômio. Rev. Bras. Eng. Agríc. Ambient. 2001, 5, 497–501. [Google Scholar] [CrossRef]
  51. Salunkhe, P.B.; Dhakephalkar, P.K.; Paknikar, K.M. Bioremediation of hexavalent chromium in soil microcosms. Biotechnol. Lett. 1998, 20, 749–751. [Google Scholar] [CrossRef]
  52. Gonçalves Junior, A.C.; Luchese, E.B.; Lenzi, E. Avaliação da fitodisponibilidade de cádmio, chumbo e crômio, em soja cultivada em latossolo vermelho escuro tratado com fertilizantes comerciais. Quím Nova 2000, 23, 173–177. [Google Scholar] [CrossRef]
  53. Chirigiu, L.; Popescu, R.; Bubulica, M.-V.; Popescu, A. Determination of chromium, cooper, iron, zinc, cadmium and led by graphite furnace atomic absorption spectrometry in seven phytopharmaceutical products. Rev. Chim. 2012, 63, 874–876. [Google Scholar]
  54. Rodríguez Martín, J.A.; Ramos-Miras, J.J.; Boluda, R.; Gil, C. Spatial relations of heavy metals in arable and greenhouse soils of a Mediterranean environment region (Spain). Geoderma 2013, 200–201, 180–188. [Google Scholar] [CrossRef]
  55. Obrador, A.; Gonzalez, D.; Alvarez, J.M. Effect of inorganic and organic copper fertilizers on copper nutrition in spinacia oleracea and on labile copper in soil. J. Agric. Food Chem. 2013, 61, 4692–4701. [Google Scholar] [CrossRef]
  56. Romic, M.; Matijevic, L.; Bakic, H.; Romic, D. Copper accumulation in vineyard soils: Distribution, fractionation and bioavailability assessment. In Environmental Risk Assessment of Soil Contamination; Hernandez Soriano, M.C., Ed.; BoD: Norderstedt, Germany, 2014; Available online: http://www.intechopen.com/books/environmental-risk-assessment-of-soil-contamination/copper-accumulation-in-vineyard-soils-distribution-fractionation-and-bioavailability-assessment (accessed on 27 September 2021).
  57. Watts, C.; Aslam, M.; Gunaratna, N.; Shankar, A.; Groote, H.D.; Sharp, P. Agronomic Biofortification of maize with zinc fertilizers increases zinc uptake from maize flour by human intestinal caco-2 cells. Curr. Dev. Nutr. 2020, 4, 1853. [Google Scholar] [CrossRef]
  58. Safaya, N.M. Phosphorus-zinc interaction in relation to absorption rates of phosphorus, zinc, copper, manganese, and iron in corn. Soil Sci. Soc. Am. J. 1976, 40, 719–722. [Google Scholar] [CrossRef]
  59. Brady, N.C.; Weil, R.R.; Weil, R.R. The Nature and Properties of Soils; Prentice Hall: Upper Saddle River, NJ, USA, 2010; Volume 13, pp. 662–710. [Google Scholar]
  60. Brooks, R.R. Serpentine and its Vegetation: A Multidisciplinary Approach; Dioscorides Press: Portland, OR, USA, 1987. [Google Scholar]
Figure 1. Study area (a) lithology and (b) sampled universes.
Agronomy 11 02024 g001
Figure 2. Error bars for the sample year 2012 by RSG for the available (a) Cd, (b) Cr, and (c) Pb.
Agronomy 11 02024 g002
Figure 3. Predictive maps for available (a) Cd in 2002, (b) Cd in 2012, (c) Cr in 2002, (d) Cr in 2012, (e) Pb in 2002, and (f) Pb in 2012.
Agronomy 11 02024 g003aAgronomy 11 02024 g003b
Figure 4. Error bars for the sample year 2012 by RSG for the available (a) Cu, (b) Zn, (c) Mn, and (d) Ni.
Agronomy 11 02024 g004
Figure 5. Predictive maps for available (a) Cu in 2002, (b) Cu in 2012, (c) Zn in 2002, (d) Zn in 2012, (e) Mn in 2002, (f) Mn in 2012, (g) Ni in 2002, and (h) Ni in 2012.
Agronomy 11 02024 g005aAgronomy 11 02024 g005bAgronomy 11 02024 g005c
Figure 6. Predictive map for the metal bioavailability in the study area in (a) 2002 and (b) 2012.
Agronomy 11 02024 g006
Table 1. Available Cd, Cr, and Pb concentrations (a) in 2002 and 2012 for MAI, HAI, and average; (b) MAI and HAI by RSG in 2012; (c) average by cultivation system in 2012; and (d) average by cultivation system and RSG in 2012.
ParameterYearRSGCSNMAITestpNHAINAverageTestp
(a)Cd
(mg kg−1)
2002n.a.n.a.6200.065X: 98570.0026750.51012950.101T (2588): −0.6490.517
20125120.0207830.49512950.089
Cr
(mg kg−1)
2002n.a.n.a.6200.380X: 59,1360.0006751.6012950.440U: 599,533,0000.000
20125120.0007841.3512960.223
Pb
(mg kg−1)
2002n.a.n.a.6202.55X: 1.2010.0266756.7012952.71U: 763,037,0000.000
20125132.707848.0212973.08
(b)Cd
(mg kg−1)
2012Fluvisolsn.a.1980.000 bX2(3): 59,7600.0004300.245n.a.
Luvisols1510.015 b1880.475
Calcisols980.315 a1300.612
Cambisols640.000 b3612.5
Cr
(mg kg−1)
2012Fluvisolsn.a.1980.000 bX2(3): 36,1400.0004300.845n.a.
Luvisols1520.000 b1881.21
Calcisols980.675 a1301.93
Cambisols640.000 b360.687
Pb
(mg kg−1)
2012Fluvisolsn.a.1981.89 cX2(3): 63,7470.0004306.64n.a.
Luvisols1522.86 b1887.86
Calcisols995.51 a13012.4
Cambisols642.34 bc366.87
(c)Cd
(mg kg−1)
2012n.a.Rainfedn.a.n.a.5120.106T (1293): 0.5660.572
Irrigation7830.078
Cr
(mg kg−1)
2012n.a.Rainfedn.a.n.a.5120.259T (1294): −0.3860.700
Irrigation7840.199
Pb
(mg kg−1)
2012n.a.Rainfedn.a.n.a.5133.11U: 199,147,5000.768
Irrigation7843.06
(d)Cd
(mg kg−1)
2012Fluvisols cRainfedn.a.n.a.1980.049U: 39,772,0000.147
Irrigation4290.032
Luvisols bRainfedn.a.n.a.1510.100U: 13,687,0000.552
Irrigation1880.076
Calcisols aRainfedn.a.n.a.990.295T (227): −0.6470.518
Irrigation1300.276
Cambisols bcRainfedn.a.n.a.640.032U: 1,055,5000.461
Irrigation360.049
Cr
(mg kg−1)
2012Fluvisols cRainfedn.a.n.a.1980.129T (626): 0.2460.805
Irrigation4300.094
Luvisols bRainfedn.a.n.a.1520.228T (338): −0.9380.349
Irrigation1880.209
Calcisols aRainfedn.a.n.a.980.678T (226): −0.0430.966
Irrigation1300.660
Cambisols cRainfedn.a.n.a.640.129T (98): −0.6270.532
Irrigation360.137
Pb
(mg kg−1)
2012Fluvisols cRainfedn.a.n.a.1980.129T (626): 0.0730.942
Irrigation4300.094
Luvisols bRainfedn.a.n.a.1520.228T (338): 0.7390.460
Irrigation1880.209
Calcisols aRainfedn.a.n.a.990.678T (227): 0.8360.404
Irrigation1300.660
Cambisols cRainfedn.a.n.a.640.129T (98): −0.8780.382
Irrigation360.137
RSG: reference soil group; CS: cultivation system; N: number of the samples; MAI: minimal anthropogenic input; HAI: heavy anthropogenic input; X: Pearson’s Chi-square test; T: two-sample T-test; U: Mann–Whitney U test; X2: Kruskal–Wallis test; p: p value. Different columnar letters indicate significant differences (p < 0.05).
Table 2. Available Cu, Zn, Mn, and Ni concentrations (a) in 2002 and 2012 for MAI, HAI, and average; (b) MAI and HAI by RSG in 2012; (c) average by cultivation system in 2012; and (d) average by cultivation system and RSG in 2012.
ParameterYearRSGCSNMAITestpNHAINAver.Testp
(a)Cu
(mg kg−1)
2002n.a.n.a.6200.995X: 78,7820.0006753.6212951.07U: 411,473,5000.000
20125131.6178310.112952.39
Zn
(mg kg−1)
2002n.a.n.a.6200.505X: 64,3060.0006752.9212950.646U: 581,192,5000.000
20125130.7157845.4312971.06
Mn
(mg kg−1)
2002n.a.n.a.62041.5X: 17,0900.000675150129548.3U: 639,113,5000.000
201251355.1783164129667.5
Ni
(mg kg−1)
2002n.a.n.a.6201.80X: 73500.0076754.1012951.62T (2581): −0.9420.346
20125071.357815.4212881.57
(b)Cu
(mg kg−1)
2012Fluvisolsn.a.1981.398 bX2(3): 20,7620.0004309.22n.a.
Luvisols1521.645 ab18812.5
Calcisols991.870 a13013.3
Cambisols641.070 b369.00
Zn
(mg kg−1)
2012Fluvisolsn.a.1980.743 aX2(3): 63650.0954306.77n.a.
Luvisols1520.728 a1884.73
Calcisols990.650 a1302.00
Cambisols640.778 a362.27
Mn
(mg kg−1)
2012Fluvisolsn.a.19860.5 aX2(3): 93260.025430157n.a.
Luvisols15256.9 a188182
Calcisols9931.4 b130166
Cambisols6463.3 a36166
Ni (mg kg−1)2012Fluvisolsn.a.1981.89 cX2(3): 104,5790.0004304.16n.a.
Luvisols1522.86 b1886.11
Calcisols995.51 a1306.63
Cambisols642.34 bc365.72
(c)Cu
(mg kg−1)
2012n.a.Rainfedn.a.n.a.5131.68T (1294): −0.3620.717
Irrigation7832.95
Zn
(mg kg−1)
2012n.a.Rainfedn.a.n.a.5131.40T (1295): 0.8520.394
Irrigation7842.74
Mn (mg kg−1)2012n.a.Rainfedn.a.n.a.51362.0T (1294): 3.2180.007
Irrigation78371.1
Ni
(mg kg−1)
2012n.a.Rainfedn.a.n.a.5071.51T (1286): 0.8330.405
Irrigation7811.61
(d)Cu
(mg kg−1)
2012Fluvisols cRainfedn.a.n.a.1981.56U: 26,567,0000.000
Irrigation4292.86
Luvisols acRainfed1521.82T (338): −0.7540.451
Irrigation1882.86
Calcisols aRainfed991.91U: 3,438,0000.000
Irrigation1303.38
Cambisols bRainfed641.32U: 1,055,5000.000
Irrigation363.08
Zn
(mg kg−1)
2012Fluvisols bRainfedn.a.n.a.1981.79T (626): 0.0280.978
Irrigation4301.80
Luvisols aRainfed1521.19T (338): 0.3240.746
Irrigation1881.26
Calcisols aRainfed991.06T (227): 0.8520.395
Irrigation1308.50
Cambisols abRainfed640.964U: 1,106,0000.741
Irrigation360.823
Mn
(mg kg−1)
2012Fluvisols aRainfedn.a.n.a.19866.8T (626): 2.6910.007
Irrigation43078.0
Luvisols aRainfed15261.2U: 11,837,0000.008
Irrigation18776.6
Calcisols bRainfed9948.3T (227): −1.2860.200
Irrigation13038.6
Cambisols aRainfed6470.1T (98): 0.4680.641
Irrigation3676.3
Ni
(mg kg−1)
2012Fluvisols cRainfedn.a.n.a.1960.840T (626): 0.0730.942
Irrigation4291.079
Luvisols bRainfed1501.944T (338): 0.7390.460
Irrigation1872.337
Calcisols aRainfed982.650T (227): 0.8360.404
Irrigation1292.421
Cambisols cRainfed630.958U: 784,5000.011
Irrigation361.608
RSG: reference soil group; CS: cultivation system; N: number of the samples; MAI: minimal anthropogenic input; HAI: heavy anthropogenic input; X: Pearson’s Chi-square test; T: two-sample T-test; U: Mann–Whitney U test; X2: Kruskal–Wallis test; p: p value. Different columnar letters indicate significant differences (p < 0.05).
Table 3. Bioavailability of metal cations in uncontaminated soils for plants and soil invertebrates, depending on soil pH and SOM.
RSGCSNpHSOM
(%)
Bioavailability *Study Area
(ha)(%)
FluvisolsRainfed1966.501.48High676145.5
Irrigation4306.631.11High
LuvisolsRainfed1457.101.52Medium446530.1
Irrigation1897.291.22Medium
CalcisolsRainfed997.971.65Medium280818.9
Irrigation1328.061.46Medium
CambisolsRainfed596.361.42High8185.50
Irrigation366.391.35High
* Adapted from Fairbrother et al. [47]. Bioavailability ranges from very low, low, medium, high, and very high; CS: cultivation system; N: number of the samples.
Publisher’s Note: MDPI stays neutral with regard to jurisdictional claims in published maps and institutional affiliations.