
Comparative Characterization of Eastern Carrot Accessions for Some Main Agricultural Traits

 ,
,  ,
, 


Abstract
1. Introduction
2. Materials and Methods
2.1. Plant Material and Germination Indices In Vitro
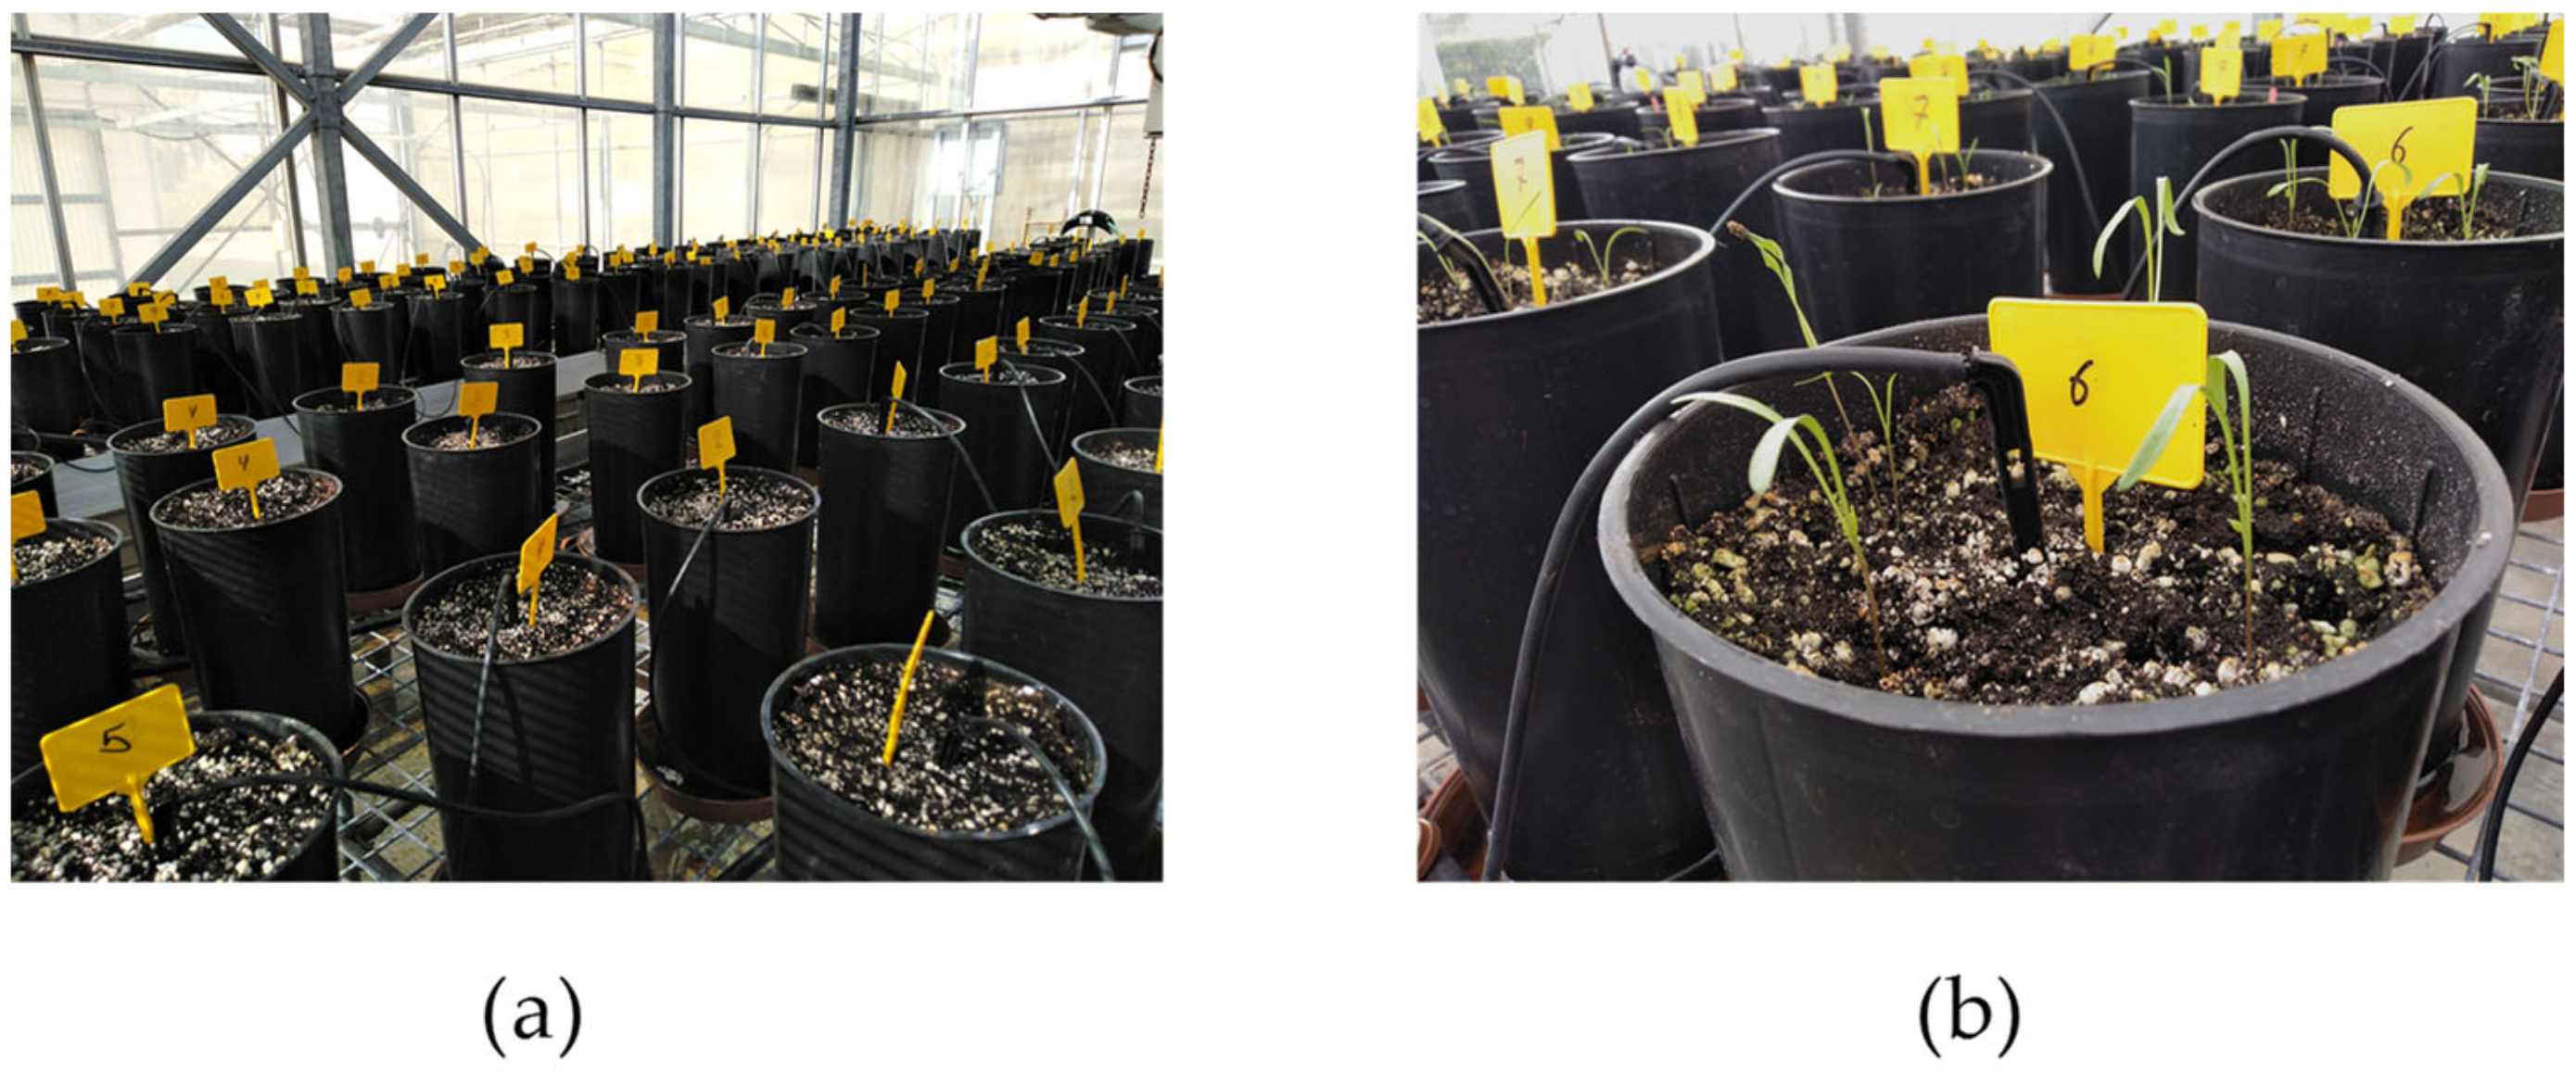
2.2. Glasshouse Cultivation
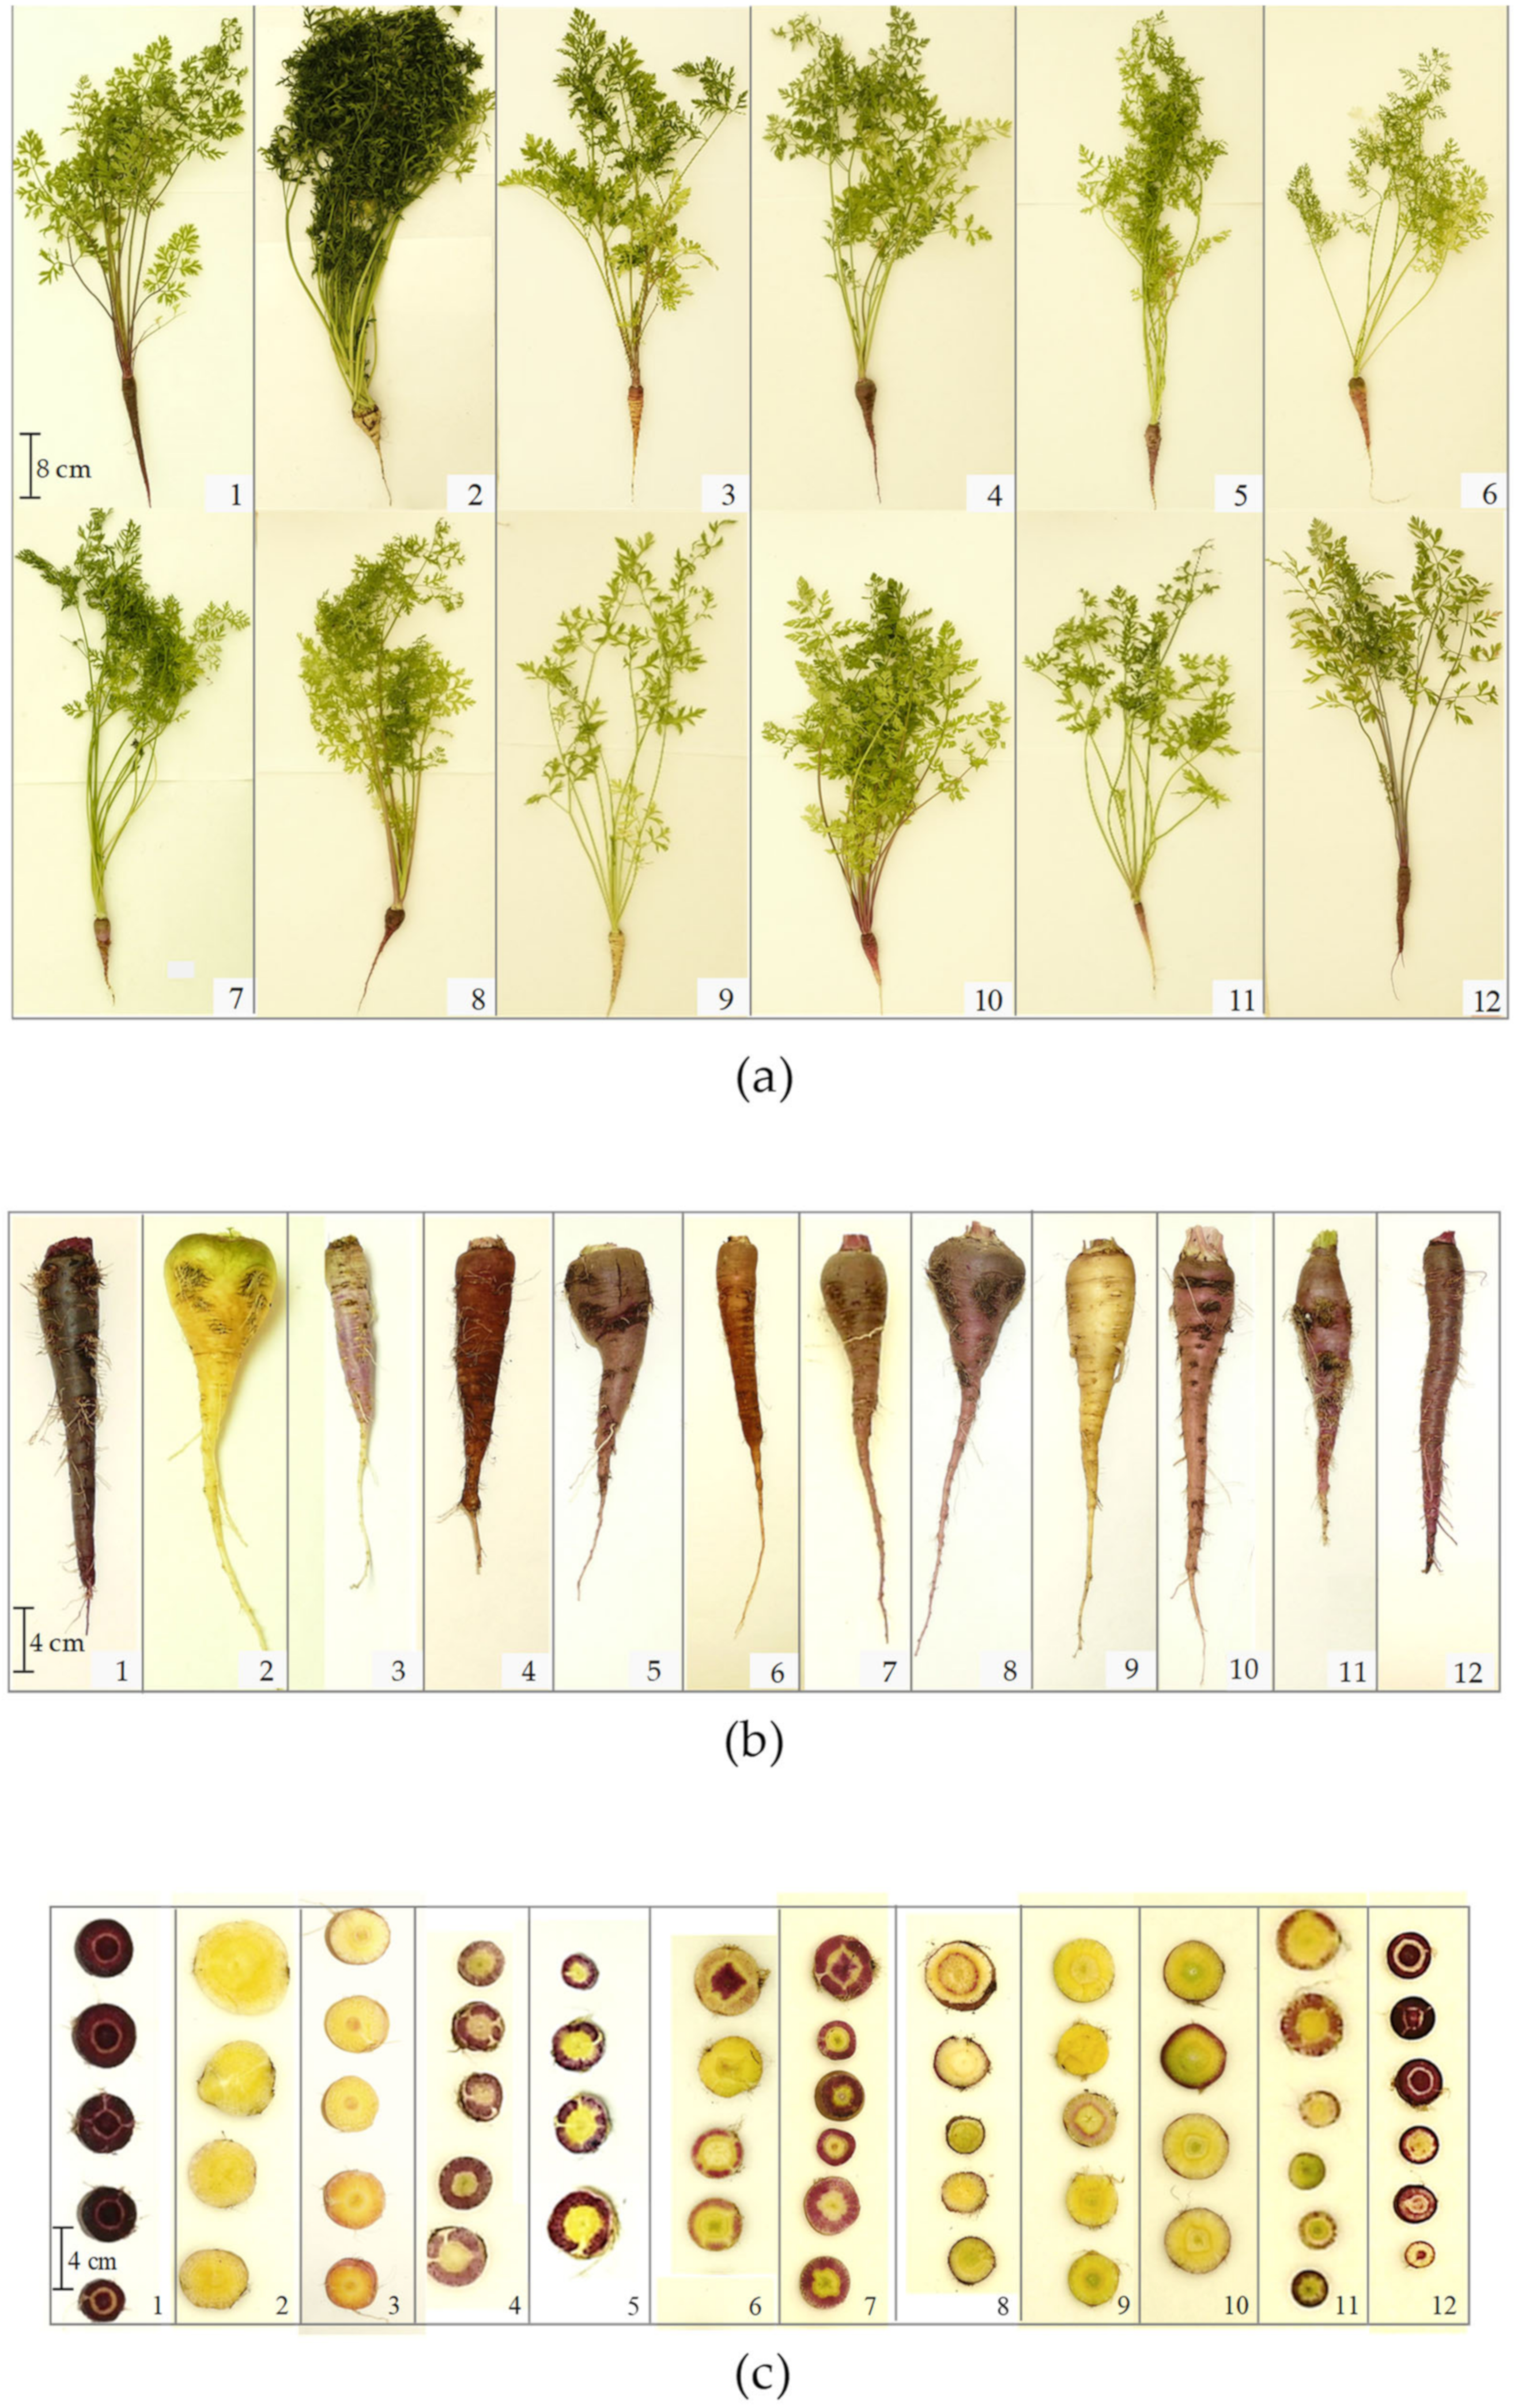
2.3. Harvest, Sample Collection, Growth Measurements and Processing
2.4. Determination of Dry Matter and Nutrient Analysis
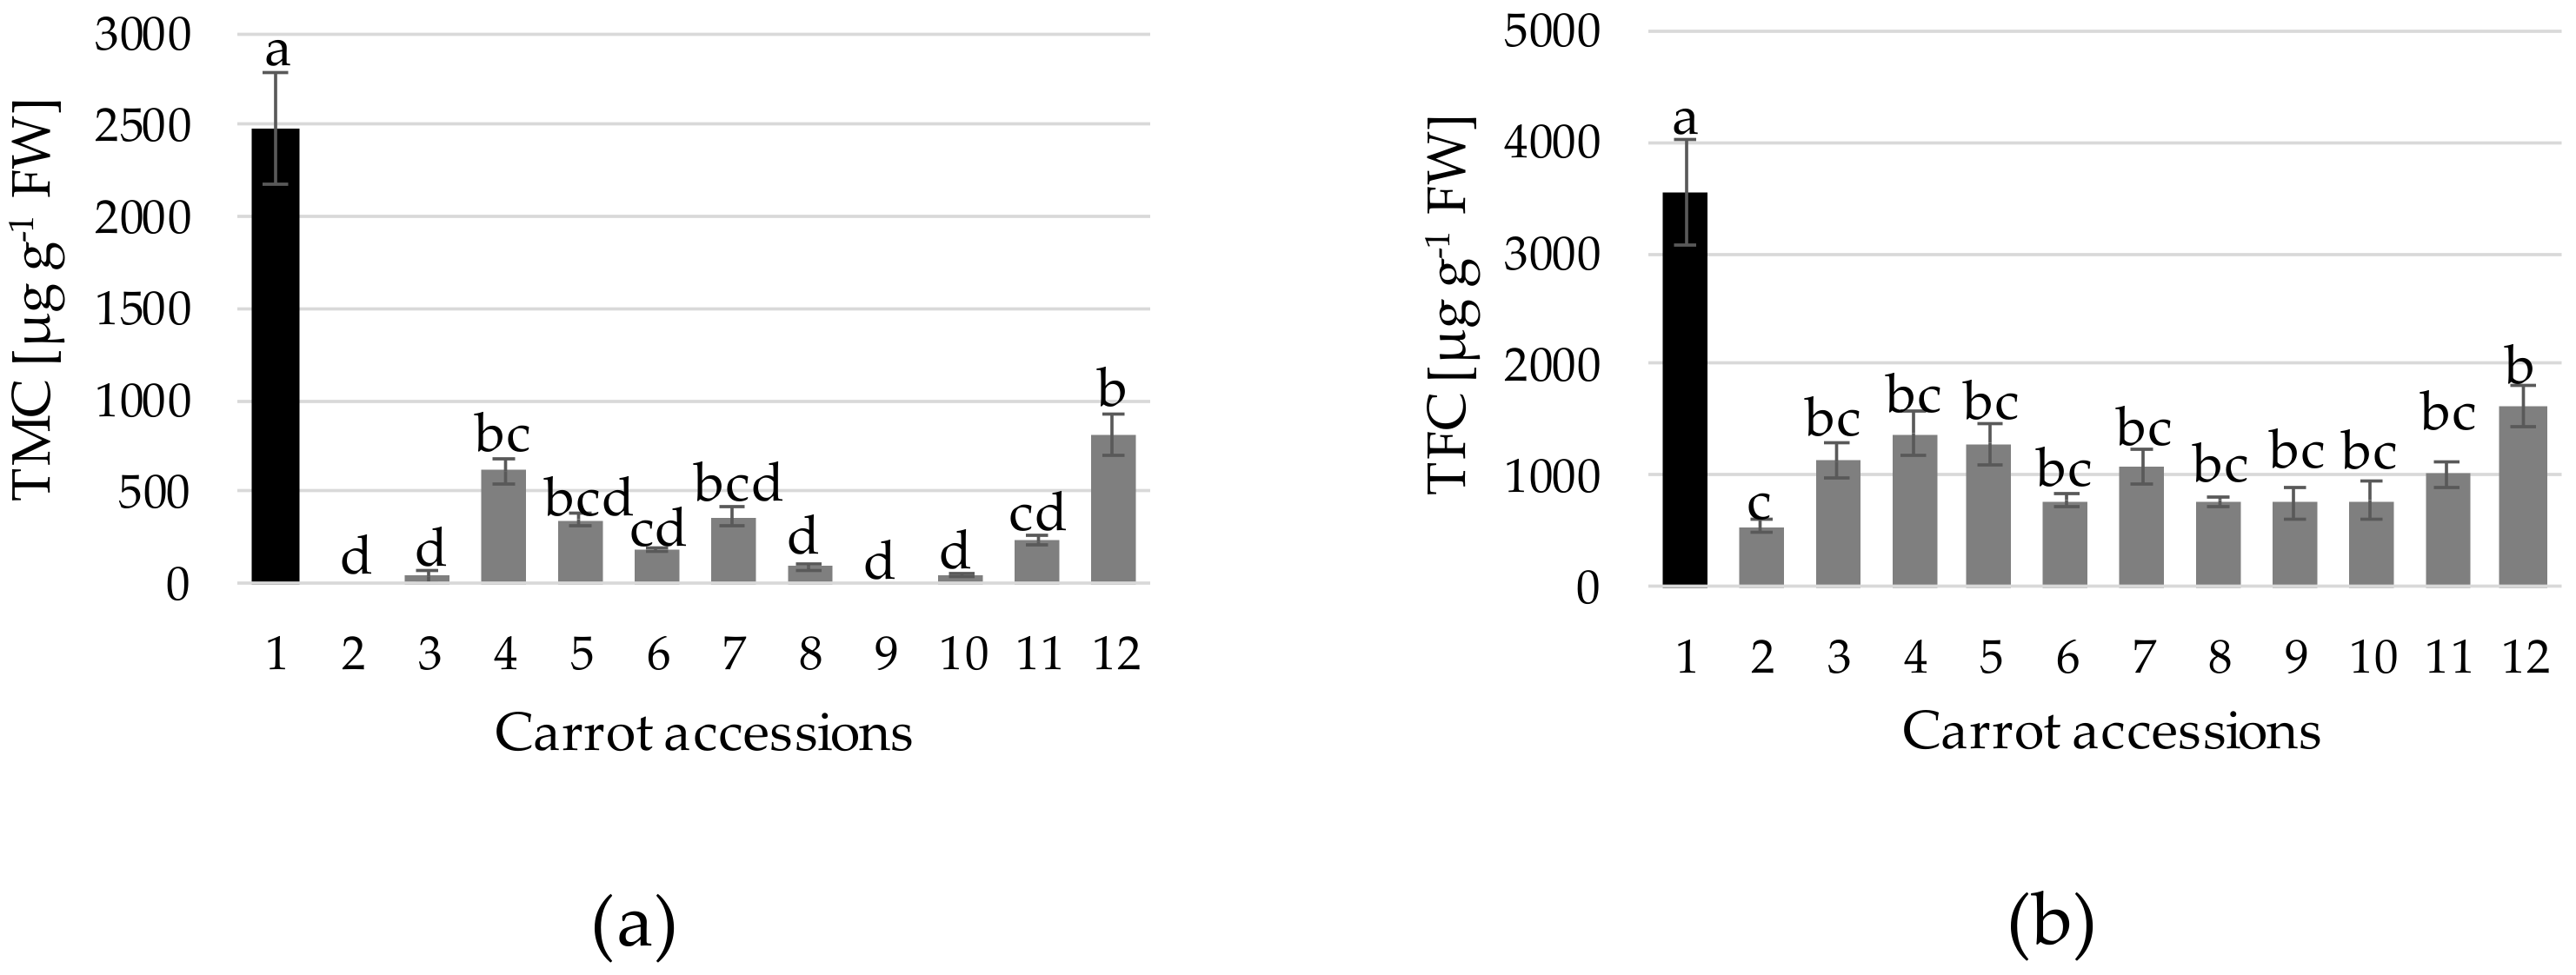
2.5. Determination of Total Monomeric Anthocyanin Content (TMC) and Total Flavonoid Content (TFC)
2.6. Statistical Analyses
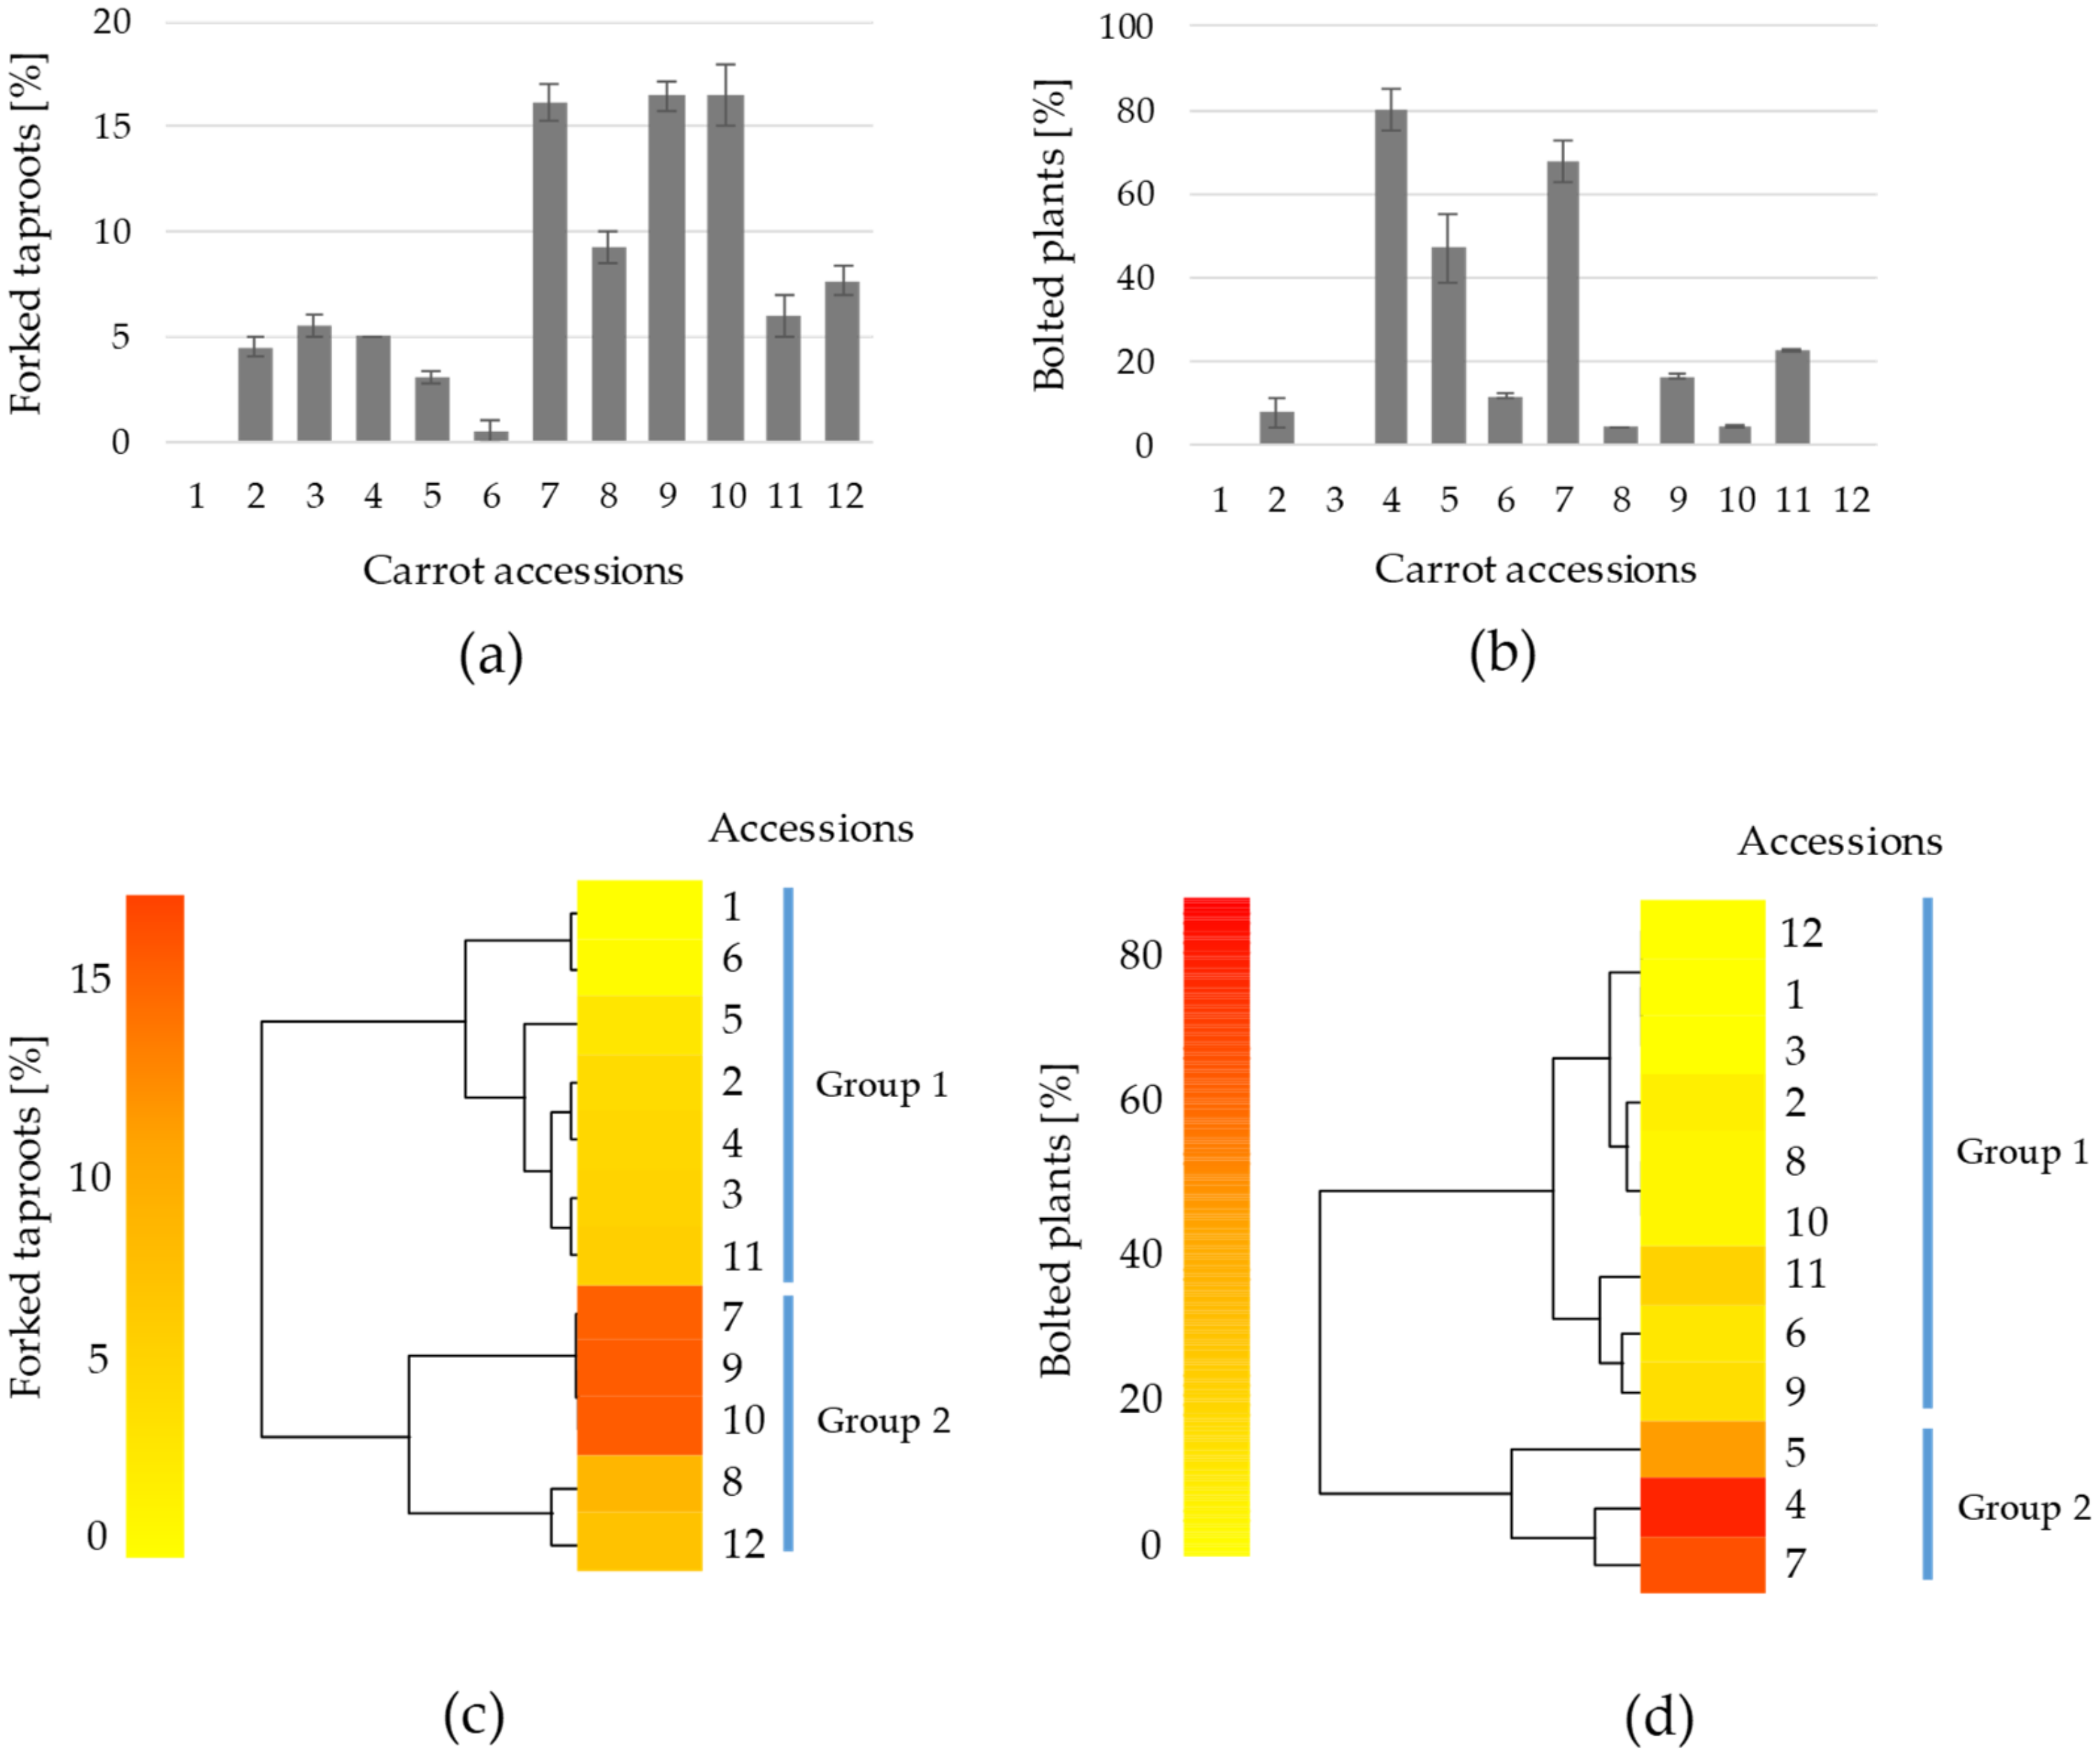
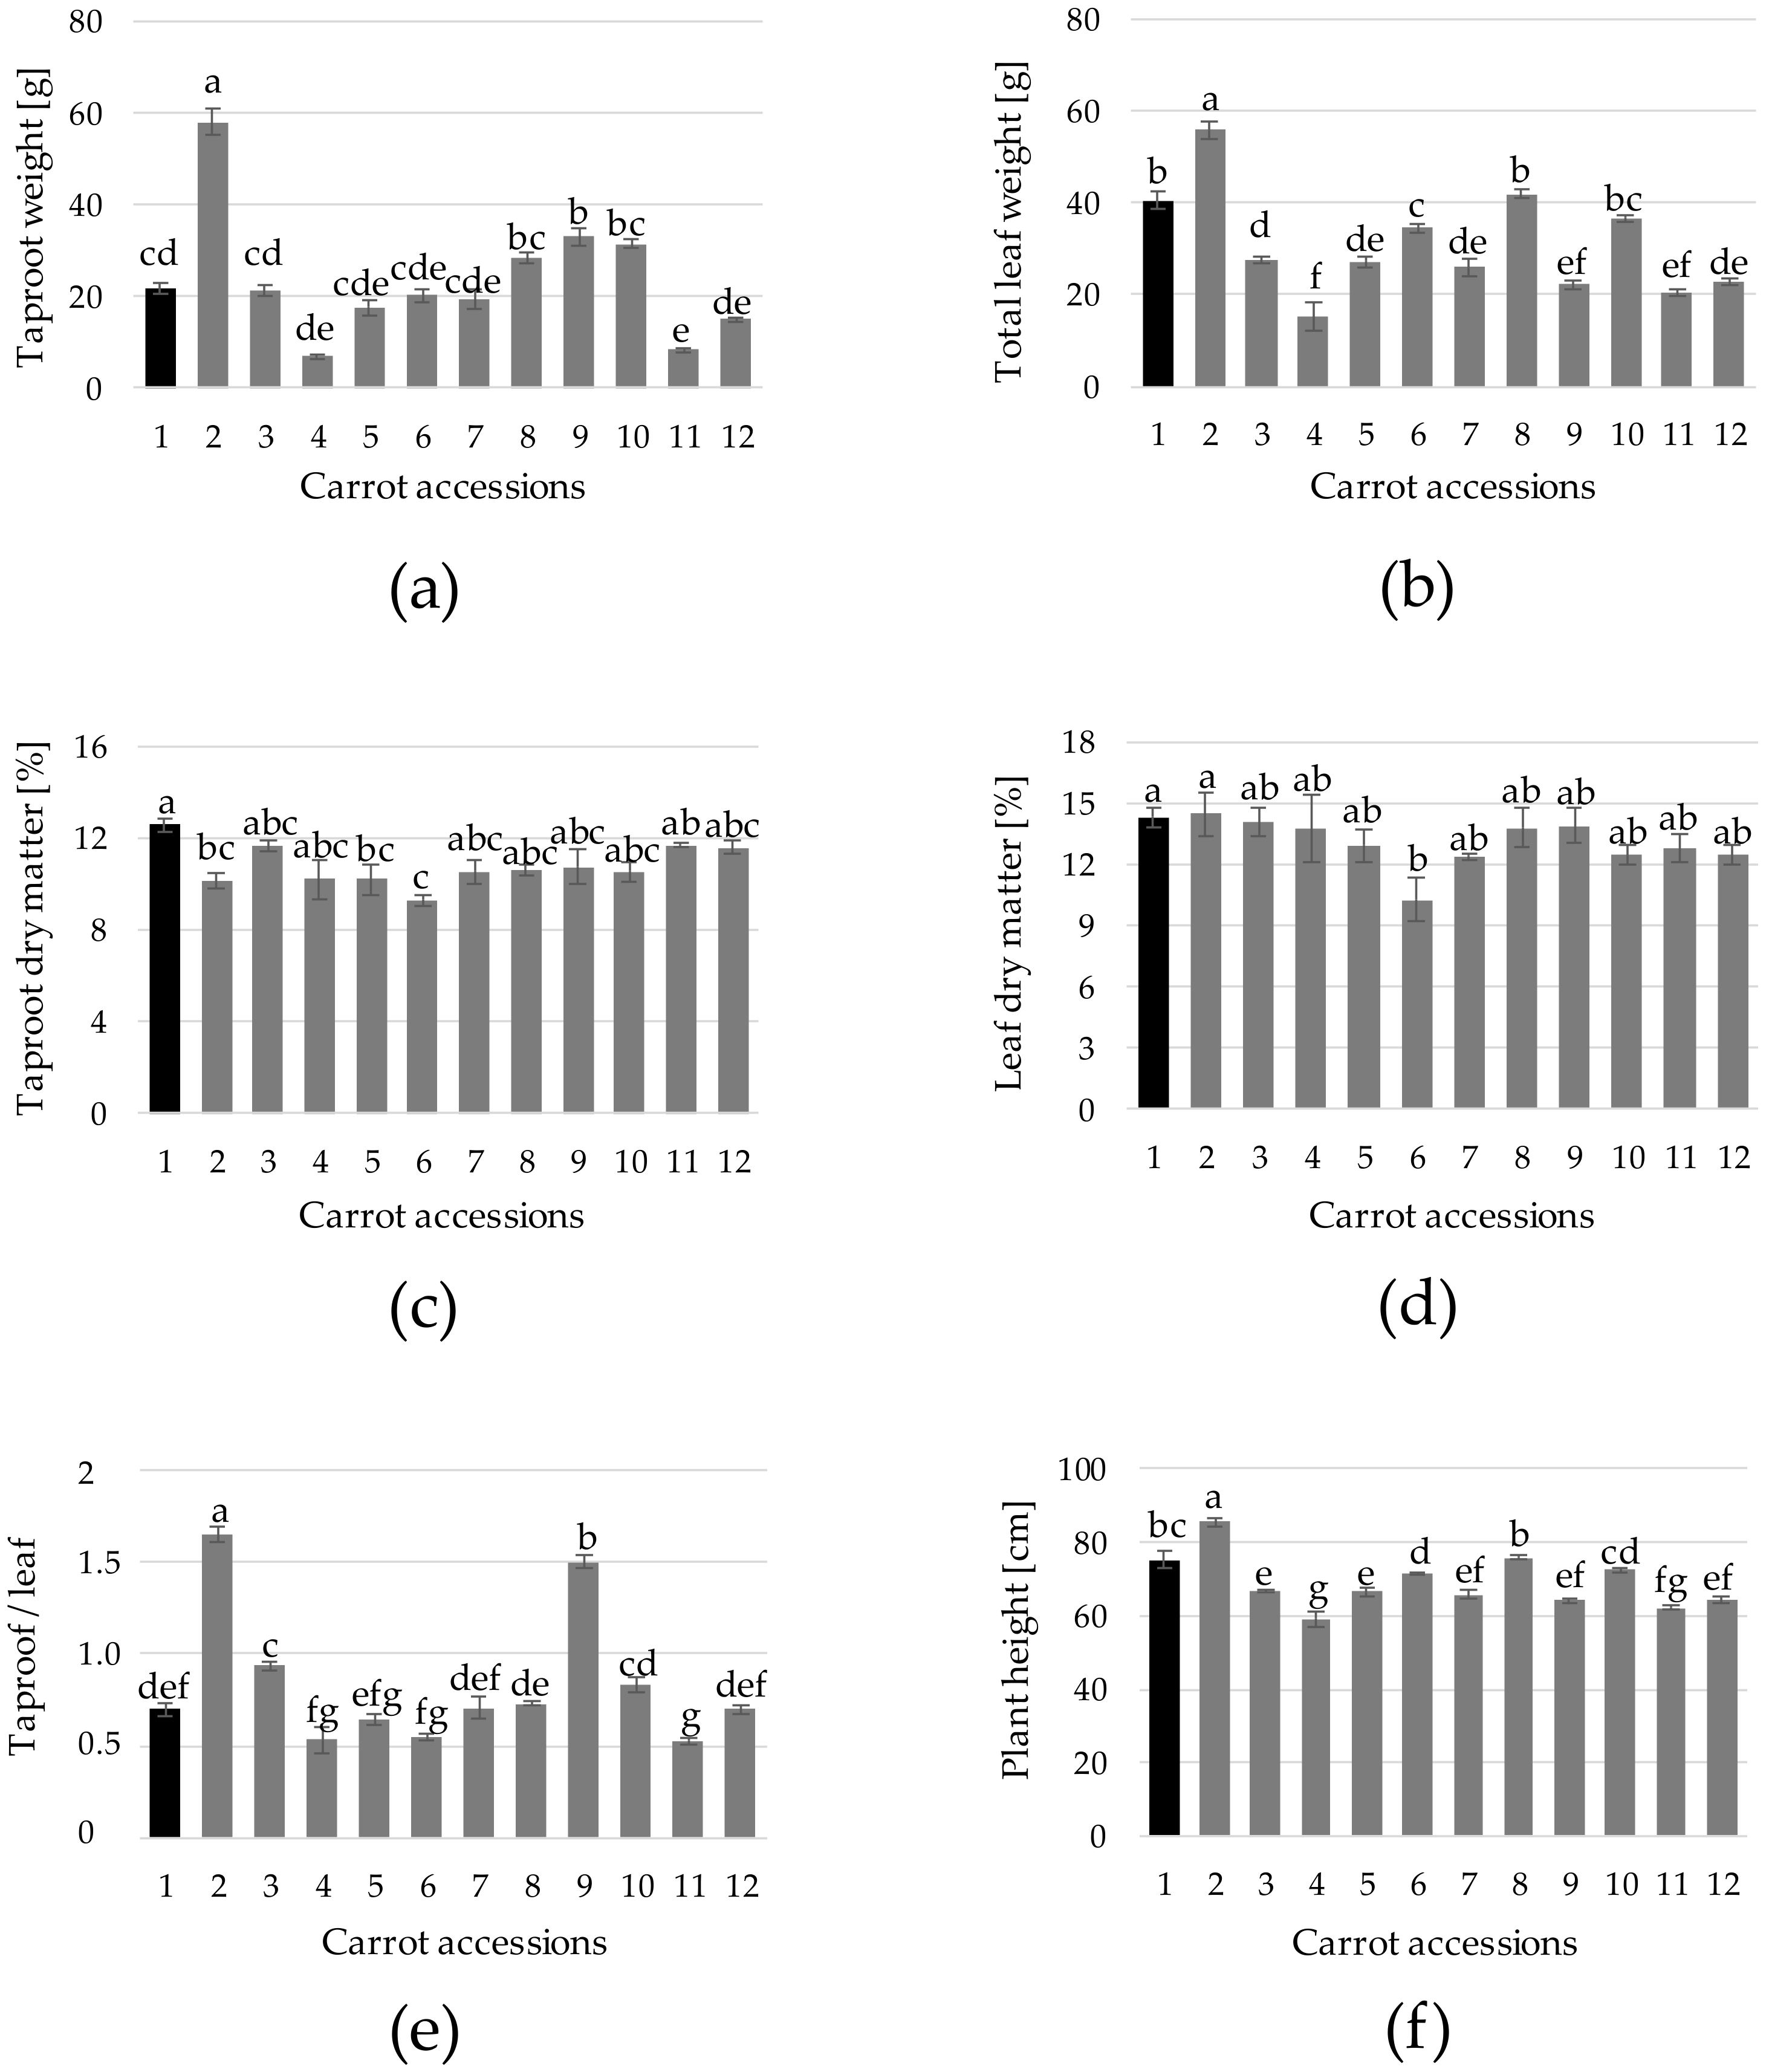
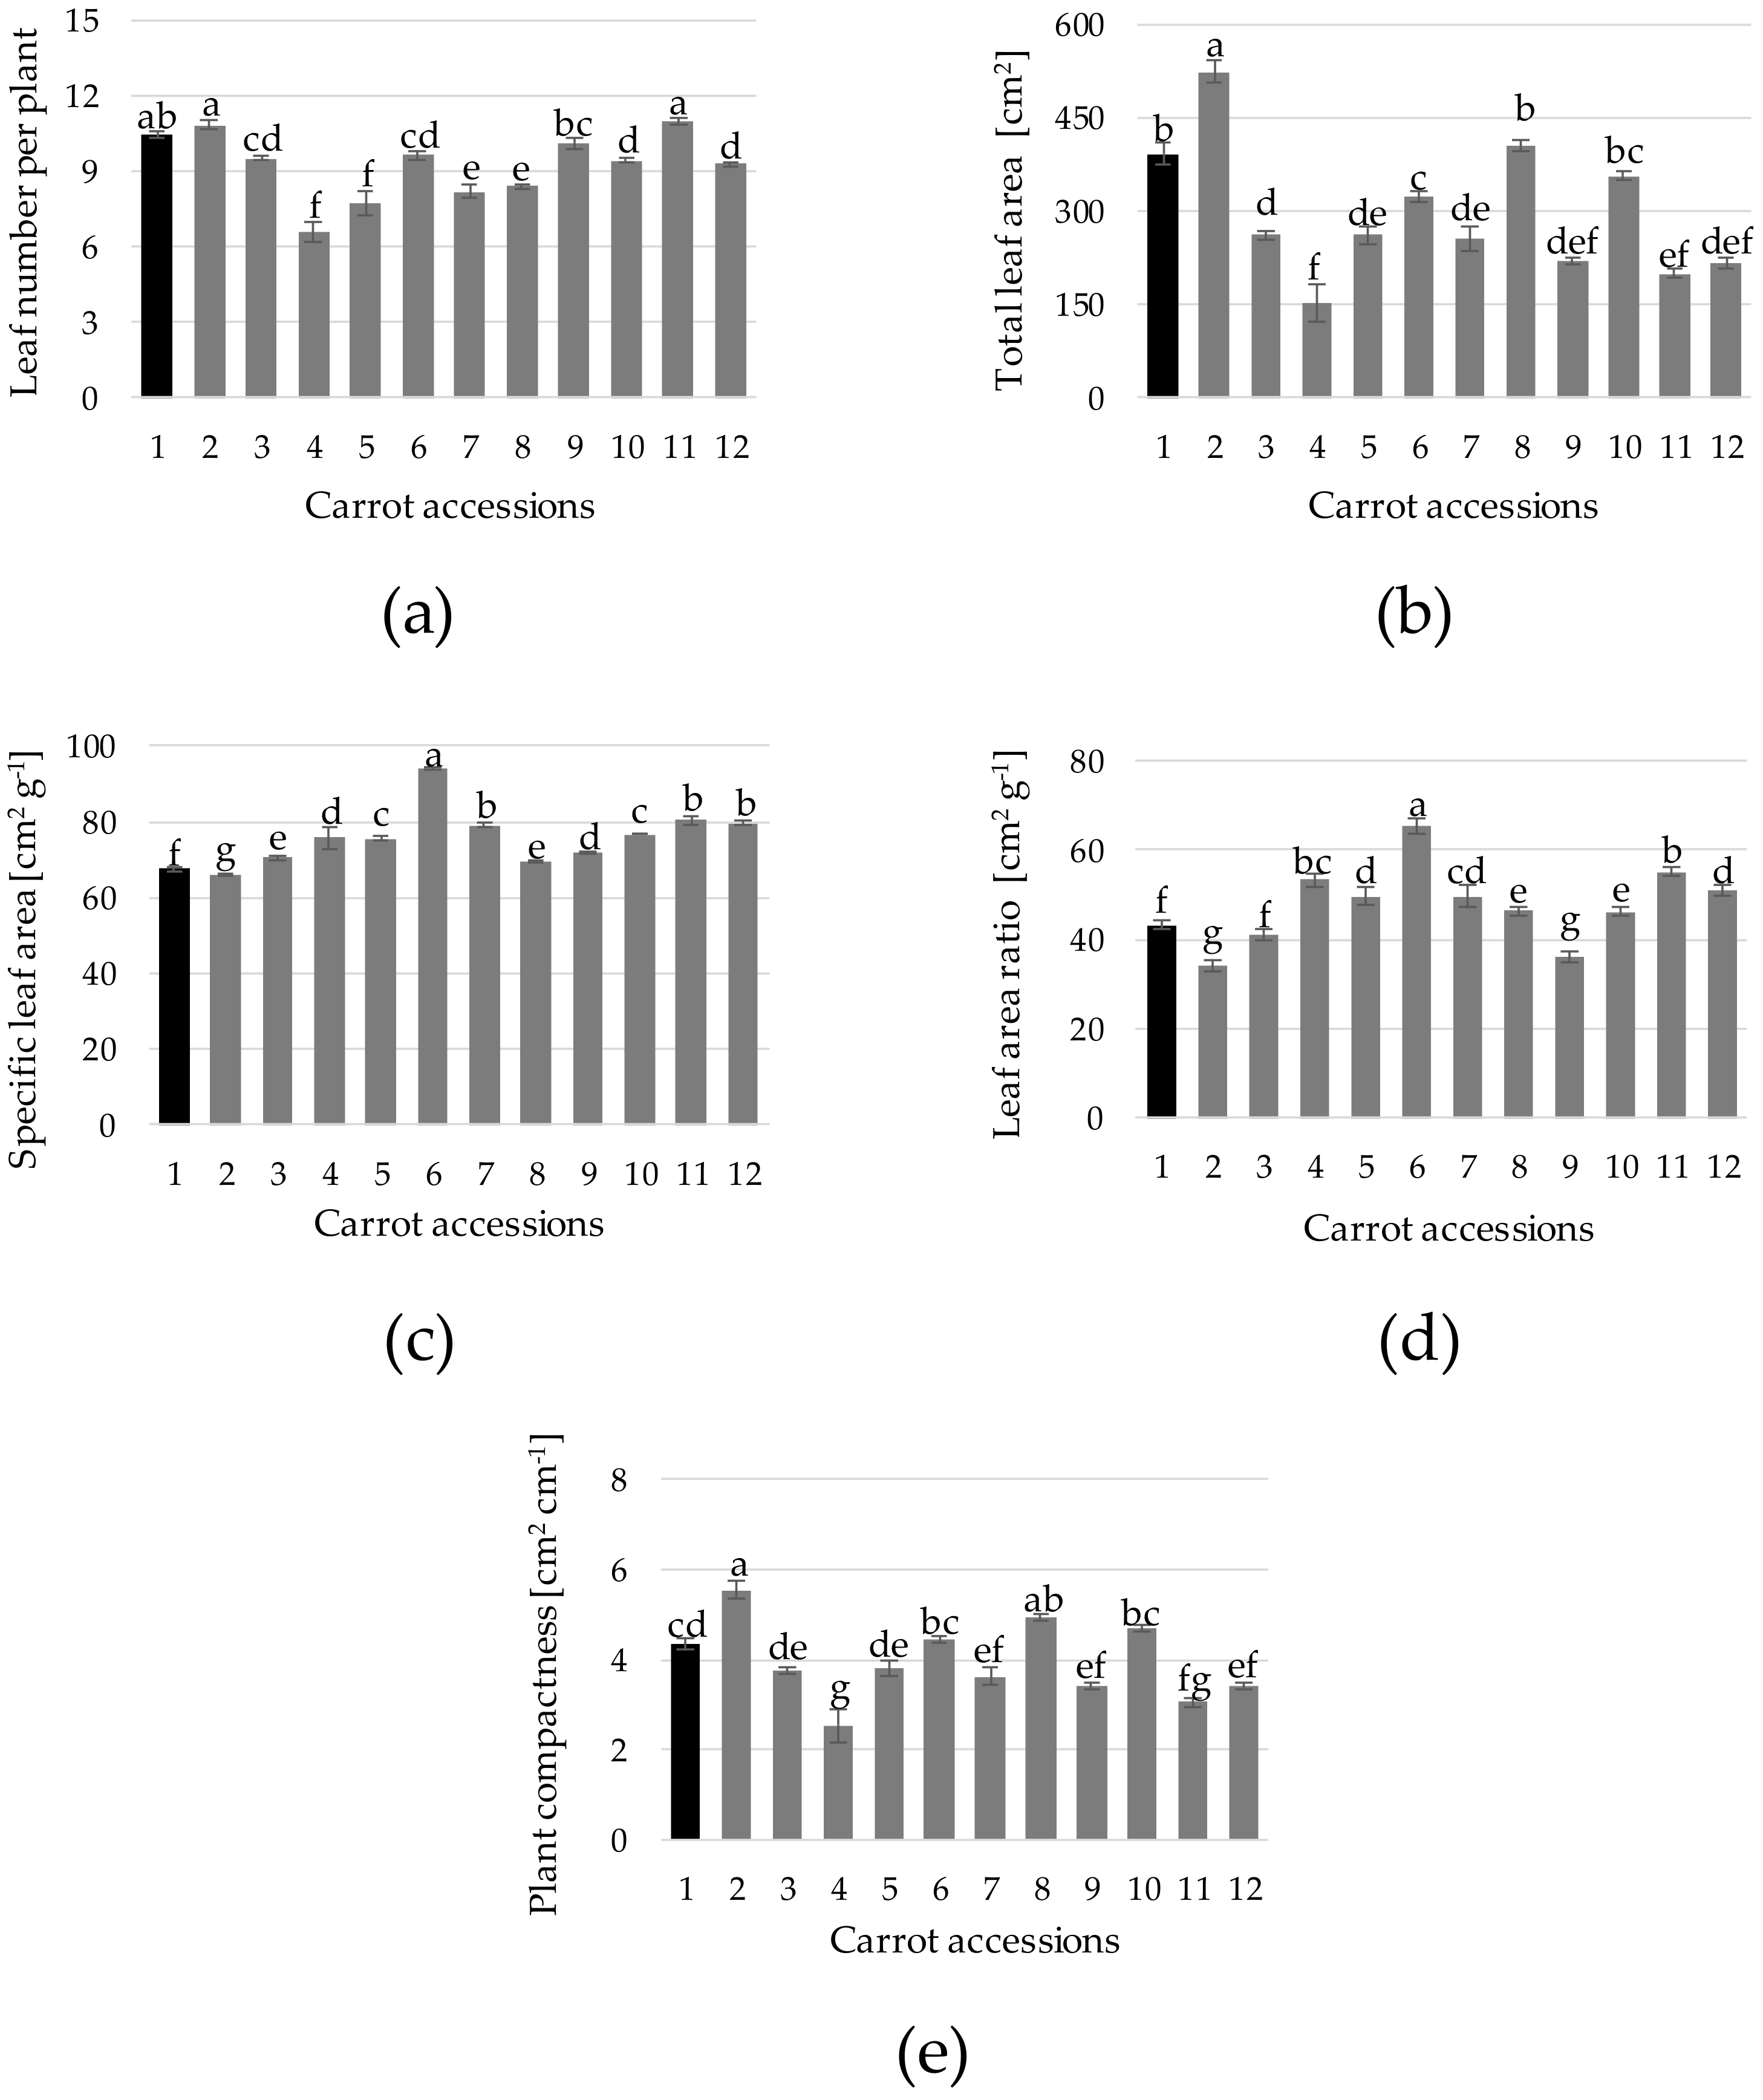
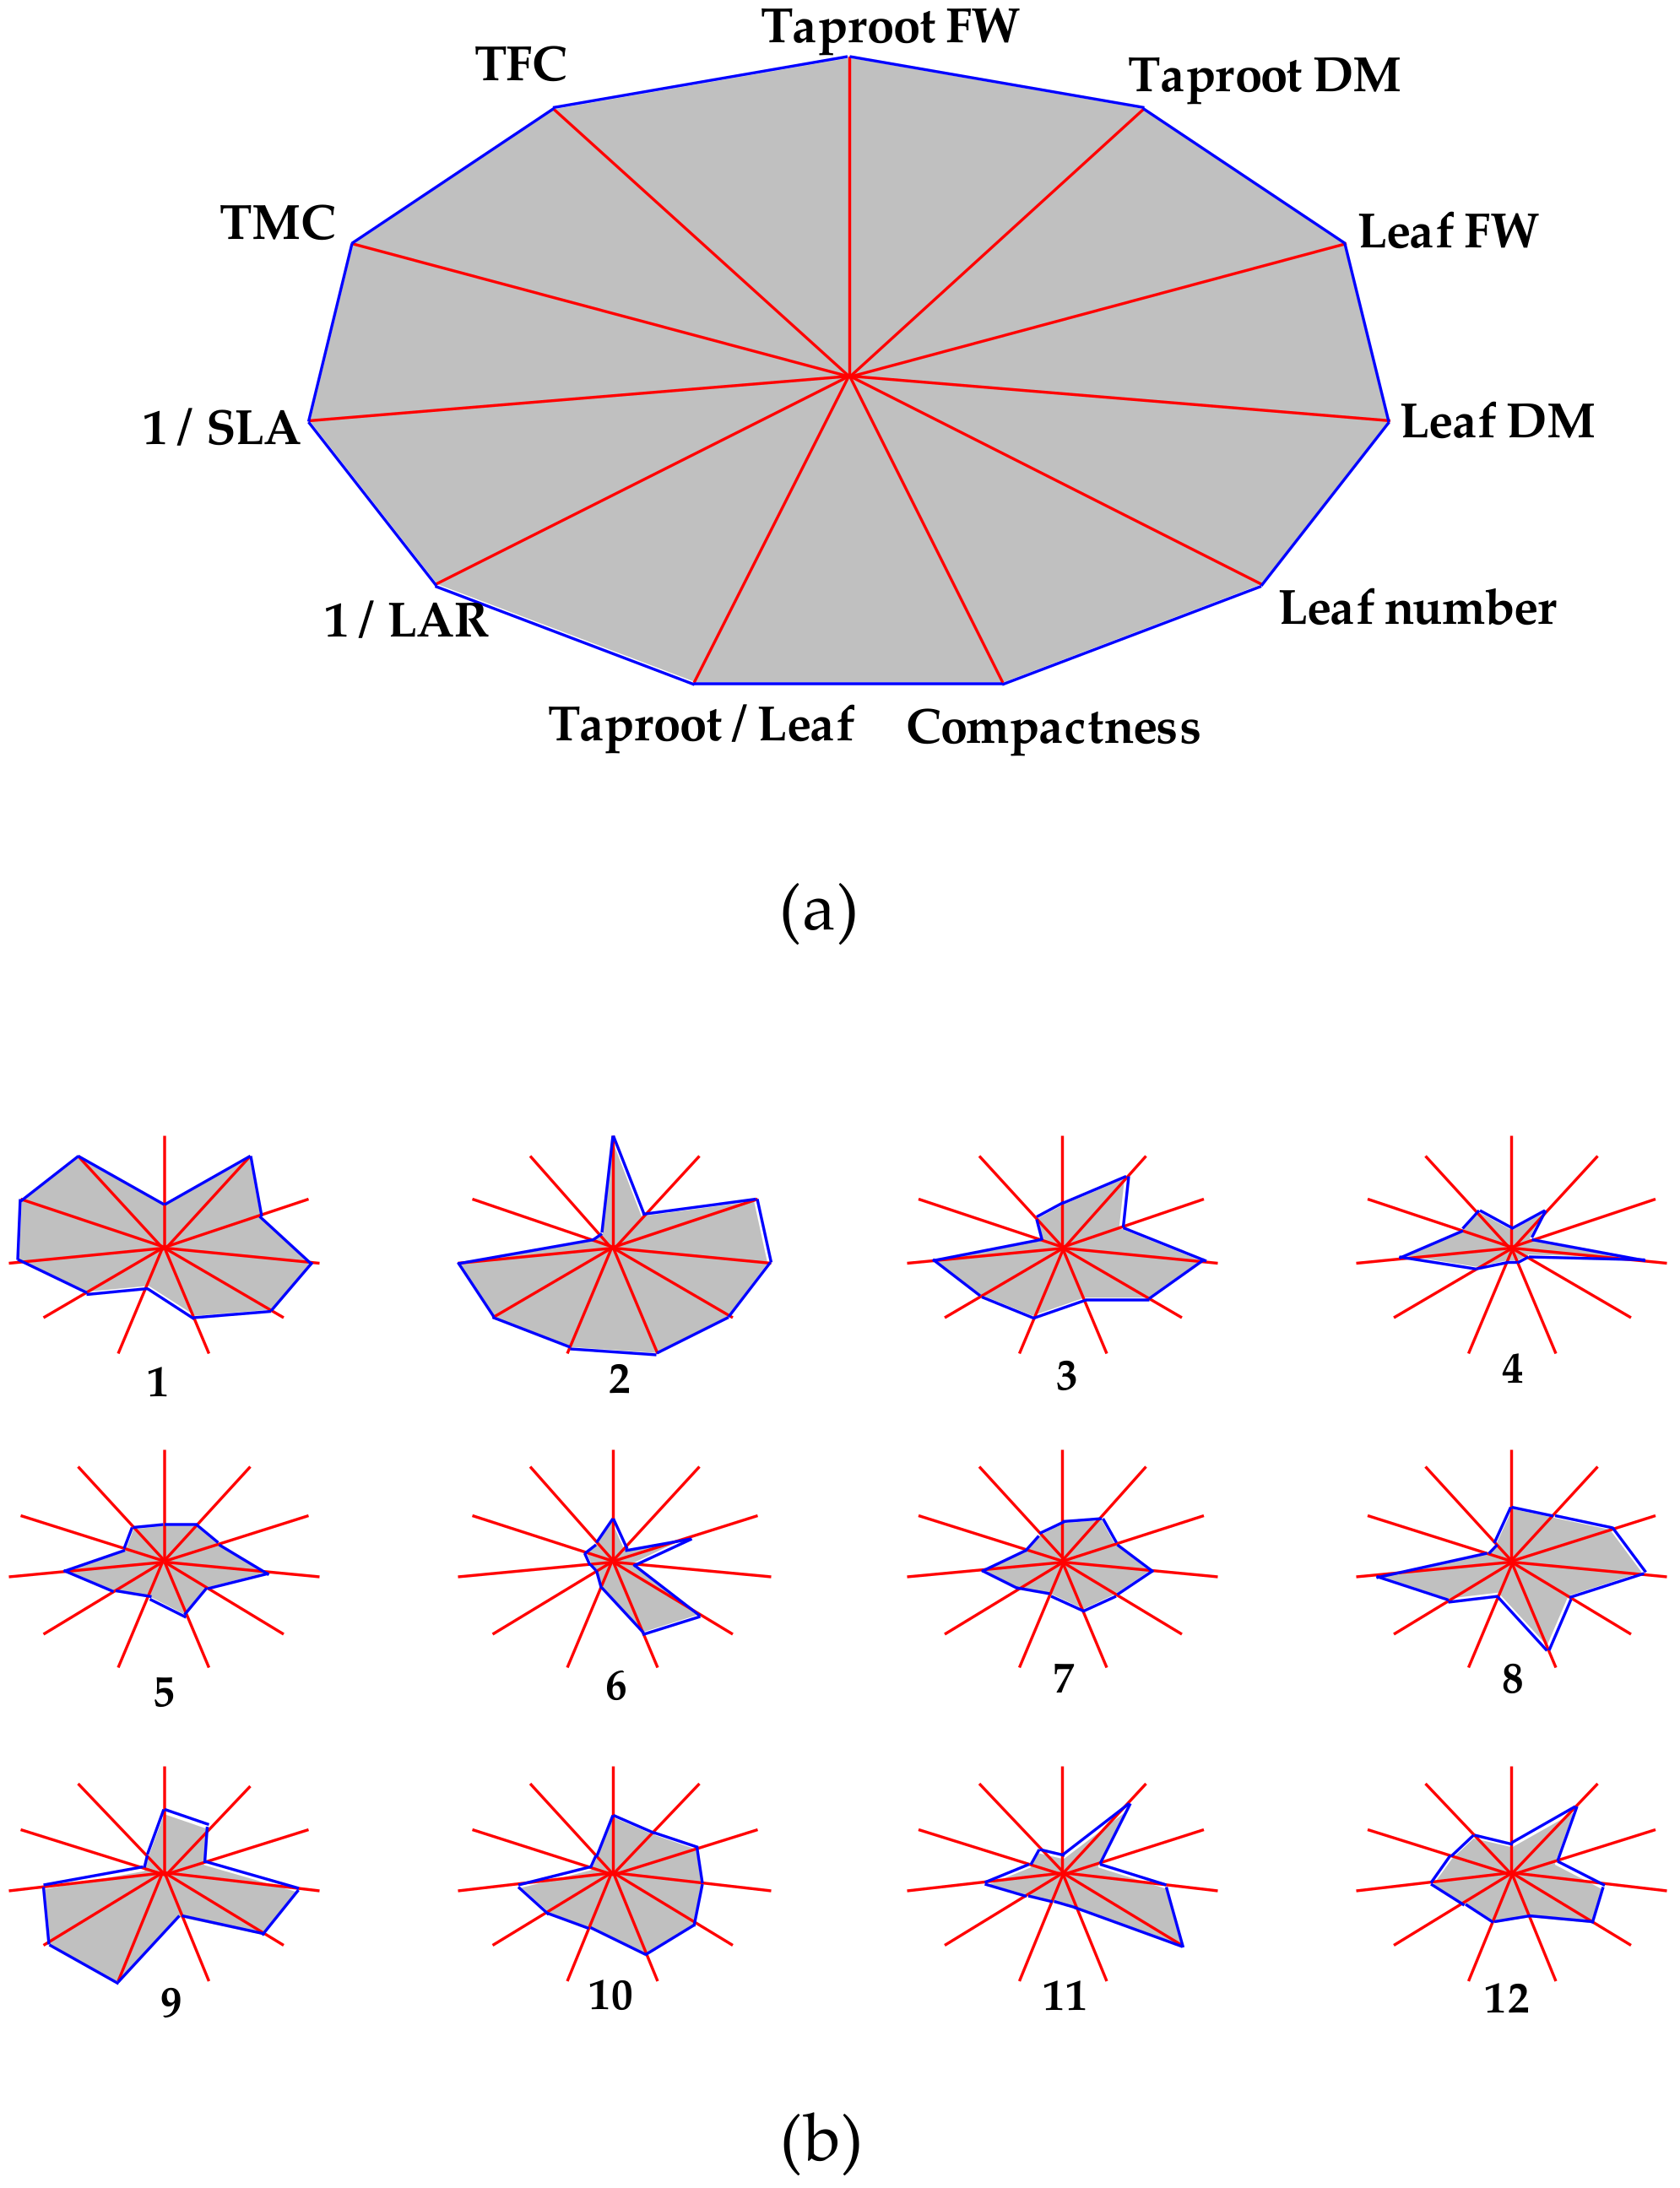
3. Results and Discussion
4. Conclusions
Author Contributions
Funding
Data Availability Statement
Acknowledgments
Conflicts of Interest
References
- Iorizzo, M.; Ellison, S.; Senalik, D.; Zeng, P.; Satapoomin, P.; Huang, J.; Bowman, M.; Iovene, M.; Sanseverino, W.; Cavagnaro, P.; et al. A high-quality carrot genome assembly provides new insights into carotenoid accumulation and asterid genome evolution. Nat. Genet. 2016, 48, 657–666. [Google Scholar] [CrossRef] [PubMed]
- Bolton, A.; Klimek-Chodacka, M.; Martin-Millar, E.; Grzebelus, D.; Simon, P.W. Genome-Assisted Improvement Strategies for Climate-Resilient Carrots. In Genomic Designing of Climate-Smart Vegetable Crops; Springer International Publishing: Cham, Switzerland, 2020. [Google Scholar]
- Iorizzo, M.; Senalik, D.A.; Ellison, S.L.; Grzebelus, D.; Cavagnaro, P.F.; Allender, C.; Brunet, J.; Spooner, D.M.; Van Deynze, A.; Simon, P.W. Genetic structure and domestication of carrot (Daucus carota subsp. sativus) (Apiaceae) 1. Am. J. Bot. 2013, 100, 930–938. [Google Scholar] [CrossRef]
- Simon, P.W. Economic and Academic Importance. In The Carrot Genome. Compendium of Plant Genomes; Simon, P., Iorizzo, M., Grzebelus, D., Baranski, R., Eds.; Springer: New York, NY, USA, 2019; pp. 1–8. [Google Scholar]
- Giusti, M.M.; Wrolstad, R.E. Acylated anthocyanins from edible sources and their applications in food systems. Biochem. Eng. J. 2003, 14, 217–225. [Google Scholar] [CrossRef]
- Montilla, E.C.; Arzaba, M.R.; Hillebrand, S.; Winterhalter, P. Anthocyanin composition of black carrot (Daucus carota ssp. sativus var. atrorubens Alef.) Cultivars antonina, beta sweet, deep purple, and purple haze. J. Agric. Food Chem. 2011, 59, 3385–3390. [Google Scholar] [CrossRef] [PubMed]
- Algarra, M.; Fernandes, A.; Mateus, N.; de Freitas, V.; Esteves da Silva, J.C.G.; Casado, J. Anthocyanin profile and antioxidant capacity of black carrots (Daucus carota L. ssp. sativus var. atrorubens Alef.) from Cuevas Bajas, Spain. J. Food Compos. Anal. 2014, 33, 71–76. [Google Scholar] [CrossRef]
- Barba-Espín, G.; Glied, S.; Crocoll, C.; Dzhanfezova, T.; Joernsgaard, B.; Okkels, F.; Lütken, H.; Müller, R. Foliar-applied ethephon enhances the content of anthocyanin of black carrot roots (Daucus carota ssp. sativus var. atrorubens Alef.). BMC Plant Biol. 2017, 17, 70–80. [Google Scholar] [CrossRef]
- Müller, R.; Acosta-Motos, J.R.; Großkinsky, D.K.; Hernández, J.A.; Lütken, H.; Barba-Espin, G. UV-B exposure of black carrot (Daucus carota ssp. sativus var. atrorubens) plants promotes growth, accumulation of anthocyanin, and phenolic compounds. Agronomy 2019, 9, 323. [Google Scholar] [CrossRef]
- Dzhanfezova, T.; Barba-Espín, G.; Müller, R.; Joernsgaard, B.; Hegelund, J.N.; Madsen, B.; Larsen, D.H.; Martínez Vega, M.; Toldam-Andersen, T.B. Anthocyanin profile, antioxidant activity and total phenolic content of a strawberry (Fragaria × ananassa Duch) genetic resource collection. Food Biosci. 2020, 36, 100620. [Google Scholar] [CrossRef]
- McCann, D.; Barrett, A.; Cooper, A.; Crumpler, D.; Dalen, L.; Grimshaw, K.; Kitchin, E.; Lok, K.; Porteous, L.; Prince, E.; et al. Food additives and hyperactive behaviour in 3-year-old and 8/9-year-old children in the community: A randomised, double-blinded, placebo-controlled trial. Lancet 2007, 370, 1560–1567. [Google Scholar] [CrossRef]
- Carocho, M.; Barreiro, M.F.; Morales, P.; Ferreira, I.C.F.R. Adding molecules to food, pros and cons: A review on synthetic and natural food additives. Compr. Rev. Food Sci. Food Saf. 2014, 13, 377–399. [Google Scholar] [CrossRef]
- Akhtar, S.; Rauf, A.; Imran, M.; Qamar, M.; Riaz, M.; Mubarak, M.S. Black carrot (Daucus carota L.), dietary and health promoting perspectives of its polyphenols: A review. Trends Food Sci. Technol. 2017, 66, 36–47. [Google Scholar] [CrossRef]
- Smeriglio, A.; Denaro, M.; Barreca, D.; D’Angelo, V.; Germanò, M.P.; Trombetta, D. Polyphenolic profile and biological activities of black carrot crude extract (Daucus carota L. ssp. sativus var. atrorubens Alef.). Fitoterapia 2018, 124, 49–57. [Google Scholar] [CrossRef]
- Barba-Espin, G.; Nicolas, E.; Almansa, M.S.; Cantero-Navarro, E.; Albacete, A.; Hernández, J.A.; Díaz-Vivancos, P. Role of thioproline on seed germination: Interaction ROS-ABA and effects on antioxidative metabolism. Plant Physiol. Biochem. 2012, 59, 30–36. [Google Scholar] [CrossRef]
- Sharma, A.; Shahzad, B.; Rehman, A.; Bhardwaj, R.; Landi, M.; Zheng, B. Response of phenylpropanoid pathway and the role of polyphenols in plants under abiotic stress. Molecules 2019, 24, 2452. [Google Scholar] [CrossRef] [PubMed]
- Tak, Y.; Kumar, M. Phenolics: A Key Defence Secondary Metabolite to Counter Biotic Stress. In Plant Phenolics in Sustainable Agriculture; Springer: Singapore, 2020. [Google Scholar]
- Simon, P.W. Domestication, Historical Development, and Modern Breeding of Carrot. In Plant Breeding Reviews; Janick, J., Ed.; Wiley: New Jersey, NJ, USA, 2019; Volume 19, pp. 157–190. [Google Scholar]
- Aveling, T.A.S. Global standards in seed health testing. In Global Perspectives on the Health of Seeds and Plant Propagation Material; Springer: Dordrecht, The Netherlands, 2014; Volume 6. [Google Scholar]
- Asaduzzaman, M.; Kobayashi, Y.; Mondal, M.F.; Ban, T.; Matsubara, H.; Adachi, F.; Asao, T. Growing carrots hydroponically using perlite substrates. Sci. Hortic. 2013, 159, 113–121. [Google Scholar] [CrossRef]
- Barba-Espín, G.; Chen, S.-T.; Agnolet, S.; Hegelund, J.N.; Stanstrup, J.; Christensen, J.H.; Müller, R.; Lütken, H. Ethephon-induced changes in antioxidants and phenolic compounds in anthocyanin-producing black carrot hairy root cultures. J. Exp. Bot. 2020, 71, 7030–7045. [Google Scholar] [CrossRef]
- Ahmed, D.; Khan, M.M.; Saeed, R. Comparative analysis of phenolics, flavonoids, and antioxidant and antibacterial potential of methanolic, hexanic and aqueous extracts from Adiantum caudatum leaves. Antioxidants 2015, 4, 394. [Google Scholar] [CrossRef]
- Dessau, R.B.; Pipper, C.B. [’’R’’--project for statistical computing]. Ugeskr. Laeger 2008, 170, 328–330. [Google Scholar] [PubMed]
- Bolton, A.; Nijabat, A.; Mahmood-Ur-Rehman, M.; Naveed, N.H.; Majharul Mannan, A.T.M.; Ali, A.; Rahim, M.A.; Simon, P. Variation for Heat Tolerance during Seed Germination in Diverse Carrot [Daucus carota (L.)] Germplasm. HortScience 2019, 54, 1470–1476. [Google Scholar] [CrossRef]
- Hernández, J.A.; Diaz-Vivancos, P.; Barba-Espín, G.; Clemente-Moreno, M.J. On the role of salicylic acid in plant responses to environmental stresses. In Salicylic Acid: A Multifaceted Hormone; Springer: Singapore, 2017. [Google Scholar]
- Chen, C.; Ma, J.; Ma, J.; Ma, W.; Yang, J. Analysis of main agronomic traits in different varieties of carrots. J. Phys. Conf. Ser. 2020, 1549, 032053. [Google Scholar] [CrossRef]
- Sharma, R.; Agarwal, A.; Mamatha, H.R. Classification of carrots based on shape analysis using machine learning techniques. In Proceedings of the 3rd International Conference on Intelligent Communication Technologies and Virtual Mobile Networks, ICICV 2021, Tirunelveli, India, 4–6 February 2021. [Google Scholar]
- Iorizzo, M.; Curaba, J.; Pottorff, M.; Ferruzzi, M.G.; Simon, P.; Cavagnaro, P.F. Carrot anthocyanins genetics and genomics: Status and perspectives to improve its application for the food colorant industry. Genes 2020, 11, 906. [Google Scholar] [CrossRef] [PubMed]
- Bannoud, F.; Ellison, S.; Paolinelli, M.; Horejsi, T.; Senalik, D.; Fanzone, M.; Iorizzo, M.; Simon, P.W.; Cavagnaro, P.F. Dissecting the genetic control of root and leaf tissue-specific anthocyanin pigmentation in carrot (Daucus carota L.). Theor. Appl. Genet. 2019, 132, 2485–2507. [Google Scholar] [CrossRef] [PubMed]
- Xu, Z.S.; Yang, Q.Q.; Feng, K.; Xiong, A.S. Changing carrot color: Insertions in DcMYB7 alter the regulation of anthocyanin biosynthesis and modification. Plant Physiol. 2019, 181, 195–207. [Google Scholar] [CrossRef]
- Maksylewicz, A.; Baranski, R. Intra-population genetic diversity of cultivated carrot (Daucus carota L.) assessed by analysis of microsatellite markers. Acta Biochim. Pol. 2013, 60, 753–760. [Google Scholar] [CrossRef]
- Appiah, F.K.; Sarkodie-Addo, J.; Opoku, A. Quality of Carrot (Daucus Carota L.) As Influenced by Green Manure and Plant Spacing on Forest Ochrosols in Ghana. J. Biol. Agric. Healthc. 2017, 7, 36–44. [Google Scholar]
- Hussain, S.I.; Hadley, P.; Pearson, S. A validated mechanistic model of carrot (Daucus carota L.) growth. Sci. Hortic. 2008, 117, 26–31. [Google Scholar] [CrossRef]
- Colley, M. Organic carrot production. In Carrots and Related Apiaceae Crops; Geoffriau, E., Simon, P., Eds.; CABI: Boston, MA, USA, 2020; pp. 197–215. [Google Scholar]
- Aquino, R.F.B.A.; Assunção, N.S.; Aquino, L.A.; Aquino, P.M.D.; Oliveira, G.A.D.; Carvalho, A.M.X.D. Nutrient Demand by the Carrot Crop Is Influenced by the Cultivar. Rev. Bras. Ciência Solo 2015, 39, 541–552. [Google Scholar] [CrossRef][Green Version]
- Qi, Y.; Wei, W.; Chen, C.; Chen, L. Plant root-shoot biomass allocation over diverse biomes: A global synthesis. Glob. Ecol. Conserv. 2019, 18, e00606. [Google Scholar] [CrossRef]
- Suojala, T. Growth of and partitioning between shoot and storage root of carrot in a northern climate. Agric. Food Sci. Finl. 2000, 9, 49–59. [Google Scholar] [CrossRef]
- Forbes, J.C.; Watson, R.D. Plants in Agriculture; Cambridge University Press: Cambridge, UK, 1992. [Google Scholar] [CrossRef]
- Vega Rojas, T.; Soto, C.M.; Montero, W.R. Análisis del crecimiento de cinco híbridos de zanahoria (Daucus carota L.) mediante la metodología del análisis funcional. Agron. Costarric. 2012, 36, 29–46. [Google Scholar] [CrossRef]
- Clautilde, M.; Lucien, T.; Eric, N.; Abba, M.; Hamadou, B. Field Productivity of Carrot (Daucus carota L.) in Adamawa Cameroon and Chemical Properties of Roots According To Chicken Manure Pretreatments and Vivianite Powder. IOSR J. Agric. Vet. Sci. 2017, 10, 16–23. [Google Scholar] [CrossRef]
- Blackman, G.E.; Evans, G.C. The Quantitative Analysis of Plant Growth. J. Ecol. 1973, 61, 617–619. [Google Scholar] [CrossRef]
- Kimball, B.A.; Kobayashi, K.; Bindi, M. Responses of agricultural crops to free-air CO2 enrichment. Adv. Agron. 2002, 77, 293–368. [Google Scholar] [CrossRef]
- Singh, B.K.; Koley, T.K.; Maurya, A.; Singh, P.M.; Singh, B. Phytochemical and antioxidative potential of orange, red, yellow, rainbow and black coloured tropical carrots (Daucus carota subsp. sativus Schubl. & Martens). Physiol. Mol. Biol. Plants 2018, 24, 899–907. [Google Scholar] [CrossRef]
- Dimitrić Marković, J.M.; Milenković, D.; Amić, D.; Popović-Bijelić, A.; Mojović, M.; Pašti, I.A.; Marković, Z.S. Energy requirements of the reactions of kaempferol and selected radical species in different media: Towards the prediction of the possible radical scavenging mechanisms. Struct. Chem. 2014, 25, 1795–1804. [Google Scholar] [CrossRef]
- Cavagnaro, P.F.; Bannoud, F.; Iorizzo, M.; Senalik, D.; Ellison, S.L.; Simon, P.W. Carrot anthocyanins: Nutrition, diversity and genetics. Acta Hortic. 2019, 1264, 101–106. [Google Scholar] [CrossRef]
- Sharma, K.D.; Karki, S.; Thakur, N.S.; Attri, S. Chemical composition, functional properties and processing of carrot—A review. J. Food Sci. Technol. 2012, 49, 22–32. [Google Scholar] [CrossRef]
- Que, F.; Hou, X.L.; Wang, G.L.; Xu, Z.S.; Tan, G.F.; Li, T.; Wang, Y.H.; Khadr, A.; Xiong, A.S. Advances in research on the carrot, an important root vegetable in the Apiaceae family. Hortic. Res. 2019, 6, 1–15. [Google Scholar] [CrossRef]
- Nicolle, C.; Simon, G.; Rock, E.; Amouroux, P.; Rémésy, C. Genetic variability influences carotenoid, vitamin, phenolic, and mineral content in white, yellow, purple, orange, and dark-orange carrot cultivars. J. Am. Soc. Hortic. Sci. 2004, 129, 523–529. [Google Scholar] [CrossRef]
- Goneim, G.; Ibrahim, F.; El-Shehawy, S. Carrot Leaves: Antioxidative and Nutritive Values. J. Food Dairy Sci. 2011, 2, 1–9. [Google Scholar] [CrossRef]
- Warman, P.R.; Havard, K.A. Yield, vitamin and mineral contents of organically and conventionally grown carrots and cabbage. Agric. Ecosyst. Environ. 1997, 61, 155–162. [Google Scholar] [CrossRef]
- Smoleń, S.; Rozek, S.; Strzetelski, P.; Ledwozyw-Smoleń, I. Preliminary evaluation of the influence of soil fertilization and foliar nutrition with iodine on the effectiveness of iodine biofortification and mineral composition of carrot. J. Elem. 2011, 16, 103–114. [Google Scholar] [CrossRef]
- Broadley, M.; Brown, P.; Cakmak, I.; Rengel, Z.; Zhao, F. Function of Nutrients: Micronutrients. In Marschner’s Mineral Nutrition of Higher Plants, 3rd ed.; Petra Marschner: Adelaide, GA, USA, 2011. [Google Scholar]
- Griffiths, M.; Roy, S.; Guo, H.; Seethepalli, A.; Huhman, D.; Ge, Y.; Sharp, R.E.; Fritschi, F.B.; York, L.M. A multiple ion-uptake phenotyping platform reveals shared mechanisms affecting nutrient uptake by roots. Plant Physiol. 2021, 185, 781–795. [Google Scholar] [CrossRef] [PubMed]
- Niedziela, C.E.; Nelson, P.V.; Dickey, D.A. Growth, Development, and Mineral Nutrient Accumulation and Distribution in Tulip from Planting through Postanthesis Shoot Senescence. Int. J. Agron. 2015, 2015, 1–11. [Google Scholar] [CrossRef]


| Source | Number | Accession | Origin | Life Form | Improvement Status |
|---|---|---|---|---|---|
| USDA | 2 | 179689 | India | Biennial | Landrace |
| 3 | 211024 | Afghanistan | n.d. | Landrace | |
| 4 | 269486 | Pakistan | n.d. | Landrace | |
| 5 | 279776 | Egypt | n.d. | Landrace | |
| 6 | 279777 | Egypt | Annual/biennial | Landrace | |
| 7 | 288242 | Egypt | n.d. | Landrace | |
| Warwick | 8 | 006753 | India | n.d. | Advanced cultivar |
| 9 | 010156 | India | Annual | Landrace | |
| 10 | 10225 | India | Annual/biennial | Landrace | |
| 11 | 10217 | Turkey | n.d. | Landrace | |
| 12 | 13879 | n.d. | n.d. | Landrace |
| Accession n. | Germination Percentage [%] | Seedling Vigour Index | Speed of Emergence |
|---|---|---|---|
| 1 | 81 | 8.67 | 2.8 |
| 2 | 92 | 11.32 | 3.45 |
| 3 | 84 | 10.00 | 2.94 |
| 4 | 71 | 4.40 | 1.8 |
| 5 | 81 | 9.48 | 2.31 |
| 6 | 74 | 6.96 | 1.52 |
| 7 | 83 | 8.96 | 2.52 |
| 8 | 79 | 6.95 | 2.2 |
| 9 | 61 | 5.25 | 1.05 |
| 10 | 79 | 6.64 | 1.6 |
| 11 | 84 | 6.30 | 1.89 |
| 12 | 96 | 7.10 | 2.16 |
| Macronutrient [g/100 g DW] | ||||||||||||
|---|---|---|---|---|---|---|---|---|---|---|---|---|
| Acc. | K | Ca | Na | S | P | Mg | ||||||
| T | L | T | L | T | L | T | L | T | L | T | L | |
| 1 | 1.51 ab | 3.38 abc | 0.27 b | 2.84 a | 0.73 bc | 0.84 bcde | 0.089 ab | 0.85 ab | 0.36 b | 0.38 abcd | 0.15 bc | 0.32 abcd |
| 2 | 1.21 ab | 2.39 c | 0.36 ab | 2.16 abc | 1.40 ab | 1.37 a | 0.086 ab | 0.46 bc | 0.41 ab | 0.30 bcd | 0.13 c | 0.31 abcd |
| 3 | 1.79 a | 3.45 abc | 0.30 ab | 2.43 abc | 0.66 bc | 0.70 de | 0.077 b | 0.41 c | 0.43 ab | 0.43 ab | 0.16 bc | 0.33 abc |
| 4 | 1.62 a | 3.29 abc | 0.39 ab | 3.03 a | 1.25 abc | 1.06 abcd | 0.077 b | 0.86 a | 0.42 ab | 0.35 abcd | 0.24 a | 0.41 a |
| 5 | 1.68 a | 3.36 abc | 0.45 a | 1.91 bc | 1.57 a | 1.23 abc | 0.097 ab | 0.52 abc | 0.43 ab | 0.26 cd | 0.17 abc | 0.28 bcd |
| 6 | 1.44 ab | 4.28 a | 0.34 ab | 2.11 abc | 1.12 abc | 1.32 ab | 0.083 b | 0.53 abc | 0.50 ab | 0.38 abc | 0.16 bc | 0.30 abcd |
| 7 | 1.19 ab | 3.46 abc | 0.37 ab | 1.80 bc | 1.29 abc | 1.37 a | 0.110 ab | 0.53 abc | 0.57 a | 0.32 abcd | 0.20 ab | 0.30 abcd |
| 8 | 0.98 b | 2.75 bc | 0.37 ab | 2.65 abc | 1.51 a | 1.12 abcd | 0.133 a | 0.84 ab | 0.38 b | 0.37 abcd | 0.17 bc | 0.34 ab |
| 9 | 1.45 ab | 2.71 bc | 0.25 b | 2.04 c | 0.65 c | 0.55 e | 0.106 ab | 0.30 c | 0.33 b | 0.25 d | 0.16 bc | 0.24 cd |
| 10 | 1.30 ab | 3.12 bc | 0.35 ab | 2.35 abc | 1.06 abc | 1.09 abcd | 0.084 b | 0.58 abc | 0.34 b | 0.42 ab | 0.14 bc | 0.31 abcd |
| 11 | 1.49 ab | 2.75 bc | 0.25 b | 1.89 bc | 0.87 abc | 0.79 cde | 0.071 b | 0.45 bc | 0.49 ab | 0.46 a | 0.11 c | 0.21 d |
| 12 | 1.59 a | 3.65 ab | 0.29 ab | 2.15 abc | 0.68 bc | 0.73 de | 0.093 ab | 0.50 abc | 0.43 ab | 0.37 abcd | 0.15 bc | 0.32 abcd |
| Micronutrients [mg/kg DW] | |||||||||
|---|---|---|---|---|---|---|---|---|---|
| Acc. | Si | Mn | Sr | Fe | Zn | B | Al | Rb | Li |
| Taproot | |||||||||
| 1 | 31.1 b | 15.0 ab | 36.8 ab | 33.4 a | 11.1 a | 15.1 a | 7.5 b | 5.84 | n.d. |
| 2 | 56.2 ab | 15.6 ab | 60.8 ab | 34.2 a | 15.2 a | 15.8 a | 12.3 ab | 5.21 bc | n.d. |
| 3 | 59.9 ab | 13.0 b | 44.5 ab | 36.9 a | 12.3 a | 15.8 a | 17.0 ab | 9.60 a | n.d. |
| 4 | 35.9 ab | 16.3 ab | 54.5 ab | 30.7 a | 10.5 a | 14.1 a | 17.2 ab | 7.31 abc | n.d. |
| 5 | 38.5 ab | 16.2 ab | 58.1 ab | 34.5 a | 14.1 a | 15.1 a | 10.6 ab | 8.38 ab | n.d. |
| 6 | 48.0 ab | 15.4 ab | 54.4 ab | 38.9 a | 11.5 a | 13.9 a | 10.6 ab | 7.14 abc | n.d. |
| 7 | 53.4 ab | 15.8 ab | 56.1 ab | 37.8 a | 12.8 a | 14.0 a | 10.2 ab | 5.72 bc | n.d. |
| 8 | 106 a | 21.2 a | 65.3 a | 47.2 a | 14.4 a | 16.0 a | 29.5 a | 3.89 c | n.d. |
| 9 | 52.1 ab | 13.2 b | 32.2 b | 34.2 a | 14.0 a | 11.8 a | 7.7 b | 5.91 bc | n.d. |
| 10 | 56.8 ab | 17.4 ab | 46.0 ab | 34.6 a | 11.5 a | 14.8 a | 14.9 ab | 5.17 bc | n.d. |
| 11 | 32.5 b | 14.2 ab | 37.4 ab | 28.4 a | 12.3 a | 12.8 a | 6.3 b | 5.47 bc | n.d. |
| 12 | 45.0 ab | 13.4 ab | 40.2 ab | 35.8 a | 12.6 a | 14.6 a | 8.5 b | 6.33 abc | n.d. |
| Leaf | |||||||||
| 1 | 211 ab | 157 ab | 165 ab | 56.2 ab | 35.8 b | 41.1 ab | 27.9 a | 13.0 bc | 3.94 ab |
| 2 | 306 a | 141 ab | 156 abc | 53.7 ab | 38.5 b | 38.4 ab | 26.3 a | 9.2 c | 5.45 a |
| 3 | 164 ab | 188 ab | 169 ab | 63.6 ab | 56.5 ab | 44.5 a | 17.9 a | 11.9 bc | 2.65 ab |
| 4 | 232 ab | 236 a | 160 abc | 103.5 a | 79.8 a | 39.7 ab | 26.5 a | 9.8 bc | 3.54 ab |
| 5 | 195 ab | 192 ab | 98 c | 49.9 b | 49.9 ab | 38.5 ab | 16.9 a | 14.1 ab | 3.35 ab |
| 6 | 174 ab | 91 ab | 139 abc | 51.1 ab | 33.0 b | 32.6 ab | 21.8 a | 18.7 a | 2.39 b |
| 7 | 171 ab | 222 a | 122 bc | 37.7 b | 59.3 ab | 39.0 ab | 13.6 a | 14.8 ab | 3.72 ab |
| 8 | 292 a | 202 a | 189 a | 72.0 ab | 43.1 ab | 36.1 ab | 17.5 a | 10.2 bc | 4.14 ab |
| 9 | 188 ab | 141 ab | 121 bc | 50.4 b | 31.4 b | 29.5 b | 19.9 a | 10.2 bc | 2.66 ab |
| 10 | 195 ab | 106 ab | 148 abc | 59.2 ab | 29.0 b | 28.5 b | 14.4 a | 13.0 bc | 2.82 ab |
| 11 | 80 b | 72 b | 139 abc | 37.6 b | 26.8 b | 30.6 ab | 10.6 a | 10.1 bc | 1.71 b |
| 12 | 178 ab | 117 ab | 132 bc | 59.8 ab | 32.0 b | 30.3 ab | 16.2 a | 14.8 ab | 2.28 b |
| Micronutrients [mg/kg DW] | |||||||||
|---|---|---|---|---|---|---|---|---|---|
| Acc. | Mo | Cu | Ti | Pb | As | Cr | Ni | Cd | Co |
| Taproot | |||||||||
| 1 | n.d. | 1.94 ab | 0.60 a | 0.20 ab | n.d. | 0.29 a | 0.10 a | n.d. | n.d. |
| 2 | n.d. | 2.19 ab | 1.74 a | 0.28 ab | n.d. | 0.43 a | 0.37 a | n.d. | n.d. |
| 3 | n.d. | 1.73 ab | 0.83 a | 0.18 b | n.d. | 0.23 a | 0.08 a | n.d. | n.d. |
| 4 | n.d. | 1.82 ab | 0.45 a | 0.24 ab | n.d. | 0.18 a | 0.03 a | n.d. | n.d. |
| 5 | n.d. | 1.43 ab | 0.51 a | 0.17 b | n.d. | 0.17 a | 0.06 a | n.d. | n.d. |
| 6 | n.d. | 1.93 ab | 1.29 a | 0.26 ab | n.d. | 0.16 a | 0.03 a | n.d. | n.d. |
| 7 | n.d. | 1.30 b | 0.70 a | 0.30 ab | n.d. | 0.42 a | 0.18 a | n.d. | n.d. |
| 8 | n.d. | 1.96 a | 1.70 a | 0.37 a | n.d. | 0.40 a | 0.27 a | n.d. | n.d. |
| 9 | n.d. | 1.50 b | 2.84 a | 0.13 b | n.d. | 0.21 a | 0.16 a | n.d. | n.d. |
| 10 | n.d. | 1.56 ab | 1.05 a | 0.14 b | n.d. | 0.18 a | 0.04 a | n.d. | n.d. |
| 11 | n.d. | 1.11 b | 0.92 a | 0.11 b | n.d. | 0.27 a | 0.09 a | n.d. | n.d. |
| 12 | n.d. | 1.55 ab | 1.06 a | 0.16 b | n.d. | 0.23 a | 0.09 a | n.d. | n.d. |
| Leaf | |||||||||
| 1 | 4.06 a | 2.61 a | 0.83 b | 0.74 ab | 0.61 bcde | 0.28 a | 0.35 ab | 0.37 ab | 0.06 a |
| 2 | 2.01 bc | 2.07 a | 1.54 a | 0.99 a | 0.84 ab | 0.50 a | 0.35 ab | 0.18 d | 0.11 a |
| 3 | 4.28 a | 2.48 a | 0.71 b | 0.89 ab | 0.73 abcd | 0.60 a | 0.29 bc | 0.30 bc | 0.12 a |
| 4 | 2.91 abc | 2.46 a | 1.14 ab | 0.85 ab | 1.07 a | 0.64 a | 0.49 a | 0.43 a | 0.16 a |
| 5 | 2.23 abc | 1.83 a | 0.81 b | 0.37 b | 0.58 bcde | 1.52 a | 0.32 abc | 0.16 d | 0.10 a |
| 6 | 2.37 abc | 2.53 a | 1.14 ab | 0.61 ab | 0.58 bcde | 0.72 a | 0.34 ab | 0.21 cd | 0.07 a |
| 7 | 2.14 abc | 1.82 a | 0.73 b | 0.75 ab | 0.49 cde | 0.53 a | 0.31 bc | 0.23 cd | 0.11 a |
| 8 | 4.04 a | 2.77 a | 1.17 ab | 0.82 ab | 0.83 ab | 0.44 a | 0.33 ab | 0.35 ab | 0.13 a |
| 9 | 2.10 bc | 1.67 a | 1.12 ab | 0.50 ab | 0.46 de | 0.19 a | 0.22 bc | 0.17 d | 0.13 a |
| 10 | 1.68 c | 1.90 a | 0.99 ab | 0.58 ab | 0.78 abc | 0.56 a | 0.27 bc | 0.22 cd | 0.04 a |
| 11 | 2.04 bc | 1.81 a | 0.70 b | 0.34 b | 0.36 e | 0.28 a | 0.17 c | 0.22 cd | 0.06 a |
| 12 | 3.32 ab | 2.21 a | 0.80 b | 0.66 ab | 0.57 bcde | 0.30 a | 0.29 bc | 0.18 d | 0.09 a |
| Dry Matter | TMC | TFC | K | Ca | Na | Mg | P | |
|---|---|---|---|---|---|---|---|---|
| TMC | 0.457 ** | |||||||
| TFC | 0.545 *** | 0.953 *** | ||||||
| K | 0.265 | 0.125 | 0.218 | |||||
| Ca | −0.290 * | −0.182 | −0.154 | 0.135 | ||||
| Na | −0.377 * | −0.256 | −0.276 | −0.241 | 0.833 *** | |||
| Mg | −0.233 | 0.041 | 0.046 | 0.164 | 0.646 *** | 0.498 *** | ||
| P | −0.063 | −0.106 | −0.115 | 0.140 | 0.490 *** | 0.490 *** | 0.385 * | |
| S | −0.056 | −0.085 | −0.098 | −0.158 | 0.464 *** | 0.556 *** | 0.382 * | 0.253 |
Publisher’s Note: MDPI stays neutral with regard to jurisdictional claims in published maps and institutional affiliations. |
© 2021 by the authors. Licensee MDPI, Basel, Switzerland. This article is an open access article distributed under the terms and conditions of the Creative Commons Attribution (CC BY) license (https://creativecommons.org/licenses/by/4.0/).
Share and Cite
Acosta-Motos, J.R.; Díaz-Vivancos, P.; Becerra-Gutiérrez, V.; Hernández Cortés, J.A.; Barba-Espín, G. Comparative Characterization of Eastern Carrot Accessions for Some Main Agricultural Traits. Agronomy 2021, 11, 2460. https://doi.org/10.3390/agronomy11122460
Acosta-Motos JR, Díaz-Vivancos P, Becerra-Gutiérrez V, Hernández Cortés JA, Barba-Espín G. Comparative Characterization of Eastern Carrot Accessions for Some Main Agricultural Traits. Agronomy. 2021; 11(12):2460. https://doi.org/10.3390/agronomy11122460
Chicago/Turabian StyleAcosta-Motos, José R., Pedro Díaz-Vivancos, Verónica Becerra-Gutiérrez, José A. Hernández Cortés, and Gregorio Barba-Espín. 2021. "Comparative Characterization of Eastern Carrot Accessions for Some Main Agricultural Traits" Agronomy 11, no. 12: 2460. https://doi.org/10.3390/agronomy11122460
APA StyleAcosta-Motos, J. R., Díaz-Vivancos, P., Becerra-Gutiérrez, V., Hernández Cortés, J. A., & Barba-Espín, G. (2021). Comparative Characterization of Eastern Carrot Accessions for Some Main Agricultural Traits. Agronomy, 11(12), 2460. https://doi.org/10.3390/agronomy11122460