Article

Effects of Fertilizers and Manures on Temporal Yield Variability of Winter Rye

1
Department of Biometry, Institute of Agriculture, Warsaw University of Life Science, 02-787 Warsaw, Poland
2
Department of Agronomy and Crop Physiology, Institute for Plant Production and Plant Breeding I, Justus Liebig University, 35392 Giessen, Germany
3
Department of Plant and Environmental Sciences, Section of Environmental Chemistry and Physics, University of Copenhagen, 1871 Frederiksberg Copenhagen, Denmark
4
Sustainable Agriculture Sciences Department, Rothamsted Research, Harpenden AL5 2JQ, UK
5
Section of Agricultural Chemistry, Institute of Agriculture, Warsaw University of Life Science, 02-787 Warsaw, Poland
*
Author to whom correspondence should be addressed.
Agronomy 2021, 11(3), 519; https://doi.org/10.3390/agronomy11030519
Submission received: 16 February 2021 / Revised: 3 March 2021 / Accepted: 4 March 2021 / Published: 10 March 2021

Abstract

:
The anticipated increases in environmental variability associated with climate change may lead to enhanced abiotic plant stresses (e.g., heat stress, drought stress, etc.) resulting in greater inter-annual yield fluctuations and higher crop production risk. While there has been increasing attention to adaptation measures, there is little evidence available on how to change agronomic management strategies to maintain stable yields in winter rye production systems in Poland. This study uses rye yields from the unique Skierniewice Long-term experiment (Poland) to examine for the first-time the long-term effects of different nutrient regimes on crop yield stability from 1966 to 2015. Yields from six combinations of mineral fertilizers and lime (CaNPK, NPK, CaPK, CaNK, CaNP, Ca), with and without additional manure, were used to estimate the temporal yield variability of winter rye. A novel statistical approach based on a mixed model approach with REML (restricted maximum likelihood) stability parameter estimation was used. The results showed that the use of additional manure in ‘sub-optimal’ mineral fertilizer treatments, such as Ca and CaPK (without mineral N), reduced the temporal yield variability of rye. In contrast, additional organic input led to more variable rye yields in already ‘optimal’ treatments including mineral N (CaNPK and NPK), compared to those with no additional manure. Winter rye given CaNPK and NPK, without additional organic manure demonstrated high yield and low temporal yield variability. In contrast, yields of treatments with no mineral N (Ca and CaPK) and no additional manure supply were low and unstable. In addition, it was found that increasing soil organic carbon resulted in larger, more stable yields. These findings highlight the importance of ensuring rye crops receive sufficient fertilizer to maintain crop production levels and yield stability, especially in dry years. They also demonstrate the importance of avoiding the excessive use of organic manures when fertilizer inputs are sufficient to meet crop demand. Overall, the study provides novel insights about how to maintain grain yields and minimize temporal yield variation of rye in arable cropping systems, which will become increasingly important in a changing climate in Poland and in other temperate climate areas. This study also highlights the importance of soil organic carbon for improving the climate resilience of winter rye, while simultaneously meeting the demand for more sustainable management of the soil.

1. Introduction

It is anticipated that climate change will lead to a higher temporal yield variability (lower yield stability) and increased yield loss of field crops, largely as a result of increasing environmental stresses during the growing season, including heat, drought or late frosts [1,2,3]. Against this background, the development of climate-resilient, stable cropping systems is important to ensure future food security. Evaluation of yield variability for cereals in terms of climate change is a highly relevant topic.
Rye (Secale cereale L.) is an important crop grown on sandy soils in cultivated areas of central Europe, under a continental climate. It is used primarily for the production of animal feed, bread flour, biogas, bioethanol or alcohol. Due to its well-developed drought tolerance and nutrient use efficiency [4], as well as its high frost tolerance and early regrowth in the spring [5], the inclusion of winter rye in crop rotations may help improve current cropping systems in terms of their sustainability and climate resilience. However, a robust evaluation of its temporal yield variability under different environmental conditions and agronomic practices (e.g., different fertilizer regimes) is needed to verify its suitability for increased use in central Europe and beyond.
In addition, the long-term impact of liming on rye yield variability requires evaluation. Many of the agricultural soils on which rye is grown in Poland are highly acidic, about half of the soils in Poland have a pH even below 5.5 [6]. This is mainly due to the nature of the geological and pedological processes by which the soils evolved. Over 90% of Poland’s area is covered by postglacial light and very light soils, made of acidic sedimentary rocks, loose crumbs brought by glaciers from Scandinavia [6]. Consequently, the application of lime is often required to maintain a suitable pH for crop production [7].
The analysis of temporal yield variability requires field-level measurements over a sufficient number of years under relatively controlled conditions. Long-term field experiments (LTEs), which record yield data for crops grown on the same soil, under similar management, and over a period of more than 20 years [8] are ideal for such analyses. While these properties make LTEs ideal for quantifying temporal variation they are only now beginning to be used more extensively to assess yield variability [9,10], but analyses of the effects of agronomic management practices (e.g., impact of cultivar choice [11], sowing conditions [12] and fertilization [13]) for winter rye are still rare. The LTEs also play an important role in the study of changes in soil properties that cannot be observed in a short time, e.g., soil organic carbon, pH and phosphorus contents [7]. The soil organic matter (SOM), and in particular, soil organic carbon (SOC), plays an important role in sustainable crop production by maintaining the resilience of cropping systems [14]. Increasing SOC can be achieved by returning crop residues and applying organic fertilizers. However, temperature increases associated with climate change could contribute to losses of SOC. enhanced levels of SOC may contribute to less production risk and more stable yields [15], as demonstrated in modelling studies on wheat.
A comprehensive analysis of data sets collected from long-term experiments is often problematic; incomplete datasets are a common problem. In addition, they are often subject to changes in crop rotations or other treatment modifications (e.g., changes in the cultivation method, plant protection methods, etc.) associated with commercial developments in crop production technologies. Such changes may make it difficult or impossible to statistically analyse the results. Some valuable LTEs, established at the beginning of the 20th century, were designed without a good knowledge of the statistical methods used in modern agricultural research [8]. However, the use of linear mixed models can overcome some of the limitations resulting from poor experimental design. Such models can deal with incomplete datasets by using appropriate variance and covariance structures, making it possible to model the complex experimental design used in some LTEs.
This study aims to provide new insights in how rye yields are affected by different nutrient regimes. The main objective was to identify the impact of lime, nitrogen (N), phosphorus (P), and potassium (K) supplied in six different combinations (1. ‘Ca’; 2. ‘CaPK’; 3. ‘CaNK’; 4. ‘CaNP’; 5. ‘CaNPK’; 6. ‘NPK’) with and without additional manure, on the temporal grain yield variability of winter rye. A novel mixed model approach calculating Shukla’s stability variance index was used, based on yield, climate and soil data (1966–2015) from the long-term fertilization field experiment at Skierniewice. This study provides, for the first time, a stability analysis from this unique long-term experiment in Central Europe. We addressed four specific questions:
(Q1)
What combination of Ca, N, P, and K leads to the lowest temporal yield variability for winter rye?
(Q2)
What are the effects of additional organic inputs on temporal yield variability of rye?
(Q3)
Are there correlations between soil organic carbon content and temporal yield variability of rye?
(Q4)
Do the effects of fertilizer and soil organic matter differ between (i) dry and (ii) average or wet years?

2. Materials and Methods

2.1. The Skierniewice Long-Term Experiment

The data on rye grain yield used in this study come from a LTE performed from 1965/1966 to 2014/2015 at the Experimental Station of the Warsaw University of Life Science in Skierniewice (51°57′ N 20°09′ E). We wanted to focus on the long-term effects of the contrasting mineral and organic fertilizer treatments on rye yield variability. The rye yield data from the Skierniewice LTE fitted this objective very well. The same variety has been used in this experiment for a very long time, so that no interfering effects due to cultivar changes took place (we write more about it in the following paragraphs.)
The experiment was established on a Luvisol soil. The substratum is loamy sand with the following fractions in the 0–25 cm layer: >0.05 mm · 87%; 0.002–0.05 mm · 5%; <0.002 mm · 7%. The climate is continental; annual precipitation and mean air temperature at Skierniewice during the period 1966–2015 are shown in Figure 1, and on a monthly basis in Table A2 (Appendix A).
The LTE in Skierniewice was designed around 1920 and with some modifications, it has continued until today. The effects of six combinations of mineral fertilization (CaNPK, NPK, CaPK, CaNK, CaNP, Ca) and two levels of organic inputs (with and without manure) were evaluated in this experiment. The experiment has a non-randomization experimental design with 5 replication for each fertilizer combination, similar to a split-plot design (Table A1 in Appendix A). The harvest area within each experimental plot was 36 m2. The experiment in Skierniewice has a strong focus on research related to liming (using Ca) this is due to the fact that Poland is characterized by a high proportion of acidic and very acidic soils (pH < 5.5). However, a limitation of this LTE is that no full control of liming was included in the experimental design. The only combination without Ca was a combination with optimal NPK fertilization (Table A1 in Appendix A).
The experiment comprised a five-year crop rotation (potato, spring barley, red clover, winter wheat and winter rye). The same rye cultivar (cv. Dańkowskie Złote) was used in all years because it was the most popular cultivar used in commercial practice in Poland and for many years it was the reference cultivar used for the registration of new cultivars. One of its advantages is high tolerance to lodging, compared to other rye cultivars bred over the past 50 years in Poland [16]. A conventional ploughing system was used to cultivate the soil before the rye was sown. The plough depth was about 20 cm and the soil was consolidated before sowing by harrowing and rolling. In most years sowing was done in the second half of September (from 15 to 25 September). Expected plant density at emergence was 350 plants m−2. Mineral fertilizers were applied annually in March/April at the following rates (unchanged since 1966): 90 kg N ha−1 (ammonium nitrate), 26 kg P ha−1 (single superphosphate), and 91 kg K ha−1 (potassium chloride); every fifth year 1.6 t CaO ha−1 (calcium oxide) was applied. N was applied to winter rye in a single dose in spring, P and K was applied in autumn, before sowing. Stockpiled cattle manure was applied at a rate of 30 t/ha of fresh material (dry matter 45–50% depending on the year) once every fifth year before potatoes in autumn. The manure was applied by hand. On average, the manure used contained approximately 0.25% (dry weight) of nitrogen, 0.15% phosphorus, 0.35% potassium. The organic carbon content was on average 4–5% of manure dry weight. Herbicides were used to protect against weeds from 1983. They were applied in the autumn after emergence, and, if necessary, in spring. Fungicides and growth regulators were not used. Harvesting was usually carried out in July and August, from the 1990s a field harvester was used, but crops were harvested by hand before this. This method of cultivation, in accordance with Polish standards, is referred to as moderate input crop management. The soil chemical properties determined for each fertilizer treatment in 2013 are shown in Table 1. The total N content of the soil samples from the experimental fields was determined using the Kjeldahl method. The available phosphorus and potassium contents were determined with the Egner-Riehm DL method.

2.2. Statistical Analysis

The analysis of rye grain yield data (standardized to 85% of dry weight) was performed using a linear mixed model (LMM). The LMM is very good at dealing with unbalanced data and non-randomization experimental designs [17]. They allow for the correct modeling of very complex data structure and for the application of a flexible variance-covariance structure. The study data set contained the yield means from 4 replicates. They were used in the LMM model shown below:
xikq = µ + yi + mq + ok + ymiq + yoik +moqk + ymoikq
where: xikq is the mean of yield for of the i–th year, the q–th mineral fertilization, the k–th organic input; µ is the overall mean; ai is the random main effect of the i–th year; mq is the fixed main effect of the q–th mineral fertilization; ok is the fixed main ef-fect of the k–th organic input; ymiq is the random interaction effect of the i–th year and the q–th mineral fertilization; yoik is the random interaction effect of the i–th year and the k–th organic input; mogk is the fixed interaction effect of the q–th mineral fertilization and the k–th organic input; ymoikq is the random interaction effect of the the i–th year, the q–th mineral fertilization, the k–th organic input and the error term associated with the xikq mean.
In each rotation cycle [8] rye was cultivated on the same plot after wheat, returning to the same plot every five years. As a result, a repeated measures design was used for the yield observation in this experiment. Therefore, in this model for residual covariance structure we used an autoregressive AR (1) model to evaluate autocorrelation between year (growing seasons) and plot. The model parameters were estimated using the restricted maximum likelihood (REML). Before applying the above linear mixed model the fertilization treatments were tested separately for a trend in rye yields over the years (1966–2014), but there was no evidence of significant temporal trends.
The significance of the fixed effects from model (1) was evaluated with the Wald F test [18]. The adjusted mean by LMM (model 1) yields for the main effects, mineral fertilization × year, and mineral fertilization × organic input × year were calculated using the algorithm described by [19]. The multiple comparisons of means were performed with Sidak corrections of p values. The adjusted means obtained for appropriate combinations were used to assess temporal yield variability. In order to achieve this aim we used Shukla’s stability variance [20]. This measure of stability is commonly used in plant breeding to evaluate genotypes. It differs from standard deviation and standard error of means by allowing an unbiased estimate of the dynamic type of stability (sometimes named type 2 or agronomic concept of yield stability). The model allowed temporal yield variability to be determined independently of the yield level, as recommended by Shukla [20]. Yield variability can be incorrectly interpreted if there is a systematic dependency in the variation from the mean [11]; no such dependencies were found in this analysis.
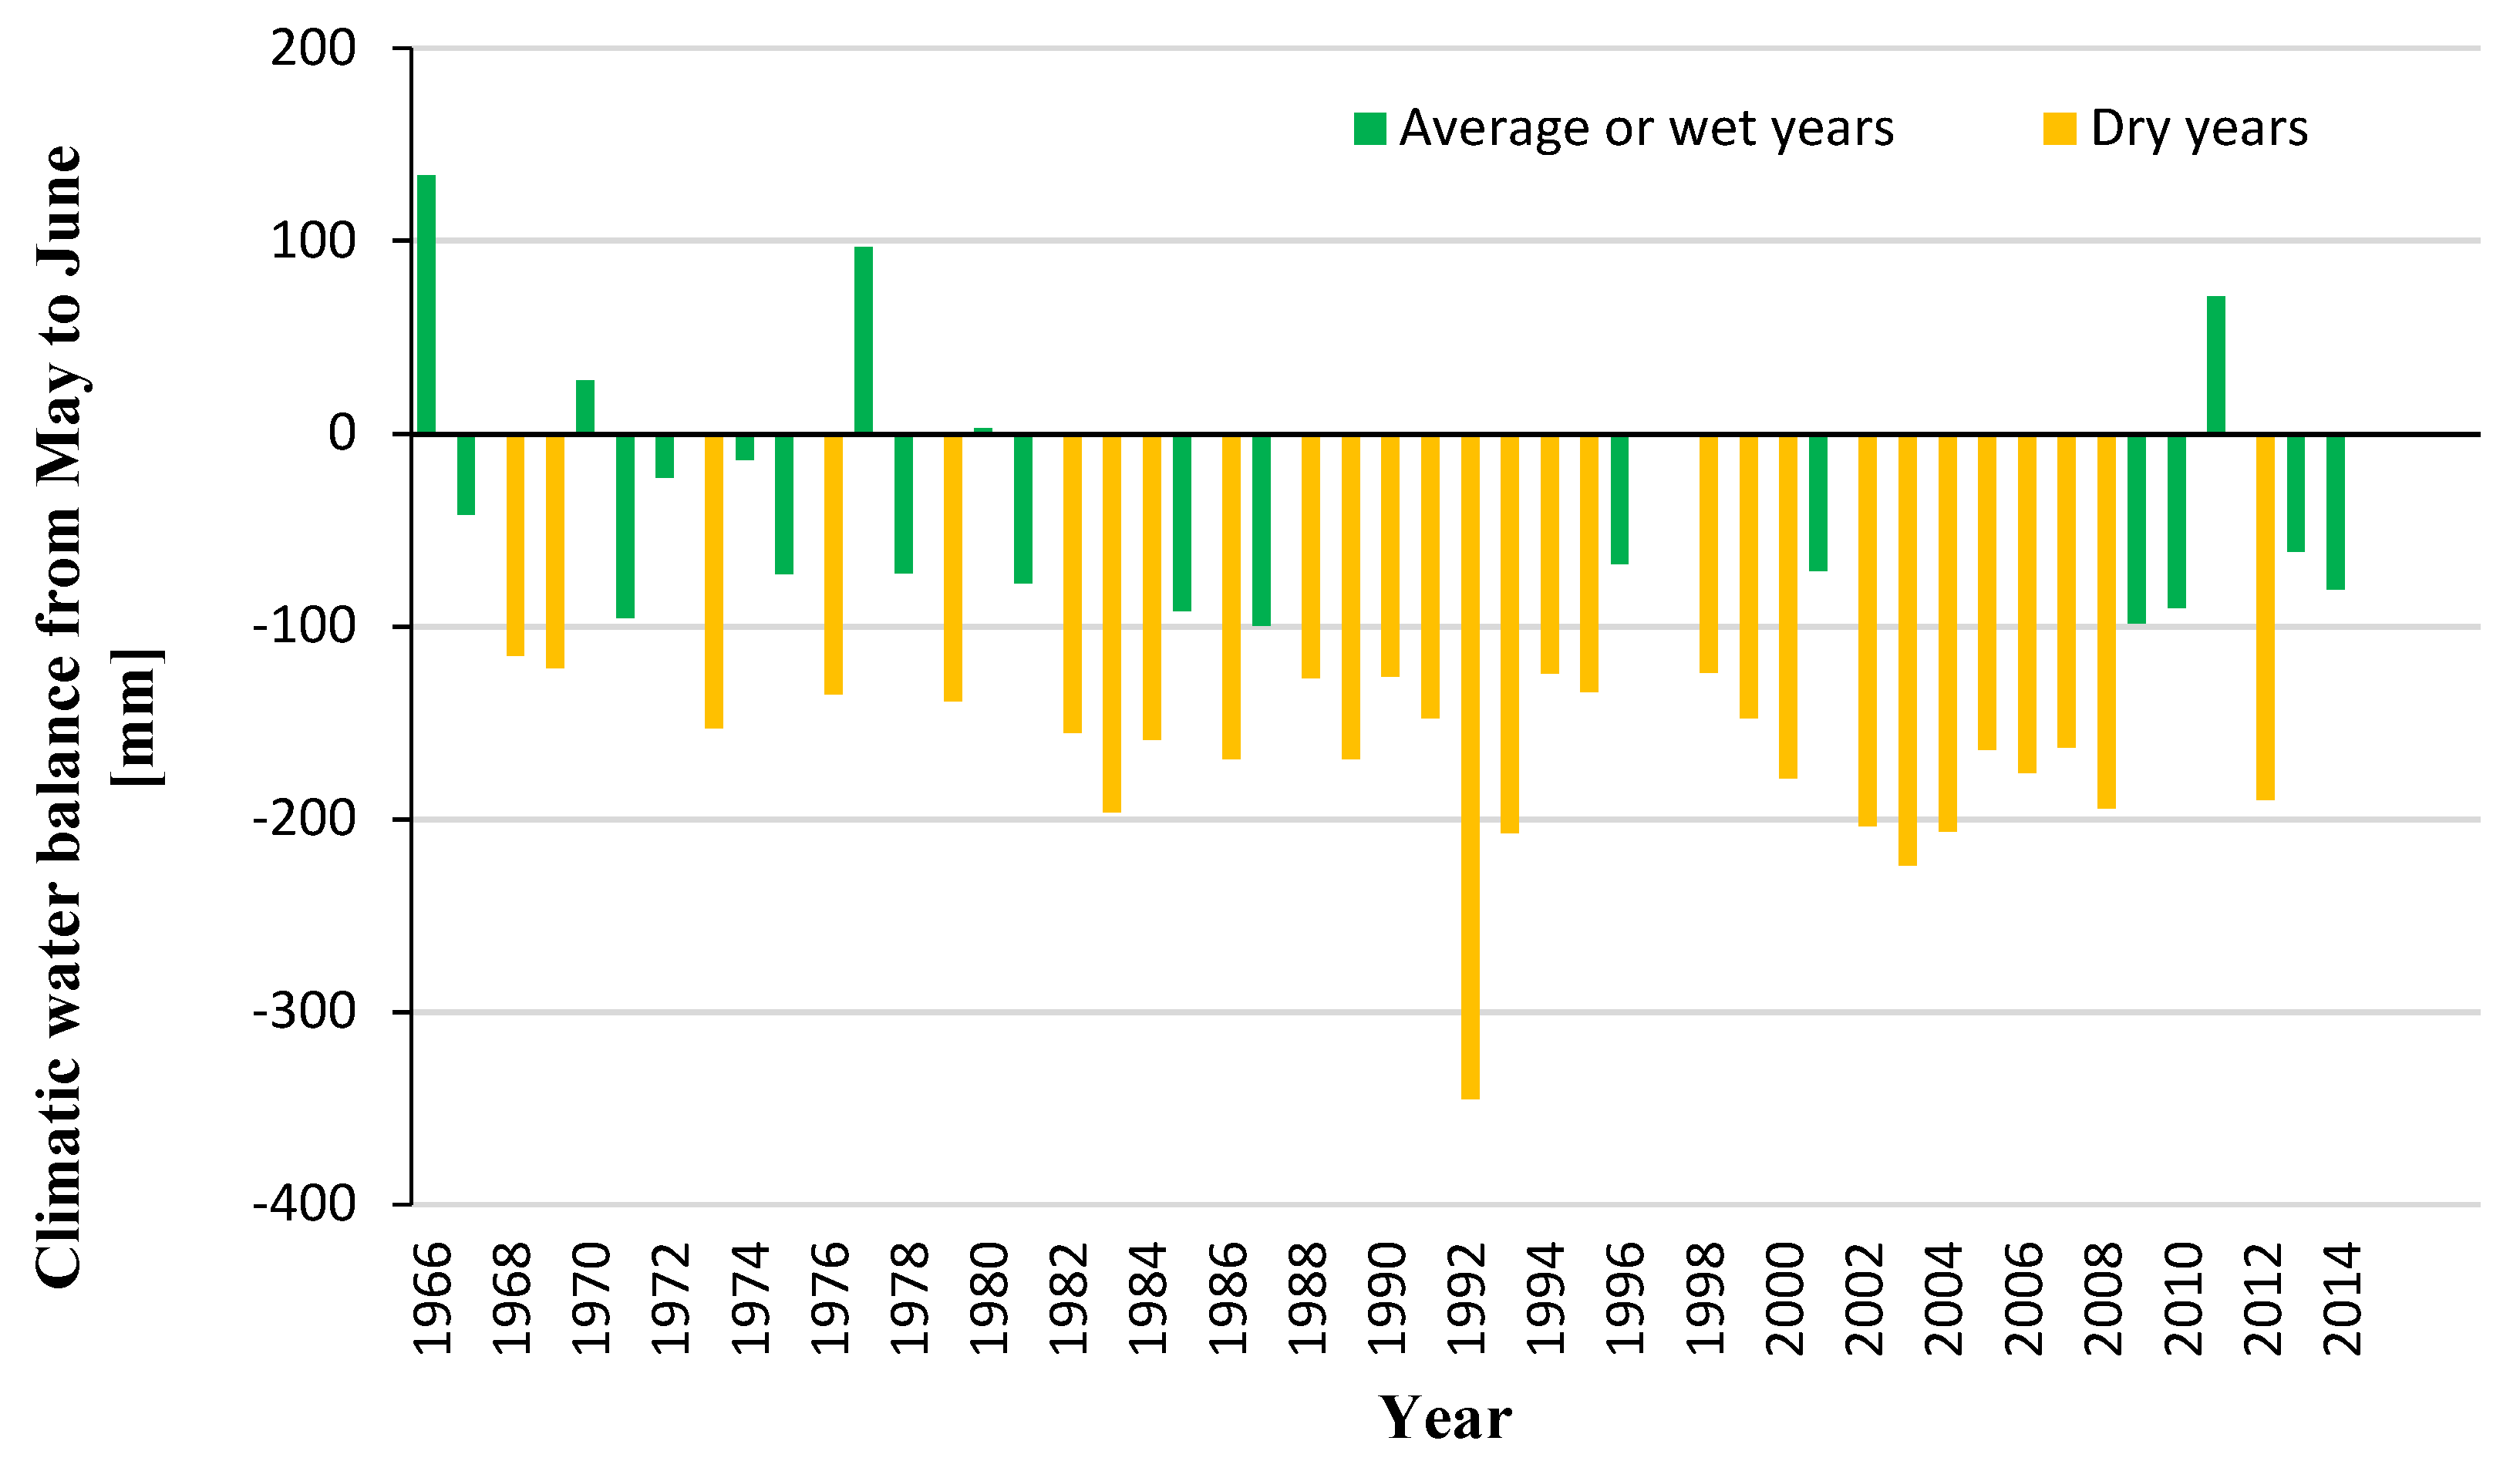
We used the Spearman rank correlation coefficient to evaluate relationship between soil properties determined in 2013 and mean rye yields across 1996–2014 years, and with values of the Shukla’s stability variances. Additionally, this correlation coefficient was used to test the relationship between climatic water balance (CWB) value and rye yield in each fertilizer combination separately. Based on the CWB in the period from May to June, the growing seasons were divided into (i) dry and (ii) average or wet years. The CWB is defined as difference between precipitation and the potential evapotranspiration (unit: mm). The evapotranspiration was calculated according to Ivanov equation [21] as recommended for the Polish continental climate with a crop specific correction factor. The dry years include growing seasons whose CWB value were equal to or lower than −100 mm. Growing seasons with a CWB greater than −100 mm were considered to be average or wet years, including years with a small water deficit and with optimal water availability for rye. The specific CWB values (1966–2015) used in this analysis are show in Figure A1 (Appendix A).
The statistical analysis was carried out using the R 3.2.5 software package (The R Foundation for Statistical Computing, Vienna, Austria). The model LMM was fitted using ASReml 4.0, implemented in the R software package ASReml–R. The metan package in R software was used to obtain Shukla’s stability variance parameters.

3. Results and Discussion

The annual precipitation sum ranges from 400 mm (in 1982) to 854 mm (in 1966) and with averages around 550 mm (Figure 1, and Table A2 in Appendix A) in study period; lower than the average for the whole of Poland, which is about 620 mm [22]. The mean precipitation in May and June was 64 mm and 80 mm, respectively (Figure A1 in Appendix A). The low amount of rainfall recorded at the study site together with the sandy soil texture (sand content 87%) indicates that water stress conditions existed in the study region for cereals, including rye. May and June are critical times for cereal development [4]. The growth stages at this time are responsible for the formation of yield components, such as the number of grains per spike and the mass of a thousand grains. Low water availability during the formation of these yield components reduces grain size and, consequently, reduces the yield. Even relatively high rainfall in July will not compensate for such losses. In addition, one of the other main factors limiting the plant development after sowing, and resulting in negative consequences for rye yield formation, is the very low mean precipitation in the autumn and winter period (from September to February), only about 140 mm (Table A2 in Appendix A).
During the study period (1966–2015), we observed a statistically significant increase in annual air temperatures (β = 0.03, R2 = 0.22, p-value = 0.0006). The temperature in June, which is one of the most important months for rye cultivation [4], ranged from 15 °C to 23 °C. The values of CWB differed greatly during the study period (Figure A1); from −345 to +133 mm. CWB values were strongly correlated with the total annual precipitation, but we did not observe significant relationship between CWB and the annual average temperature, or the temperature during important periods (form May to July) for rye growth and development.
The mean yield of winter rye (Figure 2) was smallest in mineral treatments without N or manure (Ca: 1.45 t ha−1; CaPK: 1.69 t ha−1). The additional supply of manure in these treatments led to a significant yield increase of around 1.2 t ha−1. In treatments with Ca, N plus either K or P, a significantly higher yield was observed (CaNK: 2.79 t ha−1; CaNP: 3.40 t ha−1) compared to treatments without N. The increased yield due to additional manure was 0.8 t ha−1 for the CaNK treatment, but only 0.5 t ha−1 for the CaNP treatment. The rye yields were greatest (4.11–4.26 t ha−1) for the CaNPK and NPK treatments, with no significant differences between them. The addition of manure did not lead to significant increases in yield for these treatments. The mean yield of rye was mainly affected by N, followed by additional manure, P and K, and, lastly, by Ca (Figure 2).
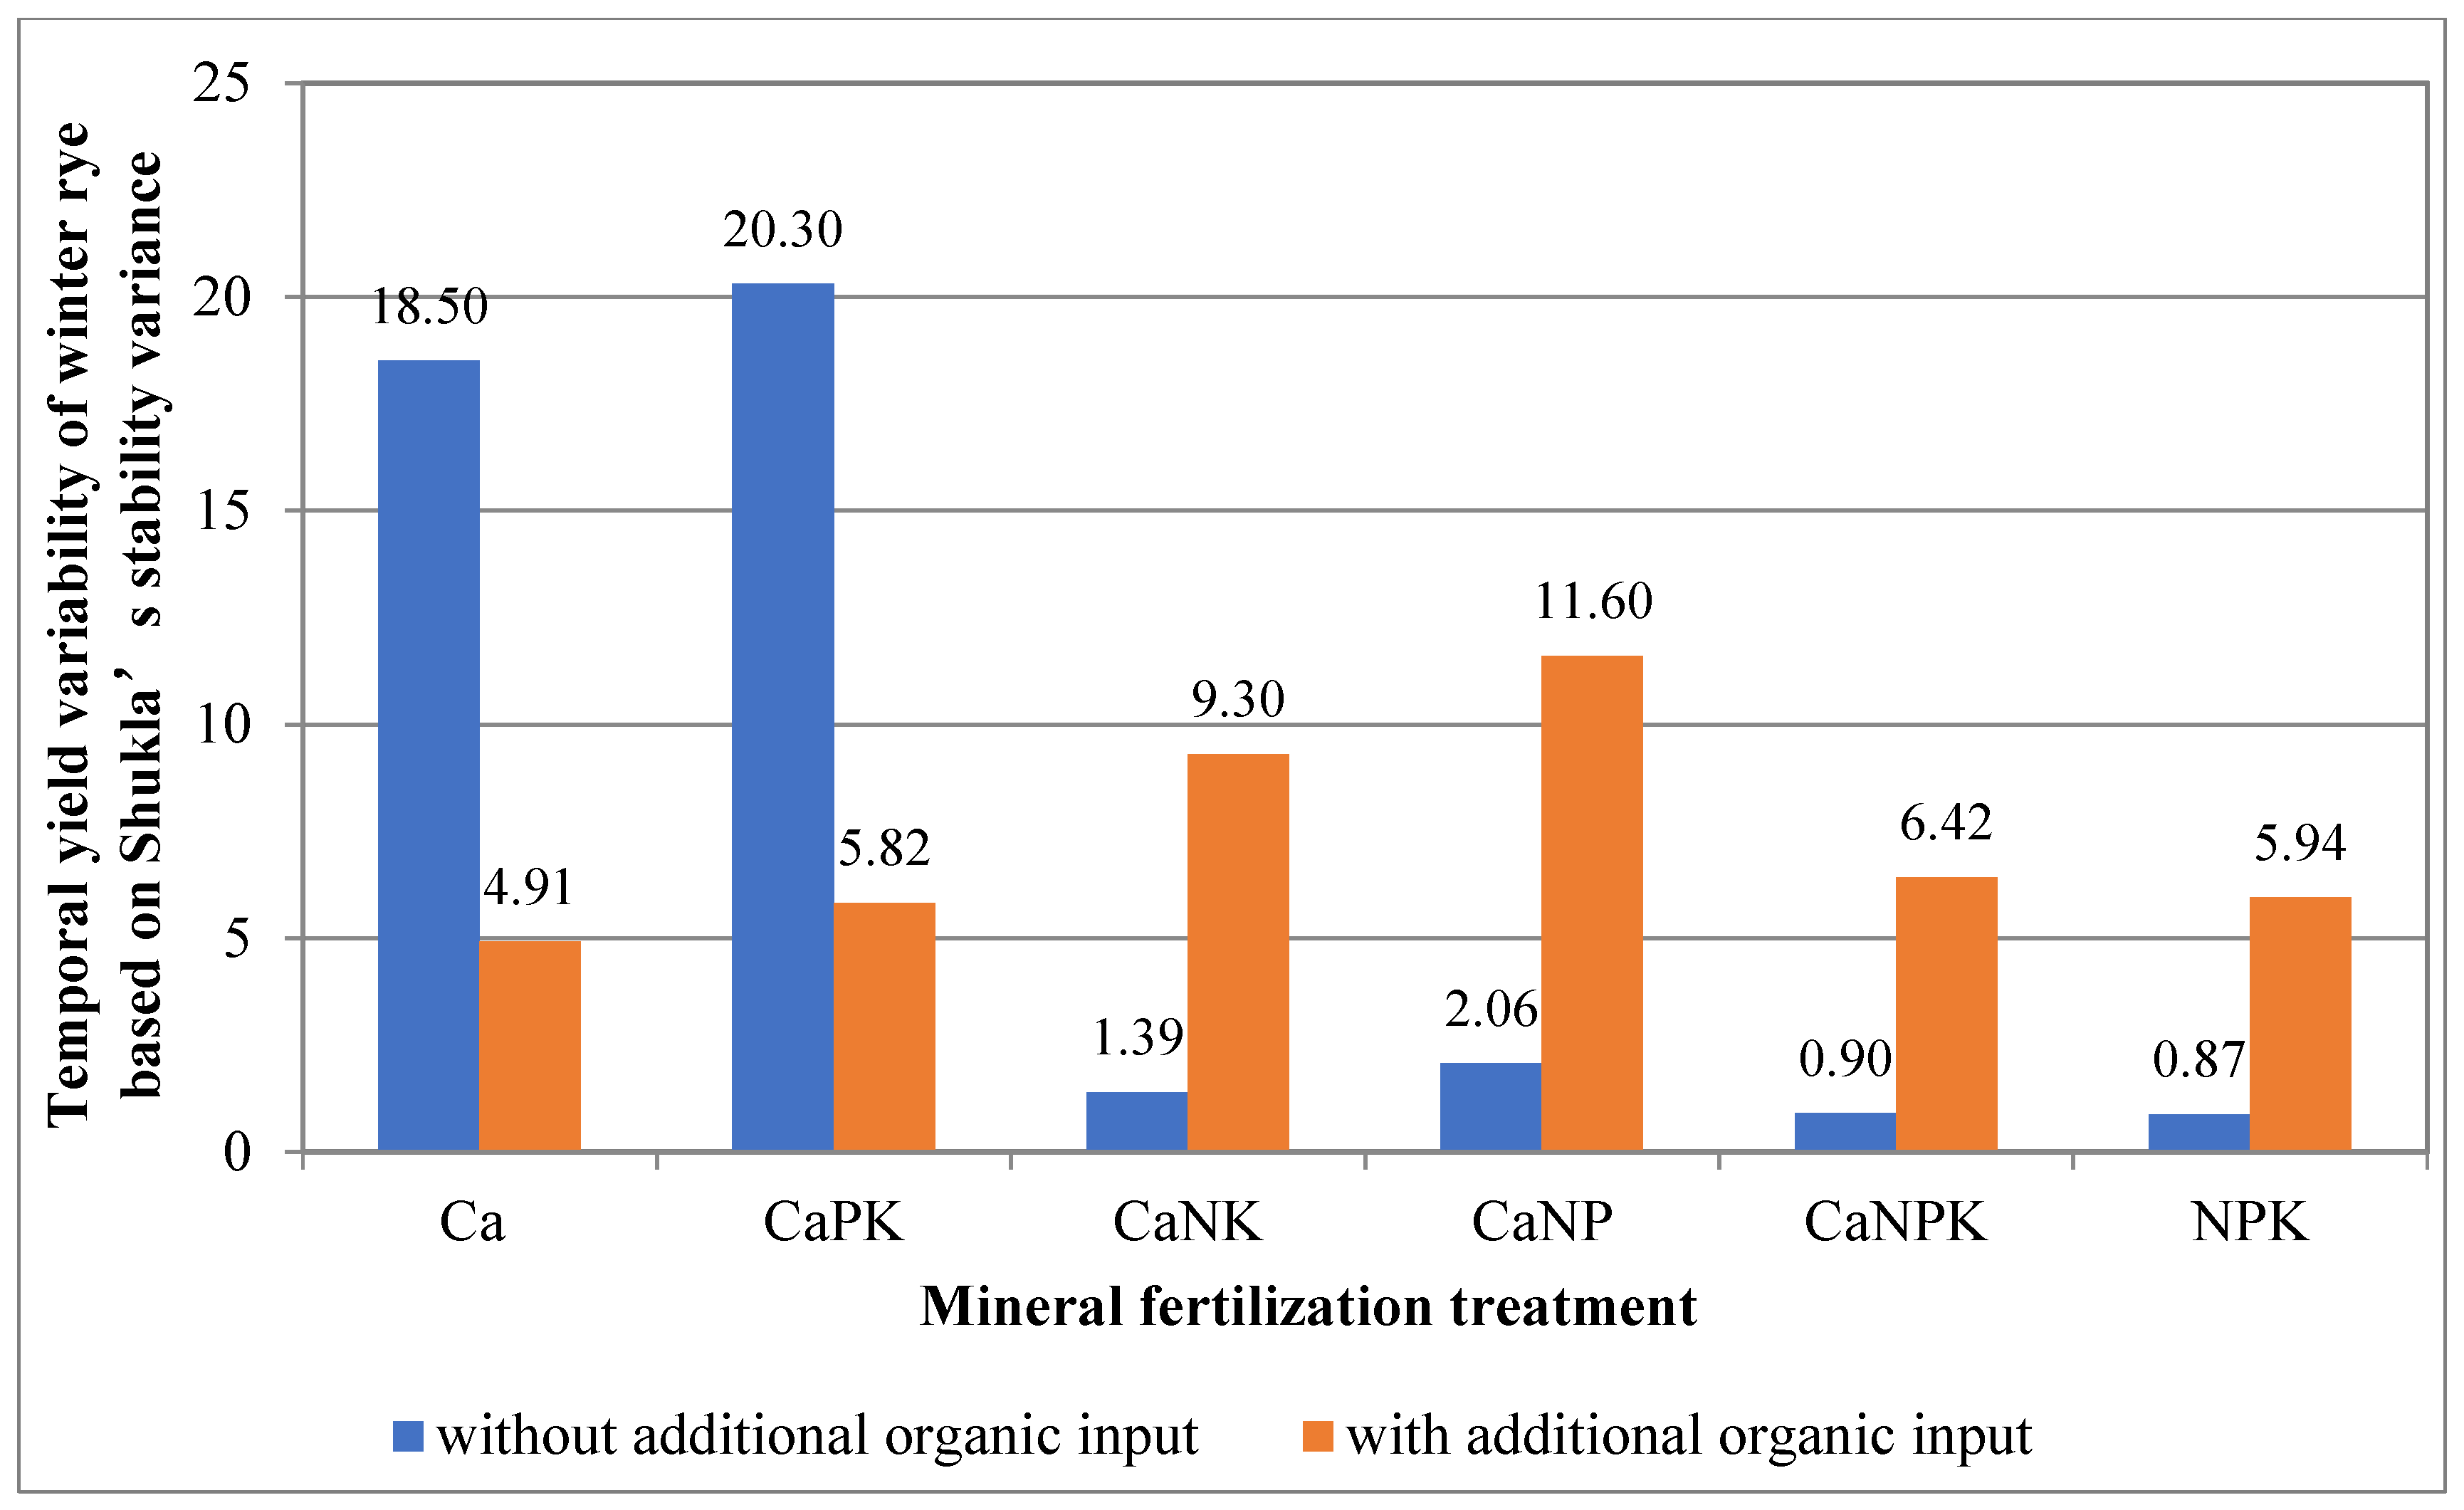
The temporal yield variability (Figure 3) was greatest in treatments with no mineral N input (‘Ca and CaPK’), but was lower in treatments with mineral N. Yield variability was smallest for treatments where P and K (‘CaNPK or NPK’) were combined. The additional supply of organic manure reduced the yield variability in treatments without mineral N supply (‘Ca or CaPK’), whereas it increased when mineral N was applied (‘CaNK, CaNP, CaNPK, NPK’) (Figure 3). However, the value of temporal yield variation for these three mineral fertilization combinations with additional organic manure was over 3 times lower than for treatments without mineral N and without manure.
Nutrient supply management is critical for maintaining high and stable crop yields [23]. We determined that N supply had the greatest impact on temporal yield variability of rye, which was also observed by [24,25]. Under conditions of sufficient N supply, we found that crop yields were higher and more resilient to environmental stress (yields were more stable) in the CaNPK and NPK (with or without additional manure supply) treatments. In addition to N, we found a direct effect of mineral P and K supply on rye yield and variability; with the following ranking: N > K > P. A similar ranking has been found for wheat and barley [9], and for wheat and rye [26] in two comparable long-term fertilization experiments in Germany. The lowest yields and highest temporal yield variabilities were found under insufficient N supply (treatments Ca and CaPK), which was also observed by [23] in an analysis based on a similar long-term experiment in Denmark. In addition to N deficiency, an insufficient P and K supply (treatment Ca vs. CaPK) may result in additional plant stress and reduced climatic resilience to abiotic stress [23]. Evidence of nutrient deficiency was demonstrated by the soil nutrient analysis (plant available forms) in 2013, which showed insufficient soil P (0.011 g Pavailable per kg soil) and K (0.042 g Kavailable per kg soil) in the Skierniewice LTE (Table 1) where lime was applied alone and without organic input. The P and K contents in these treatments were very low (reaching the value of 4 on the 5-point scale used in Poland). Besides this, a reason for the slightly higher impact of K than P on temporal yield variability could be the positive effects of K on plant tolerance to water stress [27], which resulted in more stable rye yields in treatments with sufficient K supply (CaNK vs. CaNP). One of the main reasons for the effect of K on temporal rye yield variability may be that the soils at the Skierniewice site are highly susceptible to K leaching. Sandy luvisols, such as in this experiment and in the study by [28] in Lithuania, are characterized by a significant degree of K leaching.
In the Skierniewice LTE, the additional of manure to treatments with mineral N (CaNK; CaNP; CaNPK; NPK) led to higher temporal yield variability of rye, particularly for the ‘CaNPK and NPK’ treatments, but did not increase mean yield. The application of manure containing P and K would be expected to improve yields in the treatments that do not include P and K inputs. In addition, the plant available N, in mineral plus organic forms, may have exceeded the optimum for rye, resulting in increased vulnerability to diseases and/or lodging (data not shown) because growth regulators and fungicides were not used, resulting in greater temporal yield variability. Poland has one of the lowest consumptions of plant protection agents in Europe, the average consumption is around 1.5 kg active substance/ha (http://www.fao.org/faostat/en/, accessed on 12 January 2021). Even today, many Polish farmers do not use fungicides and growth regulators in rye grain production systems, which can be described as low input. Therefore, yield variability depended strongly on the weather conditions during the vegetative growth periods, mainly rainfall. This result stands in contrast to the findings from some LTEs in Germany and Hungary reported by [9,10] respectively, where additional manure supply stabilized wheat yields. Although these results were for wheat, comparable effects could have been assumed for rye. However, differences regarding the agronomic management (usage of growth regulators and fungicides), and the amount, form (slurry, farmyard manure) and frequency of manure application, may be responsible for the differences between these studies. In addition, rye and wheat respond differently to fertilizer combinations because rye is more prone to lodging than wheat. Thus, a direct comparison of rye and wheat temporal yield variability is not possible, but more suitable studies for rye are not yet available.
As drought is one of the major agronomic risks [1,2,3,29], the fertilization impact on rye yield was compared for (i) dry years versus (ii) average or wet years (Table 2). In most fertilization treatments rye yield was significantly lower in dry than in average/wet years, but no yield differences were found for the ‘Ca; CaPK and CaNK’ treatments, without additional manure input. It can be concluded, that in dry years with limited water availability the supply of nutrients, particularly N and P—but also organic input (in the absence of mineral fertilization), were of great importance for the yield security of winter rye (Table 2). The yield of rye in dry years was on average about 0.40 t/ha lower compared to average/wet years in treatments with significant differences. For all fertilization combinations with manure addition we observed significant differences of mean yield between dry versus average/wet years. For the fertilization combinations we observed no significant differences in yield between dry and average/wet years (combination Ca, CaPK and CaNK without manure), indicating that in these cases fertiliser management is limiting the rye yield to a greater extent than the weather conditions. In the absence of basic nutrients, as in those combinations for which we observe insignificant differences in yield between dry and average/wet years, drought stress is not a key factor in rye yield determination. A similar effect has been observed with triticale in a long term field experiment in Hungary [30], which showed that with an increase in the level of mineral fertilization the difference between the yield in a drought and non-drought season increased. Three fertilizer combinations for which there were no significant differences in yield between dry and average/wet years had Spearman rank correlation coefficients between yield and CWB close to zero (or negative), but these correlation coefficients were not significant. The values of the coefficients were positive for the remaining fertilization treatment, but only four combinations (CaNP without manure; CaNP, CaNPK and NPK with manure) were statistically significant. The yield difference between dry and average/wet years for these four combinations were large, about 0.6 t/ha. The significant Spearman rank correlation coefficients for optimal fertilization treatments indicated that yield variation was related to water availability. Therefore, the temporal yield variation under favorable cultivation conditions is related to variability of water availability. In particular, we observed high variability in precipitation in May and June at the Skierniewice Experimental Station (Figure A1 in Appendix A).
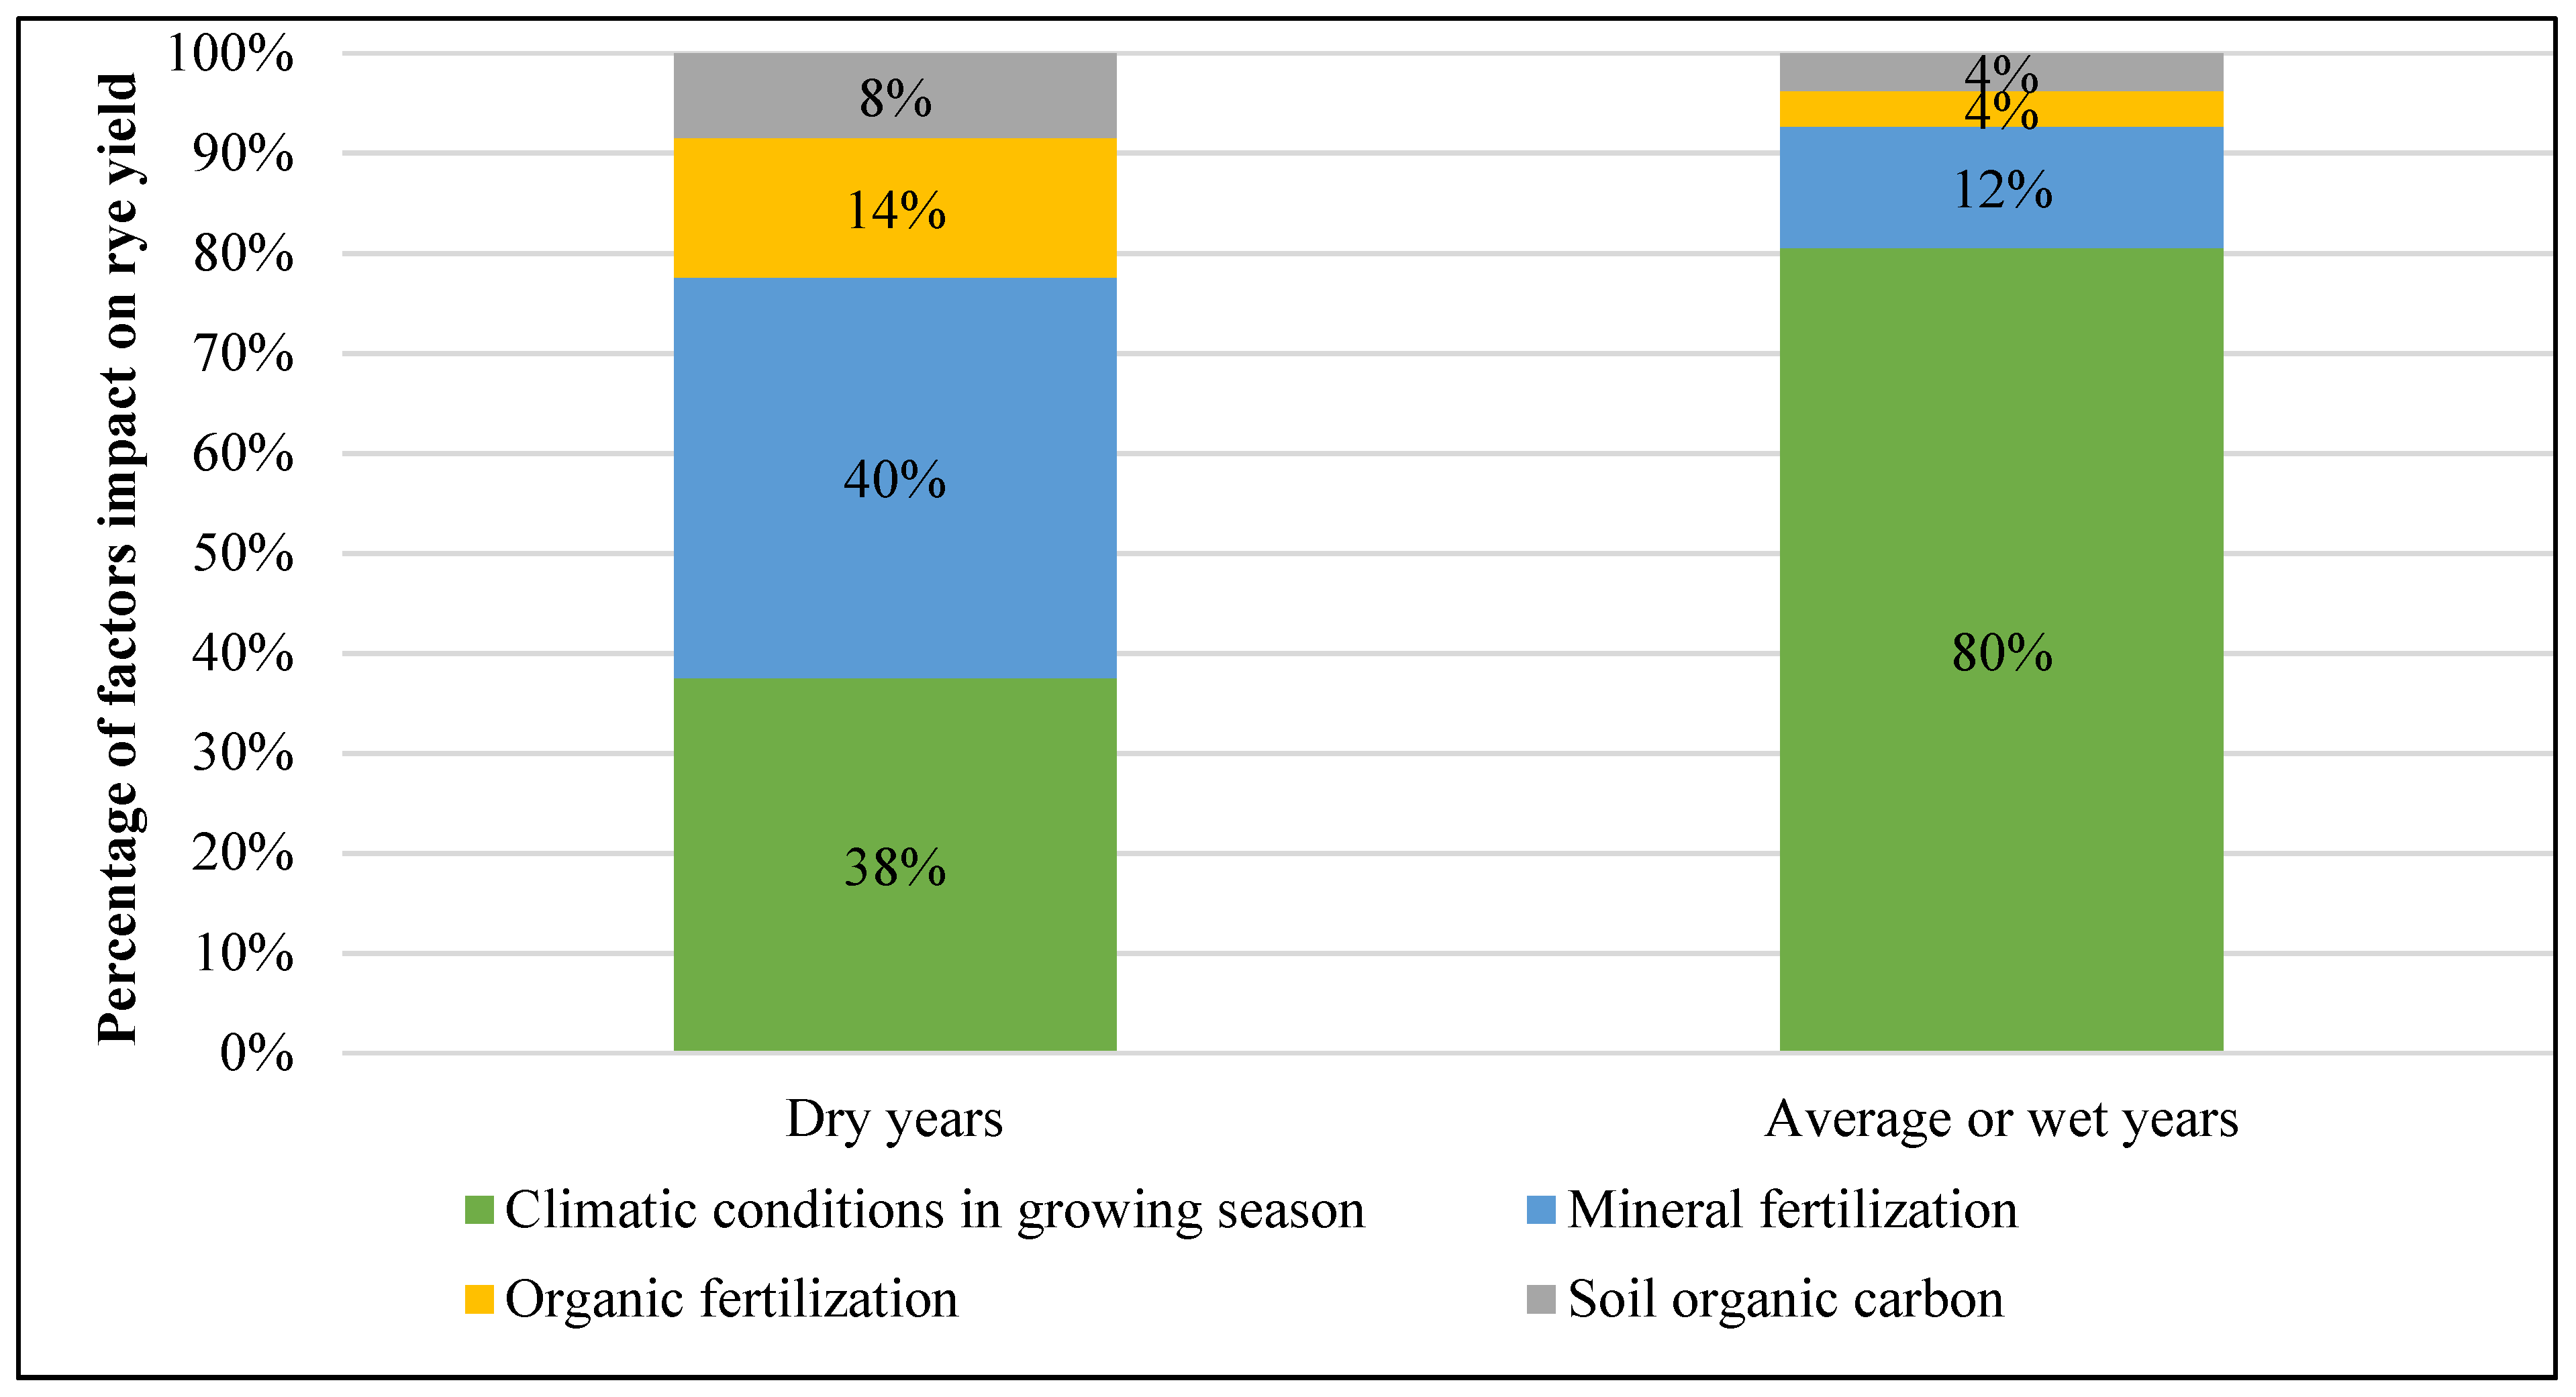
The effects of annual weather conditions, mineral fertilization, additional manure input and soil organic carbon content on the grain yield of winter rye were quantified for dry and average/wet years (Figure 4). In dry years, the effects of weather and mineral fertilization were dominant, explaining 38–40% of rye yield variability, whereas the impact on rye yield variability of additional manure input was lower (14%) and lowest for soil organic carbon (8%). In average or wet years, the impact of annual weather conditions was twice as high (80%), but decreased substantially for mineral fertilization (from 40% to 12%); manure input and soil organic carbon showed the lowest impact on rye yield (both 4%; Figure 4). It can be concluded, that in dry years the yield was limited by annual weather conditions, especially by the total rainfall (restricted water availability; CWB ≤ 100 mm, see Figure A1 and Table A2 in Appendix A). This highlights the importance of a sufficient nutrient supply for crop yield formation in dry years (14%; three times greater than in average or wet years). Favorable soil conditions also played a significant role for yield security, with the impact of soil organic carbon in dry years being twice as high (8%) than in average or wet years (4%) (Figure 4). Thus, appropriate agronomic practices for building-up and maintaining soil organic carbon may enhance soil fertility and water use efficiency, which can help mitigate drought risk and improve cropping systems [29]. The study by [31] reported that soils with greater organic carbon contents plus optimal fertilization (mineral fertilizers and organic manures) provided good condition for plants, promoting an extensive root system and an increase in the amount of beneficial microorganisms in the soil, despite the removal of straw from the field. In another long-term experiment in Europe, [32] observed a significant increase in the amount of soil organic carbon in soils given all three basic nutrients (N, P and K) compared with unfertilized soils or where fertilization was incomplete.
The greater and less variable yields in this study correlated with enhanced soil organic carbon contents (Table 3), indicating a positive and stabilizing effects on rye yield. This may be due to one or more of the effects of enhanced organic matter on soil properties. The study [33] highlighted enhanced nutrient availability, improved soil structure, increased cation exchange and water-holding capacity as some of the main benefits of increasing the organic matter content of agricultural soils. Similar effects of soil organic matter on yields and yield stability of winter wheat have been shown in a Serbian study by [34]. However, rye yields in this study were negatively correlated with soil pH, but had higher and more stable yields under acid soil conditions (lower pH values: 3.9–4.1; Table 3), as was found for treatments given mineral NPK without Ca. In contrast, rye yields decreased and were more variable under less acid soil conditions (higher pH values: 6.5–6.6), as for treatments with ‘CaPK’ (Table 1 and Table 3). Among those fertilizer combinations that were characterized by a relatively high pH were those in which only liming (Ca) was applied, without the use of other mineral fertilizers. As shown in the studies by [35] and [7], grain yield response to soil pH was dependent on the crop species. They observed a strong relationship for wheat, while the oat yield was only slightly dependent on the soil pH. Study [36,37,38] show that rye in comparison with other cereal species does very well on acidic soils. However, one limitation of the Skierniewice LTE is the lack of regular and frequent comprehensive soil properties assessments. Hence, the correlation shown here is based on soil properties measured in a single year (2013; Table 1). More years of soil analyses would be needed to support these findings and would allow for a more complete finding of reasons for the observed yield variability depending on fertilizer combinations. Another limitation of our research is that no full control of liming was used during the establishment of the experiment. The obtained negative correlation between the yield and soil pH is therefore only of limited validity. The only combination without Ca was a combination with optimal NPK fertilization. The subsequent addition of such a full control for lime in the Skierniewice LTE would allow a reliable inference of the relationship between soil pH and rye yield and its temporal variability in future studies. Overall, the results found can be seen as an initial step and underline the high importance of soil fertility, here shown by soil organic carbon and partly for optimal soil pH, for maintaining and stabilizing rye yields in the long-term, particularly under dry conditions. Further research is needed to validate these first indications.

4. Conclusions

This study, based on the unique Skierniewice LTE, provides for the first-time insights on the long-term effects of mineral and organic fertilizers on the yield of winter rye, and its variability. The temporal yield variability of winter rye was influenced by mineral fertilization, organic manure inputs, soil pH and soil organic carbon content. In particular, winter rye given complete mineral fertilization (N, P and K) had the lowest temporal yield variability (Q1). The addition of organic manure increased the yield variability in treatments with mineral N supply, but stabilized rye yields in treatments without N (Q2). Increased levels of soil organic carbon, through the use of organic manures, were associated with larger and more stable rye yields (Q3). The importance of fertilization and soil organic carbon for securing rye yields was greater in dry years than in average or wet years, highlighting the importance of sufficient nutrient supply and water holding capacity for supporting climate-resilient rye production (Q4).
In summary, it was demonstrated that adequate mineral fertilizer inputs are required to achieve acceptable rye yields on sandy soils in Poland; nutrient inputs ranked in decreasing order of importance were N > K > P. The greater benefit of K relative to P might be most likely due to the susceptibility of K losses by leaching on this drought-prone sandy soil, but leaching was not measured. The benefits of organic manure inputs on soil fertility were especially apparent during dry growing seasons for crops with sub-optimal mineral fertilizer inputs, demonstrating the potential to enhance yield security of winter rye grown on acidic, drought-prone soils through the appropriate use of mineral fertilizers and organic manures.
The fact that yields were limited by rainfall on the sandy soil at the study site indicates that irrigation may need to be considered by farmers growing crops on similar soils to mitigate future climate change effects. However, research on the effects of irrigation on the climate resilience of cropping systems needs to consider carefully the associated economic and environmental impacts of such a strategy. In addition, management practices designed to enhance the soil water holding capacity by increasing its organic matter content, for example through the use of manures, straw incorporation or catch crops, may be particularly beneficial for improving the resilience and sustainability of crop production on sandy soils with limited rainfall. Furthermore, the use of LTE data for crop modelling studies and climate change simulations provides a promising approach for testing agronomic adaptation strategies and evaluating the sustainability of new cropping systems designed to mitigate climate change effects (e.g., systems to limit greenhouse gas emissions and enhance soil C sequestration) and maintain high and stable crop yields.
The results and conclusions from this study allow to supplement the Polish agricultural recommendations and for other countries with moderated climate in the goal of counteracting the negative effects of climate change on agricultural production. In particular, one should focus on monitoring the pH value and organic carbon content in the soil, and choose agronomic management improving these two soil properties (e.g., organic manure, leaving crop residues, sufficient nutrient supply and liming). It could be useful for higher and more stable crop yields, especially reduced production risk in dry years. Governments should focus on promoting and encouraging the care of soil organic matter through as plant adapted and integrated fertilization strategies.

Author Contributions

Conceptualization, M.S., J.M. and W.S.; Methodology, M.S., J.M. and W.S.; Investigation, M.S. and J.M.; Writing—Original Draft, M.S. and J.M.; Writing—Review and Editing, M.S., J.M. and A.M.; Supervision, W.S. All authors have read and agreed to the published version of the manuscript.

Funding

MJ has received research grants from the German Research Association (DFG; grant MA 7094/1-1; project no 420210236). AM was supported by the UK Biotechnology and Biological Sciences Research Council as part of the Rothamsted Long-term Experiments National Capability (LTE-NC) project (BBS/E/C/000J0300).

Institutional Review Board Statement

Not applicable.

Informed Consent Statement

Not applicable.

Data Availability Statement

The data presented in this study are available on reasonable request from the corresponding author.

Conflicts of Interest

The authors declare no conflict of interest.

Appendix A

Table A1. Field plan of the Skierniewice long-term experiment (1966–2015). Five-year crop rotation: potato (crop 1)-spring barley (crop 2)-red clover (crop 3)-winter wheat (crop 4)-winter rye (crop 5).
Organic Input Yes
CaCa NPKCa PK
Crop 1Crop 1Crop 1Crop 1Crop 1Crop 1Crop 1Crop 1Crop 1Crop 1Crop 1Crop 1Crop 1Crop 1Crop 1
Crop 2Crop 2Crop 2Crop 2Crop 2Crop 2Crop 2Crop 2Crop 2Crop 2Crop 2Crop 2Crop 2Crop 2Crop 2
Crop 3Crop 3Crop 3Crop 3Crop 3Crop 3Crop 3Crop 3Crop 3Crop 3Crop 3Crop 3Crop 3Crop 3Crop 3
Crop 4Crop 4Crop 4Crop 4Crop 4Crop 4Crop 4Crop 4Crop 4Crop 4Crop 4Crop 4Crop 4Crop 4Crop 4
Crop 5Crop 5Crop 5Crop 5Crop 5Crop 5Crop 5Crop 5Crop 5Crop 5Crop 5Crop 5Crop 5Crop 5Crop 5
Ca NKCa NP.NPK
Crop 1Crop 1Crop 1Crop 1Crop 1Crop 1Crop 1Crop 1Crop 1Crop 1Crop 1Crop 1Crop 1Crop 1Crop 1
Crop 2Crop 2Crop 2Crop 2Crop 2Crop 2Crop 2Crop 2Crop 2Crop 2Crop 2Crop 2Crop 2Crop 2Crop 2
Crop 3Crop 3Crop 3Crop 3Crop 3Crop 3Crop 3Crop 3Crop 3Crop 3Crop 3Crop 3Crop 3Crop 3Crop 3
Crop 4Crop 4Crop 4Crop 4Crop 4Crop 4Crop 4Crop 4Crop 4Crop 4Crop 4Crop 4Crop 4Crop 4Crop 4
Crop 5Crop 5Crop 5Crop 5Crop 5Crop 5Crop 5Crop 5Crop 5Crop 5Crop 5Crop 5Crop 5Crop 5Crop 5
Organic input No
CaCa NPKCa PK
Crop 1Crop 1Crop 1Crop 1Crop 1Crop 1Crop 1Crop 1Crop 1Crop 1Crop 1Crop 1Crop 1Crop 1Crop 1
Crop 2Crop 2Crop 2Crop 2Crop 2Crop 2Crop 2Crop 2Crop 2Crop 2Crop 2Crop 2Crop 2Crop 2Crop 2
Crop 3Crop 3Crop 3Crop 3Crop 3Crop 3Crop 3Crop 3Crop 3Crop 3Crop 3Crop 3Crop 3Crop 3Crop 3
Crop 4Crop 4Crop 4Crop 4Crop 4Crop 4Crop 4Crop 4Crop 4Crop 4Crop 4Crop 4Crop 4Crop 4Crop 4
Crop 5Crop 5Crop 5Crop 5Crop 5Crop 5Crop 5Crop 5Crop 5Crop 5Crop 5Crop 5Crop 5Crop 5Crop 5
Ca NKCa NP.NPK
Crop 1Crop 1Crop 1Crop 1Crop 1Crop 1Crop 1Crop 1Crop 1Crop 1Crop 1Crop 1Crop 1Crop 1Crop 1
Crop 2Crop 2Crop 2Crop 2Crop 2Crop 2Crop 2Crop 2Crop 2Crop 2Crop 2Crop 2Crop 2Crop 2Crop 2
Crop 3Crop 3Crop 3Crop 3Crop 3Crop 3Crop 3Crop 3Crop 3Crop 3Crop 3Crop 3Crop 3Crop 3Crop 3
Crop 4Crop 4Crop 4Crop 4Crop 4Crop 4Crop 4Crop 4Crop 4Crop 4Crop 4Crop 4Crop 4Crop 4Crop 4
Crop 5Crop 5Crop 5Crop 5Crop 5Crop 5Crop 5Crop 5Crop 5Crop 5Crop 5Crop 5Crop 5Crop 5Crop 5
Figure A1. Climatic water balance (CWB) from May to July [mm] in 1966–2015 period in Warsaw University of Life Science Experimental Station in Skierniewice, Poland. Dry years: CWB from May to June ≤−100 mm (n = 27); Average or wet years: CWB from May to June >−100 mm (n = 22).
Agronomy 11 00519 g0a1
Table A2. Monthly and annual precipitation and temperature values across 1966–2015 in Warsaw University of Live Science Experimental Station in Skierniewice, shown as mean (min–max).
MonthPrecipitation Sum [mm]Air Temperature [°C]
MeanMin–MaxMean Min–Max
January25(5.1–80.0)−1.1(−8.4–10.1)
February18.3(3.4–66.1)−2.4(−11.2–8.6)
March41.1(6.4–118.0)8.2(5.4–12.0)
April60(21.3–132.0)13.9(10.6–17.1)
May64.4(5.1–176.1)16.8(14.5–19.3)
June80.7(16.7–203.3)18.7(15.2–22.8)
July63.2(7.4–164.7)17.9(15.3–22.2)
August101.1(46.4–195.6)15.1(13.1–17.0)
September21.2(8.0–78.7)13.5(7.2–15.3)
October20(6.8–68.1)8.1(5.0–12.2)
November22(7.3–87.0)4.3(2.7–9.5)
December35.7(11.7–92.8)2.1(−0.7–8.8)
Annual552.7(400.7–854.5)8.3(6.6–9.9)

References

  1. Ceglar, A.; Zampieri, M.; Gonzalez-Reviriego, N.; Ciais, P.; Schauberger, B.; Van der Velde, M. Time-Varying impact of climate on maize and wheat yields in France since 1900. Environ. Res. Lett. 2020, 15, 094039. [Google Scholar] [CrossRef]
  2. Müller, C.; Elliott, J.; Pugh, T.A.M.; Ruane, A.C.; Ciais, P.; Balkovic, J.; Deryng, D.; Folberth, C.; Izaurralde, R.C.; Jones, C.D.; et al. Global patterns of crop yield stability under additional nutrient and water inputs. PLoS ONE 2018, 13, e0198748. [Google Scholar] [CrossRef]
  3. Ray, D.K.; Gerber, J.S.; MacDonald, G.K.; West, P.C. Climate variation explains a third of global crop yield variability. Nat. Commun. 2015, 6, 5989. [Google Scholar] [CrossRef] [Green Version]
  4. Chmielewski, F.-M.; Köhn, W. Impact of weather on yield components of winter rye over 30 years. Agric. For. Meteorol. 2000, 102, 253–261. [Google Scholar] [CrossRef]
  5. Krueger, E.S.; Ochsner, T.E.; Porter, P.M.; Baker, J.M. Winter rye cover crop management influences on soil water, soil nitrate, and corn development. Agron. J. 2011, 103, 316–323. [Google Scholar] [CrossRef]
  6. Filipek, T.; Skowrońska, M. Current dominant causes and effects of acidification of soils under agricultural use in Poland. Acta Agrophysica 2013, 20, 283–294. [Google Scholar]
  7. Kirchmann, H.; Börjesson, G.; Bolinder, M.A.; Kätterer, T.; Djodjic, F. Soil properties currently limiting crop yields in Swedish agriculture—An analysis of 90 yield survey districts and 10 long-term field experiments. Eur. J. Agron. 2020, 120, 126132. [Google Scholar] [CrossRef]
  8. Onofri, A.; Seddaiu, G.; Piepho, H.-P. Long-Term Experiments with cropping systems: Case studies on data analysis. Eur. J. Agron. 2016, 77, 223–235. [Google Scholar] [CrossRef]
  9. Macholdt, J.; Piepho, H.-P.; Honermeier, B. Does fertilization impact production risk and yield stability across an entire crop rotation? Insights from a long-term experiment. F. Crop. Res. 2019, 238, 82–92. [Google Scholar] [CrossRef]
  10. Berzsenyi, Z.; Győrffy, B.; Lap, D. Effect of crop rotation and fertilisation on maize and wheat yields and yield stability in a long-term experiment. Eur. J. Agron. 2000, 13, 225–244. [Google Scholar] [CrossRef]
  11. Hadasch, S.; Laidig, F.; Macholdt, J.; Bönecke, E.; Piepho, H.P. Trends in mean performance and stability of winter wheat and winter rye yields in a long-term series of variety trials. F. Crop. Res. 2020, 252, 107792. [Google Scholar] [CrossRef]
  12. Macholdt, J.; Honermeier, B. Impact of highly varying seeding densities on grain yield and yield stability of winter rye cultivars under the influence of delayed sowing under sandy soil conditions. Arch. Agron. Soil Sci. 2017, 63, 1977–1992. [Google Scholar] [CrossRef]
  13. Schmidt, L.; Warnstorff, K.; Dörfel, H.; Leinweber, P.; Lange, H.; Merbach, W. The influence of fertilization and rotation on soil organic matter and plant yields in the long-termEternal Rye trial in Halle (Saale), Germany. J. Plant Nutr. Soil Sci. 2000, 163, 639–648. [Google Scholar] [CrossRef]
  14. Wiesmeier, M.; Poeplau, C.; Sierra, C.A.; Maier, H.; Frühauf, C.; Hübner, R.; Kühnel, A.; Spörlein, P.; Geuß, U.; Hangen, E.; et al. Projected loss of soil organic carbon in temperate agricultural soils in the 21st century: Effects of climate change and carbon input trends. Sci. Rep. 2016, 6, 32525. [Google Scholar] [CrossRef] [Green Version]
  15. Macholdt, J.; Gyldengren, J.G.; Diamantopoulos, E.; Styczen, M.E. How will future climate depending agronomic management impact the yield risk of wheat cropping systems? A regional case study of Eastern Denmark. J. Agric. Sci. 2021, 1–16. [Google Scholar] [CrossRef]
  16. Oleksiak, T. Progress in rye breeding and its practical utilization in production in Poland in the years 1986–2000. Biul. IHAR 2006, 220, 171–178. [Google Scholar]
  17. Reckling, M.; Ahrends, H.; Chen, T.-W.; Eugster, W.; Hadasch, S.; Knapp, S.; Laidig, F.; Linstädter, A.; Macholdt, J.; Piepho, H.-P.; et al. Methods of yield stability analysis in long-term field experiments. A review. Agron. Sustain. Dev. 2021. accepted. [Google Scholar]
  18. Gilmour, A.R.; Gogel, B.J.; Cullis, B.R.; Thompson, R.; Butler, D.; Cherry, M.; Collins, D.; Dutkowski, G.; Harding, S.A.; Haskard, K.; et al. ASReml User Guide Release 3.0; Hp1 1ES, VSN International Ltd.: Hemel Hempstead, UK, 2009. [Google Scholar]
  19. Welham, S.; Cullis, B.; Gogel, B.; Gilmour, A.; Thompson, R. Prediction in linear mixed models. Aust. New Zeal. J. Stat. 2004, 46, 325–347. [Google Scholar] [CrossRef]
  20. Shukla, G.K. Some statistical aspects of partitioning genotype-environmental components of variability. Heredity 1972, 29, 237–245. [Google Scholar] [CrossRef]
  21. Szwed, M. Projections of changes of areal evapotranspiration for different land-use units in the Wielkopolska Region (Poland). Theor. Appl. Climatol. 2017, 130, 291–304. [Google Scholar] [CrossRef] [Green Version]
  22. Stępień, W.; Kobiałka, M. Effect of long-term organic and mineral fertilisation on selected physico-chemical soil properties in rye monoculture and five-year crop rotation. Soil Sci. Annu. 2019, 70, 34–38. [Google Scholar] [CrossRef] [Green Version]
  23. van der Bom, F.; Magid, J.; Jensen, L.S. Long-Term P and K fertilisation strategies and balances affect soil availability indices, crop yield depression risk and N use. Eur. J. Agron. 2017, 86, 12–23. [Google Scholar] [CrossRef]
  24. Chloupek, O.; Hrstkova, P.; Schweigert, P. Yield and its stability, crop diversity, adaptability and response to climate change, weather and fertilisation over 75 years in the Czech Republic in comparison to some European countries. F. Crop. Res. 2004, 85, 167–190. [Google Scholar] [CrossRef]
  25. Varvel, G.E. Crop rotation and nitrogen effects on normalized grain yields in a long-term study. Agron. J. 2000, 92, 938–941. [Google Scholar] [CrossRef] [Green Version]
  26. Ellmer, F.; Baumecker, M. (Static nutrient depletion experiment Thyrow. Results after 65 experimental years). Arch. Agron. Soil Sci. 2005, 51, 151–161. [Google Scholar] [CrossRef]
  27. Cakmak, I. The role of potassium in alleviating detrimental effects of abiotic stresses in plants. J. Plant Nutr. Soil Sci. 2005, 168, 521–530. [Google Scholar] [CrossRef]
  28. Marcinkonis, S. Nutrient leaching in dominant lithuanian soils. Arch. Agron. Soil Sci. 2006, 52, 183–191. [Google Scholar] [CrossRef]
  29. Iizumi, T.; Wagai, R. Leveraging drought risk reduction for sustainable food, soil and climate via soil organic carbon sequestration. Sci. Rep. 2019, 9, 19744. [Google Scholar] [CrossRef] [PubMed]
  30. Márton, L. Impact of rainfall, liming, nitrogen (N), phosphorus (P 2 O 5 ), potassium (K 2 O), calcium (CaO), magnesium (MgO) mineral fertilization on triticale (× Triticosecale Wittmack) yield in a monoculture in Hungary. Cereal Res. Commun. 2008, 36, 333–341. [Google Scholar] [CrossRef]
  31. Guo, Z.; Han, J.; Li, J.; Xu, Y.; Wang, X.; Li, Y. Correction: Effects of long-term fertilization on soil organic carbon mineralization and microbial community structure. PLoS ONE 2019, 14, e0216006. [Google Scholar] [CrossRef]
  32. Körschens, M.; Albert, E.; Armbruster, M.; Barkusky, D.; Baumecker, M.; Behle-Schalk, L.; Bischoff, R.; Čergan, Z.; Ellmer, F.; Herbst, F.; et al. Effect of mineral and organic fertilization on crop yield, nitrogen uptake, carbon and nitrogen balances, as well as soil organic carbon content and dynamics: Results from 20 European long-term field experiments of the twenty-first century. Arch. Agron. Soil Sci. 2013, 59, 1017–1040. [Google Scholar] [CrossRef]
  33. Johnston, A.E.; Poulton, P.R.; Coleman, K. Chapter 1, Soil Organic Matter: Its importance in sustainable agriculture and carbon dioxide fluxes. Adv. Agron. 2009, 101, 1–57. [Google Scholar] [CrossRef]
  34. Seremesic, S.; Milosev, D.; Djalovic, I.; Zeremski, T.; Ninkov, J. Management of soil organic carbon in maintaining soil productivity and yield stability of winter wheat. Plant Soil Environ. 2011, 57, 216–221. [Google Scholar] [CrossRef] [Green Version]
  35. Holland, J.E.; White, P.J.; Glendining, M.J.; Goulding, K.W.T.; McGrath, S.P. Yield responses of arable crops to liming—An evaluation of relationships between yields and soil pH from a long-term liming experiment. Eur. J. Agron. 2019, 105, 176–188. [Google Scholar] [CrossRef] [PubMed]
  36. Bona, L.; Wright, R.J.; Baligar, V.C.; Matuz, J. Screening wheat and other small grains for acid soil tolerance. Landsc. Urban Plan. 1993, 27, 175–178. [Google Scholar] [CrossRef]
  37. Slootmaker, L.A.J. Tolerance to high soil acidity in wheat related species, rye and triticale. Euphytica 1974, 23, 505–513. [Google Scholar] [CrossRef]
  38. Pinto-Carnide, O.; Guedes-Pinto, H. Differential aluminum tolerance of Portuguese rye populations and North European rye cultivars. Agronomie 2000, 20, 93–99. [Google Scholar] [CrossRef]
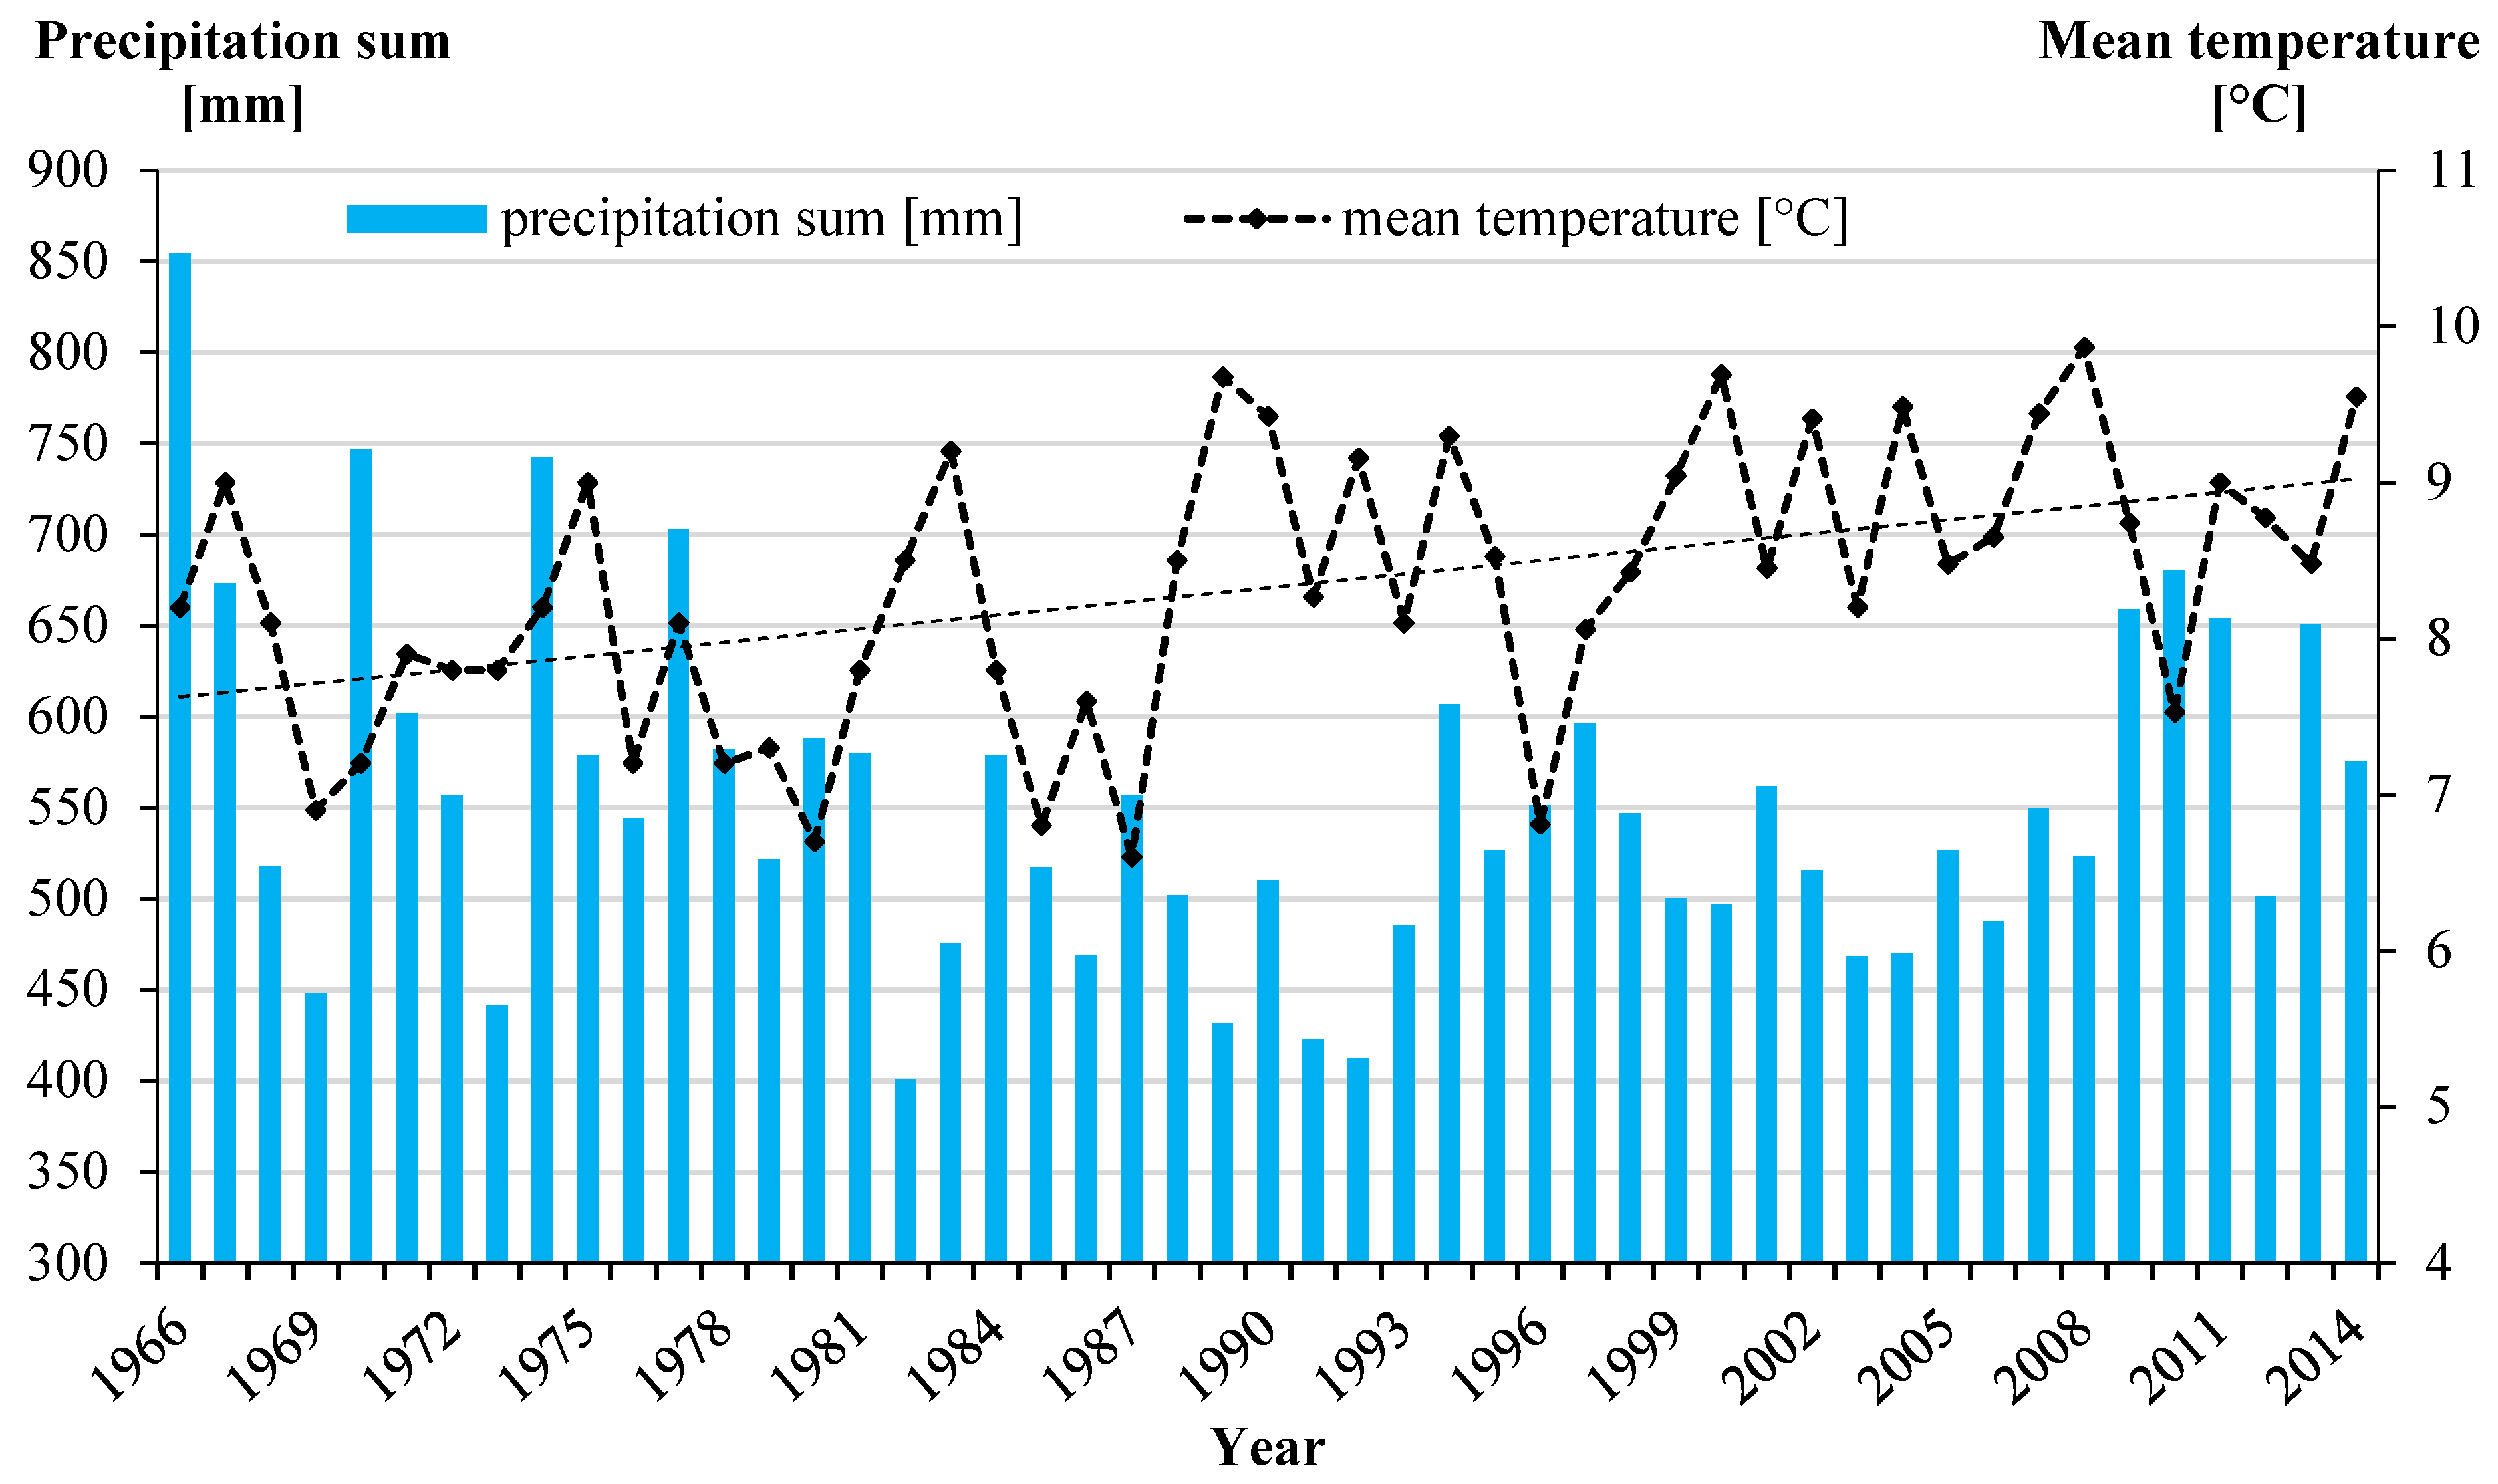
Figure 1. Annual precipitation sum [mm] and mean air temperature [°C] in 1966–2015 period in Warsaw University of Live Science Experimental Station in Skierniewice, Poland. A significant increasing linear trend (black dotted line) is shown for annual air temperature (β = 0.03, R2 = 0.22, p-value = 0.0006) Monthly values (mean, min and max) for precipitation and air temperature are shown in Table A2 (Appendix A).
Agronomy 11 00519 g001
Figure 2. Mean yield of winter rye depending on the mineral fertilization treatment without and with additional organic input (Skierniewice Long-Term Experiment ‘LTE’ 1966–2015). Different letters indicate significant (p < 0.05) differences between the treatments (combinations of mineral and organic fertilization).
Agronomy 11 00519 g002
Figure 3. Temporal yield variability of winter rye depending on the mineral fertilization treatment without and with additional organic input (Skierniewice LTE 1966–2015). Higher values indicate more variable yields (year-to-year fluctuations); lower values indicate more stable yields.
Agronomy 11 00519 g003
Figure 4. Percentage of factors impact on the grain yield of winter rye in dry years (left bar) and average or wet years (right bar) (Skierniewice LTE 1966–2015), obtained used variance components from a linear mixed model. Definition of dry years: CWB from May to June ≤100 mm (n = 27); Definition of average or wet years: CWB from May to June >100 mm (n = 22); All values are significant for p < 0.05. See specific CWB values (1966–2015) in Figure A1 (Appendix A).
Agronomy 11 00519 g004
Table 1. Soil properties (at 0–25 cm depth) for the different fertilization treatments in the Skierniewice long-term experiment (LTE), as measured in 2013.
Mineral Fertilization TreatmentAdditional Organic InputpH
in KCl
Hydrolytic Acidity [mmol/kg]C Organic
[g/kg Soil]
N Total
[g/kg Soil]
P Available
[g/kg Soil]
K Available
[g/kg Soil]
CaNo6.124.33.90.400.0110.042
CaPKNo6.510.84.20.350.0190.152
CaNKNo6.213.74.20.420.0170.115
CaNPNo6.312.84.10.470.1020.040
CaNPKNo6.111.64.60.570.0840.116
NPKNo3.937.54.50.590.0780.098
CaYes6.224.64.20.480.0210.056
CaPKYes6.612.24.60.590.0600.135
CaNKYes6.314.54.70.700.0290.125
CaNPYes6.513.44.50.700.0530.054
CaNPKYes6.314.55.10.700.0630.109
NPKYes4.137.75.00.660.0500.102
Table 2. Mean yields of winter rye in dry years versus average or wet years, and their correlations with climate water balance (CWB: May–June) (Skierniewice LTE 1966–2015).
Mineral Fertilization TreatmentAdditional Organic InputMean Yield of Winter Rye [t/ha]Correlation Coefficients between CWB and Mean Yield of Winter Rye
Dry YearsNon-Dry Years
CaNo1.56a1.50a−0.12
CaPKNo1.78a1.74a−0.03
CaNKNo2.80a2.99a−0.02
CaNPNo3.09a3.78b0.36*
CaNPKNo4.02a4.34b0.16
NPKNo3.88a4.38b0.27
CaYes2.34a2.78b0.27
CaPKYes2.68a3.03b0.22
CaNKYes3.28a3.79b0.28
CaNPYes3.60a4.15b0.43*
CaNPKYes3.89a4.52b0.46*
NPKYes3.87a4.33b0.39*
Note: Dry years: CWB from May to June ≤ −100 mm (n = 27); Average or wet years: CWB from May to June > −100 mm (n = 22) (see also Figure A1); Different small letters indicate significant (p < 0.05) differences between the mean yield of winter rye in dry versus average/wet years within each treatment; asterisked values indicate significant correlation coefficients (p < 0.05).
Table 3. Spearman rank correlation coefficients between mean yield, temporal yield variability of winter rye and two selected soil properties (Skierniewice LTE 1966–2015).
Soil PropertiesMean Yield of Winter Rye Across All Study Growing Seasons (1966–2015)Mean Yield of Winter Rye from 2011–2015 Period (Last 5 Growing Seasons)Mean Yield of Winter Rye from 2006–2015 Period (Last 10 Growing Seasons)Temporal Yield Variability of Winter Rye
Soil organic carbon0.830.910.88−0.60
pH in KCl−0.67−0.78−0.770.49
Note: Soil properties measured in the year 2013 as described in Table 1; all correlation coefficients significant for p < 0.05. A negative correlation for temporal yield variability indicates more stable yields (assessed as ‘good’).
Publisher’s Note: MDPI stays neutral with regard to jurisdictional claims in published maps and institutional affiliations.