1. Introduction
Macro-elements play an important role in plant nutrition and plant health. Among these, the cations K
+, Ca
2+ and Mg
2+ are particularly important [
1,
2]. K
+ is the most abundant cation in plant tissue; its concentration in the cytoplasm reaches 200 mM, and it accounts for up to 6% of dry plant weight [
3]. K
+ is readily translocated in the phloem and xylem and moves through tissues and into cells via K channels [
4]. K
+ helps to regulate the electrical charge in cells and control the acidity of the cytosol and chloroplasts and plays a role in enzymatic reactions [
5]. K
+ also affects the process of photosynthesis, including the turgor pressure that opens and closes stomata, other osmoregulation, cell elongation, upregulation of enzyme expression and protein synthesis [
3,
6]. In sweet basil, K deficiency inhibits growth and leads to the development of thin stems, leaf-edge necrosis and slow-developing roots (Yigal Elad, unpublished data).
When present at optimal concentrations, K decreases plants’ susceptibility to disease [
1]. It increases the thickness of the walls of epidermal cells [
4] and decreases the availability of sugar, amino acids and organic acids that are essential to the parasites’ nutrition [
3]. K regulates the plant’s reaction to stress, including reactive oxygen species, as well as jasmonic acid, ethylene and auxins [
7,
8]. Increased K levels are associated with high levels of the phenols rosmarinic acid and chicoric acid and increased anti-oxidative activity in sweet basil [
9]. K is known to reduce the incidence diseases caused by the ascomycete pathogens
Botrytis cinerea and
Sclerotinia sclerotiorum [
10,
11]. It also effectively suppresses the severity of downy mildew (
Peronospora plantaginis) in isabgol (
Plantago ovata) [
12].
The translocation of Ca
2+ in the xylem vessels of the plant is governed by transpiration during the day and by root pressure at night. Cations such as Mg
2+ and K
+ compete with Ca
2+ for absorption in the roots [
13,
14]. Ca accounts for between 0.1 and 5% of the plant’s dry weight [
4]. Ca mediates various activities in the plant tissues, including polar cell growth, cytoplasmic flow, mitosis and cytokinesis. It is a secondary messenger in signal pathways, an activator of enzymes and associates with Ca-binding proteins [
14]. In sweet basil plants, Ca deficiency causes root degeneration, necrotic lesions on leaves and defoliation (Yigal Elad, unpublished data).
Ca is an important part of plant defense systems [
15]. It is important for membrane function and stability and for preventing solutes like sugars and amino acids from leaking from the cytoplasm into the apoplast; these activities help to prevent disease. Ca is an important constituent of cell walls, and especially pectin, as it binds oligomers of pectin, and so helps to prevent pathogen penetration. It also acts against pathogens’ cell wall-degrading enzymes [
15,
16]. Apart from those direct effects, Ca also plays a role in the expression of defense-related genes, the activity of pathogenesis-related proteins and hypersensitive reactions [
17,
18,
19]. Ca increases plants’ resistance to pathogens such as species of
Pythium,
Sclerotinia,
Botrytis and
Fusarium [
20]. In sweet basil, Ca has been shown to reduce the incidence of
Botrytis cinerea and
Sclerotinia sclerotiorum [
10,
11]. Sprayed applications of Ca have been shown to reduce the severity of downy mildew (
Sclerospora graminicola) in pearl millet (
Pennisetum glaucum) [
21].
The concentration of Mg in cells is 15 to 25 mM [
22], and it is mostly found in the cells’ organelles [
23]. Mg is translocated in the phloem and accumulates in cell vacuoles. Its absorbance by the roots is especially affected by Ca, K and Mn [
24]. It is involved in protein synthesis, DNA and RNA synthesis, phosphorylation, cell energy transformation, carbohydrate metabolism and movement [
4]. Mg is also important for photosynthesis; about 20% of the Mg in plant cells is part of chlorophyll molecules [
22]. In most plants, Mg deficiency is manifested as chlorosis and leaf necrosis [
24]. Mg affects plant diseases, directly and indirectly, through its antagonistic interactions with other minerals (e.g., Ca, K and Mn) [
25]. The severity of disease caused by
Fusarium oxysporum f. sp.
conglutinans in cotton (
Gossypium arboreum) is reduced when Mg is available at optimal levels. A high concentration of Mg that interferes with Ca absorption increases the severity of bacterial speck (
Xanthomonas campestris pv.
vesicatoria) in tomato (
Solanum lycopersicum [
25]. Mg has also been shown to decrease the severity of tobacco downy mildew (
Peronospora tabacina) [
26].
Downy mildew (
Peronospora belbahrii) is a major foliar disease of sweet basil (
Ocimum basilicum) in Israel [
27]. We examined the effects on sweet basil downy mildew (SBDM) of Ca, Mg, and K applied alone or in combination with each other through the irrigation solution or as a foliar spray. In this study, we first determined the optimal concentrations for applications of each of the mineral cations in potted plants and then examined the effects of a limited number of concentrations on SBDM under commercial conditions for six growing seasons (three years). We also examined the relationships between various nutritional elements in the sweet basil plants and SBDM severity.
2. Materials and Methods
2.1. Plants and Growing Conditions
Sweet basil (
Ocimum basilicum) cv. Peri [
28] was used for all of our experiments. The seedlings were grown in a commercial nursery (Shorashim, Mivtahim, Israel) and transplanted for the experiments 3 to 4 weeks after seeding in the nursery. The “Peri” cultivar is known to be susceptible to
Peronospora belbahrii [
27]. Plugs of sweet basil seedlings were used, each containing three to five plants; hereafter, one plug is referred to as a “plant” as is common practice [
11]. The experiments involving potted plants were performed at two sites in Israel: the Gilat Research Center in the northern Negev (Site A) and the Volcani Center in Rishon LeZion (Site B). Experiments were also carried out using plants grown in containers under commercial greenhouse conditions at the Tzvi Experimental Station in the Jordan Valley, Israel (Site C).
At Sites A and B, experiments were carried out in 2-L pots. At Site C, the experiments were carried out in 500-L containers. For the fertigation experiments, sweet basil plants were planted in the pots or containers filled with perlite (medium size, 1.2 mm, Agrifusia, Fertilizers & Chemicals Ltd., Haifa, Israel). For the experiments involving the foliar salt treatments, we used a potting mixture consisting of coconut fiber:tuff (unsorted to 8 mm; 7:3 vol.:vol.) The plants were irrigated to excess via a drip system two to four times a day, depending on the season, at a volume calibrated to lead to >30% water leaching. The daily irrigation volume was determined after analyzing the irrigation and drainage solutions once every 2 weeks, to prevent over-salinization or acidification of the root-zone solution. Plants in pots and containers were maintained according to the local extension service’s recommendations. All pot experiments were irrigated with fresh water (electrical conductivity (EC) < 1.0 dS/m). The tested elements were applied with the irrigation water (fertigation) or as a foliar spray, as described below and summarized in
Table 1.
2.2. Pot Experiments
2.2.1. Effects of Different Concentrations of K, Ca and Mg in the Fertigation Solution on SBDM (Experiments A)
Pot experiments were conducted in an unheated, polyethylene-covered greenhouse located at Site A. The aim of these experiments was to study the effects of different K, Ca and Mg concentrations in the fertigation solution (“f” treatments) on the development of SBDM in potted sweet basil plants. The sweet basil plants were planted in 2-L perlite-filled pots with one plant per pot, in 10 replicates, and each set of cation-concentration was repeated twice with 10 replicates each.
Nutrient solutions were prepared in 500-L containers containing all of the added nutrients. All of the plants were fertigated with 5-3-8 (N-P
2O
5-K
2O) fertilizer (Fertilizers and Chemical Compounds Ltd., Haifa, Israel) until the first shoot harvest. Later on, the effect of cation concentration was tested by tailoring the fertigation solution to each K, Ca and Mg concentration of interest, as described below. The concentrations of nutrients that were not part of the experiments and remained the same across all treatments were as follows: 5.7 mM N (90% NO
3−-N and 10% NH
4+-N), 0.35 mM P, 2.6 mM K (excluding Experiment A1-K below), 1.3 mM Ca (excluding Experiment A1-Ca below), 0.54 mM Mg (excluding Experiment A1-Mg below), 1.1 mM SO
4−2, 0.023 mM B, 9.8 µM Fe, 4.9 µM Mn, 2.1 µM Zn, 0.31 µM Cu and 0.16 µM Mb. Solutions were prepared by dissolving KH
2PO
4, K
2SO
4, KNO
3, NH
4H
2PO
4, NaNO
3, and NH
4NO
3 in water [
29]. In Experiment A1-Ca, Ca was applied as CaCl
2 and, in Experiment A1-Mg, Mg was applied as MgCl
2.
When the plants reached a height of 45 to 50 cm, they were artificially inoculated with P. belbahrii as described below.
2.2.2. K Concentration in the Fertigation Solution (Experiment A-K-f)
The aim of these experiments was to study the effect of the K concentration in the fertigation solution on the development of SBDM in potted sweet basil plants. To characterize the response of sweet basil plants to different concentrations of K in the fertigation solutions, five K concentrations (0.5, 0.8, 1.3, 2.6 and 5.1 mM) were used while the concentrations of the other nutritional elements were kept constant. The EC in the different K-f treatments was 1.03–1.36 (dS)/m, and the pH of the fertigation solution was 6.99–7.42.
2.2.3. Ca Concentrations in the Fertigation Solution (Experiment A-Ca-f)
The aim of these experiments was to study the effect of Ca concentration on the development of SBDM in potted sweet basil plants. To characterize the response of sweet basil plants to different concentrations of Ca in the fertigation solutions, six Ca concentrations (0.50, 1.00, 1.75, 2.75, 4.00 and 6.00 mM) were used while the concentrations of the other nutritional were kept constant. The EC in the different Ca-f treatments was 0.99–2.50 dS/m and the pH of the fertigation solution was 6.43–7.12.
2.2.4. Mg Concentrations in the Fertigation Solution (Experiment A-Mg-f)
The aim of these experiments was to study the effect of the Mg concentration in the fertigation solution on the development of SBDM in potted sweet basil plants. To characterize the response of sweet basil plants to different concentrations of Mg, six Mg concentrations (0 (distilled water used), 0.4, 0.8, 1.6, 3.3 and 4.9 mM) were used while the concentrations of the other nutritional elements were kept the same for all treatments. The EC in the different Mg-f treatments was 0.84–1.78 dS/m, and the pH of the fertigation solution was 5.62–6.95.
2.3. Foliar Application of Salt Solutions to Potted Sweet Basil Plants (Experiments B1 [Ca-s, Mg-s, K-s])
Sweet basil was transplanted into pots containing growth mixture, as described above, unless noted otherwise. Fertigation was carried out with the fertilizer 4-2-6 (N-P2O5-K2O) +3% microelements (Gat Fertilizers, Kiryat Gat, Israel) throughout the experiment. Following two shoot harvests, when plants in the experiments reached 45 to 50 cm in height, the foliar treatment was initiated, and plants were artificially inoculated with P. belbahrii. Experiments B were repeated twice with 5 replicates each.
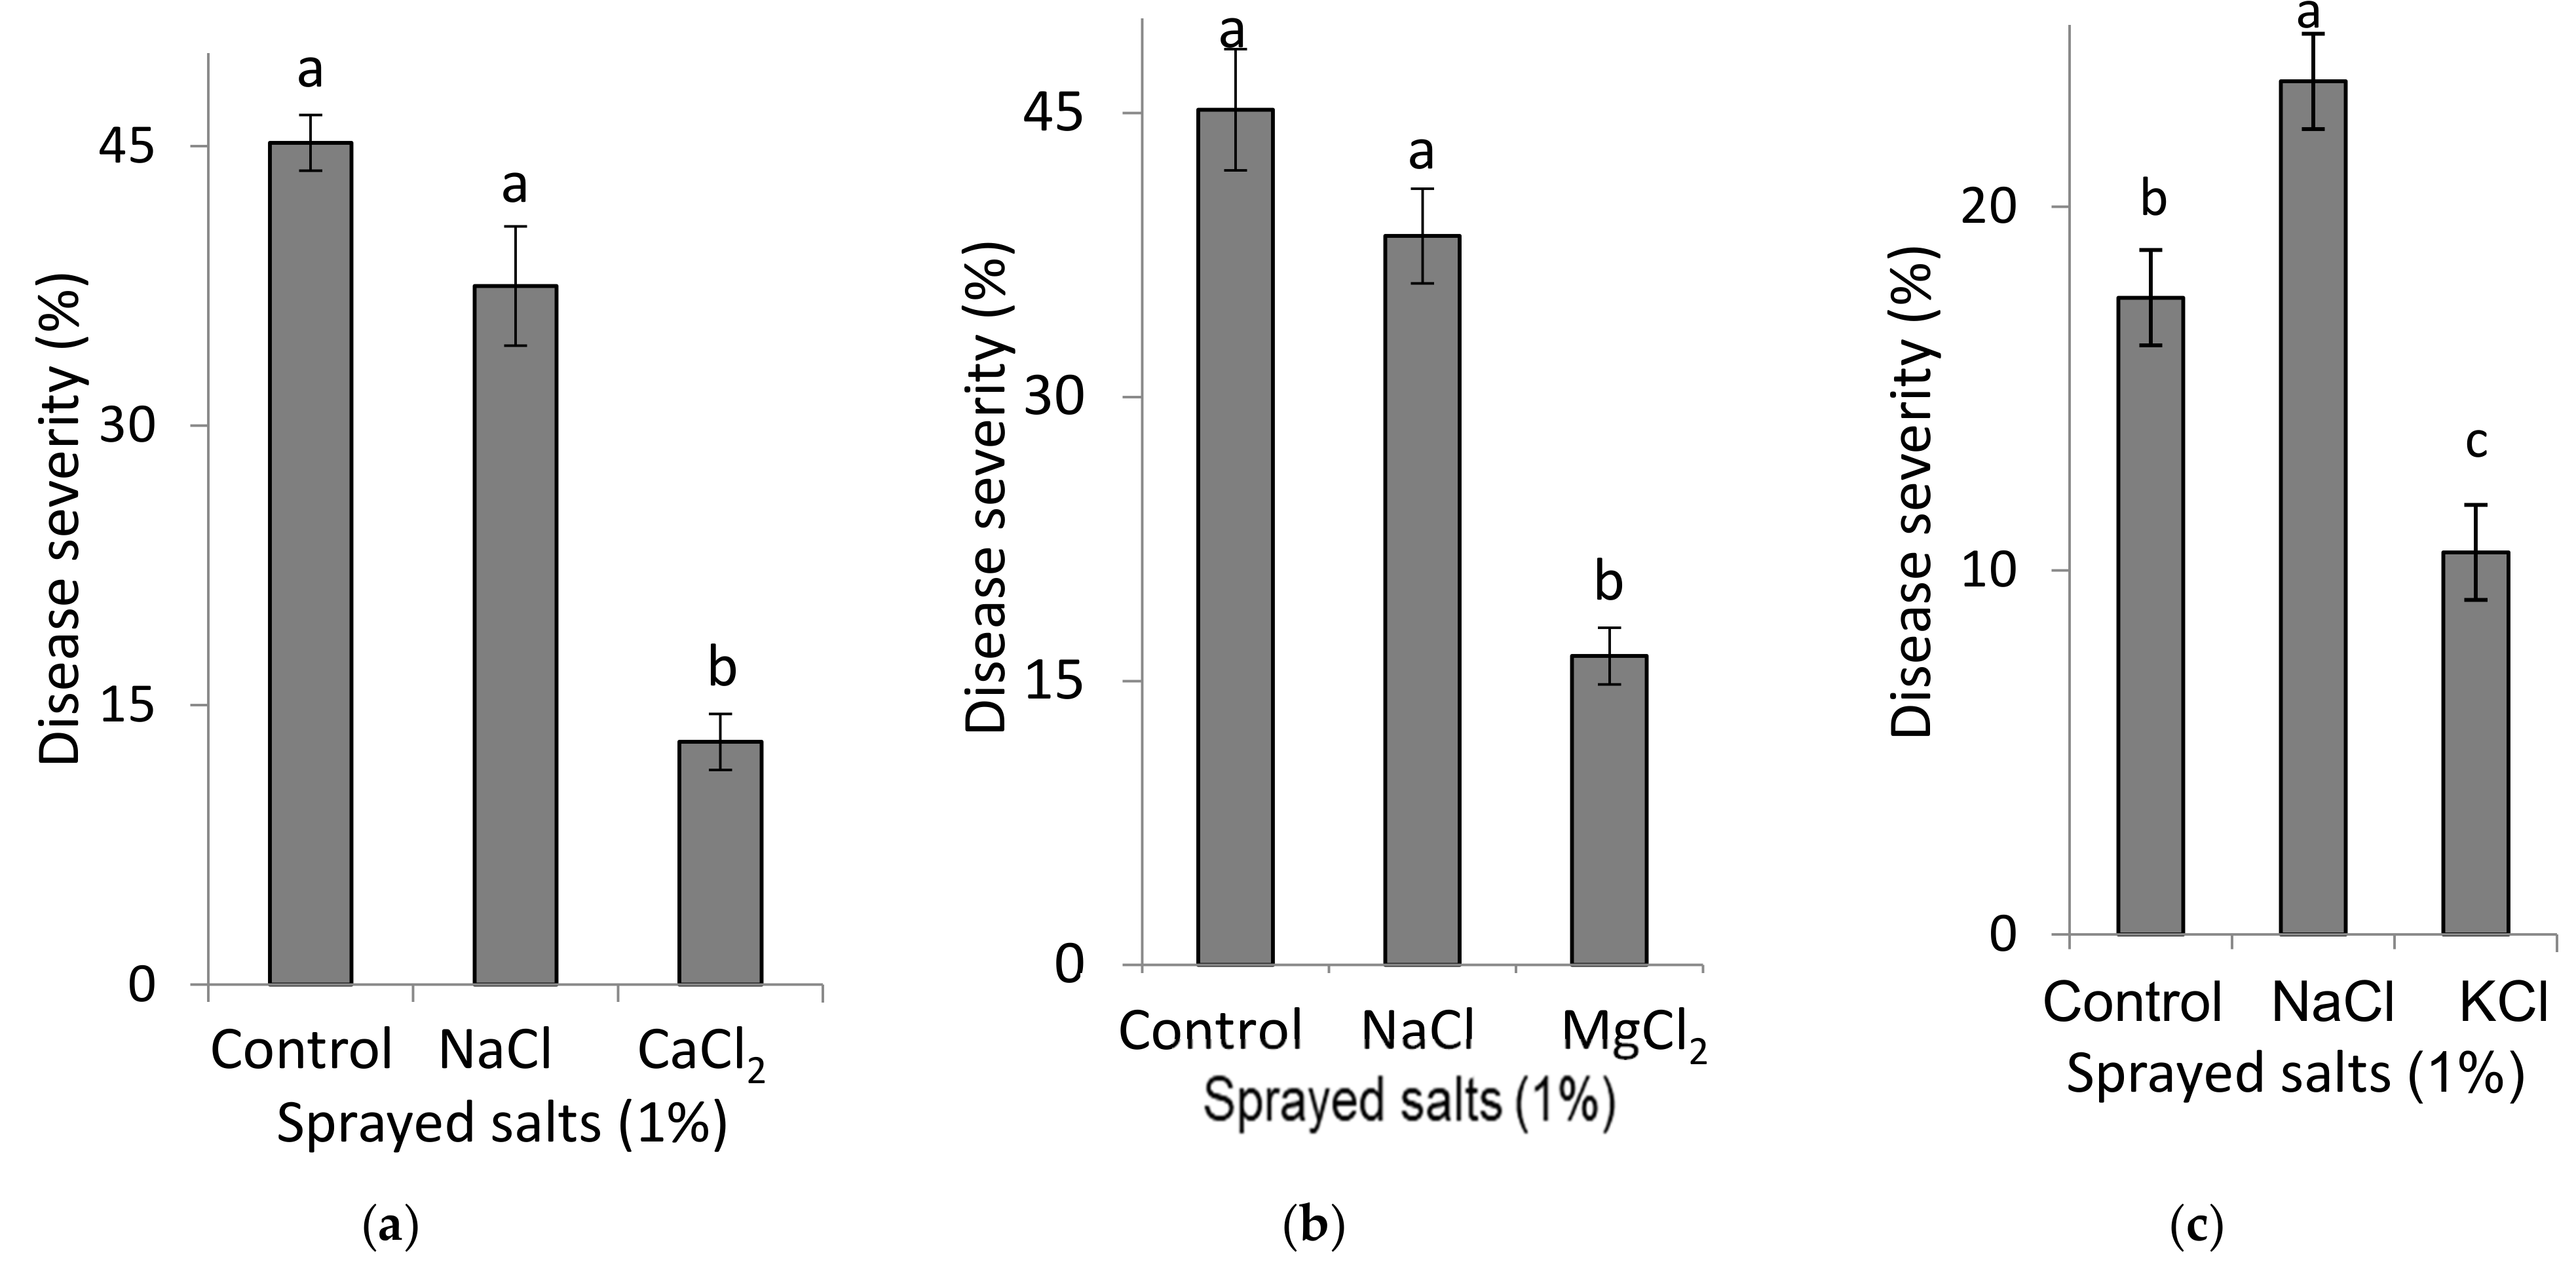
2.3.1. Spray Applications of Ca and Mg Salts to Sweet Basil Plants (Experiment B1-[Ca-s, Mg-s, K-s])
Experiments were conducted to test the effects of foliar-applied Ca, Mg and K on SBDM, as generally described for the B1 experiments. The effects of spray solutions containing 1% CaCl2, MgCl2 or KCl (90, 105 and 134 mM Ca, Mg and K, respectively) were each compared with the effects of a spray solution containing 1% NaCl (171 mM Na). Six foliar sprays were applied twice a week for a period of three weeks. At each application, 5 mL of spray solution were applied to each plant using a hand sprayer that emits fine drops, until runoff.
2.3.2. Spray Applications of K Salt Solutions to Sweet Basil Plants (Experiments B2-K-s)
To examine the effect of foliar applications of K on SBDM, experiments were conducted under the same conditions as described for the B1 experiments. Four K concentrations (0%, 0.5%, 1.0% and 1.5%, corresponding to 0, 67, 134 and 201 mM K, respectively, as KCl, and 0, 57, 114, and 171 mM K as K2SO4 (were used in spray solutions in which the salts were KCl or K2SO4 (Fertilizers & Chemical Compounds Ltd., Haifa, Israel). Six foliar sprays were applied twice a week for a period of three weeks. At each application, 5 mL of spray solution were applied to each plant using a hand sprayer that emits fine drops, until runoff.
2.3.3. Fertigation in Combination with the Foliar Application of K (Experiment B3 [Ca-f, Mg-f, K-s])
Plants potted in perlite were fertigated with a fertilizer containing 4-2-6 (N-P2O5-K2O) +3% microelements (Gat Fertilizers, Kiryat Gat, Israel) throughout the experiment as described above. Two Ca concentrations in the fertigation solution were evaluated: 1.5 and 3.9 mM Ca. In addition, two Mg concentrations in the fertigation solution were evaluated: 0.3 and 2.0 mM. Spray treatments containing 1% K2SO4 (114 mM K) were applied to the plants, to runoff, twice a week for three weeks, as described above. The K concentration in the fertigation solution ranged from 1.87 to 2.06 mM. The EC was 1.05–1.16 dS/m and the pH was 6.69–7.47.
2.4. Greenhouse Experiments (C)
At Site C, experiments were carried out in a polyethylene-covered greenhouse. Sweet basil plants were planted in perlite (medium size, 1.2 mm, Agrifusia) growth medium in polystyrene containers (1.0 × 0.8 × 0.17 m), with 24 plants per container. Plants were irrigated daily according to local extension service recommendations. During the initial 5 days, plants were sprinkler-fertigated with 4.3 mM N (10% NH4+), 1.6 mM K and 0.65 mM P in the fertigation solution to aid their establishment. After that initial period, the plants were irrigated through drippers and fertilized with 8.57 mM N, 3.2 mM K and 0.65 mM P in water until the fertigation treatments were initiated, as described below. Fertigation was performed from 1000-L tanks dedicated to each treatment, with a 17-mm drip-irrigation pipe that had a 2-L/h dripper embedded every 20 cm along its length. Spray treatments were carried out with a backpack sprayer equipped with a conical nozzle. Sprays were administrated until runoff, once or twice a week. Experiments were carried out in the autumn (September–January) or spring (February–June) growing seasons. The experiment was conducted in randomized blocks with four replicates. Each replicate consisted of three containers.
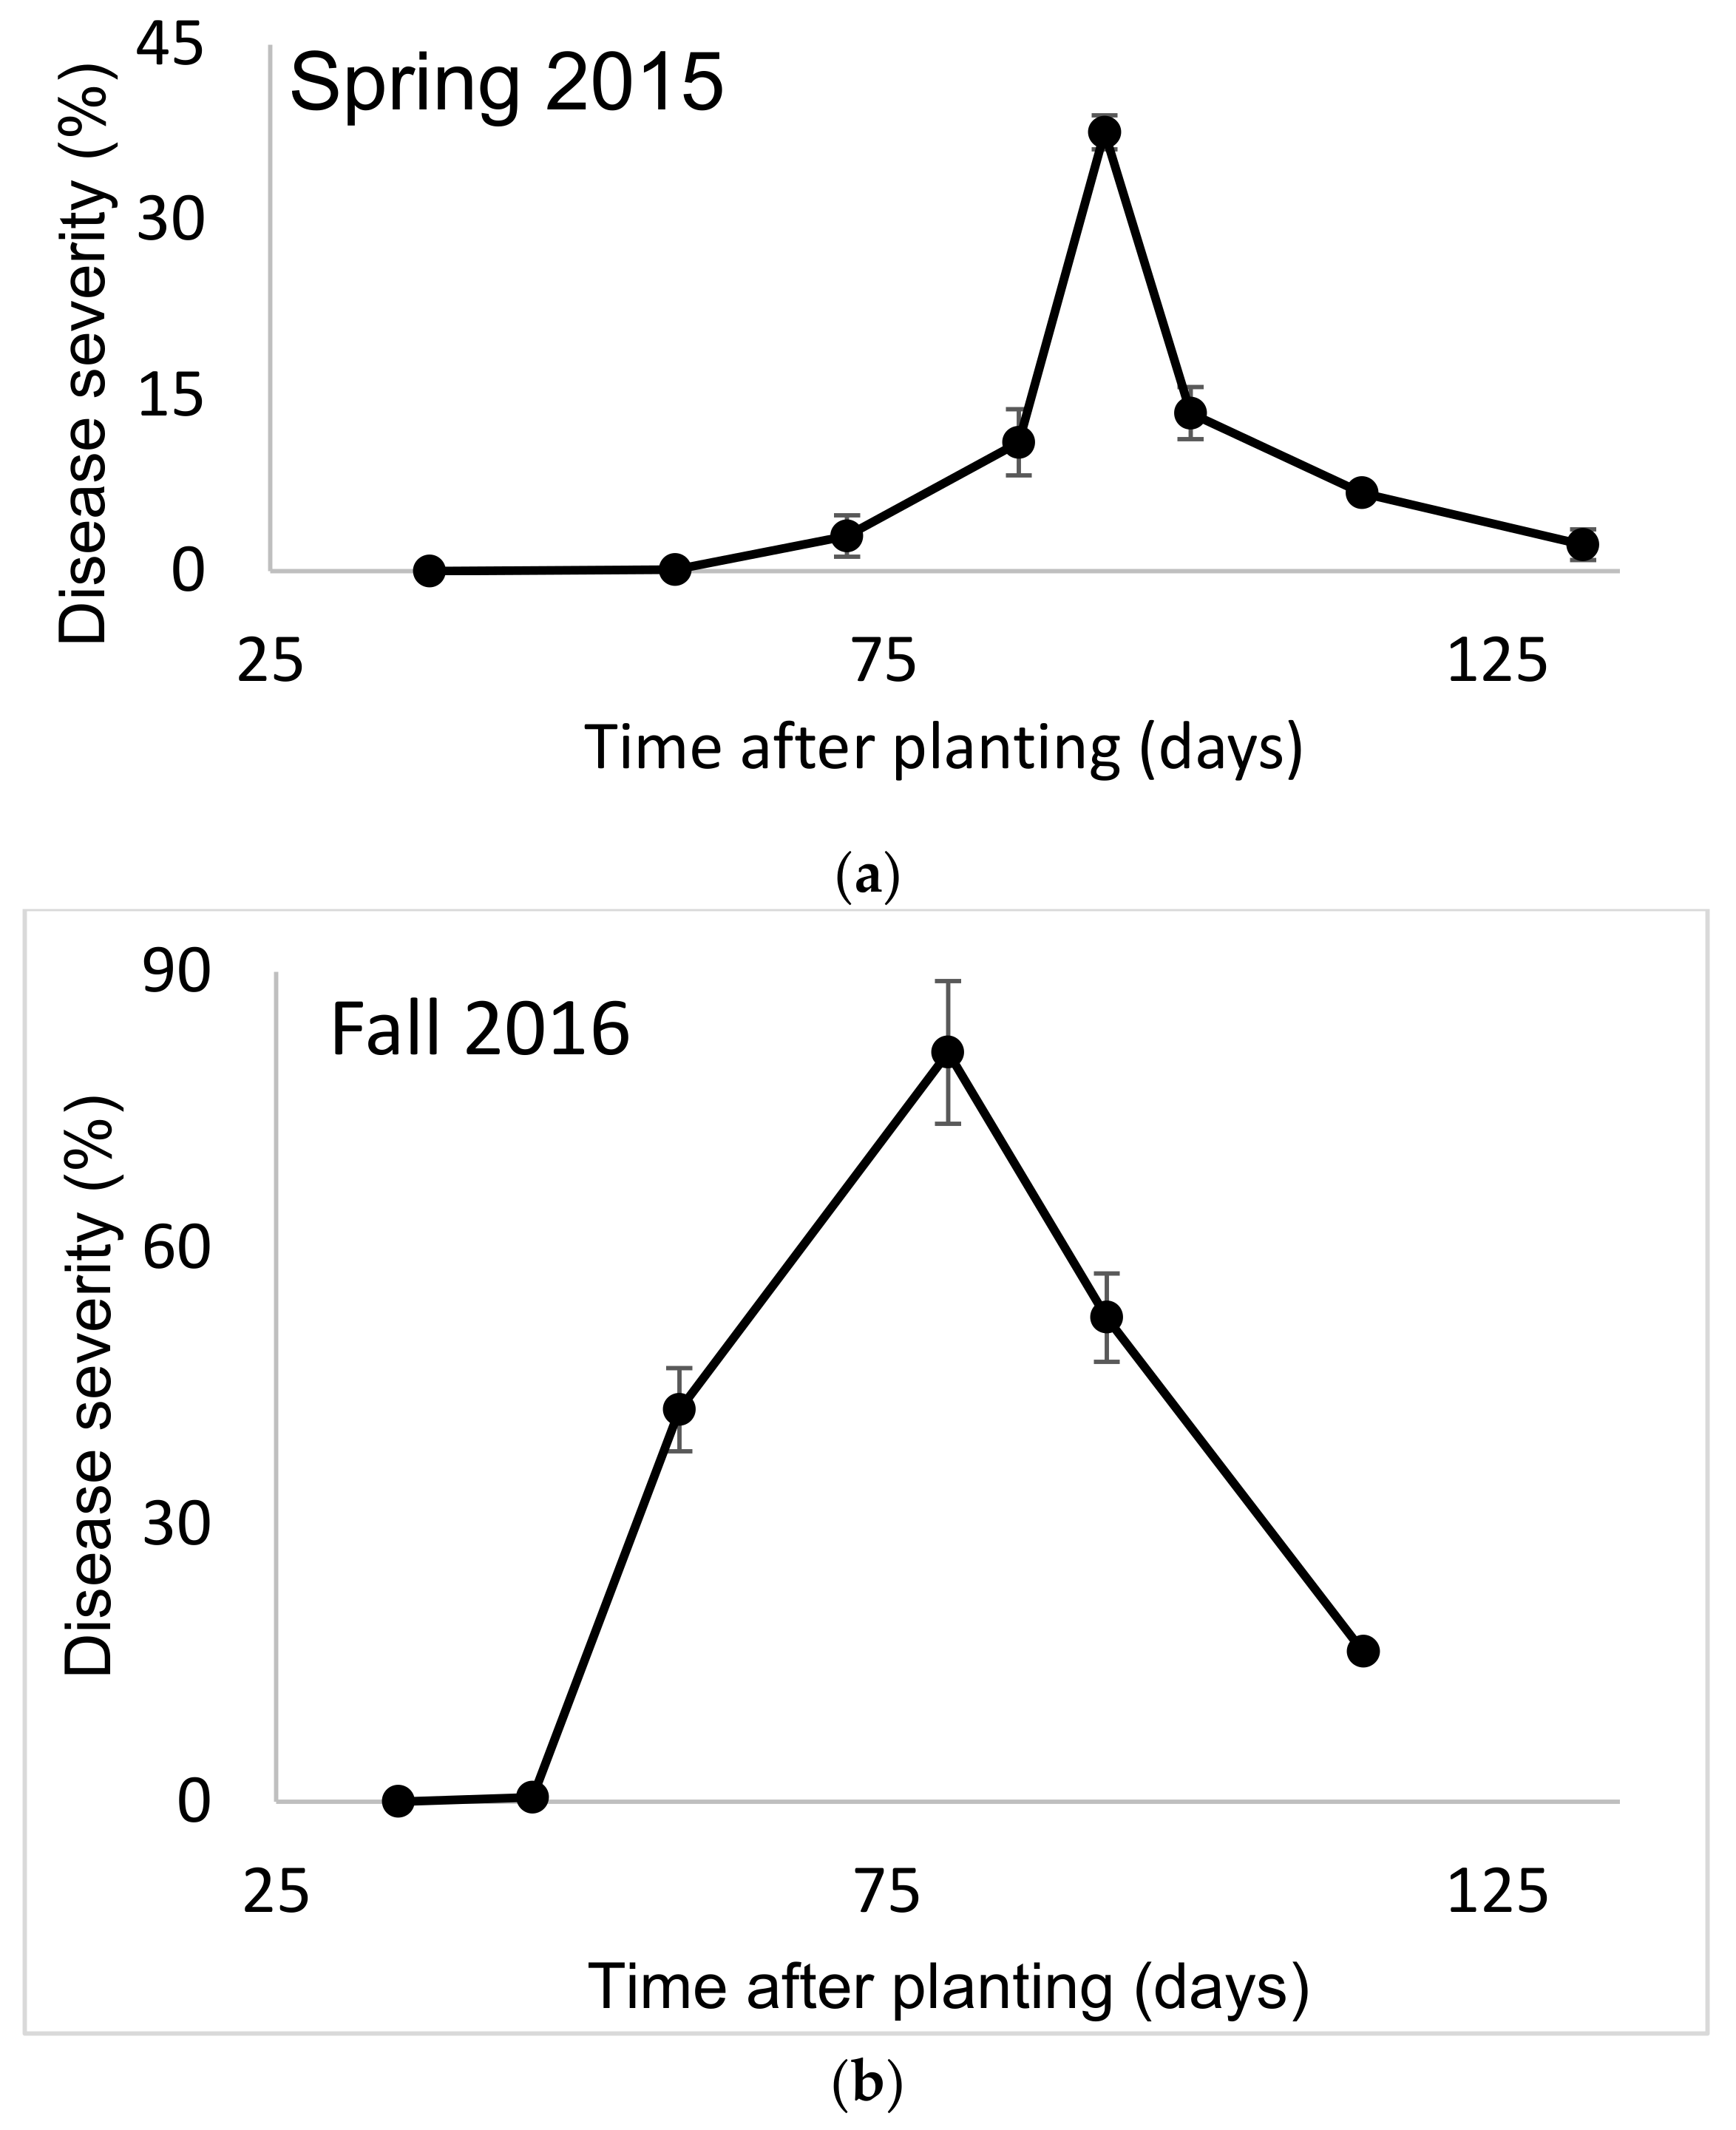
SBDM usually appears 45–60 days after planting, reaches a peak of severity and then begins to become less severe. In the spring growing season, it declined to a low level due to the high temperatures and low humidity typical in the summer (
Figure 1a). In the autumn growing season, SBDM severity decreased due to low temperatures (
Figure 1b). The results presented from the greenhouse experiments refer to SBDM severity at a certain time after planting or to AUDPC over a certain period.
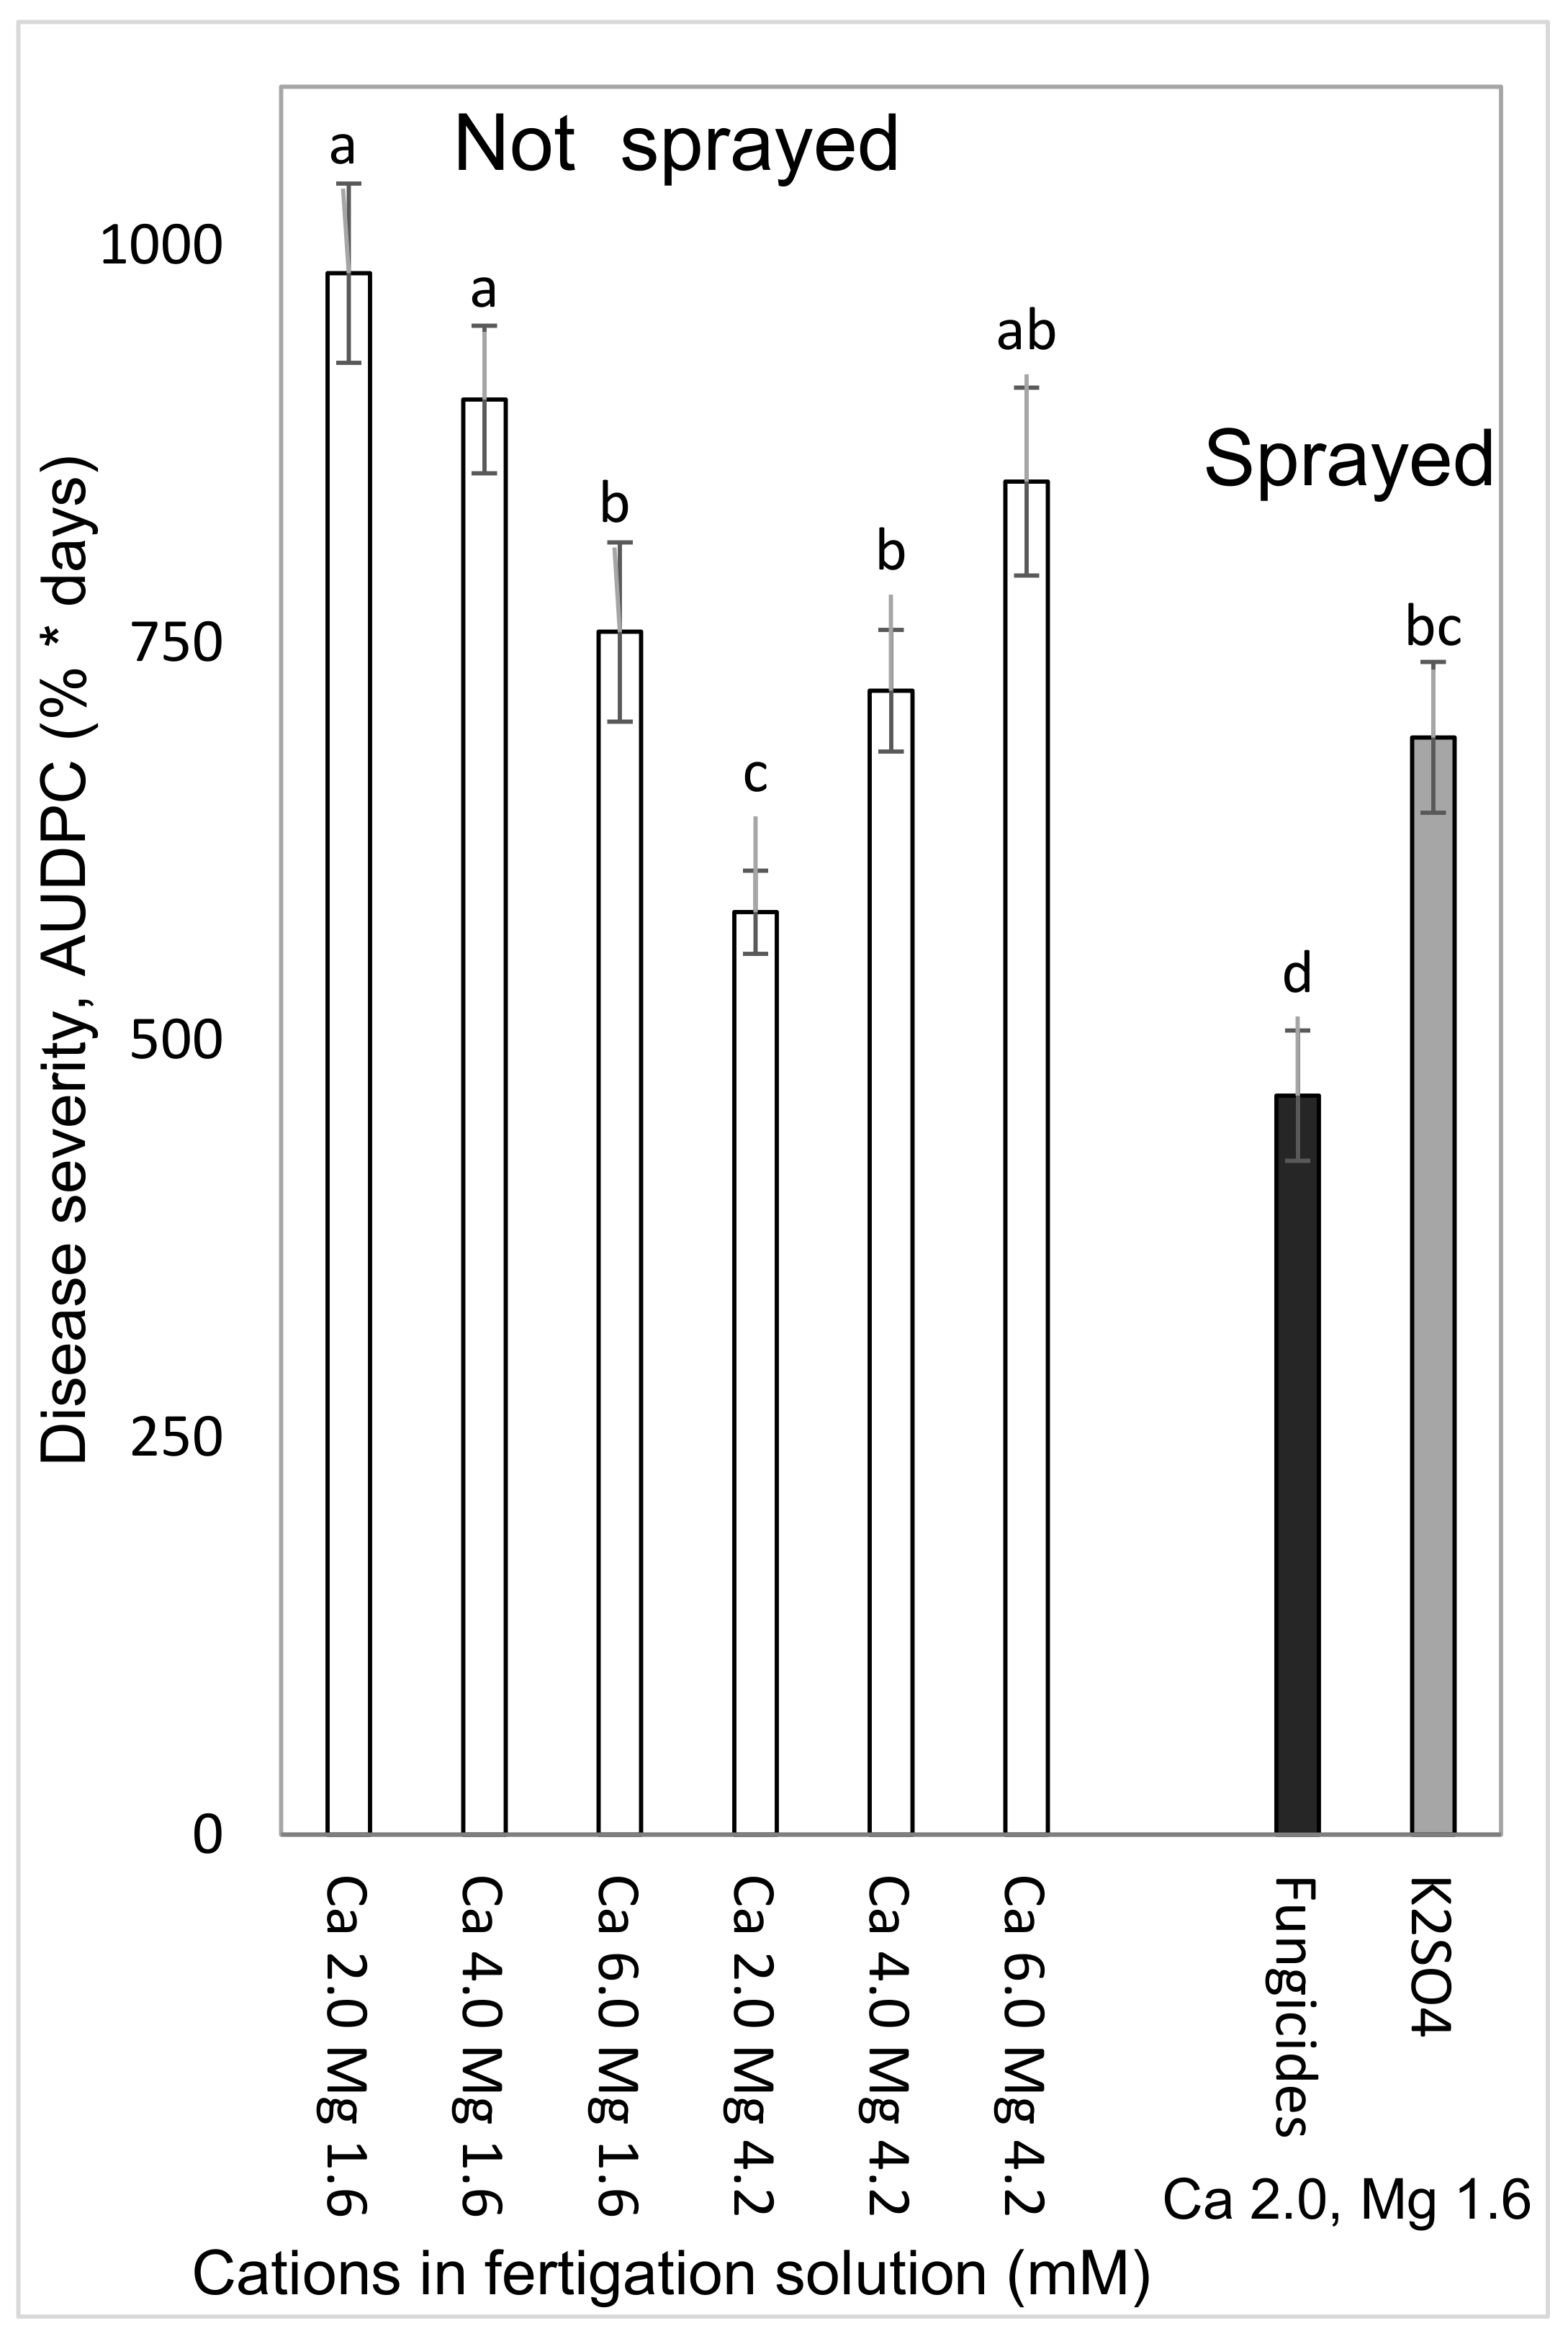
Chemical fungicide treatments included a rotation of two types of treatments. The first type of treatment was administrated soon after harvest and consisted of a spray application of a mixture of two fungicides: Canon (potassium phosphite, 780 g/L, Luxembourg Industries (Pamol) Ltd., Tel Aviv, Israel applied at 0.3%) + Cabrio Duo (dimethomorph 72 g/L + pyraclostrobin 40 g/L, BASF, Ludwigshafen, Germany applied at 0.05%) (or alternatively, Infinito (flupicolide 62.5 g/L + propamocarb-HCL 625 g/L), Bayer AG, Germany, applied at 0.1%). The second type of treatment was one spray application of Canon at one week before harvest.
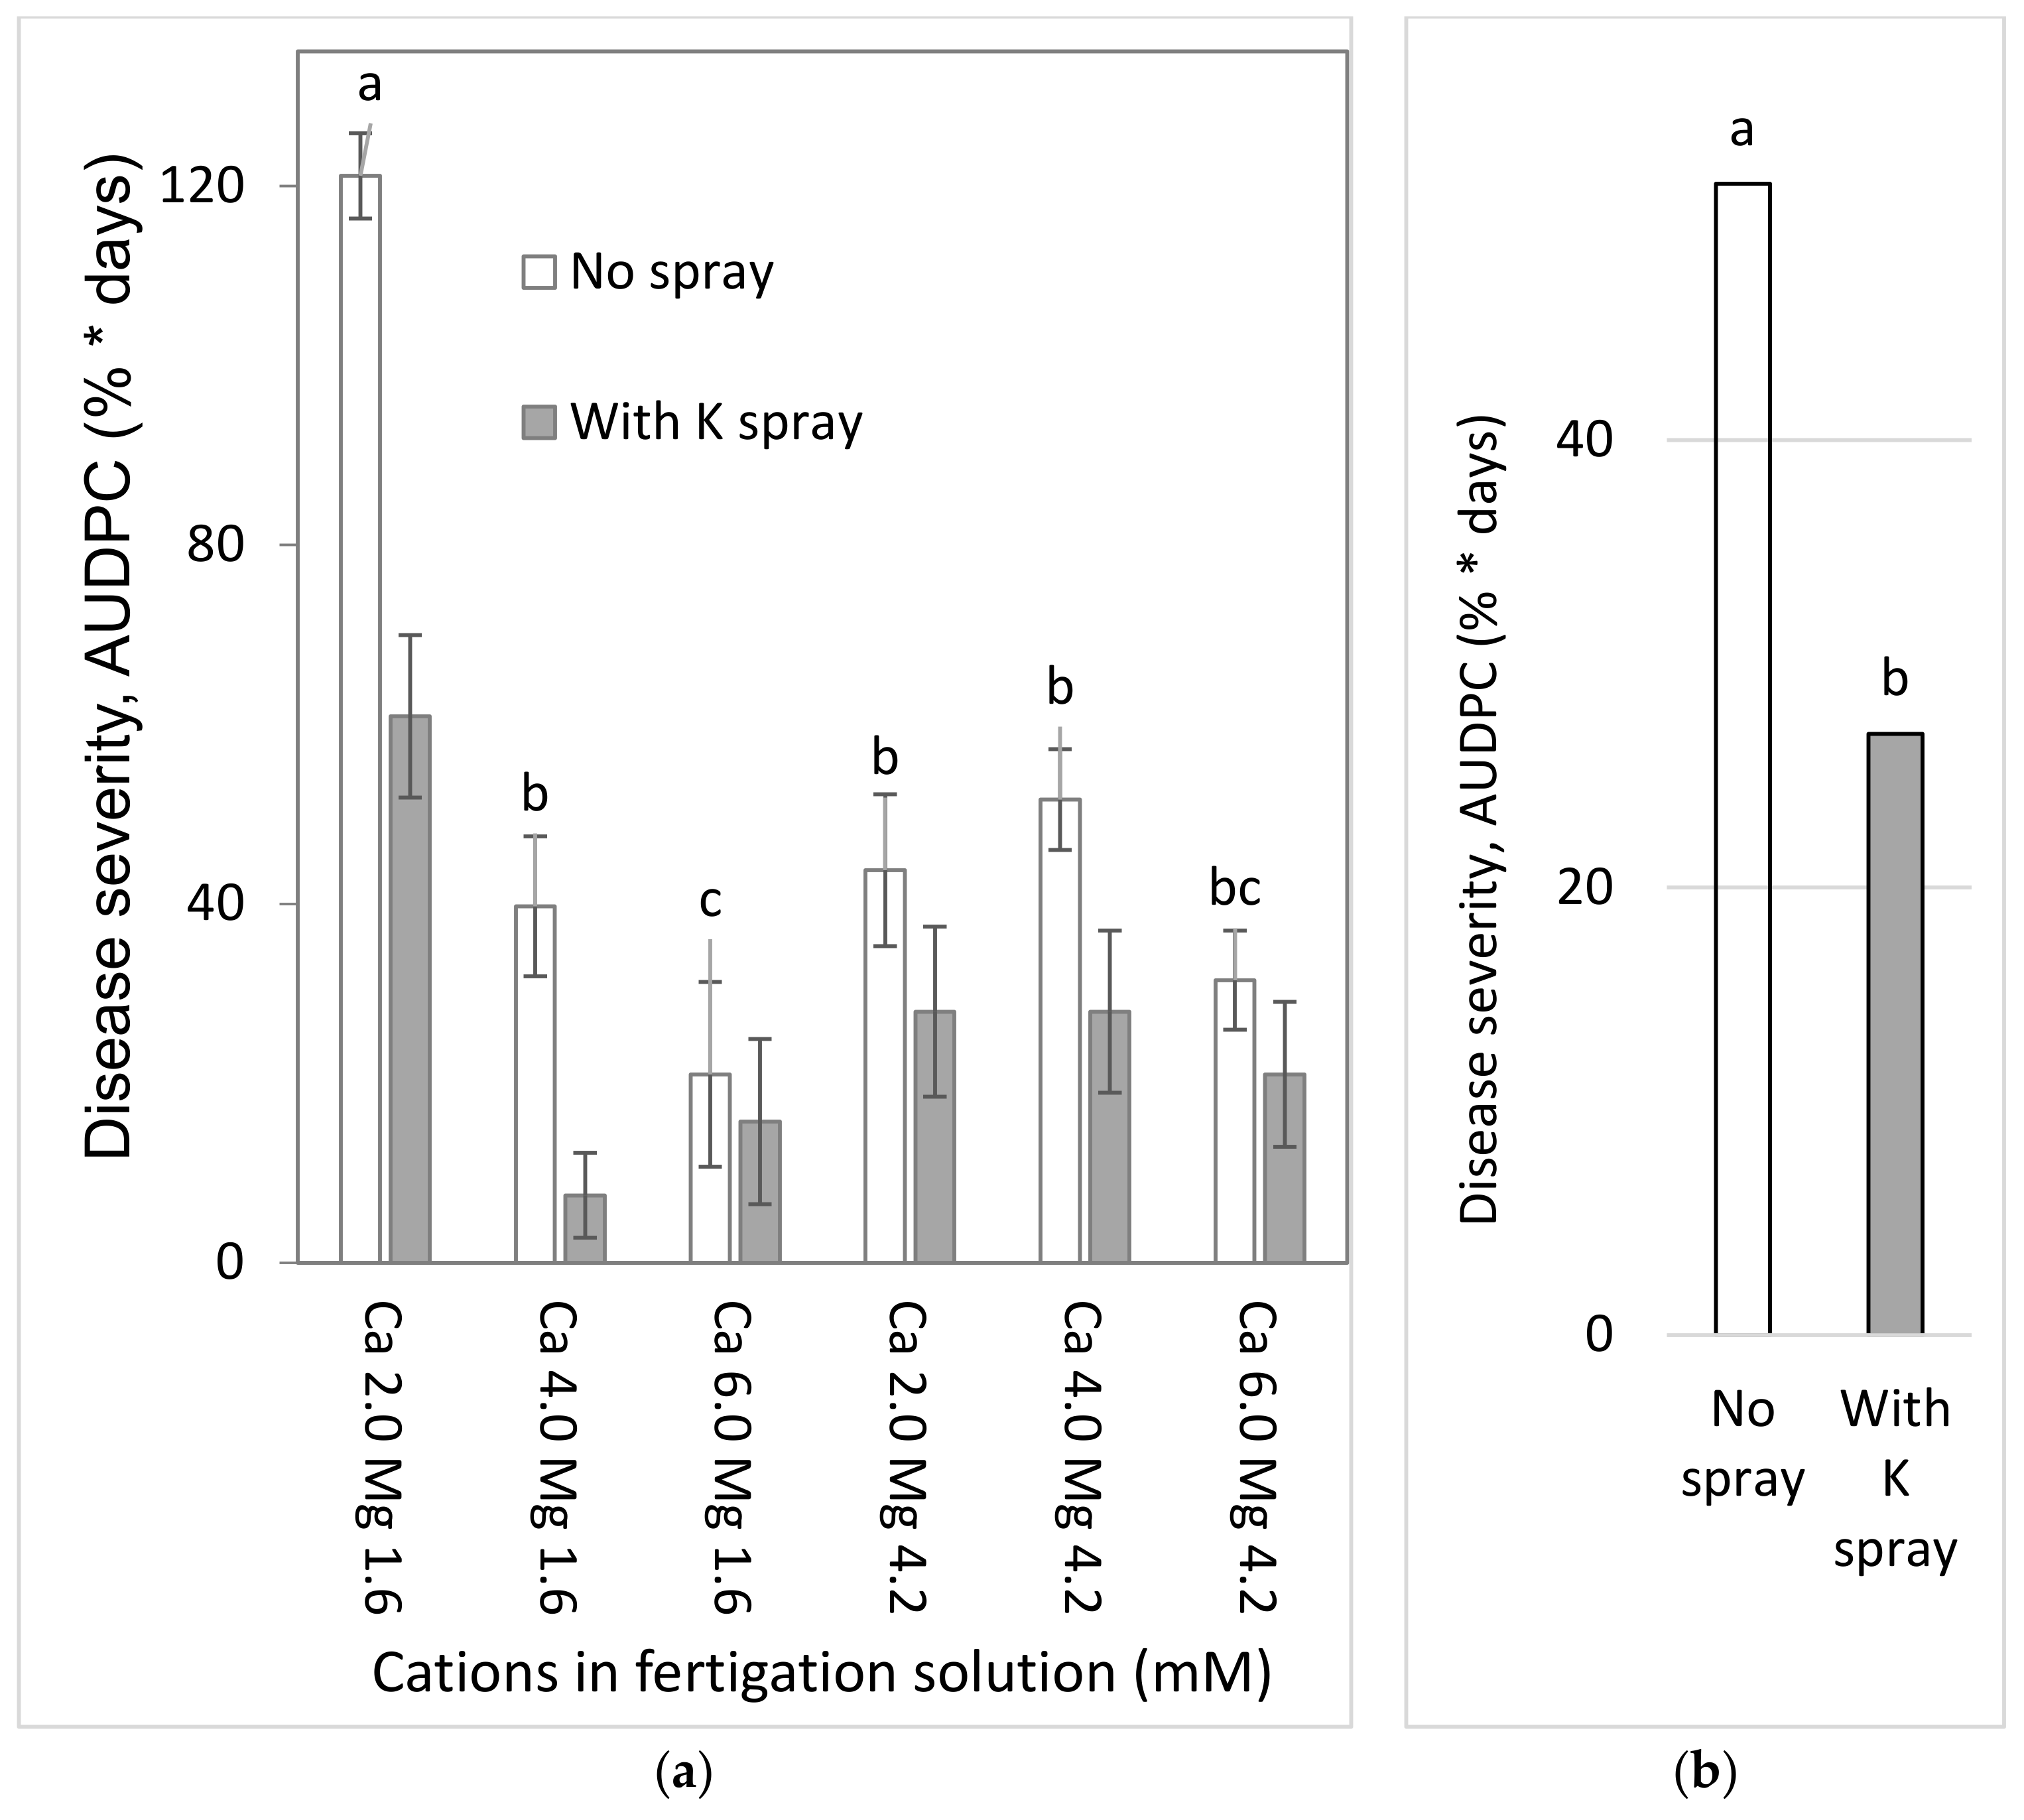
2.4.1. Effects of a Combination of Ca and Mg in the Fertigation Solution and Foliar-Applied K (Experiment C1a, Spring 2015)
To test the effects of Ca and Mg on SBDM during the spring season, sweet basil was planted on 5 March 2015. Fertigation treatments were started on 29 March 2015. The basic fertilizer described above was the same in all treatments. Irrigation water contained 2.0 mM Ca and 1.6 mM Mg. Addition of Cl salts of Ca and Mg was used for treatments with higher concentrations of these ions in the irrigation water. There were six fertigation treatments to asses all possible combinations of three levels of Ca (2.0, 4.0 and 6.0 mM) and two levels of Mg (1.6 and 4.2 mM). Those treatments were applied with and without a 1% K2SO4 spray treatment (114 mM K); the plots that received the +/− K-spray treatments were located adjacent to each other. The EC of the fertigation solutions for the six treatments were between 1.81 and 2.70 dS/m, and their pH ranged between 6.85 and 7.06. In 2015, sweet basil shoots were harvested on 31 March, 7 April, 15 April, 22 April, 4 May, 19 May, 2 June, 18 June and 2 July.
2.4.2. Combined Mg, Ca and K Treatments under Commercial Greenhouse Conditions (Experiment C1b, Autumn 2015–2016)
To examine the effects of Ca and Mg on SBDM during the autumn–winter season, sweet basil was planted on 1 September 2015. Fertigation treatments were started on 24 September 2015. The basic fertilizer mentioned above was the same in all treatments. There were six fertigation treatments, to account for all possible combinations of two concentrations of Mg (1.6 and 4.2 mM) and three concentrations of Ca (2.0, 4.0, and 6.0 mM). Those treatments were applied with and without a 1% K2SO4 spray treatment (114 mM K); the plots receiving the +/− K spray treatments were located adjacent to each other. The EC of the fertigation solutions in the six treatments ranged from 1.91 to 2.45 dS/m, and their pH values ranged from 6.95 to 6.96. Shoots were harvested on 14 October 2015, 1 November 2015 and 7 January 2016.
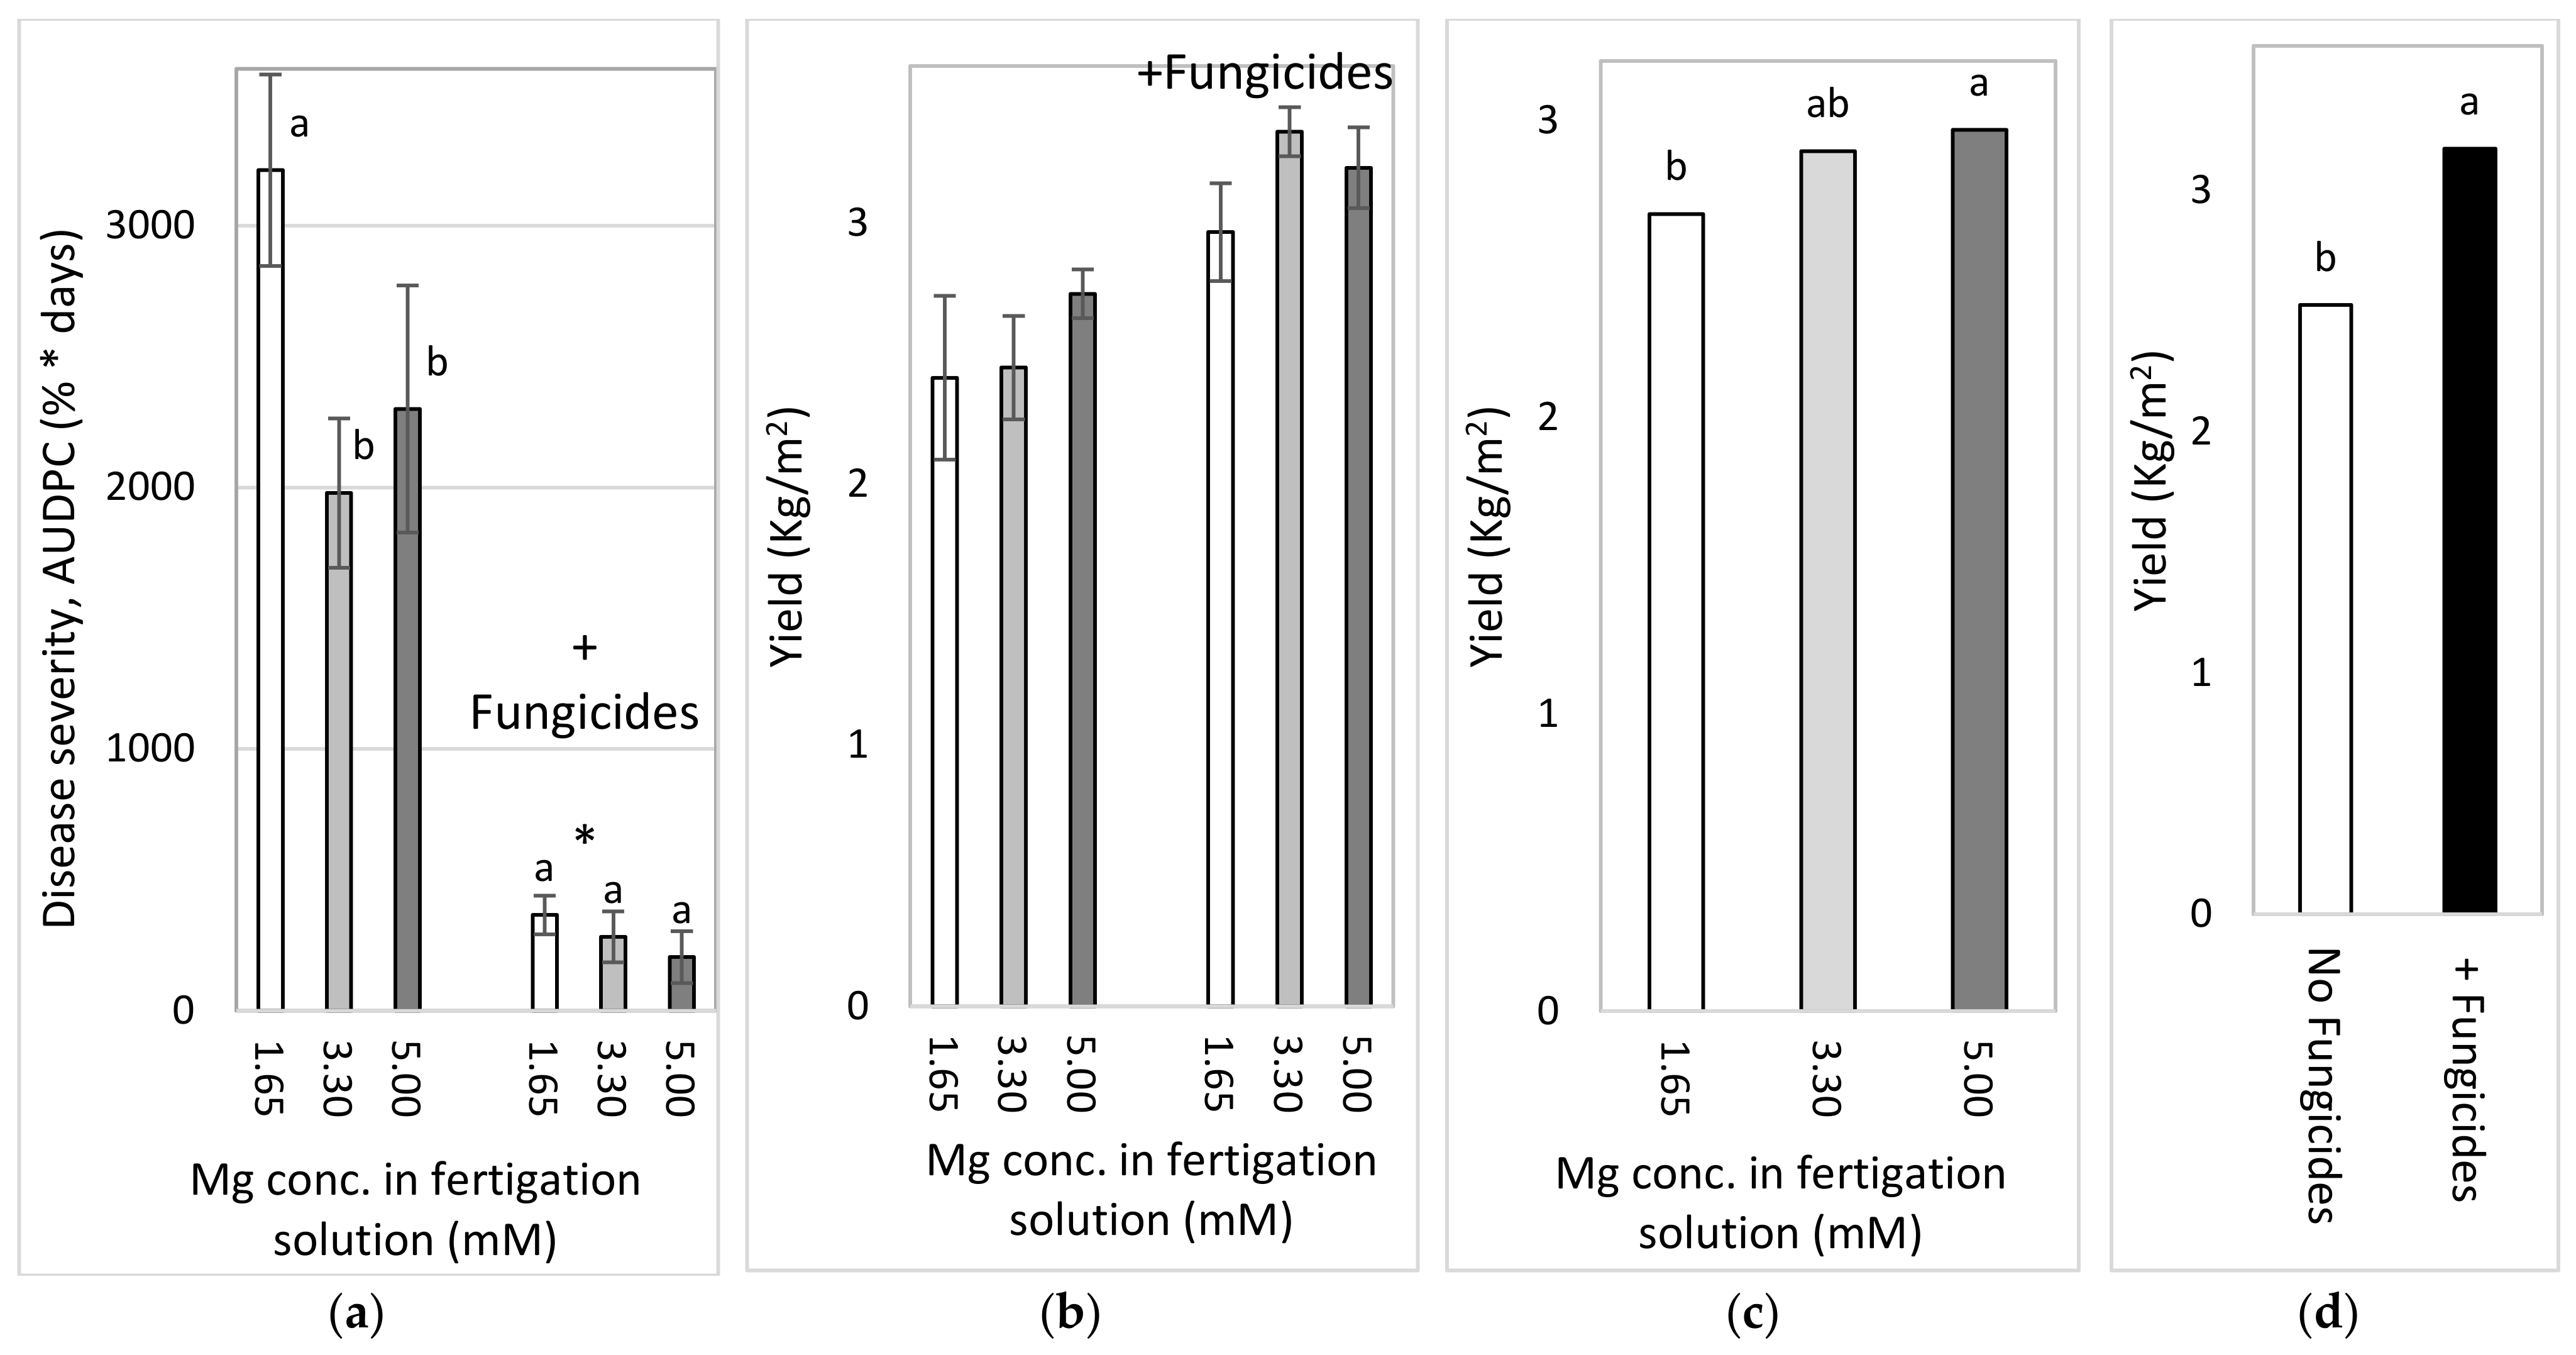
2.4.3. Effects of Different Concentrations of Mg in the Fertigation Solution under Greenhouse Conditions (Experiment C2a, Autumn 2016)
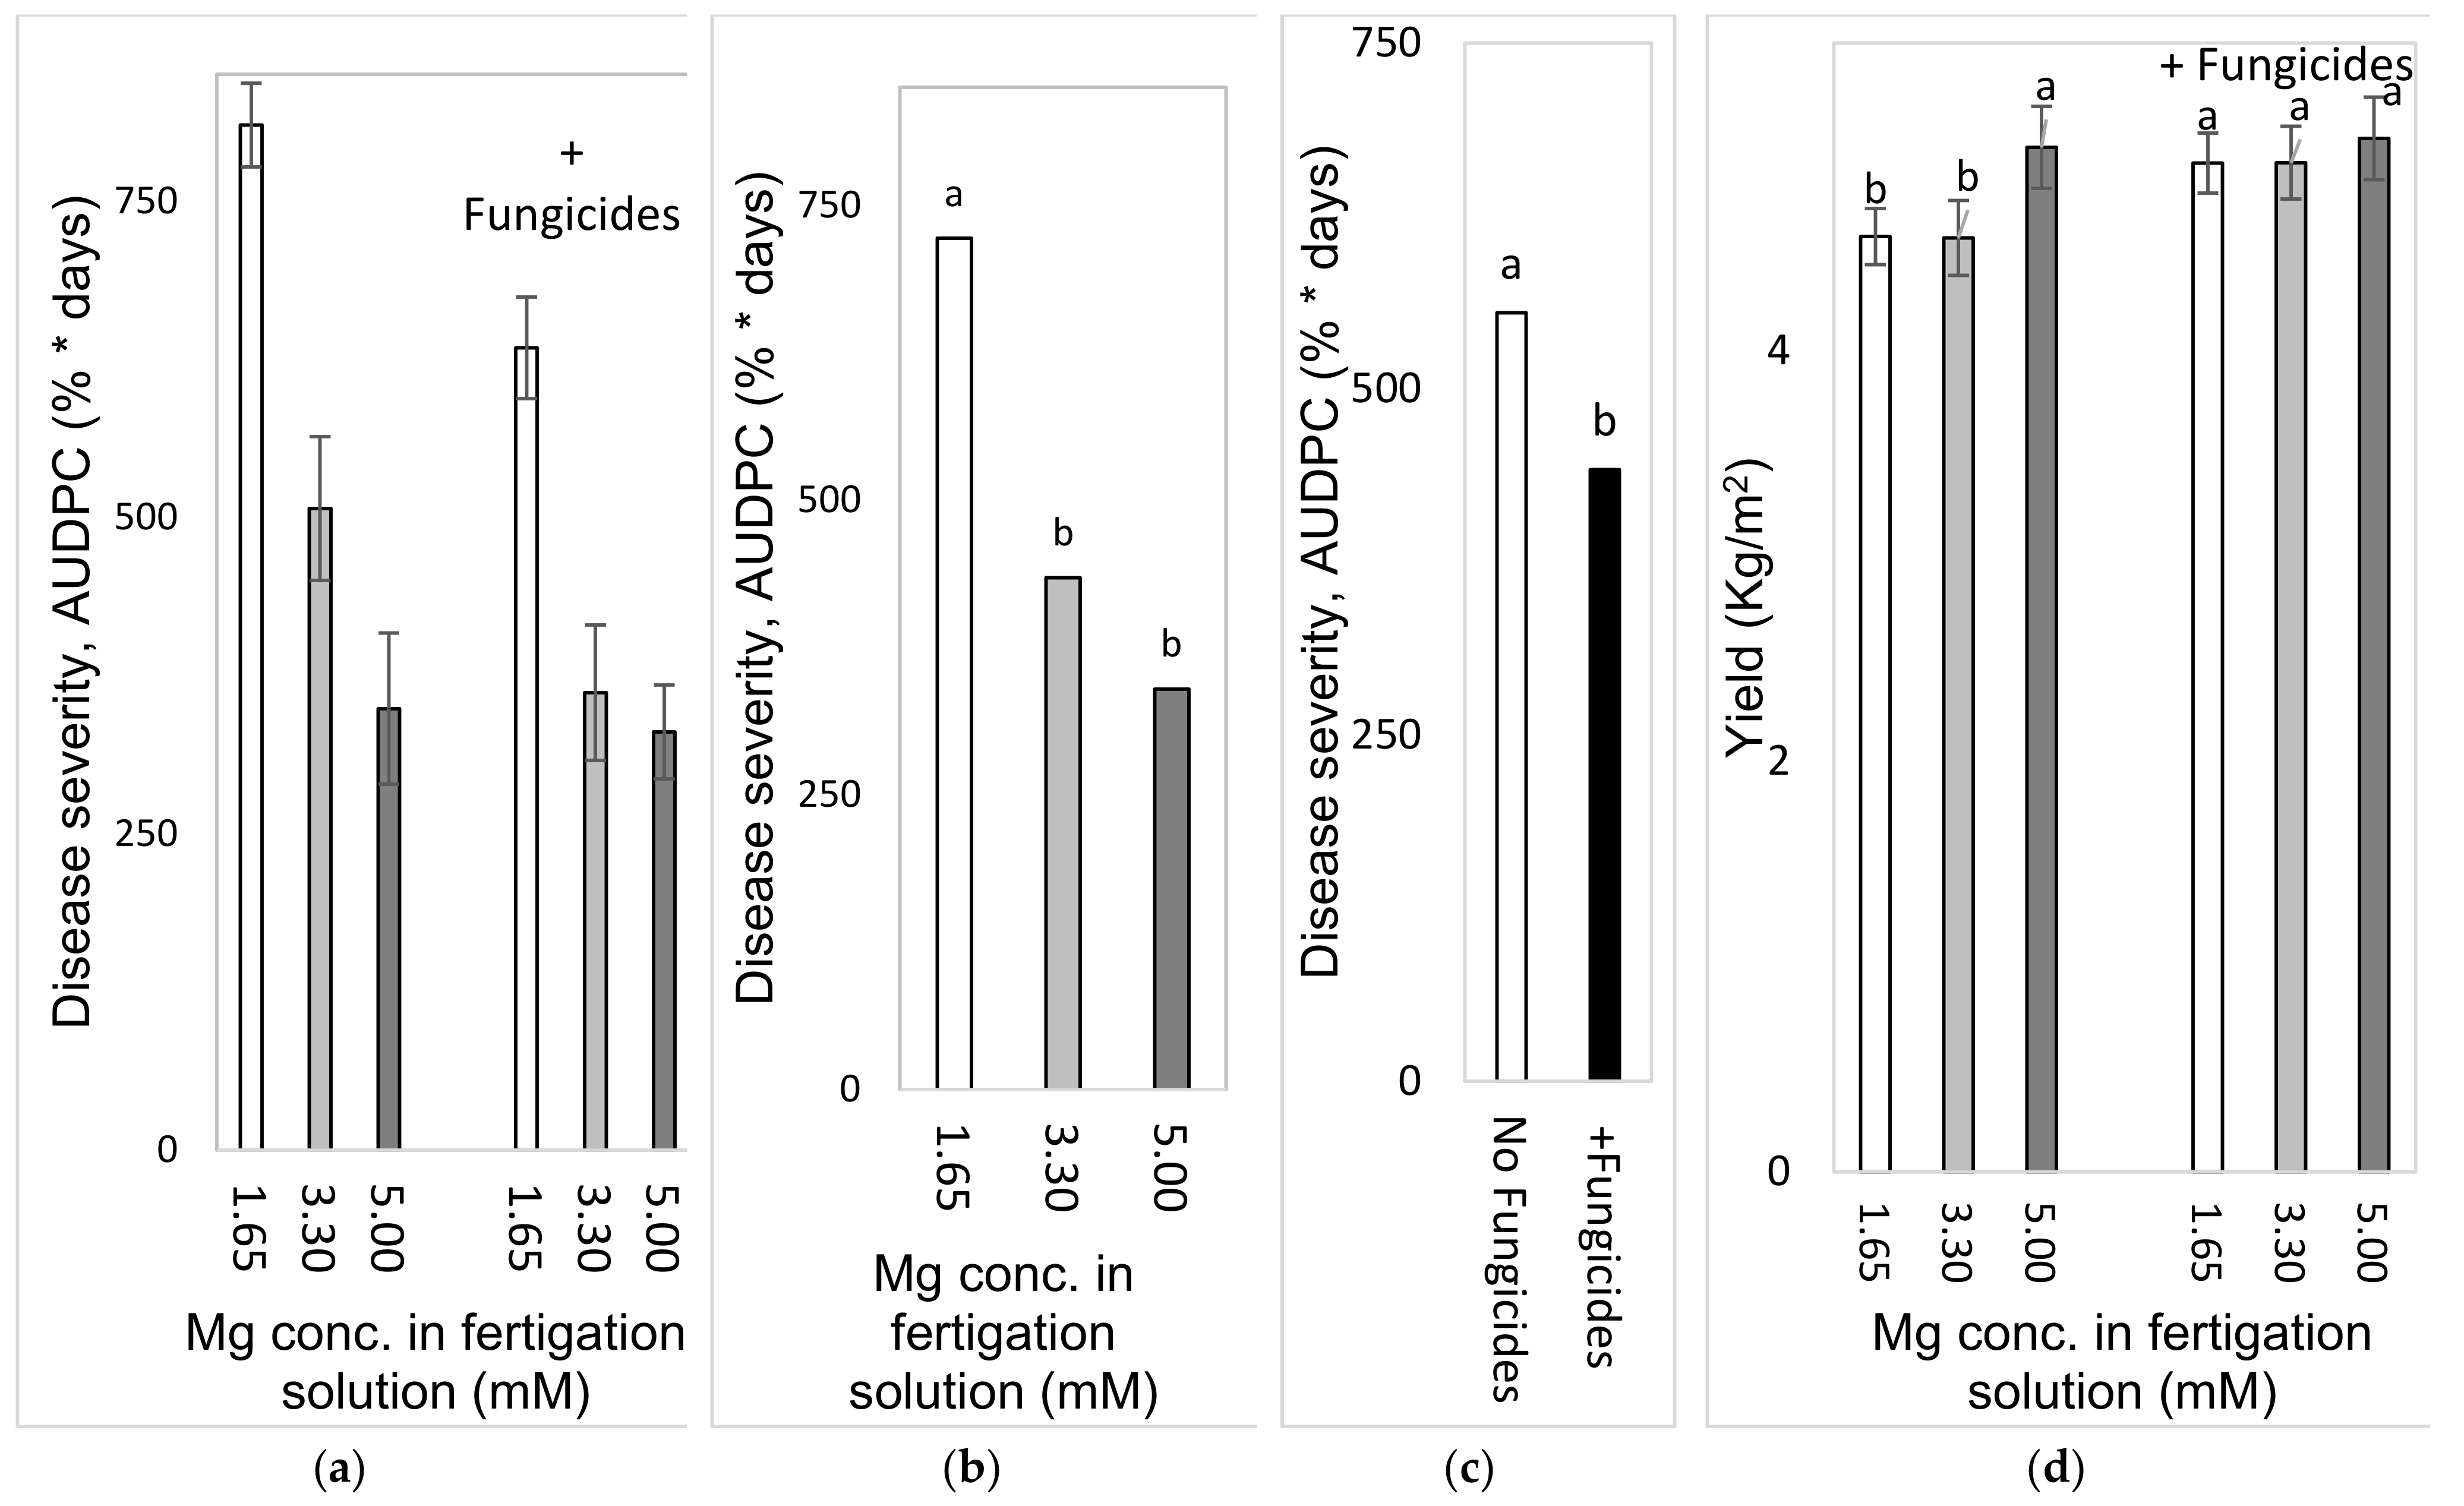
To test the effect of Mg concentration on SBDM in an autumn crop, sweet basil was planted on 21 September 2016. Fertigation treatments started on 28 September 2016. The basic fertilizer mentioned above was the same in all treatments (Experiment C). The basic Mg concentration was 1.6 mM, and additional treatments of 3.30 and 4.95 mM were made by adding MgCl2 to the irrigation water. Those treatments were applied with and without foliar fungicides, as described above; the plots that received the +/− fungicide treatments were located adjacent to each other. Fungicides were spray-applied in the experimental plots starting from 16 November 2016. The EC of the fertigation solutions for the three Mg treatments ranged from 1.91 to 2.74 dS/m, and their pH values ranged between 6.70 and 7.03. In 2016, shoots were harvested on 26 October, 15 November and 19 December.
2.4.4. Effects of Mg Fertigation Treatments under Greenhouse Conditions (Experiment C2b, Spring 2017)
To examine the effects of different Mg concentrations on SBDM in the spring season, sweet basil was planted on 28 February 2017. Fertigation treatments were started on 25 April 2017. The basic fertilizer mentioned above was the same in all treatments (Site C). The basic Mg concentration was 1.6 mM, and additional treatments of 3.3 and 5.0 mM were made by adding MgCl2 to the fertigation solution. Treatments were applied with and without foliar fungicides, as described above; the plots that received the +/− fungicide treatments were located adjacent to each other. Fungicides were sprayed in the experimental plots starting from 30 May 2017. The EC of the fertigation solutions for the three Mg treatments ranged between 1.85 and 2.87 dS/m, and their pH values ranged from 6.95 to 7.12. In 2017, shoots were harvested on 8 May, 29 May and 18 June.
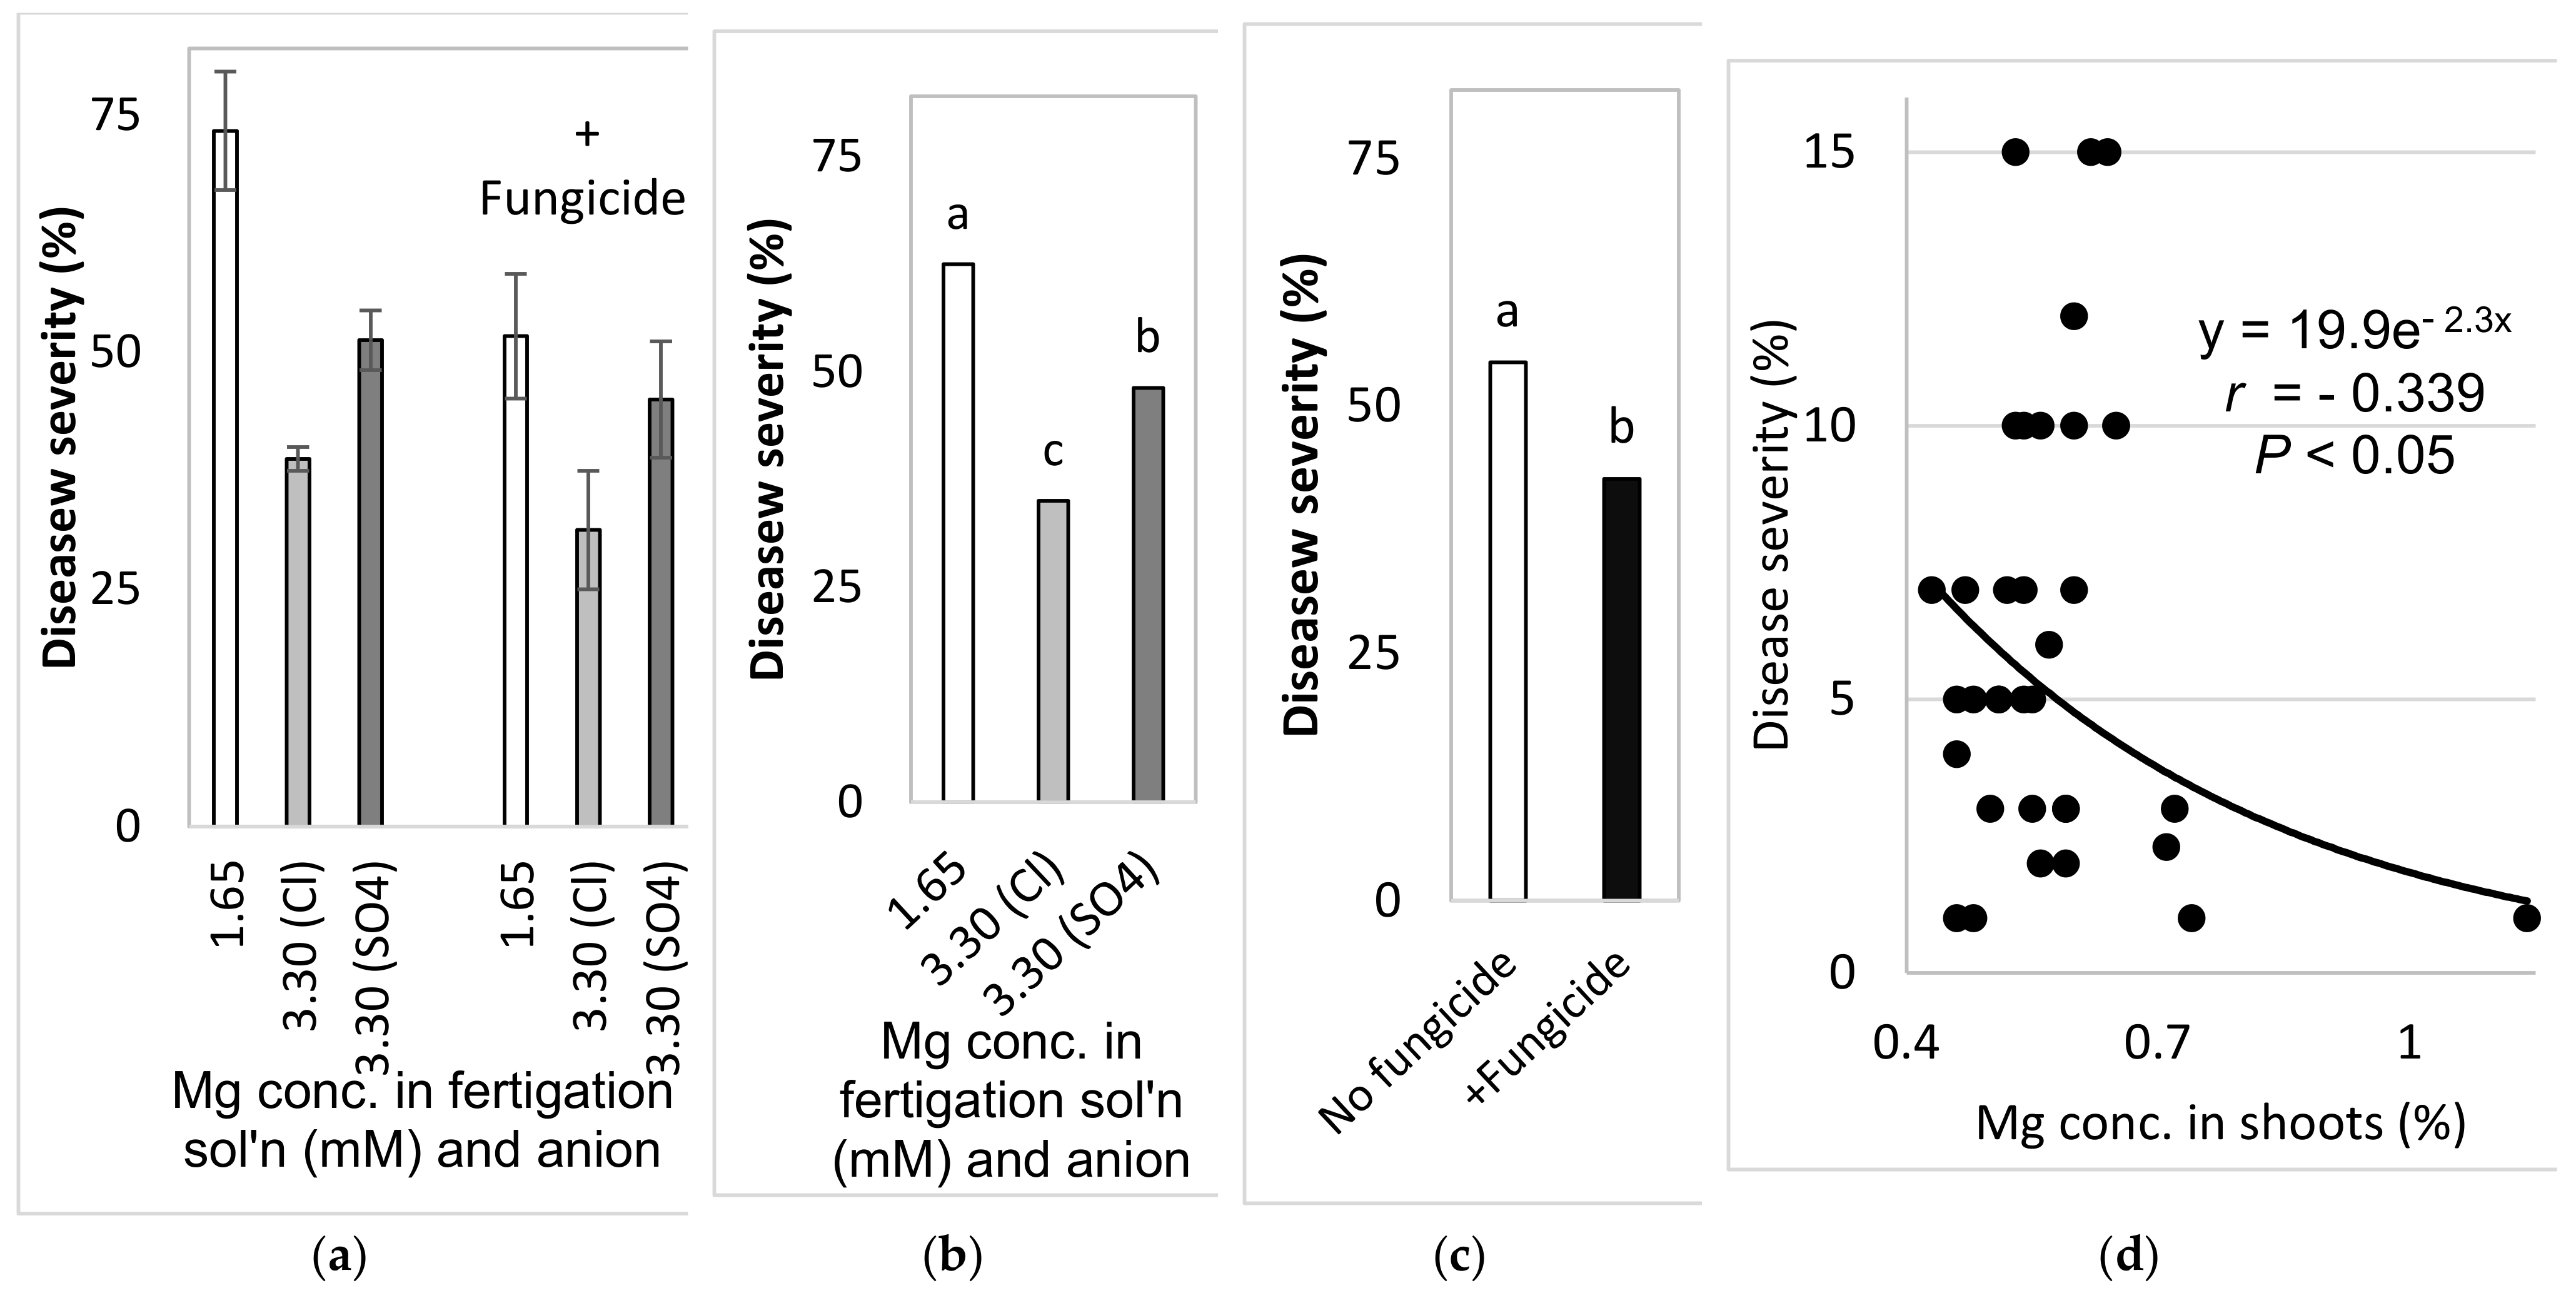
2.4.5. Comparison of the Effects of the Different Anions (Cl− vs. SO42−) in the Fertigation-Applied Mg Salt (Experiment C3, Autumn 2017–2018)
To examine the effect of the type of anion that is part of the added Mg salt on SBDM, sweet basil was planted on 26 September 2017. The basic fertilizer mentioned above was the same in all treatments (Site C). Starting on 25 October 2017, 1.65 mM MgCl2 and MgSO4 were added to the water, so that the final Mg concentration was 3.3 mM. Treatments were also applied with and without fungicides, as described above; the plots that received +/− fungicide treatments were located adjacent to each other. Fungicides were sprayed in the experimental plots starting from 9 October 2017. The EC of the fertigation solutions for the Mg treatments were between 1.91 and 2.32 dS/m, and their pH values ranged from 6.75 to 6.98. The shoots were harvested on 29 October 2017, 27 December 2017 and 24 January 2018.
2.5. Mineral Analysis
In all experiments, shoots were sampled randomly at harvest time from potted plants (Site A) and the commercial-container experiments (Site C) for determination of mineral concentrations. The shoots were rinsed with distilled water and dried in an oven at 70 °C for 48 h. The dried plant material was ground and subjected to chemical analysis. The total K, Mg and Ca concentrations of the shoots were determined after digestion with sulfuric acid and peroxide [
30]. K, Na and Mg were analyzed with an atomic absorption spectrophotometer (Perkin-Elmer 460, Norwalk, CT, USA). Ca was analyzed by digestion with nitric acid and perchlorate, followed by atomic absorption spectrophotometry Perkin-Elmer 460, Norwalk, CT, USA), following [
31]. Chloride was extracted from the shoots in water (100:1 water:dry matter) and quantified using a chloride analyzer (model 926, Sherwood).
2.6. Infection with P. belbahrii and Evaluation of SBDM Severity
Conidia of
P. belbahrii were collected in water by washing conidiating leaves of sweet basil plants that were kept in an experimental greenhouse at the Volcani Center. The canopy of potted sweet basil plants was inoculated with a conidial suspension that contained 10
3 cells mL
−1 on the afternoon of the inoculation date. The plants were incubated at high RH (>95%) in the dark in a growth chamber at 22 ± 1 °C for 12 h, and then incubated in a greenhouse chamber at 22 ± 2 °C for 1 week, incubated at high RH (>95%) in the dark in a growth chamber at 22 ± 1 °C for 12 h, and then incubated in a greenhouse chamber at 22 ± 2 °C for symptom development. Potted sweet basil plants subjected to this artificial inoculation served as inoculum sources to ensure even inoculum loads across the greenhouse in the pot (Experiment A). SBDM severity was evaluated on the sweet basil canopy using a scale of 0–100. Symptoms/signs included chlorosis, dry necrotic lesions and sporulation on the lower leaf side. In this scale, 0 = no signs or symptoms, and 100 = entire surface displays signs and/or symptoms [
27].
In the commercial greenhouse experiments (Site C), SBDM epidemics developed naturally during each experimental period. The evaluation of SBDM severity in the greenhouse plots included all plants, except for those along the edges of each plot. SBDM severity was determined every 2 to 3 weeks in each plot of each experiment, on a scale of 0 to 100, in which 0 = all plants visually healthy and 100 = all leaves on all plants in the plot show typical SBDM symptoms of chlorosis or dry necrotic lesions, or signs of sporulation of
P.
belbahrii on their lower side [
27].
The germination of P. belbahrii conidia was examined on leaves sampled from plants that had been sprayed with 1% KCl, K2SO4, NaCl (134, 114, and 171 mM, respectively) or water with no added salt. Four leaves from each of five plants per treatment were detached, placed on wet paper towel in a Petri dish and inoculated with 20 µL drops containing 105/mL conidia. The inoculated leaves were incubated for 5 h in the dark at 21 °C. Following staining with aniline blue (a mixture of methyl blue and water blue), 50 conidia in each drop were evaluated. The percent germination of the conidia and germ-tube length was evaluated.
2.7. Shoot Weight
Batches of shoots that were >15 cm long were harvested and weighed. At Site A, yield was measured for each planted pot. In the commercial greenhouse experiments, yield data was collected separately for each plot and sorted by quality grade. Results are presented in terms of grade A produce per m2.
2.8. Data Analysis
The correlations between the concentration of a nutritional element and SBDM severity or between shoot concentrations of two selected nutritional elements were calculated using all individual pairs of data. Linear, exponential, logarithmic and polynomial correlations were examined. The results present the formulas describing these types of correlations, correlation coefficient (r) values and α significance levels.
A and B experiments were performed 3 times. Data was combined from replicate experiments since no interactions between trial repetitions were observed. Data in percentages were arcsine-transformed before further analysis. Area under the disease progress curve (AUDPC) values were calculated. Standard errors of the mean (SEs) were calculated and presented alongside the degrees of freedom (df = n − 1 for controlled-conditions experiments and df = n − 2 for correlations calculated for greenhouse-conditions data). SBDM severity and AUDPC data were analyzed using ANOVA and Tukey–Kramer’s HSD test. The statistical analysis was performed using JMP 10.0 software (SAS Institute, Cary, NC).
Disease reduction was calculated as follows:
where T = severity in the treatment and control = severity in the untreated control.
The combined effect of the control measures used was estimated using the Abbott formula [
32,
33]. The expected reduction in SBDM severity (control efficacy) and the combined suppressive activity were calculated according to the following formula:
where a = severity reduction induced by one measure when applied alone; b = disease reduction induced by the other measure when applied alone; CE
exp = expected control efficacy of the combined treatment, if the two measures act additively; CE
obs = observed disease reduction for the combined treatment; and SF = the synergy factor achieved by the combined treatment. When SF = 1, the interaction between the control measures is additive; when SF < 1, the interaction is antagonistic and when SF > 1, the interaction is synergistic [
32,
33,
34]. This same formula was used to calculate SF in the context of yield.
4. Discussion
These experiments revealed that Ca and Mg applied in the fertigation solution decreased SBDM severity in sweet basil leaves. In contrast, the addition of K to the fertigation solution increased SBDM severity. The foliar application of Ca and Mg suppressed the disease and foliar-applied K contributed to disease reduction under commercial conditions.
N can also affect the development of SBDM. In a previous greenhouse study, we found that higher levels of N in the fertigation solution led to more severe SBDM and that the use of a fertigation solution in which NH4+ accounted for less than 10% of the total N was also associated with more severe SBDM (unpublished). To prevent interactions between the effects of the total N and the proportion of N that was NH4+ and the effects of each of the cations examined in this work, in the experiments reported here, we kept the concentration of the supplied N fairly high: 5.7 and 4.3 mM in the pot and greenhouse experiments, respectively.
The effect of K in this pathosystem may differ from its effects in other pathosystems. The addition of K to a low-nitrate fertilizer has been shown to reduce cucumber fruit gray mold (
Botrytis cinerea) and stem infections [
35]. In addition, foliar-applied KNO
3 has been shown to reduce the incidence and severity of Alternaria leaf blight (
Alternaria macrospora and
A. alternata) in cotton, as well as leaf-shedding in that crop [
36]. Similar to the present work, adding Ca to irrigation water has been shown to reduce gray mold on cucumber fruits and stems. Ca also reduces pepper and eggplant gray mold [
35]. In soybean (
Glycine max), K, Ca, Mg, S and Fe all induce resistance to
Fusarium oxysporum infection. That effect was observed with moderate concentrations of K and Ca, but not with high concentrations of those nutrients [
37]. Another study reported that crown and root rot of tomato caused by
F. oxysporum f. sp.
radicis-lycopersici is not affected by MgSO
4 but is reduced by Ca(NO
3)
2; the authors of that work related the latter effect to the level of nitrate [
38].
There have also been previous reports on the effects of nutritional elements on downy mildews. Interestingly, K enrichment has been shown to reduce the natural incidence of downy mildew (
Pseudoperonospora cubensis) [
36]. Seed treatment with 90 mM CaCl
2 was shown to suppress downy mildew (
Sclerospora graminicola) of pearl millet and reduce the pathogen biomass in the treated plants [
21]. The application of KSO
4 has been shown to reduce the incidence of downy mildew (
Plasmopara viticola) incidence on grape (
Vitis vinifera) leaves. Increased K content in grapevine petioles increases the constitutive and post inflectional accumulation of total phenols and phenolic acids such as o-coumaric acid, p-coumaric acid with amplified phenylalanine ammonia-lyase activity in leaves and increased disease resistance [
39].
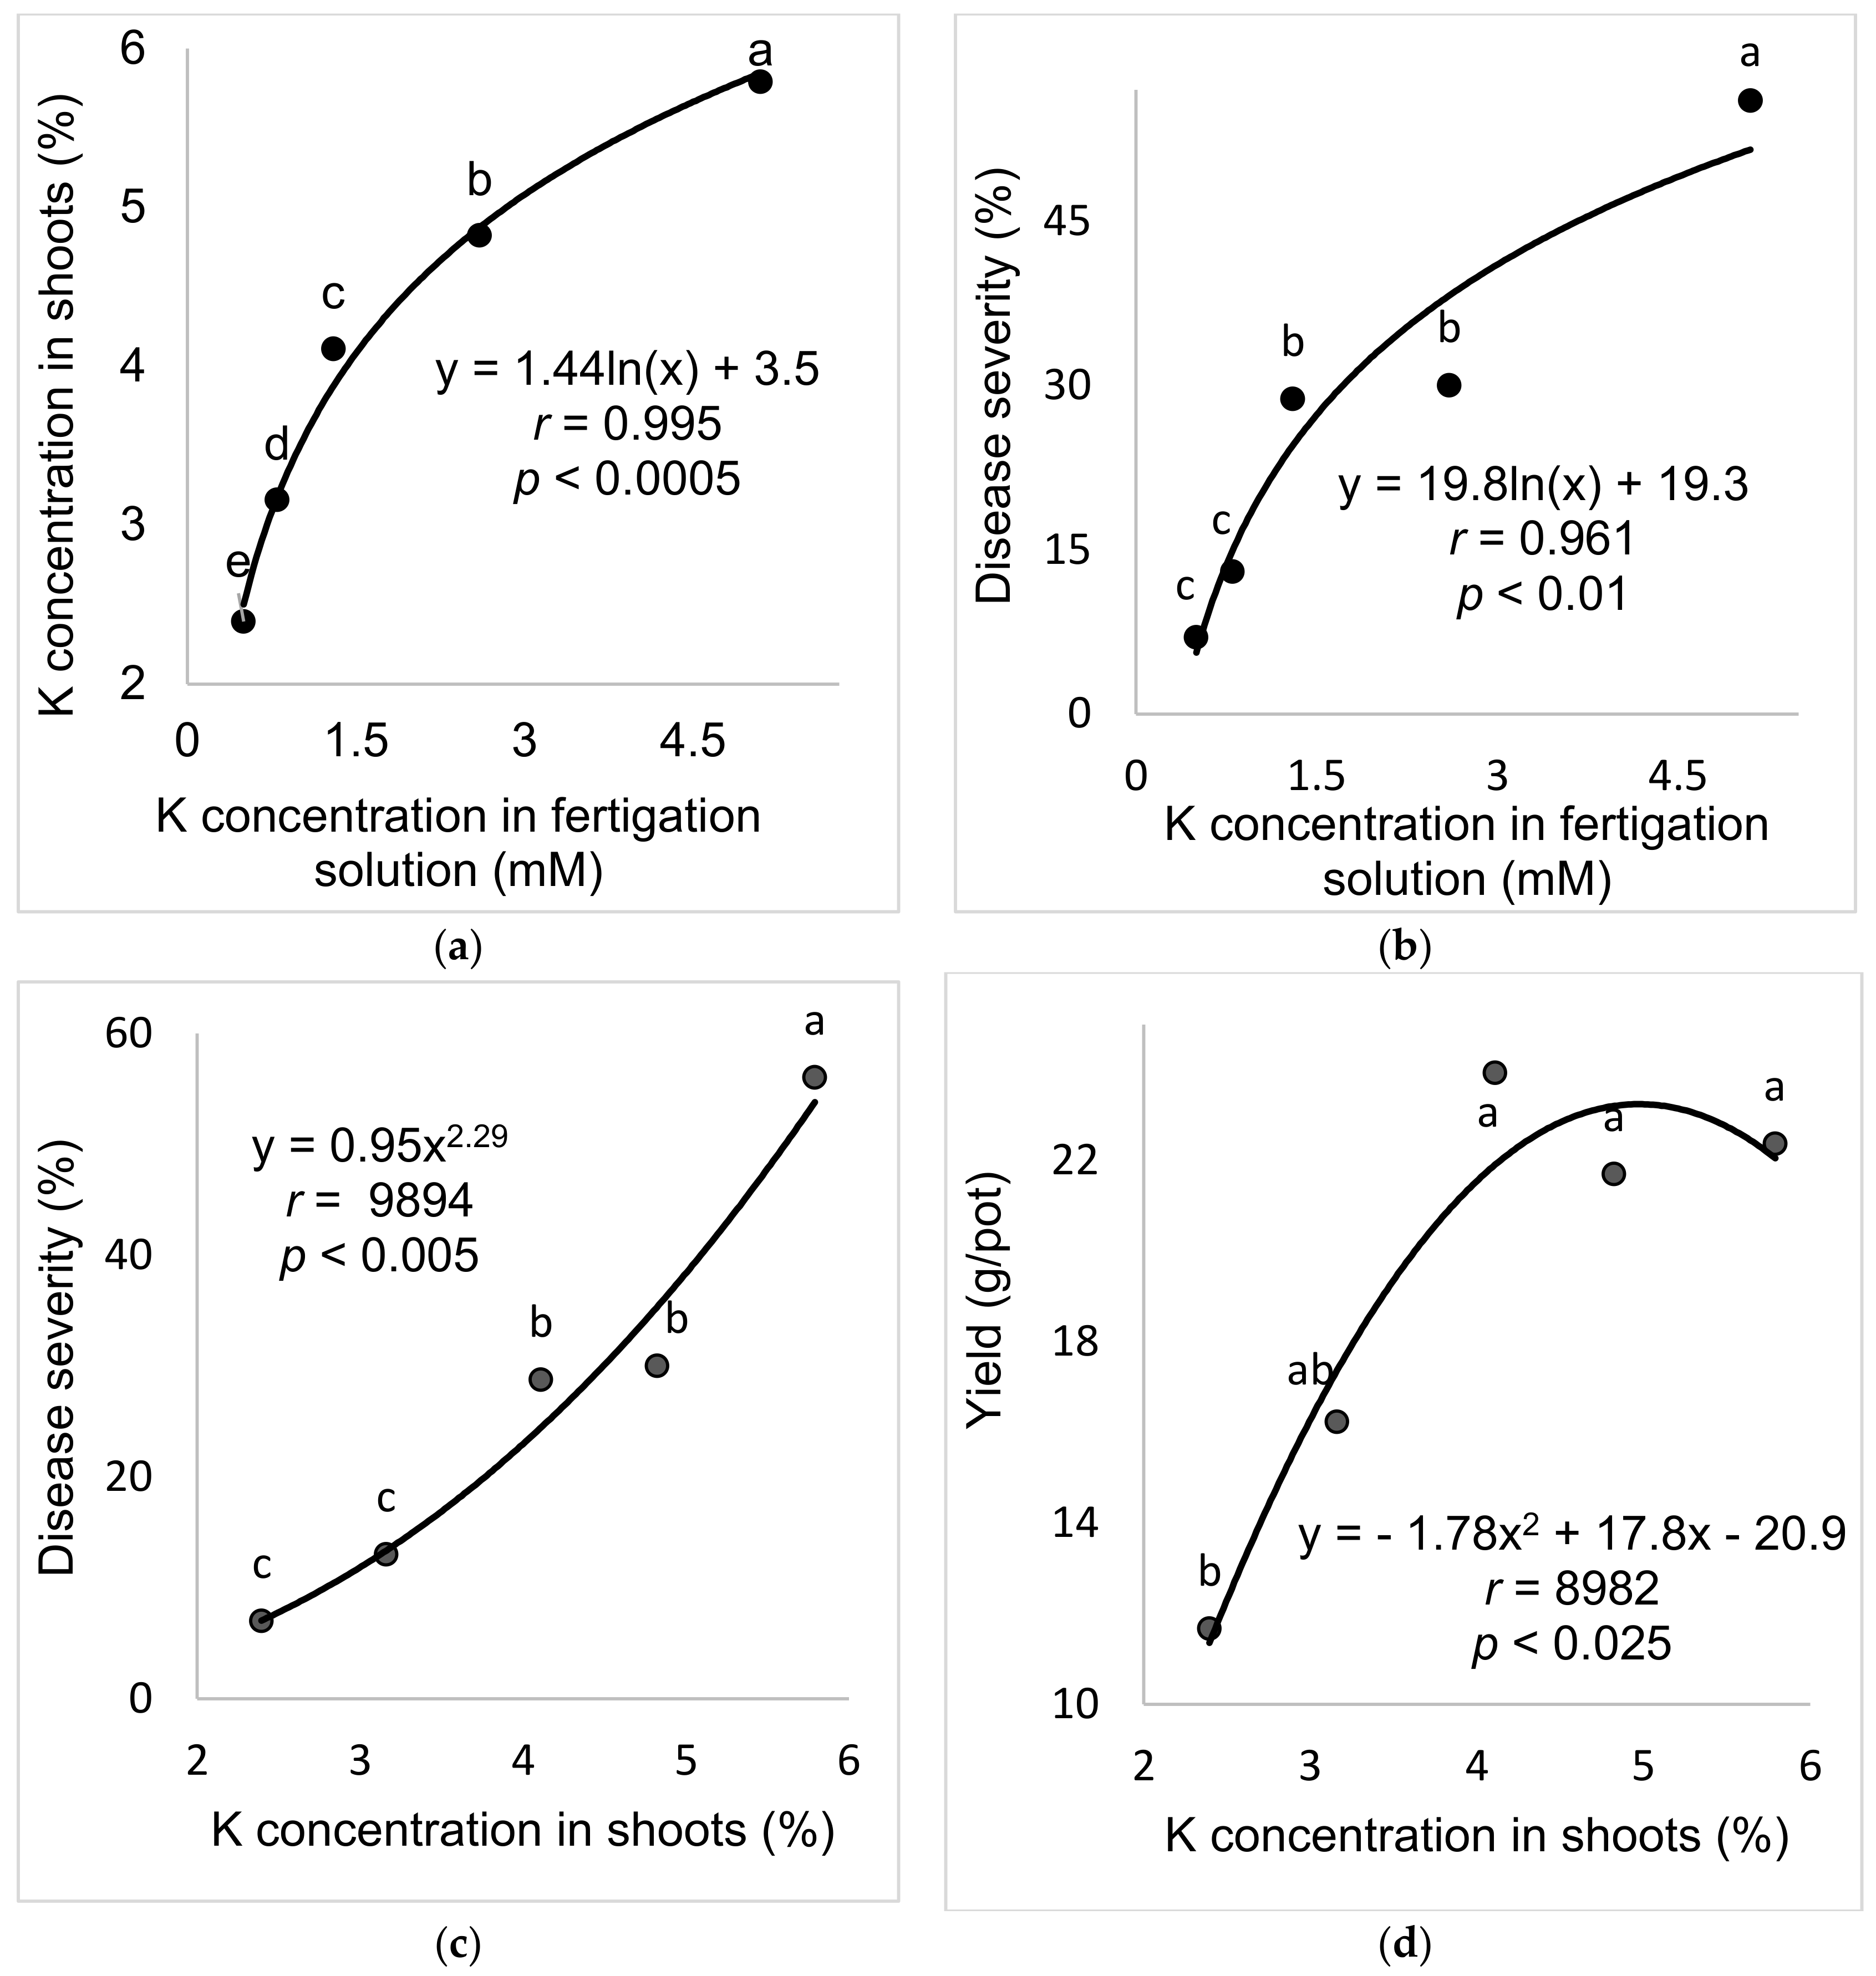
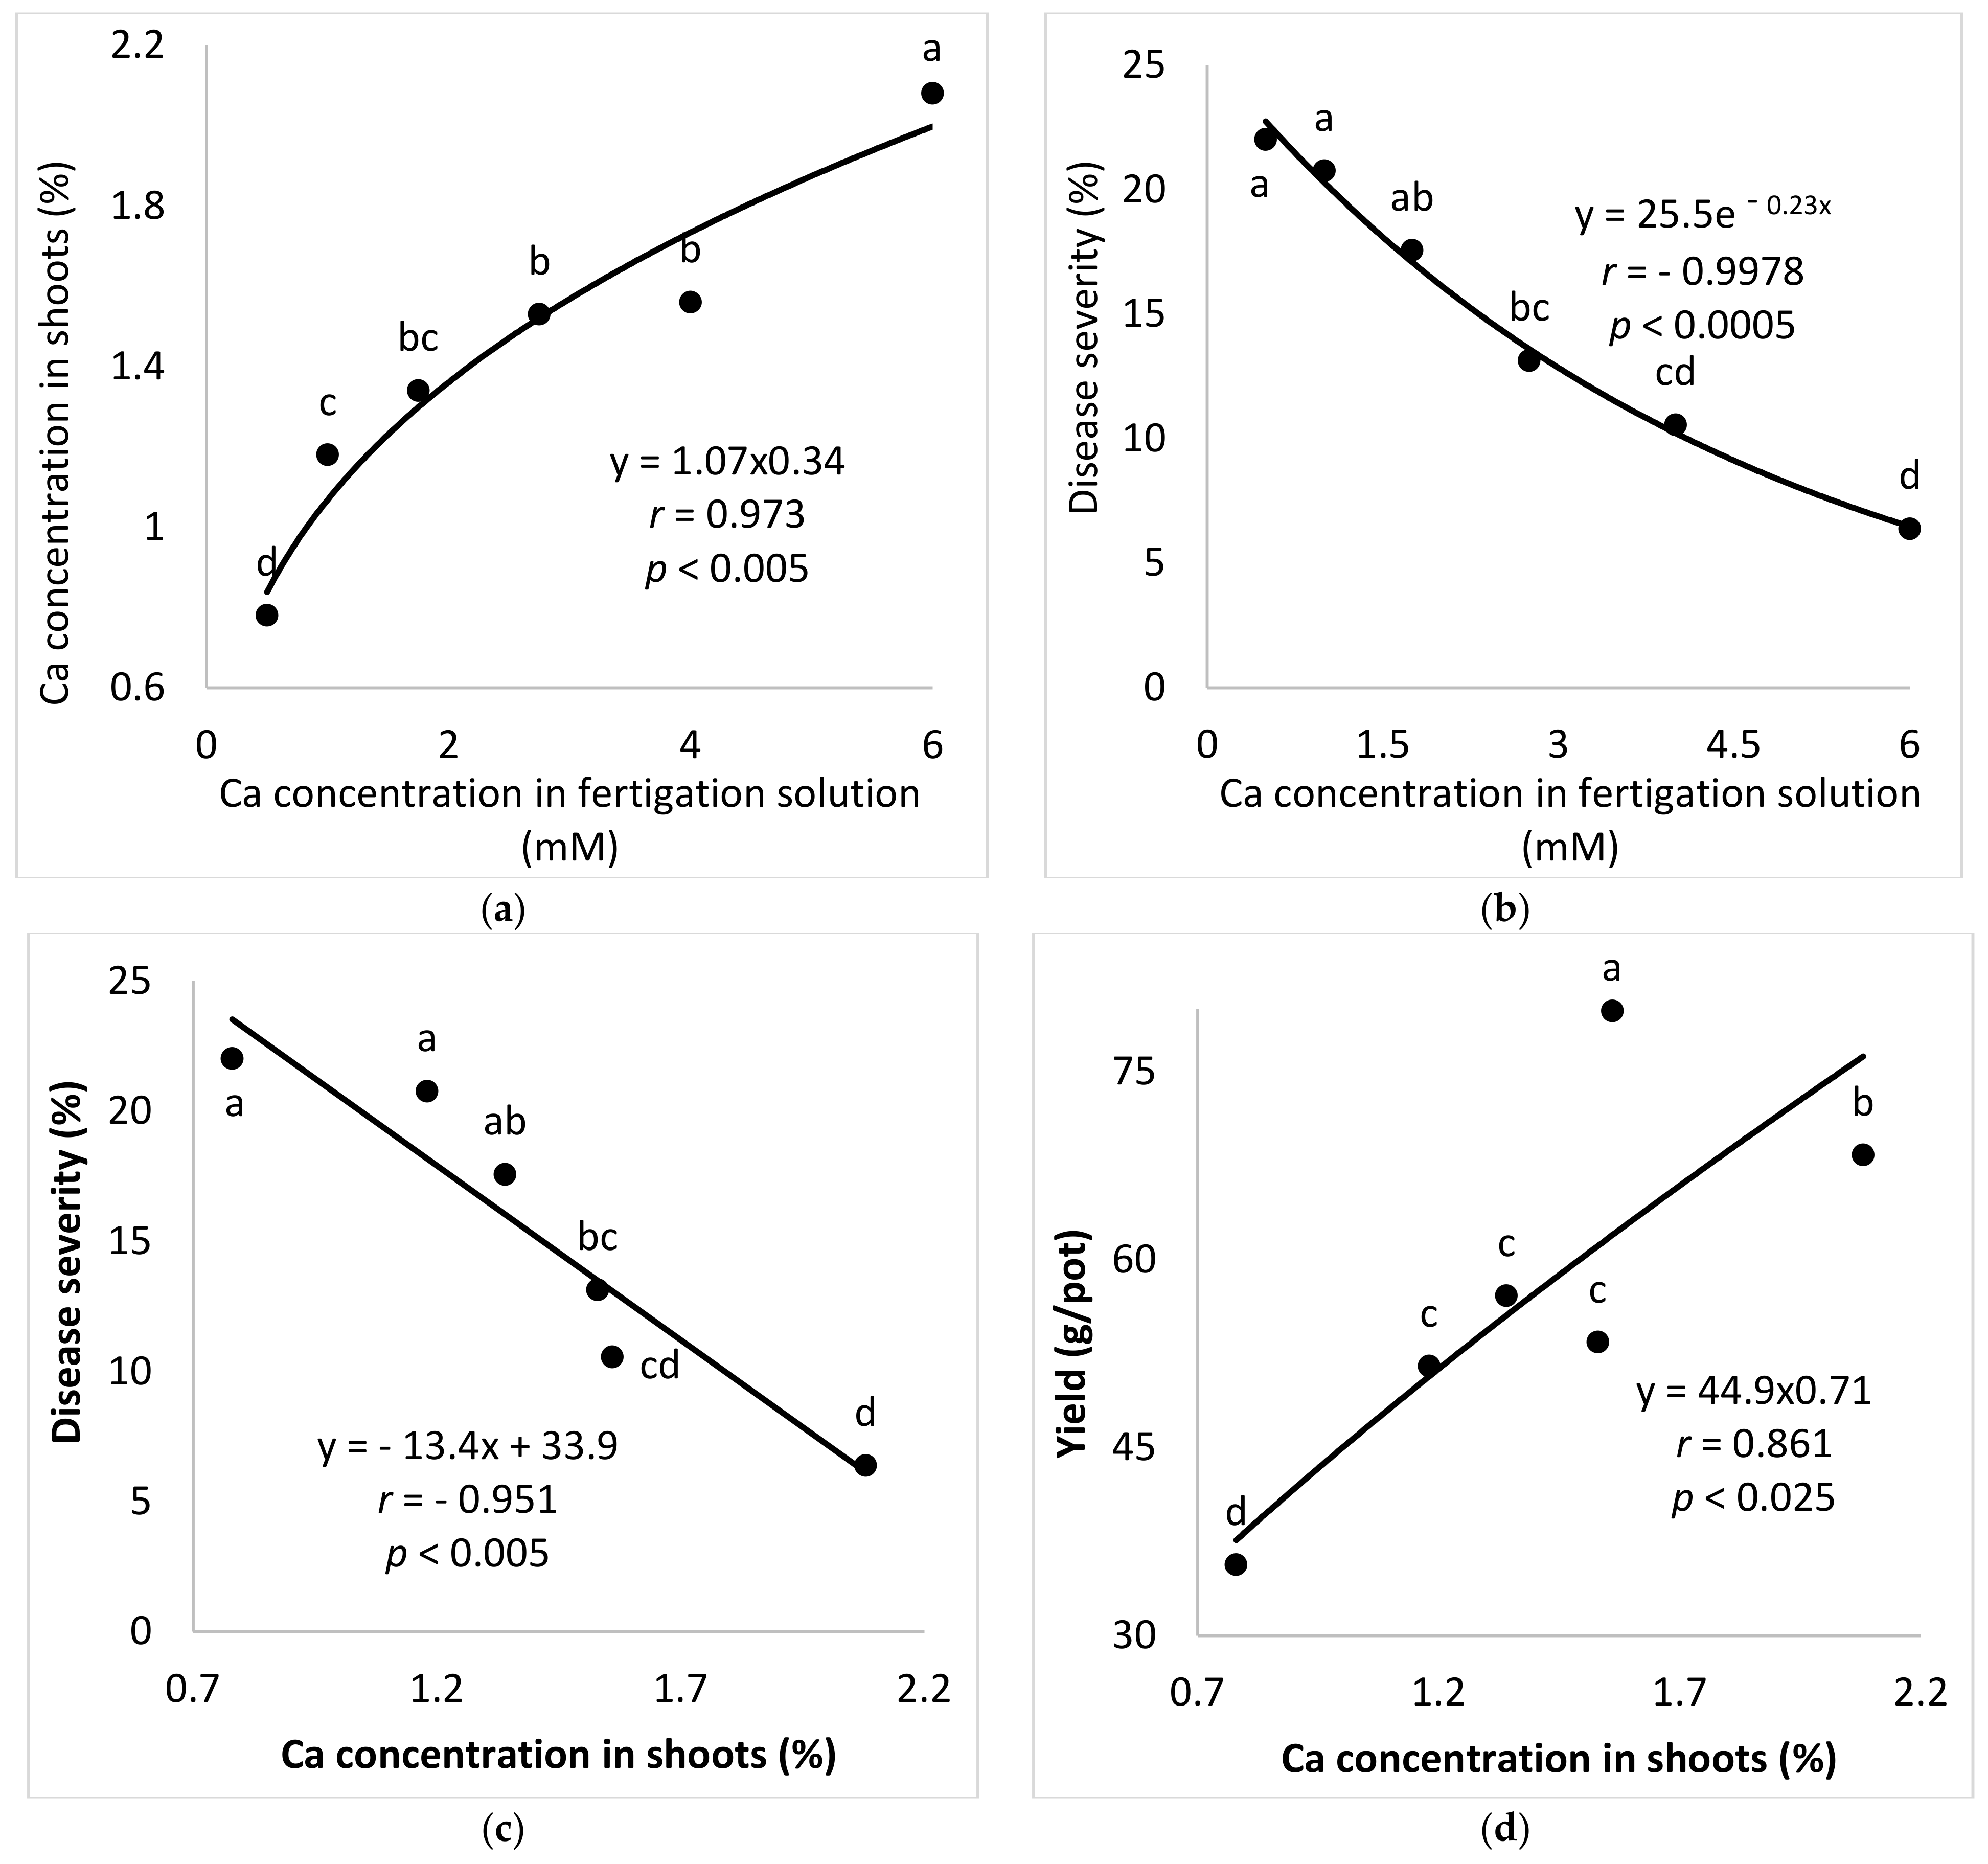
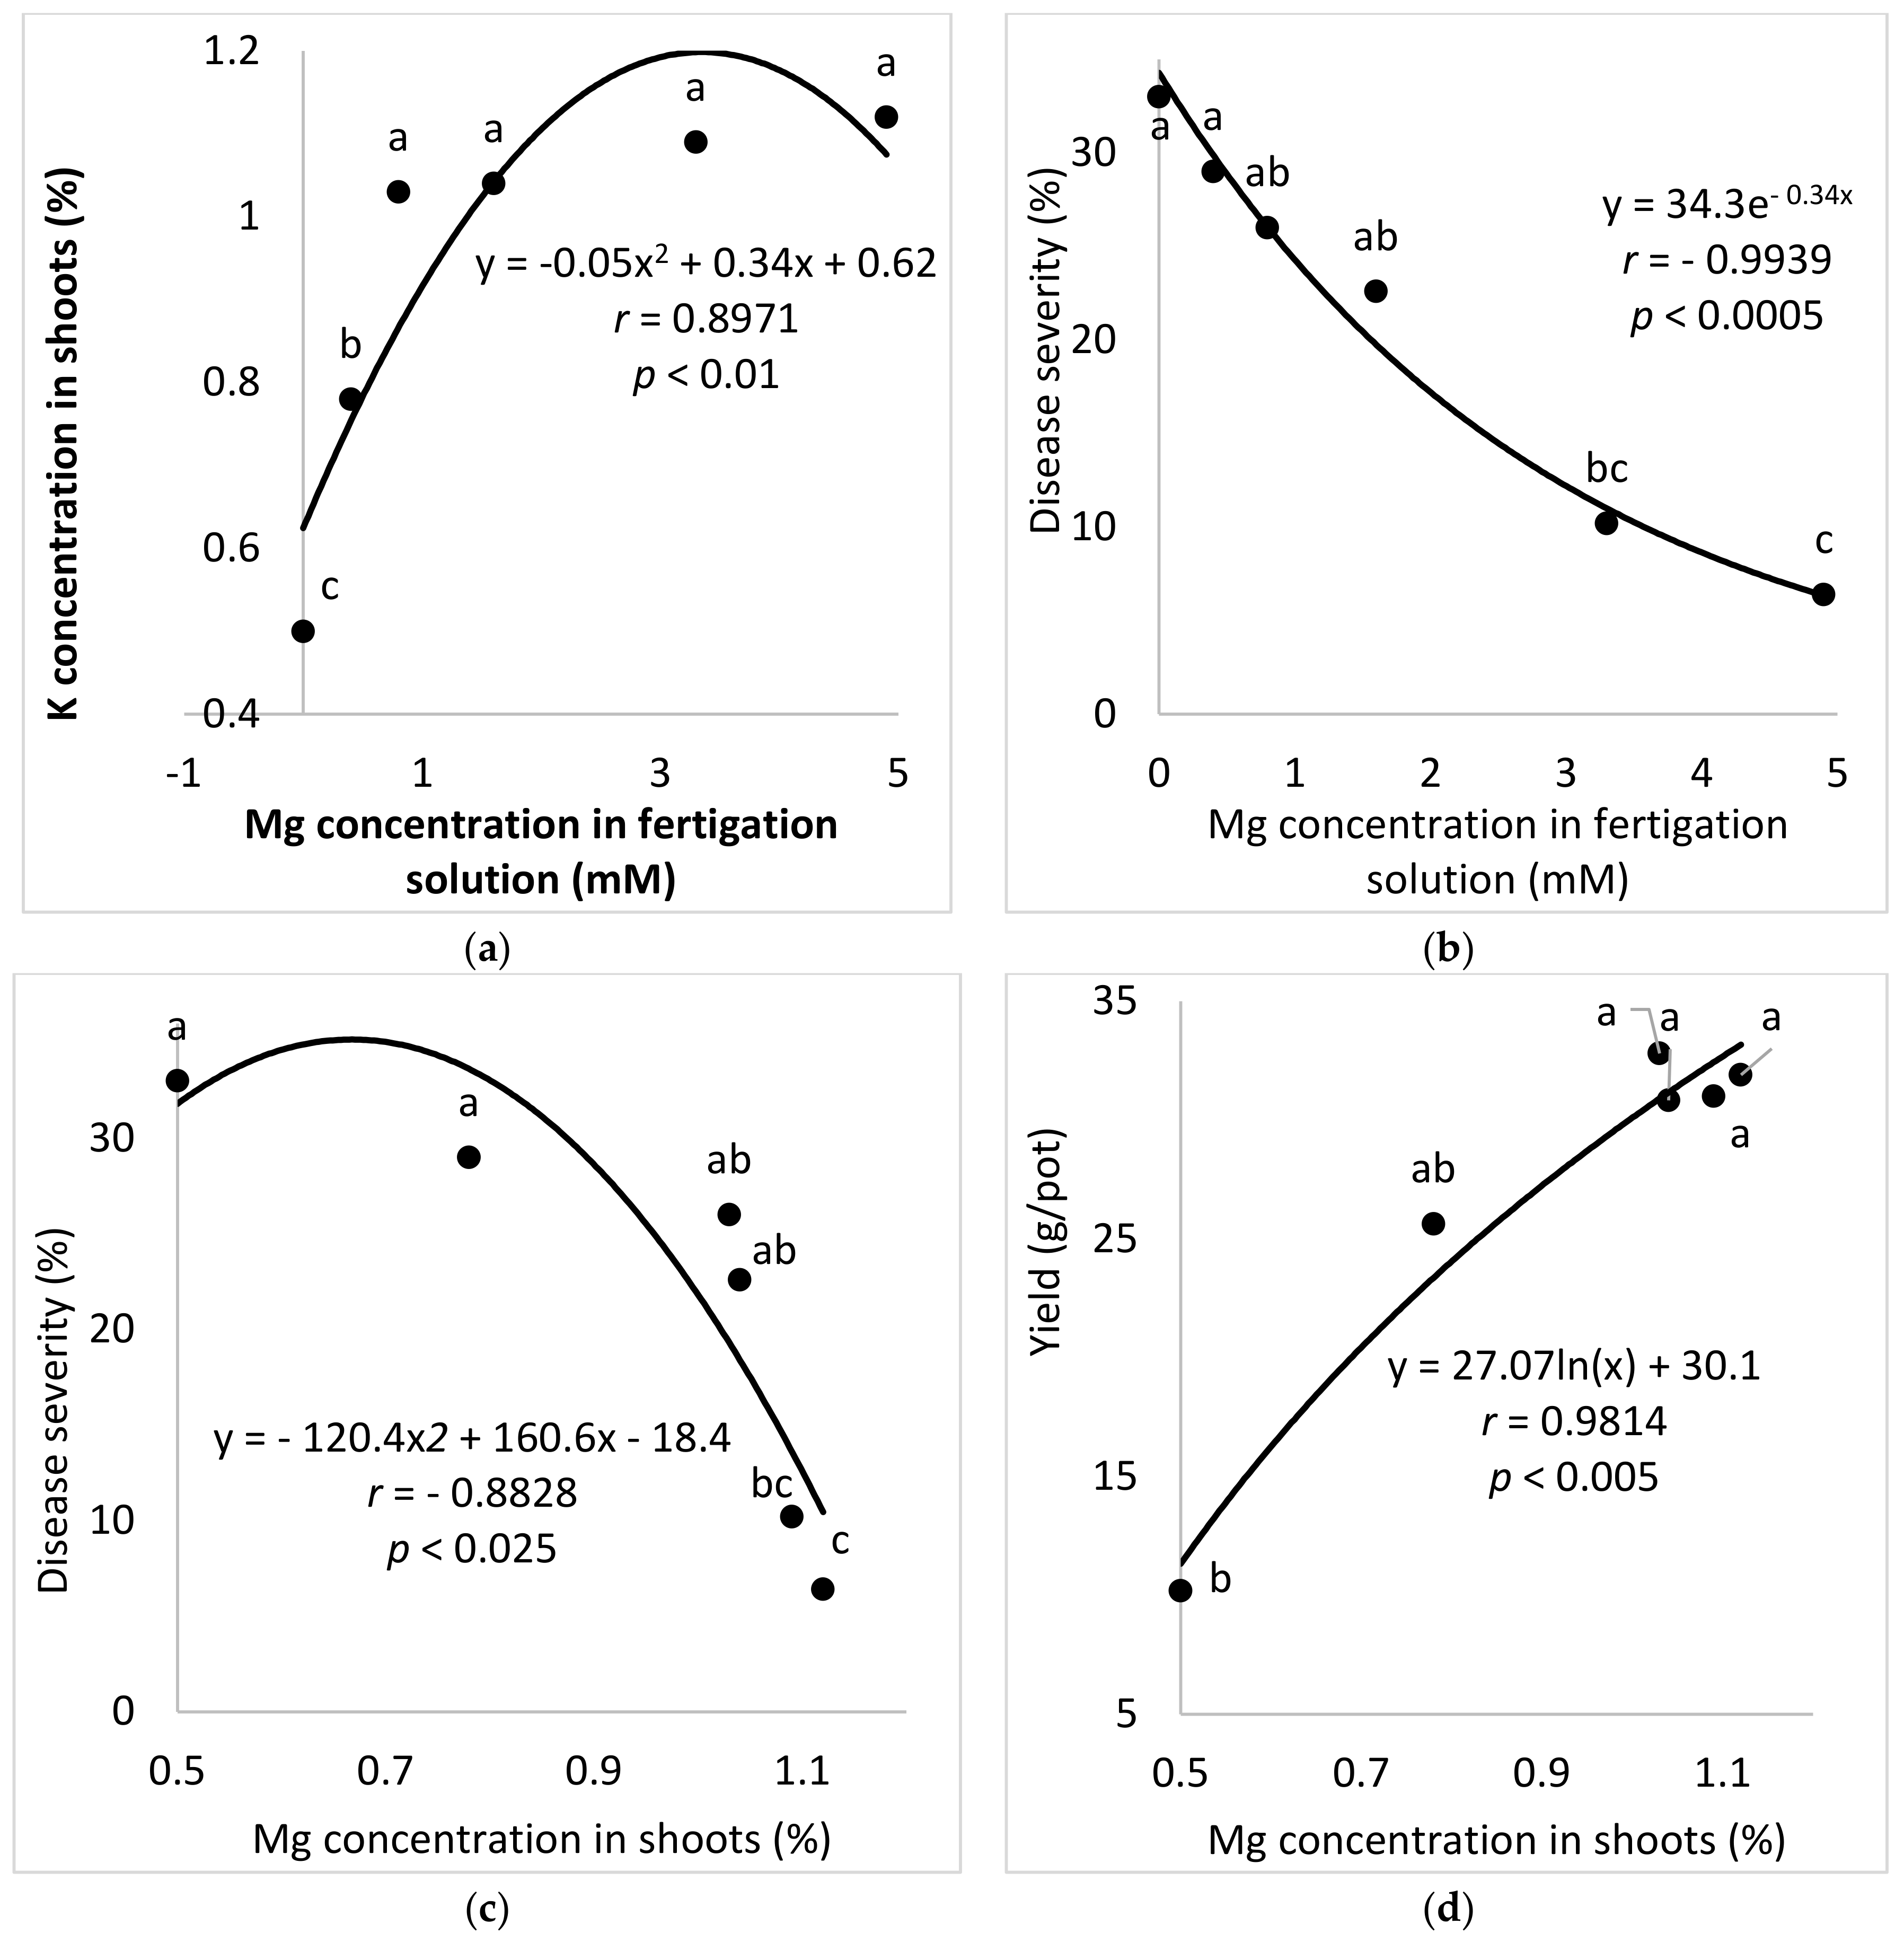
In the present research, the concentrations of Ca and Mg in the shoots were negatively correlated with disease severity. Surprisingly, Ca and Mg did not have an additive effect on SBDM control. The Mg concentration in Ca-enriched plants was lower than that observed in the plants that received the lower Ca treatment. It is possible that the deleterious effect of Ca on Mg load in the canopy was the reason that the combination of supplemental Mg and supplemental Ca did not provide superior disease control. There is no evidence in the literature for such an effect of this cations combination on plant disease. Furthermore, the observed suppression of SBDM by Ca and Mg treatments points to a general mode of action that is triggered by either of those cations. The fact that the application of K through the fertigation solution did not provide similar SBDM suppression, but actually increased SBDM severity, suggests that this mode of action is not generally related to all cations but is specific to Ca2+ and Mg2+.
Similar to our work, application of 4–30 mM KNO
3 prior to inoculation was shown to greatly reduce the incidence of Phytophthora stem rot (the oomycete
Phytophthora sojae) in soybean. The extent of that disease reduction was related to the increased K concentration in the plants, particularly the accumulation of K in the cortex layer of the plants [
40]. In another study, downy mildew (
S. graminicola) of pearl millet was alleviated by the application of dipotassium hydrogen phosphate under experimental and commercial greenhouse conditions. However, in contrast to our findings, the disease suppression in that system was related to the phosphate component [
41]. In the present work, we can conclude that the observed effect was essentially associated with the cations. Contrasting results have been reported for KCl fertilization, which reduced the severity of wheat leaf rust (
Puccinia triticina), but that response may have been partially related to the chloride in the KCl fertilizer, as suggested by the authors of that work [
42]. In another pathosystem (cucumber downy mildew—
P. cubensis), increasing the osmotic pressure of a nutrient solution was reported to suppress the expansion of lesion area more effectively than increased leaf concentrations of K, P, Ca and Mg [
43].
The choice of anion to be paired with the cations that were used was an important question during the current research. As mentioned above, Cl did not have a clear effect in the early pot work with the cation sprays. In the pot experiments, Cl and SO4 K salts had similar effects on SBDM. Under greenhouse conditions, fertigation-applied MgCl2 suppressed SBDM somewhat more effectively than fertigation-applied MgSO4. Cl− was the anion of choice in other greenhouse experiments, as well.
Mg and Ca supplied through the fertigation solution suppressed the disease, but in cases of severe epidemics of downy mildew, further disease reduction is necessary. Better SBDM suppression was obtained when the application of those cations through the fertigation solution was paired with the foliar application of K. However, SF calculations revealed significant synergism for only some of the foliar K × cation-supplemented fertigation treatments. A more pronounced improvement in disease control was obtained by combining Mg fertigation with a foliar fungicide treatment; some of the Mg × fungicide treatments provided synergetic disease control. The Mg treatment allows the use of a reduced amount of fungicide, which may help to limit the level of fungicide residue on the harvested branches. A similar benefit from the combination of plant nutrition and fungicides has been observed in the context of other diseases of sweet basil (i.e., gray mold (
B. cinerea) and white mold (
S. sclerotiorum)) [
10,
11].


