Article

Genetic Mapping of Grain Shape Associated QTL Utilizing Recombinant Inbred Sister Lines in High Yielding Rice (Oryza sativa L.)

1
State Key Laboratory of Rice Biology and Chinese National Center for Rice Improvement, China National Rice Research Institute, Hangzhou 311401, China
2
Northern Center of China National Rice Research Institute, Shuangyashan 155100, China
*
Authors to whom correspondence should be addressed.
Agronomy 2021, 11(4), 705; https://doi.org/10.3390/agronomy11040705
Submission received: 24 February 2021 / Revised: 29 March 2021 / Accepted: 2 April 2021 / Published: 7 April 2021

Abstract

:
Grain shape is a key factor for yield and quality in rice. To investigate the genetic basis of grain shape in the high-yielding hybrid rice variety Nei2You No.6, a set of recombinant inbred sister lines (RISLs) were used to map quantitative trait loci (QTLs) determining grain length (GL), grain width (GW), and length-width ratio (LWR) in four environments. A total of 91 medium/minor-effect QTL were detected using a high-density genetic map consisting of 3203 Bin markers composed of single nucleotide polymorphisms, among which 64 QTL formed 15 clusters. Twelve of 15 clusters co-localized with QTL previously reported for grain shape/weight. Three new QTL were detected: qGL-7a, qGL-8, and qGL-11a. A QTL cluster, qLWR-12c/qGW-12, was detected across all four environments with phenotypic variation explained (PVE) ranging from 3.67% to 11.93%, which was subsequently validated in paired lines of F17 progeny and tightly linked marker assay in F10 generation. Subsequently, 17 candidate genes for qLWR-12c/qGW-12 were detected in the 431 Kb interval utilizing bulk segregant analysis (BSA). Among these, OsR498G1222170400, OsR498G1222171900, OsR498G1222185100, OsR498G1222173400, and OsR498G1222170500 were the best candidates, which lays the foundation for further cloning and will facilitate high-yield breeding in rice.

1. Introduction

Rice (Oryza sativa L.) is one of the most important crops in the world, feeding more than 50% of the world’s population. In order to meet the increasing consumption demand of the people, high-yield and high-quality rice varieties are becoming more and more popular. Grain shape is a key factor of yield and appearance quality in rice, which is determined by grain length (GL), grain width (GW), and length-width ratio (LWR) [1]. Therefore, paying attention to the quantitative trait loci (QTLs)/genes for grain shape is useful for the improvement of varieties.
To date, there are more than 500 QTLs and 60 genes for grain shape and weight mapped on the rice genome (http://www.gramene.org/ (accessed on 5 April 2021)). These QTLs/genes were mainly located on all 12 chromosomes. Among these, twenty QTLs controlling grain shape or weight have been cloned, such as Grain Size 3 (GS3) [2], Grain Weight 2 (GW2) [3], Grain Width 5 (GW5) [4], Thousand-grain Weight 2 (TGW2) [5], Grain Length 3.1 (GL3.1) [6], Thousand-grain Weight 6 (TGW6) [7], Grain Size 2 (GS2) [8], Grain Weight 8 (qGW8) [9], Long-grain and high-yield 3 (LGY3) [10], Grain Shape 9 (GS9) [11], Gain Length and Weight 7 (GLW7) [12], Grain Length 4 (GL4) [13], Grain Length 6 (GL6) [14], Long Grain 3 (OsLG3) [15], Grain Size 5 (GS5) [16], Grain Width 6 (GW6) [17], Grain Length 7 (GL7) [18], Thousand-grain Weight 3 (TGW3) [19], Grain weight 6a (GW6a) [20], and Grain Size and Abiotic stress tolerance 1 (GSA1) [21]. Aggregating beneficial alleles of these genes can increase yield and rice quality. For example, introducing different allele combinations of qLGY3 and GS3 into the indica rice variety RD23 can achieve different yield-increasing effects. RD23-lgy3-gs3 proved to be on average about 10.9% more productive than RD23-LGY3-gs3 and improved grain appearance quality [10]. In the process of artificial domestication of rice, some of the grain shape QTLs/genes have been used in rice breeding invisibly [22]. So, the analysis of the genetic mechanism of high-yield and high-quality varieties is helpful for future targeted molecular improvement breeding.
Appropriate genetic populations and accurate and saturated genetic markers can improve the efficiency of QTL mapping in plants [23]. Generally, F2, backcross (BC), recombinant inbred line (RIL), double haploid (DH) are primary populations for QTL preliminary mapping [24,25,26,27]. Near isogenic lines (NIL), residual heterozygous line (RHL), and chromosome segment substitution line (CSSL) are secondary populations for QTL fine mapping [28,29]. For example, the major QTL GL7 for grain length was detected in the F2 population constructed from indica rice Ping13 (P13) and japonica rice nipponbare, and then fine mapped and cloned by near-isogenic lines [18].
Polymorphism molecular markers are closely related to the construction of a genetic map. Recent achievements in sequencing technology enabled high-throughput genotyping of single nucleotide polymorphisms (SNPs), providing saturated molecular markers for the genetic mapping of complex traits in rice [30,31]. Since there are millions of SNPs produced by whole-genome re-sequencing, the continuous non-recombinant SNPs on the genome are combined to develop a bin marker, which is the position on the genetic map with a unique separation pattern [32,33]. For example, Li et al. constructed a high-density genetic map containing 3265 bins, and located 71 QTLs related to 15 agronomic traits in three ecological environments. They further fine-mapped the prominent clusters, such as in the qPL9 cluster interval, where they found seven annotated candidate genes including a QTL DEP1 that controls grain number and panicle architecture [34,35]. In another research, a total of 26 QTLs for 6 yield traits were mapped using a high-density linkage map with 3016 Bin markers. Among them, qAGB6 and qHI9, controlling above-ground biomass and harvest index respectively, were the novel QTLs. The authors also developed markers to clone qGY8, which formed a QTL cluster together with qTGW8 and qHI8 [31]. Previously, our team reported a novel population of recombinant inbred sister lines (RISLs) with 386 lines represented by 3203 Bin markers, which was used to successfully map 43 yield-associated QTLs [36].
Bulk segregant analysis (BSA) serves as a strategy for mapping QTLs/genes by genotyping the extreme phenotypes rather than the entire mapping population. Salunkhe et al. used the BSA method to fine-map a QTL for drought resistance in the interval of RM212–RM302–RM8085–RM3825 on chromosome 1 [37]. With the development of next-generation sequencing (NGS), the cost of developing SNPs and sequencing has decreased, making BSA a powerful tool for QTLs/gene mapping. Takagi et al. fine mapped a major QTL qPHS3-2 for seedling vigor using RILs of F7 generations. Subsequently, they used QTL_seq for fine-mapping it from the F2 population to the interval of 39.08–41.08 Mb on chromosome 1 [38]. Moreover, a minor QTL qPHS-1 was detected at its latter position [39]. This shows that compared with the traditional QTL mapping method, the combination of BSA and whole-genome resequencing is not only more time-saving and labor-saving, but also more efficient for the mapping of minor QTLs.
Here, we delve into the grain shape QTLs of the super rice Nei2You No.6. Totally, we mapped 91 QTLs with phenotypic variation explained (PVE) ranging from 3.67% to 11.93%. Among all QTLs detected, the stably expressed qLWR-12c/qGW-12 was validated and subsequently further mapped utilizing the BSA method in the RHL population. These results would provide useful information for improving grain yield and appearance quality in rice molecular breeding.

2. Materials and Methods

2.1. Materials and Cultivation

‘Super rice’ is defined as a variety with at least one elite trait among yield, quality, and resistance [40]. Nei2You No.6 is an indica three-line hybrid variety released by China National Rice Research Institute, which is a ‘super rice’ with a yield of 591.1 Kg/667m2 (http://www.ricedata.cn/variety/superice.htm (accessed on 5 April 2021)). The population and genetic map are constructed as described before [36]. Consisting of 386 lines (F15) with 3203 Bin markers, the RISL population was developed from the cross between the maintainer Nei2B and the restorer Zhonghui8006 (R8006). For QTLs mapping, two parents and RISLs were cultivated in Fuyang (FY, 119°57′ E long; 30°03′ N lat), Zhejiang Province and Lingshui (LS, 110°03′ E long; 18°05′ N lat), Hainan Province in 2015 and 2016. For simplicity, we took the abbreviation 15FY, 15LS, 16FY, and 16LS representing the four corresponding environments. For QTLs validation, paired RISLs in F17 generation were planted in Fuyang in the summer of 2018 and the library of F10 generation was grown in Lingshui in 2018. For BSA, screened RHL harboring qLWR-12c/qGW-12 from F10 generation and planted in the summer of 2019 as secondary F3 population. After the phenotype was identified, selected individual plants with extreme phenotypes form a pool. The workflow of this study was shown in Figure S1.

2.2. Phenotypic Analysis

All trials were conducted with a completely randomized block design with two replications. About 25 days after sowing, 16 plants of each RISL were transplanted in two rows with a spacing of 21 × 18 cm. Field management followed the normal agricultural practice [41]. At maturity, effective panicles of six individuals from the inner portion of each line were collected for phenotyping. All seeds sun dried, threshed artificially and then evaluated with an automatic seed examination system (Wanshen Detection Technology Co., Ltd., Hangzhou, China).

2.3. QTLs Mapping and Statistical Analysis

QTLs analysis was performed with the composite interval mapping (CIM) function in WinQTLCart 2.5 software (https://statgen.ncsu.edu/qtlcart/WQTLCart.htm (accessed on 5 April 2021)). One thousand permutations were conducted with 1 cM as a search step, and the LOD threshold of 2.5 was set to declare a QTL. We obtained the percentage of phenotypic variation explained (PVE) and the value of additive effects of each QTL. The nomenclature of QTLs followed the rules reported by McCouch [42].
Statistical analysis was conducted using Microsoft Excel and GraphPad Prism 8 software for parents and RISLs. Frequency distribution was carried out in Microsoft Excel and drawn in Prism 8 software. Using R3.6.3 software, package “corrplot” was used to calculate pearson correlation coefficient and show the correlation among GL, GW, LWR, and 1000-grain weight (TGW). Also, using pakage “PCA” and “ggplot2” to conduct the principal component analysis. For qLWR-12c/qGW-12 validation, clustering analysis of two groups (Nei2B-type and R8006-type) divided by linked marker 12–26 (F: 5′-ACATTGCTTCACGGGATTTGG-3′, R: 5′-CGGCAATAACCACAACGCCT-3′) was carried out in F10 progeny. Data of the traits for paired line and two separated groups were compared using Student’s t-tests.

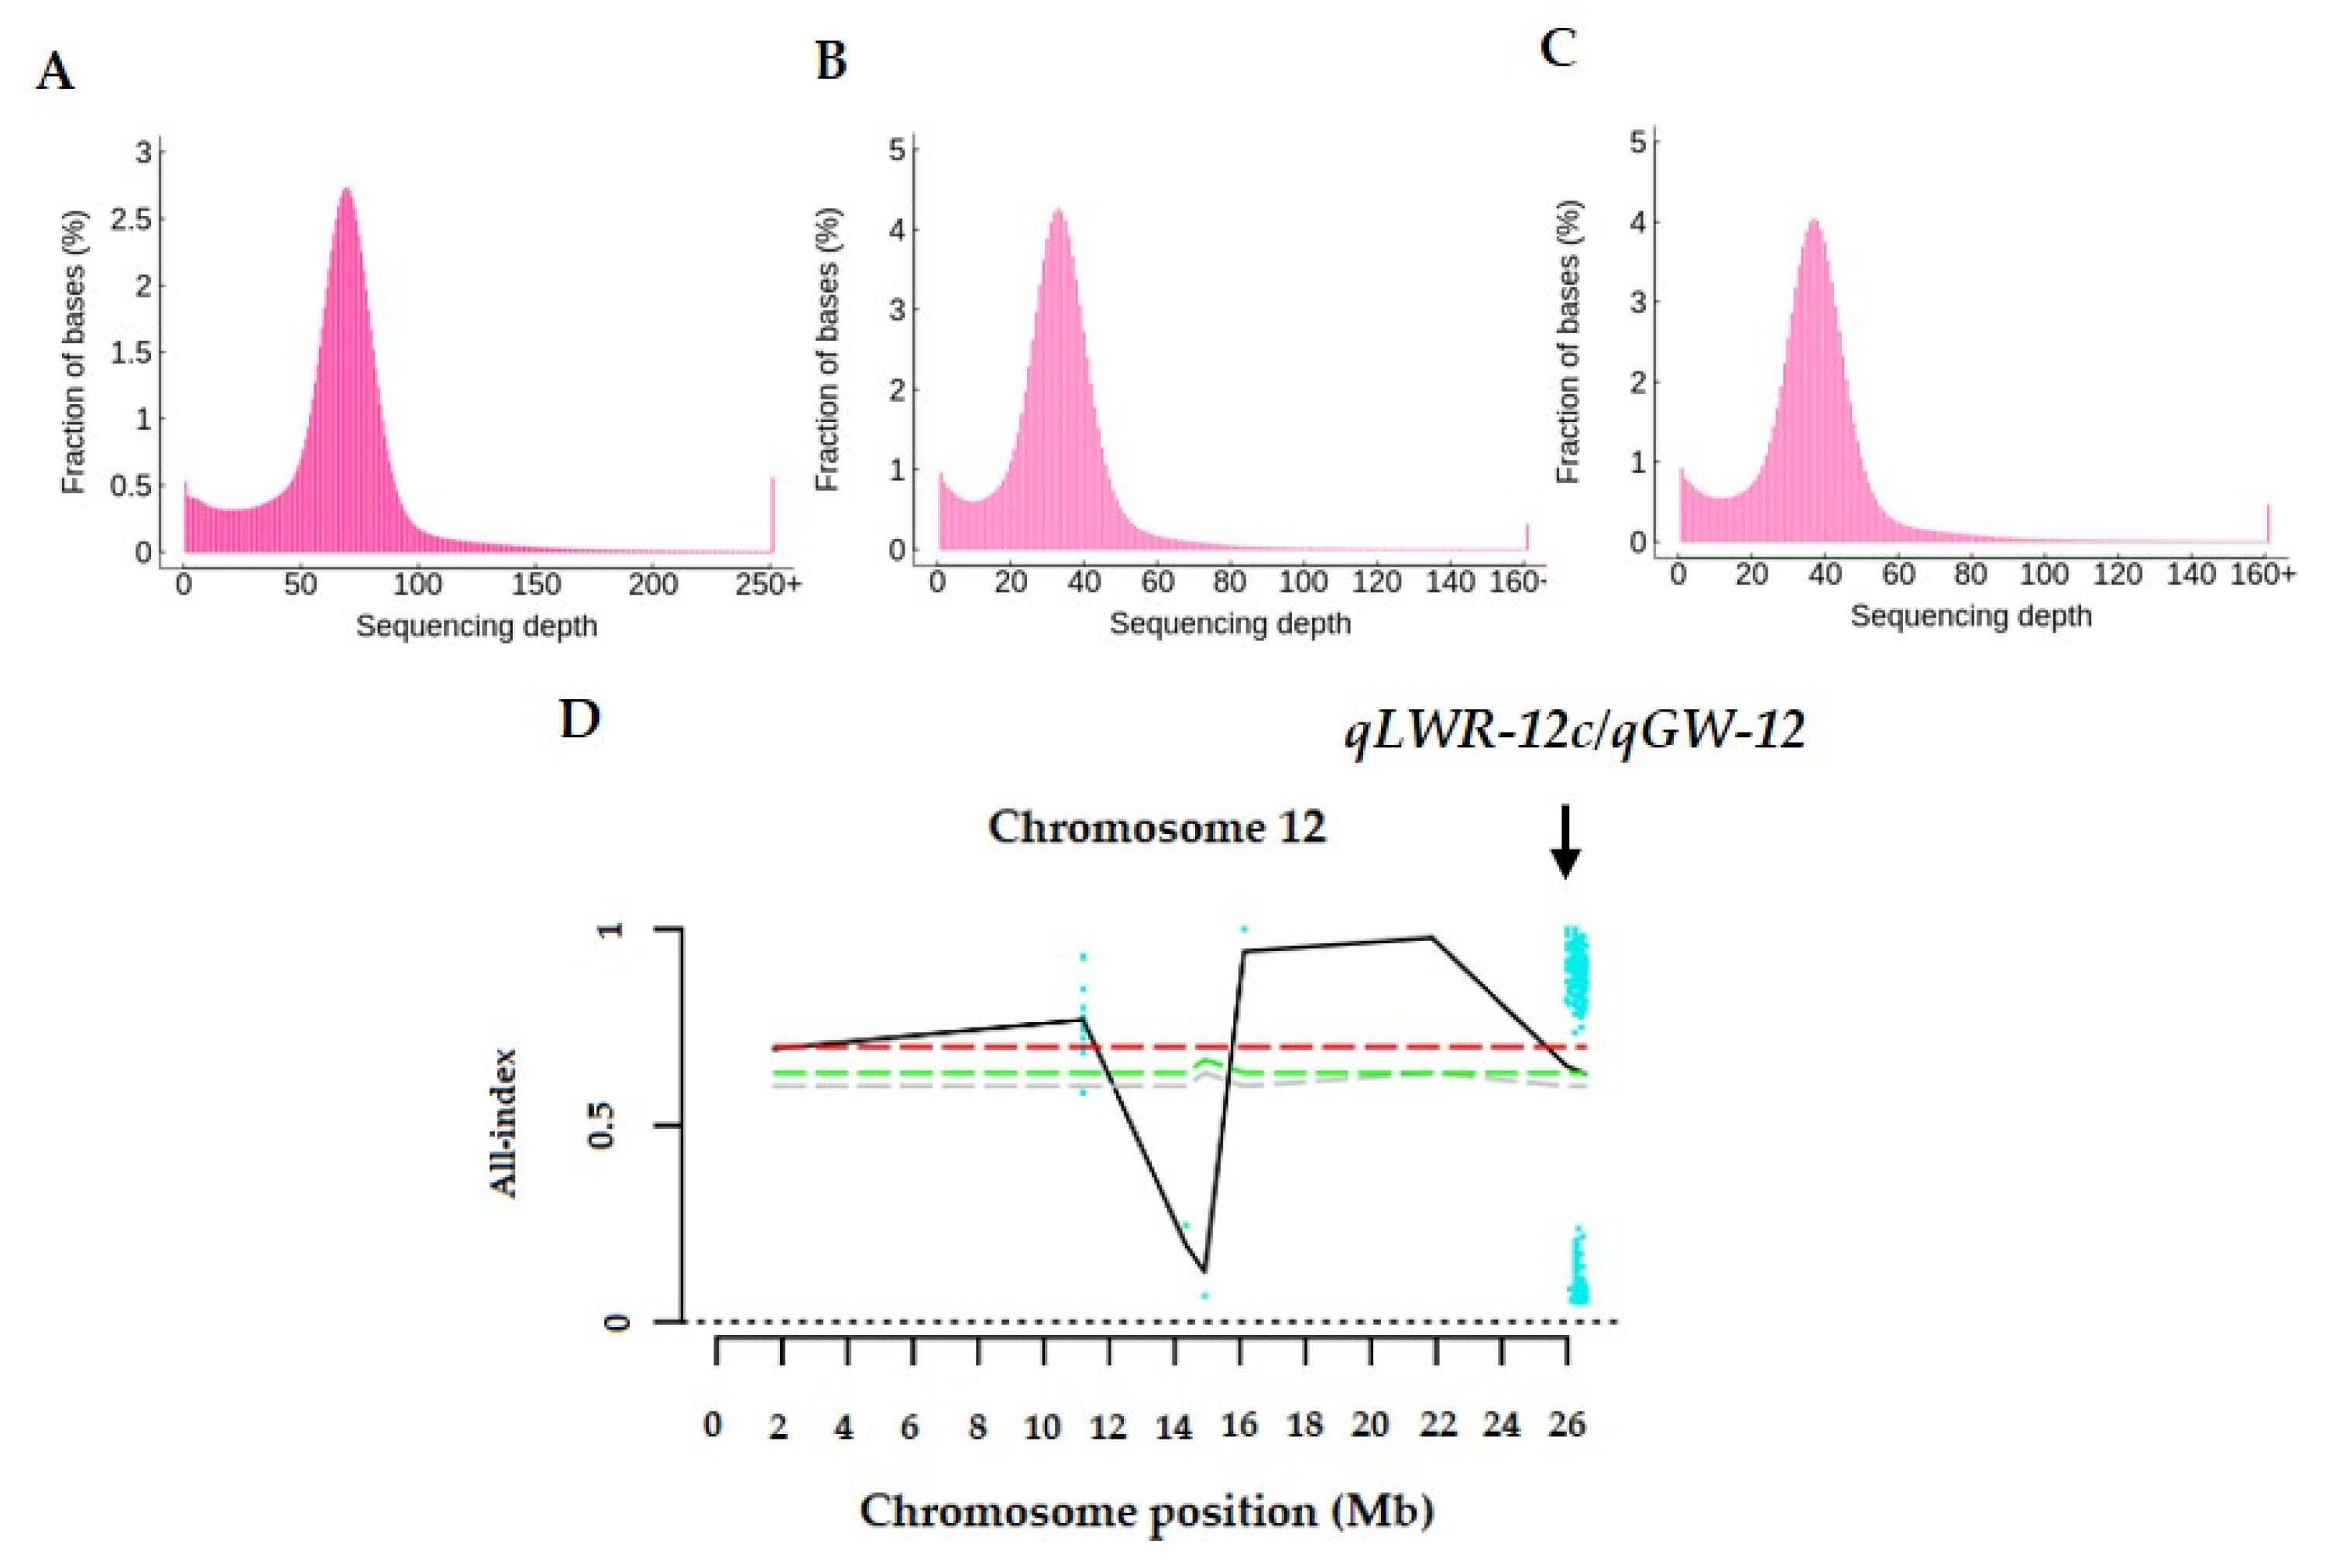
2.4. Bulk Segregant Analysis and Re-Sequencing

We selected 30 individuals with extremely high values of LWR in secondary F3 to form a pool. Genomic DNA of individuals and paired line (Q42 and Q43) was extracted using a CTAB method [43]. Re-sequencing of the mixed pool and paired lines were carried out on the Illumina HiSeq X Ten platform in Berry Genomics (Beijing Berry Genomics Biotechnology Co. Ltd., Beijing, China). For SNP calling, clean data was compared with R498 reference genome sequence (http://www.mbkbase.org/R498/ (accessed on 5 April 2021)) by the Burrows-Wheeler Aligner (BWA) 0.7.5a-r405 with default parameters [44]. SNPs and Insertion and Deletions (InDels) were detected by genome analysis toolkit 3.8 (GATK 3.8) and annotated by Annovar software [45]. SNP-index and InDel-index were calculated according to a previous report [46]. SNP-index and InDel-index were merged into All-index and the distribution of All-index on chromosome was plotted. At the 90% confidence level, the sites with All-index greater than 0.9 were selected as candidate SNPs/InDels.

3. Results

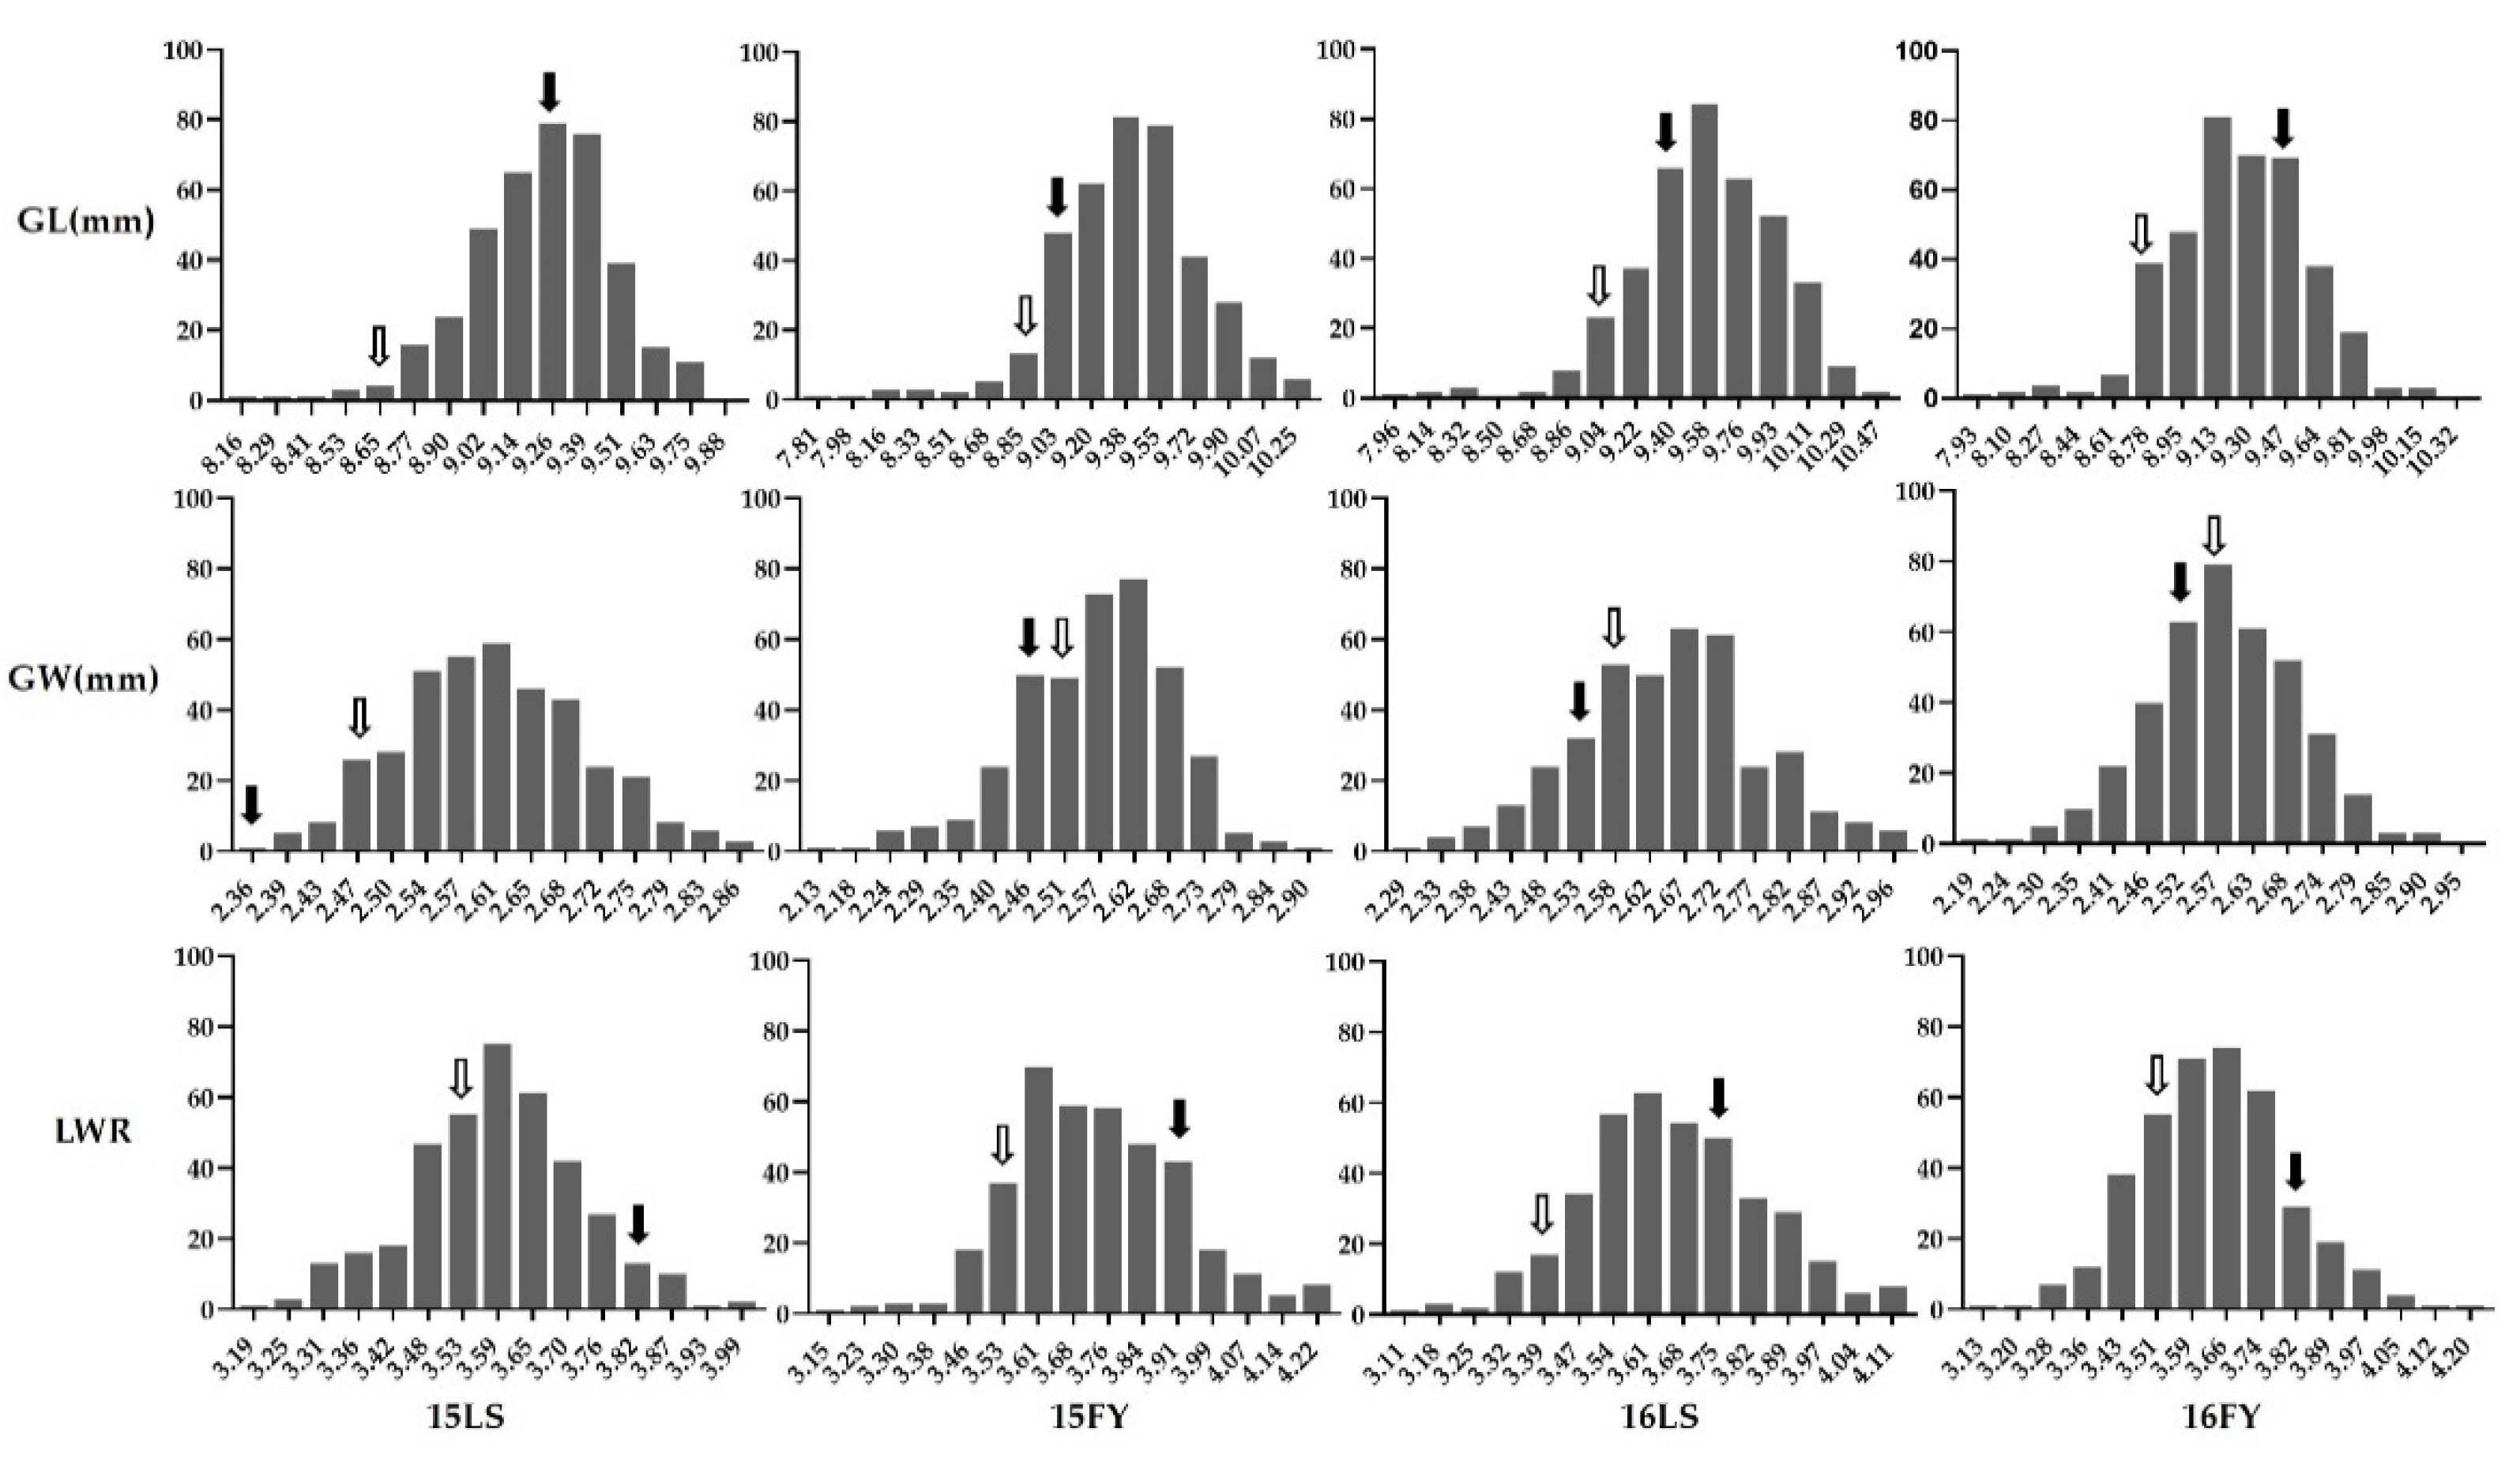
3.1. Phenotypes of Parents and RISLs

Considerable variations were observed between the two parental lines, specifically, Nei2B exhibited decreased GL and LWR but increased GW compared to R8006 (Figure 1). In the RISL population, all three traits showed continuous distribution and transgressive segregation across the four environments, indicating their quantitative inheritance. And the value of kurtosis and skewness of each trait were all between −1 and 1 except the kurtosis of GL in 15YF and 16LS (Table S1). These results indicated that GL, GW, and LWR were controlled by multiple genes in hybrid Nei2You No.6, meeting the requirements of QTLs analysis.
Correlation analysis between TGW and three grain shape traits were shown in Figure S2. TGW, GL, and GW positively correlated with each other across the four environments. LWR was positively correlated with GL and negatively correlated with GW and TGW. Notably, LWR and GW had a supreme negative correlation in each environment.

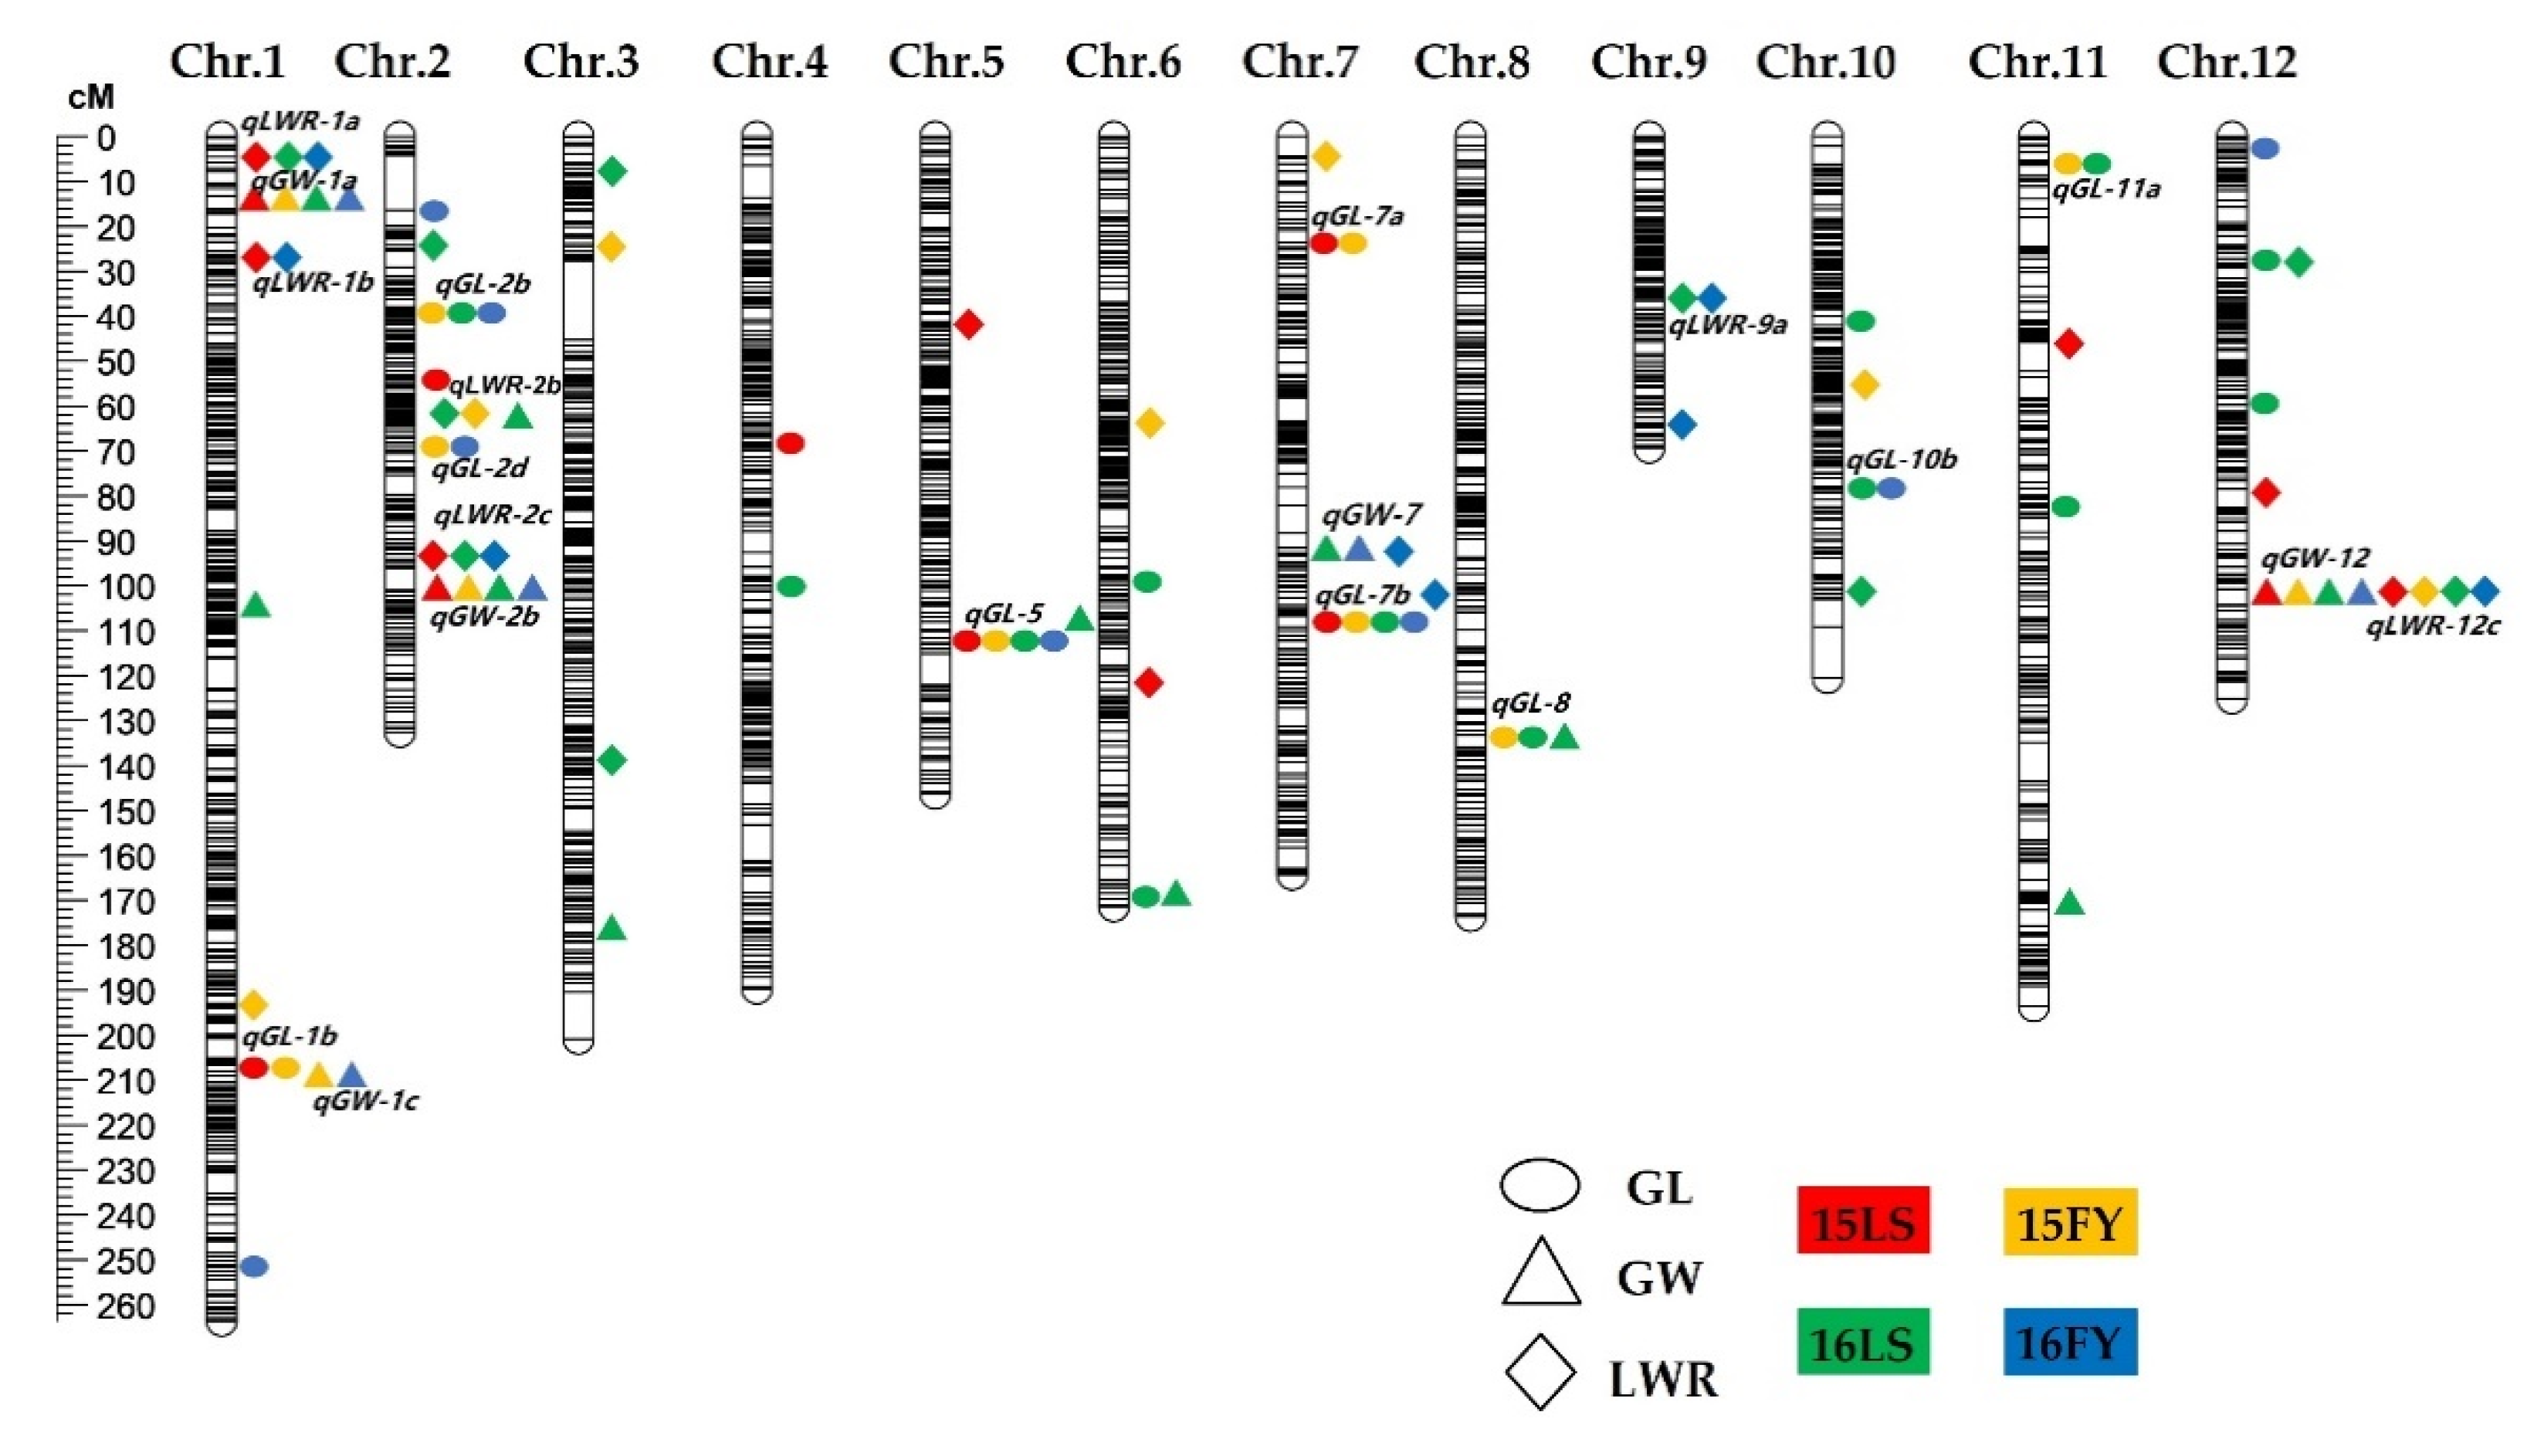
3.2. QTLs Analysis for GL, GW, and LWR

To discover the genetic mechanism underlying the grain shape of Nei2You No.6, we principally focused on three traits for grain shape (GL, GW, and LWR). A total of 91 additive QTLs were detected in RISLs in four environments, totally explaining 11.27–51.35% of the phenotypic variance (Figure 2; Table 1 and Table S2). Among them, 20 QTLs were detected in two or more environments.
Nine QTLs (qGL-1b, qGL-2b, qGL-2d, qGL-5, qGL-7a, qGL-7b, qGL-8, qGL-10b, and qGL-11a) associated with grain length were detected on chromosomes 1, 2, 5, 7, 8, 10, and 11, respectively. Each of them explained a phenotypic variance ranging from 2.25% to 10.04%. The beneficial alleles of qGL-1b, qGL-2b, and qGL-2d were from R8006, while the other six loci were inherited from Nei2B. Moreover, both qGL-5 and qGL-7b were detected in all four environments with the PVE from 5.57% to 10.04% and from 3.32% to 4.33%, respectively.
For grain width, five QTLs (qGW-1a, qGW-1c, qGW-2b, qGW-7, and qGW-12) were mapped on chromosomes 1, 2, 7, and 12 with the PVE ranging from 2.53% to 11.93%. With the additive effects from R8006, the stable qGW-2b represented 4.15%, 4.26%, 4.60%, and 6.58% of the phenotypic variance in 15LS, 15FY, 16LS, and 16FY, respectively. With positive alleles from Nei2B, qGW-1a and qGW-12 were also detected across four environments, explaining 2.98% to 4.74% and 3.68% to 11.93% of phenotypic variance, respectively. However, qGW-1c and qGW-7 were only detected in two environments and their positive alleles were conferred from R8006.
Six QTLs (qLWR-1a, qLWR-1b, qLWR-2b, qLWR-2c, qLWR-9a, and qLWR-12c) for length-width ratio were mapped on chromosomes 1, 2, 9, and 12 with the PVE ranging from 2.38% to 8.21%. Among them, only the positive allele for qLWR-2c came from Nei2B, which could be tested in 15FY, 16LS and 16FY, expounding 3.06%, 5.19%, and 5.56% phenotypic variance, respectively. Additionally, the R8006 alleles contributed to the other five QTLs, such as qLWR-1a, qLWR-1b, qLWR-2b, qLWR-9a, and qLWR-12c. The qLWR-1a was detected in the same three environments as qLWR-2c. Notably, qLWR-12c was detected across four environments with the PVE from 4.13% to 8.21% and positionally overlapped with qGW-12. This happened to qGL-1b and qGW-1c as well.
Some QTLs formed several clusters: qGL-1b/qGW-1c for grain length and grain width, qGL-2b for grain length, qGL-2d/qLWR-2b for grain length and length-width ratio, qGL-5 for grain length, qGL-6b/qGW-6 for grain length and grain width, qGL-7a for grain length, qGL-7b/qGW-7, qGL-8 for grain length, qGL-10b for grain length, qGL-11a for grain length, qGL-12b/qLWR-12a for grain length and length-width ratio, qGW-1a/qLWR-1a/qLWR-1b for grain width and length-width ratio, qGW-2b/qLWR-2c for grain width and length-width ratio, qGW-12/qLWR-12c for grain width and length-width ratio, and qLWR-9a for length-width ratio. Compared with the previous study, only qGL-7a, qGL-8, and qGL-11a were the new QTLs (Table 2).
Table 2. Comparison of grain shape related QTLs with previous studies.
QTLs of This StudyQTLs of Previous Study
QTLsPhysical (Mb)Published_SymbolMakerReference
qGL-1b/qGW-1c34.25–40.65qGL-1R210-C955[47]
qGL-2b4.95–6.55qGL-2bGL1327-C421[48]
qGL-2d/qLWR-2b26.05–28.85qGL-2C601-R3393[47]
qGL-526.25–28.95qGL5RM3321-RM274[28]
qGL-6b/qGW-632.05–32.25qTGW-6cBin1883-Bin1884[36]
qGL-7a1.55–2.05---
qGL-7b/qGW-718.85–23.65qGS7.1RM500-RM21772[49]
GLW7-[12]
qGL-822.70–25.05---
qGL-10b20.55–23.35kl10.1G2155-RG134[50]
qGL10RM27588-RM590[49]
qGL-11a0.15–1.85---
qGL-12b/qLWR-12a3.75–6.45TGW12RM7003-RM247[51]
qGW-1a/qLWR-1a/qLWR-1b0.05–4.25qGW-1C112-Xnpb113[47]
qGW-2b/qLWR-2c31.05–36.25qGW-2Tw35293-RM266[28]
TGW2-
qGW-12/qLWR-12c23.15–26.55GL12.2RM5479–RM28597[52]
qTGW-12Bin3246-Bin3266[36]
qLWR-9a7.75–18.35qLWR9-1RM23969-RM24002[49]
GS9-[11]

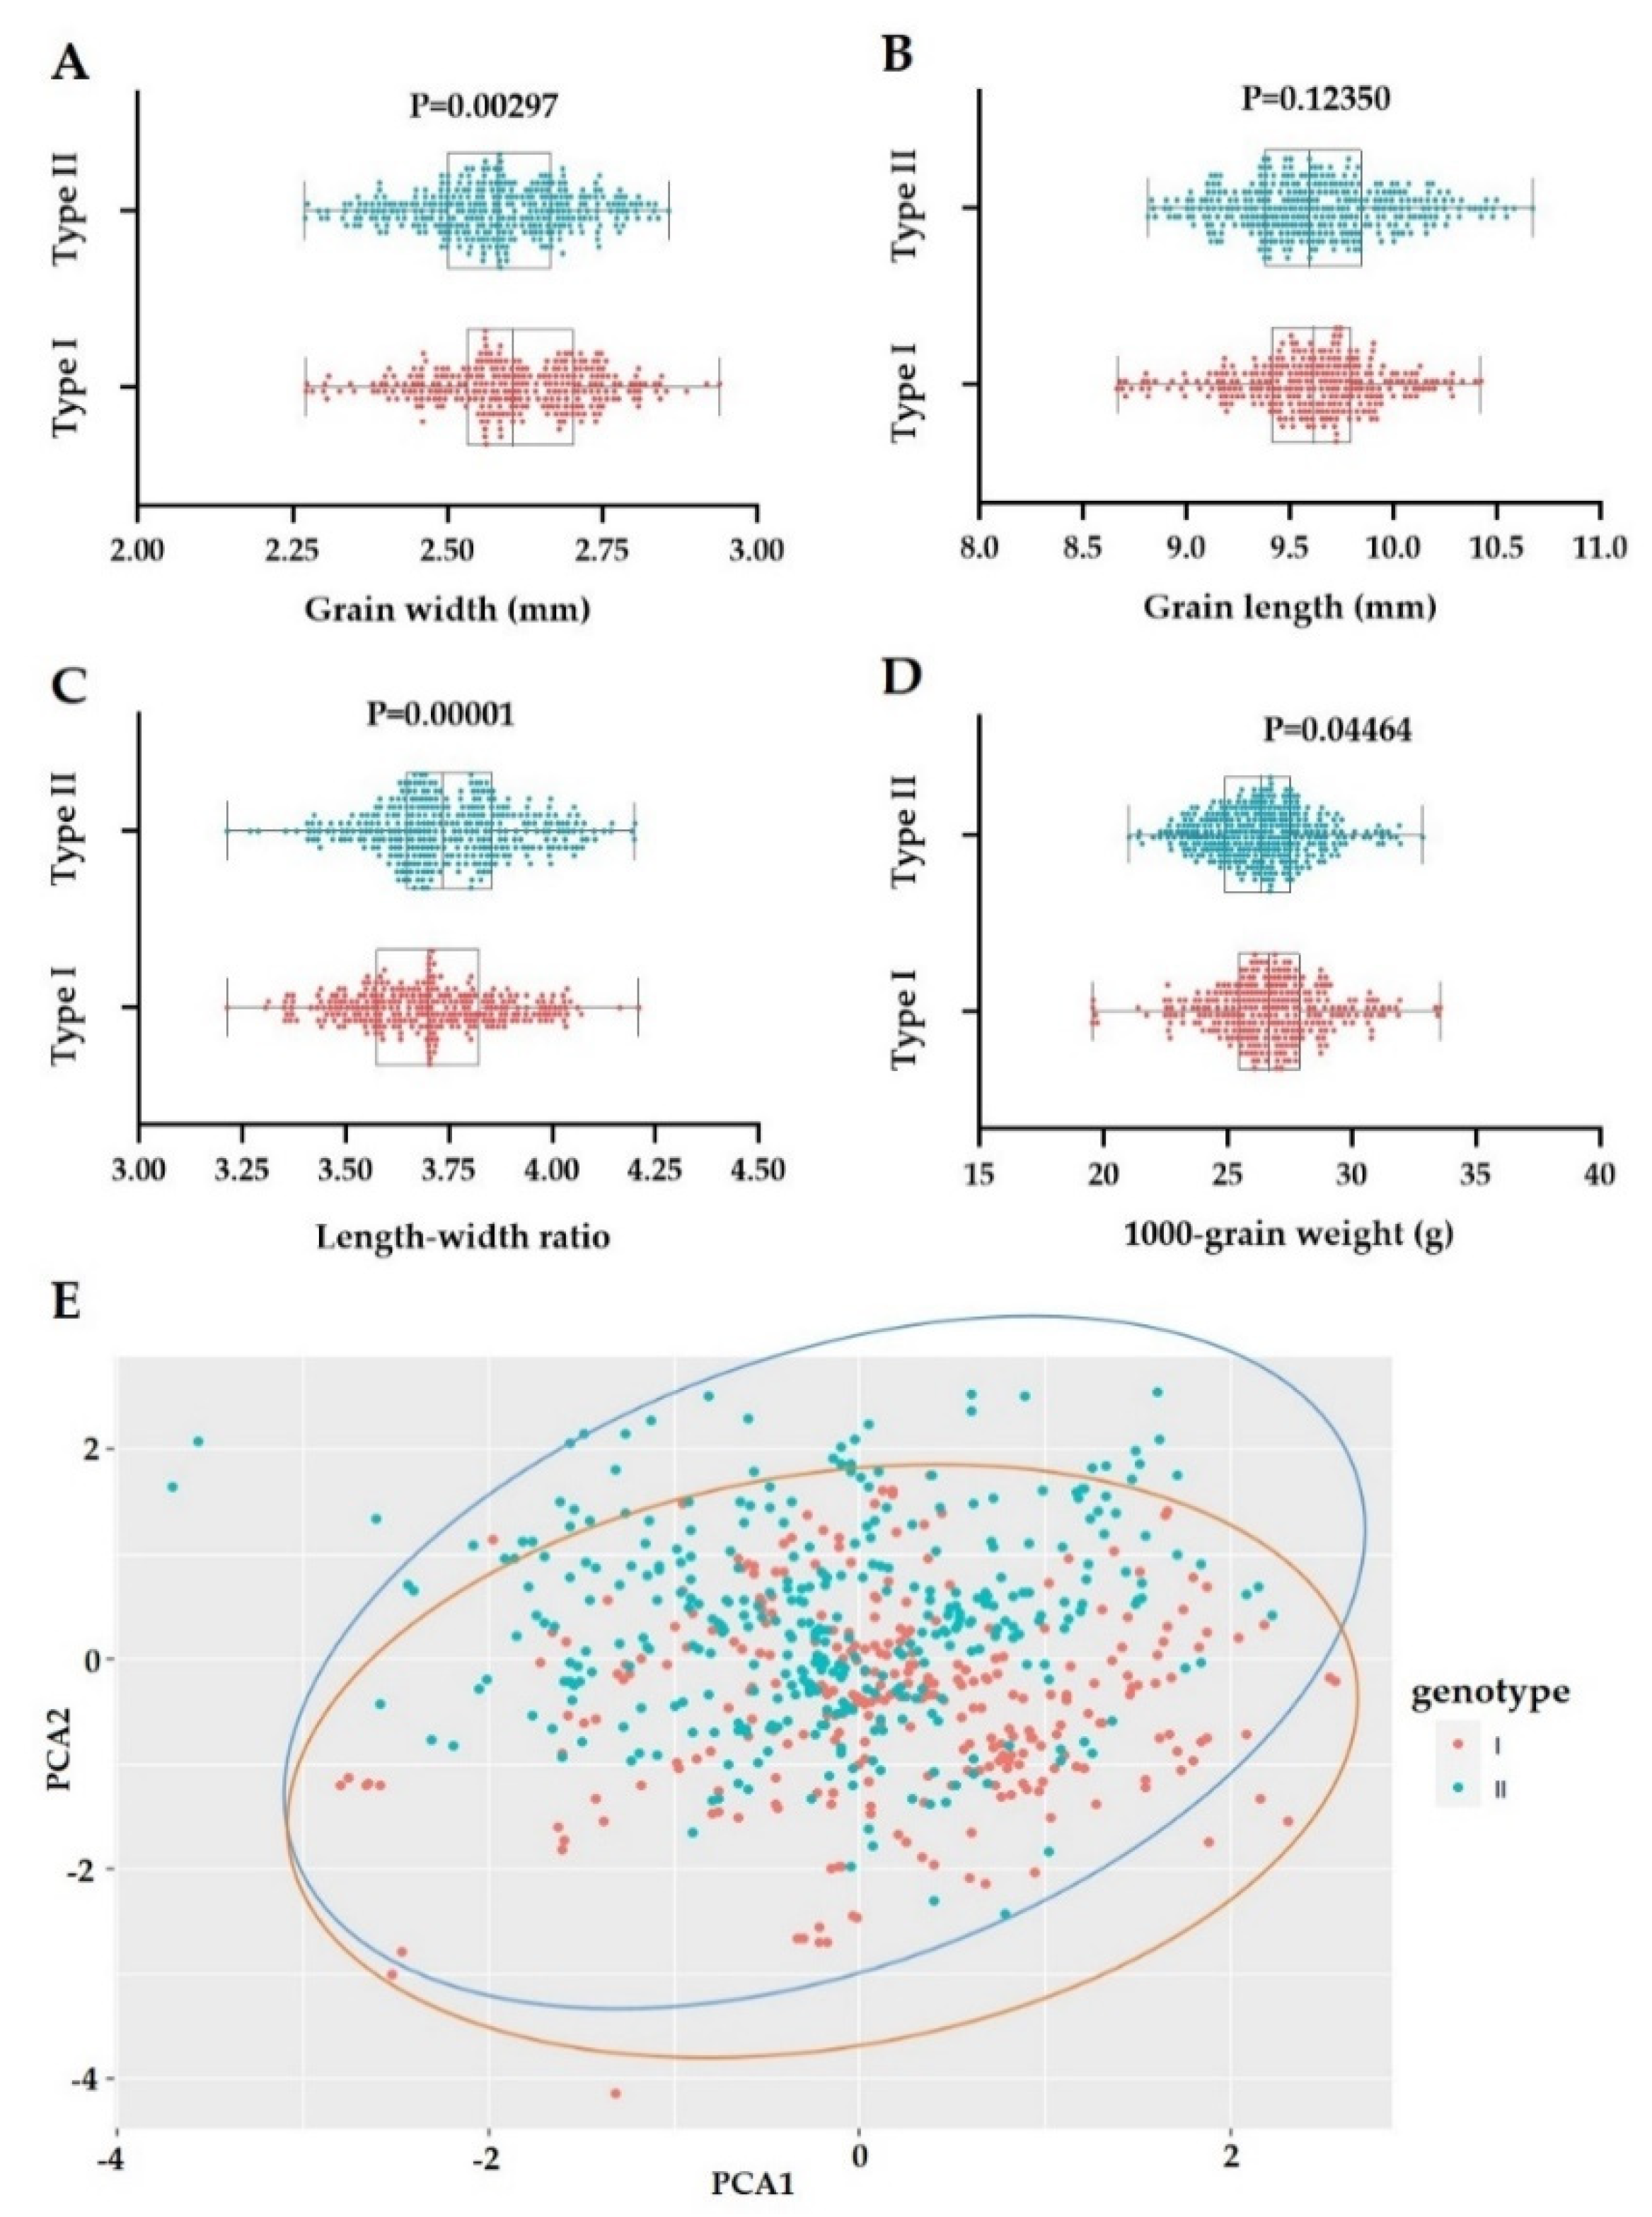
3.3. Verification of qLWR-12c/qGW-12

Since qLWR-12c and qGW-12 co-localized in the interval of Bin3241–Bin3273, forming a stable QTL cluster, we used it as the subject for subsequent research. A pair of lines with a similar genetic background, Q146 and Q147, was chosen to validate qLWR-12c/qGW-12 (Figure S3A). The allele of qLWR-12c/qGW-12 from the GW of Q147 increased by 1.90% while the LWR enhanced by 3.44% than Q146 (Figure S3B,C,E,F), indicating the role of qGW-12 for GW and LWR. These results were consistent with the result of the highest correlation between the LWR and GW in RISLs. Variance in grain length between Q146 and Q147 was observed, which was probably caused by qGL-2b and qGL-7a (Figure S3A,D).
Also, 291 Nei2B-type (Type I) and 348 R8006-type (Type II) individuals were screened from F10 progeny with marker 12–26, which is tightly linked with qLWR-12c/qGW-12. GW and LWR showed significant differences between Type I and Type II, while there was no significant difference in GL (Figure 3A–D). However, Type I and Type II could not be divided into two completely independent groups for all grain shape related traits (Figure 3E), indicating qLWR-12c/qGW-12 partially determined the grain shape, specifically, the grain width.

3.4. Fine Mapping of qLWR-12c/qGW-12 in RHLs

To further map qLWR-12c/qGW-12, we screened the F10 progeny of RISLs and identified an RHL line named 19HNPA1729, sharing the most identical genetic background except for qLWR-12c/qGW-12. Subsequently, the RHL 19HNPA1729 was selfed to develop a secondary F3 population. Genetic analyses of the secondary F3 population showed 5:3 segregation of low- and high-LWR individuals (5, 108: 3, 063; χ2 = 0.0347, p = 0.859), indicating that qLWR-12c/qGW-12 behaves as a single Mendelian factor. (Figure S4). In the F15 generation, Q42 and Q34 clustered together. Line 19HNPA1729 corresponded to Q42 of generation F15. Therefore, Q42, Q43, and pool-high mingling 30 individual plants with high LWR were selected for BSA.
We obtained 234,038,246, 107,415,386, and 122,679,378 clean reads from pool-high, Q42, and Q43, respectively (Table 3). The average sequencing depth of pool-high was 70.2×, and the average sequencing of Q42 and Q43 were 32.76× and 36.96×. Subsequently, we detected 2,286,492 SNPs and 234,979 InDels variants (Table S3). Finally, qLWR-12c/qGW-12 was mapped into a 431 Kb interval on the long arm of chromosome 12, in which 31 SNPs and 2 InDels were found varying in 17 candidate genes (Figure 4; Table 4).
SNP (G21857552-A) was within 1 Kb upstream of OsR498G1221877800 and OsR498G1221877900, so they were both considered as candidate genes for the SNP. Similarly, SNP (G26280090-A) exists within 1Kb upstream of OsR498G1222173400 and within 1 Kb downstream of OsR498G1222173600, SNP (G26446003-A) exists within 1 Kb upstream of OsR498G1222185500 and within 1 Kb downstream of OsR498G1222185300. Therefore, we obtained a total of 17 candidate genes, among which amino acid changes occurred in 5 candidates: OsR498G1222170400, OsR498G1222171900, OsR498G1222173400, and OsR498G1222185100 had non-synonymous substitutions, OsR498G1222170500 had a frameshifting insertion and non-synonymous substitutions.

4. Discussion

Compared with genetic maps constructed by traditional molecular markers, high-density genetic maps have the advantages of high throughput, and are time-saving and labor-saving, which provide effective means for the mining and identifying of QTLs for important agronomic traits. For instance, Zhu et al. used Guanghui 998 (R998) and Francis to construct recombinant inbred lines and detected 26 yield-related QTLs through the high-density genetic map with 3061 Bin makers [31]. Zhu et al. utilized a recombinant inbred line constructed with indica rice ‘Yuzhenxiang’ and japonica rice ‘02428′ to construct a high-density genetic map containing 2771 Bin markers to map 14 heading date QTLs [53]. In this study, 91 QTLs were detected using RISLs through a high-density genetic map consisting of 3203 Bin markers. With sufficient Bin markers, the reliability of our results is guaranteed. Compared with other mapping groups, RISLs showed advantages of greater time-saving and labor-saving without marker-assisted selection. As well as QTLs mapping, the RISLs are efficient in QTLs validating. As a supplement of RISLs, 1700 F11, 2780 F12, and 2464 F13 lines were collected as libraries for screening RHLs for fine mapping of target QTLs.
Previous studies have shown that the QTLs detected by the same mapping population under different environmental conditions are not necessarily the same [54]. This situation also appeared in our research. For instance, in the interval between Bin326 and Bin387 on chromosome 1, the QTL for grain length was detected in 15LS, the QTL for grain width was detected in 16FY, and the QTL for both grain length and grain width was detected at 15FY. There probably is a QTL cluster formed in the interval of markers Bin326 and Bin387.
Our study revealed that the grain shape in three-line hybrid Nei2You No.6 is controlled by medium/minor QTLs. In total, some of the 91 QTLs detected clustered in 15 loci in multiple environments. Compared with previous studies, 3 of 15 stable loci (qGL-7a, qGL-8, and qGL-11a) are novel, and the rest overlap with reported QTLs (Table 2), indicating the accuracy of our mapping results. For instance, we detected qGW-2b and qLWR-2c in the interval between 31.05 and 36.25 Mb on chromosome 2, which co-located with the major QTL TGW2 and qGW2 [5]. On chromosome 7, we detected qGW-7 in the interval of 18.85–20.25 Mb, in which GLW7 was cloned in previous research [12]. We detected qLWR-9a in the 7.75–18.35 Mb interval on chromosome 9, where GS9 was located and cloned [11]. In the present study, the qGW-12/qLWR-12c were repeatedly detected in the interval of Bin3241-Bin3273 across four environments, which overlapped the interval of mapped qTGW-12 for 1000-grain weight in the same RISLs in our previous study [36]. In addition, all 91 QTLs explain 2.17–11.93% of the phenotypic variation, indicating that the grain shape of Nei2You No.6 was coordinated by multiple medium and minor QTLs. Among the 17 candidate genes for qLWR-12c/qGW-12, there were five genes with exonic differences between two parents (Table 4). OsR498G1222170400 encodes a GNS1/SUR4 membrane family protein and its homolog in Arabidopsis, ELO4/HOS3, participates in the synthesis of very long chain fatty acids [55]. Containing a putative ankyrin repeat (ANK) domain, OsR498G1222171900 may be involved in protein-protein interaction and organism development [56]. OsR498G1222173400 encodes an α/β-hydrolase (ABH) with multiple functions in cell differentiation and development, which is the basic mechanism in the formation of grain size [57]. Encoding a reverse transcriptional transposon protein, OsR498G1222170500 harbors the DNase I-like domain, including magnesium-dependent endonuclease and phosphatase involving in intracellular signal transduction [58]. However, OsR498G1222185100 has no annotation information in Nipponbare or the R498 genome. Overall, although OsR498G1222171900 and OsR498G1222173400 are more likely the causal genes of qLWR-12c/qGW-12, we still can’t exclude the other genes. In the future, we will identify the candidate gene for qLWR-12c/qGW-12 through two strategies. Firstly, further fine mapping will be conducted to narrow the target interval of qLWR-12c/qGW-12 using the segregating heterozygous line. Secondly, the expression level of candidate genes will be measured between two parents utilizing Quantitative Real-time PCR.

5. Conclusions

In total, we identified 91 medium/minor-effect QTLs for grain shape in RISLs with a high-density genetic map. Among 15 clusters harboring 64 QTLs, qGL-7a, qGL-8, and qGL-11a were the three firstly reported loci associated with grain size in rice. For further mapping of the stable qLWR-12c/qGW-12, 17 candidate genes were preliminarily obtained by BSA. Bioinformatics analysis shows that one of OsR498G1222185100, OsR498G1222170400, OsR498G1222171900, OsR498G1222173400, and OsR498G1222170500 was probably responsible for qLWR-12c/qGW-12, providing a potential candidate gene for further cloning. In conclusion, the revealed genetic basis of grain shape in Nei2You No.6 and the genetically dissected qLWR-12c/qGW-12 will provide useful information for breeders in developing hybrid rice varieties.

Supplementary Materials

The following are available online at https://www.mdpi.com/article/10.3390/agronomy11040705/s1, Figure S1: The workflow of this study. Figure S2: Correlation analysis of grain shape associated traits. Figure S3: Validation of identified qLWR-12c/qGW-12 using a pair of RISL. Figure S4: Distribution of grain shape associated traits of 171 individuals in secondary F3. Table S1: Means of grain shape related traits for the parental lines and RISL population. Table S2: QTLs for grain shape identified in the RISL population in one environment. Table S3: Detection and annotation of SNPs and InDels.

Author Contributions

Conceptualization, Y.Z. (Yingxin Zhang) and S.C.; software, Y.Z. (Yingxin Zhang), M.Z., and Y.Z. (Yue Zhang); validation, P.X., M.Z. and Y.K.; formal analysis, Y.K., M.Z., and Y.Z. (Yingxin Zhang); investigation, Y.K. and P.X.; writing—original draft preparation, Y.K.; writing—review and editing, Y.Z. (Yingxin Zhang); supervision, Y.Z. (Yingxin Zhang), W.W., L.C., and X.Z. All authors have read and agreed to the published version of the manuscript.

Funding

This research was supported by the National Key Research and Development Program (2016YFD0101801), the Natural Science Foundation of Innovation Research Group (31961143016, 31521064), the Fundamental Research Funds of Central Public Welfare Research Institutions (2017RG001), and the Chinese Academy of Agricultural Sciences Innovation Project (CAAS-ASTIP-2013-CNRRI).

Institutional Review Board Statement

Not applicable.

Informed Consent Statement

Not applicable.

Data Availability Statement

Data sets analysed during the current study are available from the current author on reasonable request.

Acknowledgments

We thank Aaron Lorheed Chan for modifying the language of this article.

Conflicts of Interest

The authors declare no conflict of interest.

References

  1. Xia, D.; Zhou, H.; Qiu, L.; Jiang, H.; Zhang, Q.; Gao, G.; He, Y. Mapping and verification of grain shape QTLs based on an advanced backcross population in rice. PLoS ONE 2017, 12, e187553. [Google Scholar] [CrossRef]
  2. Fan, C.; Xing, Y.; Mao, H.; Lu, T.; Han, B.; Xu, C.; Li, X.; Zhang, Q. GS3, a major QTL for grain length and weight and minor QTL for grain width and thickness in rice, encodes a putative transmembrane protein. Theor. Appl. Genet. 2006, 112, 1164–1171. [Google Scholar] [CrossRef]
  3. Song, X.J.; Huang, W.; Shi, M.; Zhu, M.Z.; Lin, H.X. A QTL for rice grain width and weight encodes a previously unknown RING-type E3 ubiquitin ligase. Nat. Genet. 2007, 39, 623–630. [Google Scholar] [CrossRef]
  4. Liu, J.; Chen, J.; Zheng, X.; Wu, F.; Lin, Q.; Heng, Y.; Tian, P.; Cheng, Z.; Yu, X.; Zhou, K.; et al. GW5 acts in the brassinosteroid signalling pathway to regulate grain width and weight in rice. Nat. Plants 2017, 3, 17043. [Google Scholar] [CrossRef] [PubMed]
  5. Ruan, B.; Shang, L.; Zhang, B.; Hu, J.; Wang, Y.; Lin, H.; Zhang, A.; Liu, C.; Peng, Y.; Zhu, L.; et al. Natural variation in the promoter of TGW2 determines grain width and weight in rice. N. Phytol. 2020, 227, 629–640. [Google Scholar] [CrossRef]
  6. Zhang, X.; Wang, J.; Huang, J.; Lan, H.; Wang, C.; Yin, C.; Wu, Y.; Tang, H.; Qian, Q.; Li, J.; et al. Rare allele of OsPPKL1 associated with grain length causes extra-large grain and a significant yield increase in rice. Proc. Natl. Acad. Sci. USA 2012, 109, 21534–21539. [Google Scholar] [CrossRef] [PubMed] [Green Version]
  7. Ishimaru, K.; Hirotsu, N.; Madoka, Y.; Murakami, N.; Hara, N.; Onodera, H.; Kashiwagi, T.; Ujiie, K.; Shimizu, B.; Onishi, A.; et al. Loss of function of the IAA-glucose hydrolase gene TGW6 enhances rice grain weight and increases yield. Nat. Genet. 2013, 45, 707–711. [Google Scholar] [CrossRef]
  8. Hu, J.; Wang, Y.; Fang, Y.; Zeng, L.; Xu, J.; Yu, H.; Shi, Z.; Pan, J.; Zhang, D.; Kang, S.; et al. A Rare Allele of GS2 Enhances Grain Size and Grain Yield in Rice. Mol. Plant 2015, 8, 1455–1465. [Google Scholar] [CrossRef] [Green Version]
  9. Wang, S.; Wu, K.; Yuan, Q.; Liu, X.; Liu, Z.; Lin, X.; Zeng, R.; Zhu, H.; Dong, G.; Qian, Q.; et al. Control of grain size, shape and quality by OsSPL16 in rice. Nat. Genet. 2012, 44, 950–954. [Google Scholar] [CrossRef]
  10. Liu, Q.; Han, R.; Wu, K.; Zhang, J.; Ye, Y.; Wang, S.; Chen, J.; Pan, Y.; Li, Q.; Xu, X.; et al. G-protein βγ subunits determine grain size through interaction with MADS-domain transcription factors in rice. Nat. Commun. 2018, 9, 852. [Google Scholar] [CrossRef] [PubMed] [Green Version]
  11. Zhao, D.S.; Li, Q.F.; Zhang, C.Q.; Zhang, C.; Yang, Q.Q.; Pan, L.X.; Ren, X.Y.; Lu, J.; Gu, M.H.; Liu, Q.Q. GS9 acts as a transcriptional activator to regulate rice grain shape and appearance quality. Nat. Commun. 2018, 9, 1240. [Google Scholar] [CrossRef] [PubMed]
  12. Si, L.; Chen, J.; Huang, X.; Gong, H.; Luo, J.; Hou, Q.; Zhou, T.; Lu, T.; Zhu, J.; Shangguan, Y.; et al. OsSPL13 controls grain size in cultivated rice. Nat. Genet. 2016, 48, 447–456. [Google Scholar] [CrossRef] [PubMed]
  13. Wu, W.; Liu, X.; Wang, M.; Meyer, R.S.; Luo, X.; Ndjiondjop, M.N.; Tan, L.; Zhang, J.; Wu, J.; Cai, H.; et al. A single-nucleotide polymorphism causes smaller grain size and loss of seed shattering during African rice domestication. Nat. Plants 2017, 3, 17064. [Google Scholar] [CrossRef] [PubMed]
  14. Wang, A.; Hou, Q.; Si, L.; Huang, X.; Luo, J.; Lu, D.; Zhu, J.; Shangguan, Y.; Miao, J.; Xie, Y.; et al. The PLATZ Transcription Factor GL6 Affects Grain Length and Number in Rice. Plant Physiol. 2019, 180, 2077–2090. [Google Scholar] [CrossRef] [PubMed] [Green Version]
  15. Yu, J.; Xiong, H.; Zhu, X.; Zhang, H.; Li, H.; Miao, J.; Wang, W.; Tang, Z.; Zhang, Z.; Yao, G.; et al. OsLG3 contributing to rice grain length and yield was mined by Ho-LAMap. BMC Biol. 2017, 15, 28. [Google Scholar] [CrossRef] [Green Version]
  16. Li, Y.; Fan, C.; Xing, Y.; Jiang, Y.; Luo, L.; Sun, L.; Shao, D.; Xu, C.; Li, X.; Xiao, J.; et al. Natural variation in GS5 plays an important role in regulating grain size and yield in rice. Nat. Genet. 2011, 43, 1266–1269. [Google Scholar] [CrossRef]
  17. Shi, C.L.; Dong, N.Q.; Guo, T.; Ye, W.W.; Shan, J.X.; Lin, H.X. A quantitative trait locus GW6 controls rice grain size and yield through the gibberellin pathway. Plant J. 2020, 103, 1174–1188. [Google Scholar] [CrossRef]
  18. Wang, Y.; Xiong, G.; Hu, J.; Jiang, L.; Yu, H.; Xu, J.; Fang, Y.; Zeng, L.; Xu, E.; Xu, J.; et al. Copy number variation at the GL7 locus contributes to grain size diversity in rice. Nat. Genet. 2015, 47, 944–948. [Google Scholar] [CrossRef]
  19. Ying, J.Z.; Ma, M.; Bai, C.; Huang, X.H.; Liu, J.L.; Fan, Y.Y.; Song, X.J. TGW3, a Major QTL that Negatively Modulates Grain Length and Weight in Rice. Mol. Plant 2018, 11, 750–753. [Google Scholar] [CrossRef] [Green Version]
  20. Song, X.J.; Kuroha, T.; Ayano, M.; Furuta, T.; Nagai, K.; Komeda, N.; Segami, S.; Miura, K.; Ogawa, D.; Kamura, T.; et al. Rare allele of a previously unidentified histone H4 acetyltransferase enhances grain weight, yield, and plant biomass in rice. Proc. Natl. Acad. Sci. USA 2015, 112, 76–81. [Google Scholar] [CrossRef] [Green Version]
  21. Dong, N.Q.; Sun, Y.; Guo, T.; Shi, C.L.; Zhang, Y.M.; Kan, Y.; Xiang, Y.H.; Zhang, H.; Yang, Y.B.; Li, Y.C.; et al. UDP-glucosyltransferase regulates grain size and abiotic stress tolerance associated with metabolic flux redirection in rice. Nat. Commun. 2020, 11, 2629. [Google Scholar] [CrossRef]
  22. Li, N.; Xu, R.; Duan, P.; Li, Y. Control of grain size in rice. Plant Reprod. 2018, 31, 237–251. [Google Scholar] [CrossRef] [PubMed]
  23. Sun, J.; Peng, R.; Peng, J. Overview of Rice Quantitative Traits (QTL) Mapping Main Construction Population and Statistical Methods. Hunan Agric. Sci. 2016, 7, 120–123, (In Chinese with English Abstract). [Google Scholar]
  24. Hongge, L.I.; Zhaoe, P.; Shoupu, H.E.; Yinhua, J.; Xiaoli, G.; Baojun, C.; Liru, W.; Baoyin, P.; Xiongming, D.U. QTL mapping of agronomic and economic traits for four F2 populations of upland cotton. J. Cotton Res. 2021, 4, 3. [Google Scholar]
  25. Kabange, N.R.; Park, S.; Shin, D.; Lee, S.; Jo, S.; Kwon, Y.; Cha, J.; Song, Y.; Ko, J.; Lee, J. Identification of a Novel QTL for Chlorate Resistance in Rice (Oryza sativa L.). Agriculture 2020, 10, 360. [Google Scholar] [CrossRef]
  26. Yan, X.; Zheng, H.; Zhang, P.; Weldu, G.T.; Li, Z.; Liu, D. QTL mapping of adult plant resistance to stripe rust in the Fundulea 900× Thatcher RIL population. Czech J. Genet. Plant 2021, 57, 1–8. [Google Scholar] [CrossRef]
  27. Tang, G.P.; Cheng, X.R.; Zhu, C.L.; Peng, X.S.; He, X.P.; Fu, J.R.; Bian, J.M.; Hu, L.F.; Ouyang, L.J.; He, H.H. Identification Low Nitrogen Tolerance of XieqingzaoB//XieqingzaoB/Dongxiang wild Rice BC1F13 Populations and Some Restorers of Hybricl Rice. Acta Agric. Univ. Jiangxiensis 2017, 39, 214–222, (In Chinese with English Abstract). [Google Scholar]
  28. Zhang, H.; Zhu, Y.J.; Zhu, A.D.; Fan, Y.Y.; Huang, T.X.; Zhang, J.F.; Xie, H.A.; Zhuang, J.Y. Fine-mapping of qTGW2, a quantitative trait locus for grain weight in rice (Oryza sativa L.). PeerJ 2020, 8, e8679. [Google Scholar] [CrossRef] [PubMed] [Green Version]
  29. Zhang, C.; Yuan, Z.; Wang, Y.; Sun, W.; Tang, X.; Sun, Y.; Yu, S. Genetic Dissection of Seed Dormancy in Rice (Oryza sativa L.) by Using Two Mapping Populations Derived from Common Parents. Rice 2020, 13, 52. [Google Scholar] [CrossRef]
  30. Zhang, B.; Shang, L.; Ruan, B.; Zhang, A.; Yang, S.; Jiang, H.; Liu, C.; Hong, K.; Lin, H.; Gao, Z.; et al. Development of Three Sets of High-Throughput Genotyped Rice Chromosome Segment Substitution Lines and QTL Mapping for Eleven Traits. Rice 2019, 12, 33. [Google Scholar] [CrossRef]
  31. Zhu, M.; Liu, D.; Liu, W.; Li, D.; Liao, Y.; Li, J.; Fu, C.; Fu, F.; Huang, H.; Zeng, X.; et al. QTL mapping using an ultra-high-density SNP map reveals a major locus for grain yield in an elite rice restorer R998. Sci. Rep. 2017, 7, 10914. [Google Scholar] [CrossRef]
  32. Huang, X.; Feng, Q.; Qian, Q.; Zhao, Q.; Wang, L.; Wang, A.; Guan, J.; Fan, D.; Weng, Q.; Huang, T.; et al. High-throughput genotyping by whole-genome resequencing. Genome Res. 2009, 19, 1068–1076. [Google Scholar] [CrossRef] [Green Version]
  33. van Os, H.; Andrzejewski, S.; Bakker, E.; Barrena, I.; Bryan, G.J.; Caromel, B.; Ghareeb, B.; Isidore, E.; de Jong, W.; van Koert, P.; et al. Construction of a 10,000-marker ultradense genetic recombination map of potato: Providing a framework for accelerated gene isolation and a genomewide physical map. Genetics 2006, 173, 1075–1087. [Google Scholar] [CrossRef] [PubMed] [Green Version]
  34. Li, X.; Wu, L.; Wang, J.; Sun, J.; Xia, X.; Geng, X.; Wang, X.; Xu, Z.; Xu, Q. Genome sequencing of rice subspecies and genetic analysis of recombinant lines reveals regional yield-and quality-associated loci. BMC Biol. 2018, 16, 102. [Google Scholar] [CrossRef] [Green Version]
  35. Ashikari, M.; Sakakibara, H.; Lin, S.; Yamamoto, T.; Takashi, T.; Nishimura, A.; Angeles, E.R.; Qian, Q.; Kitano, H.; Matsuoka, M. Cytokinin oxidase regulates rice grain production. Science 2005, 309, 741–745. [Google Scholar] [CrossRef]
  36. Zhang, M.; Zhou, Z.; Chen, Y.; Cao, Y.; Deng, C.; Xue, P.; Zhan, X.; Cheng, S.; Cao, L.; Zhang, Y. Finding new addictive QTL for yield traits based on a high-density genetic map in hybrid rice. Plant Growth Regul. 2021, 93, 105–115. [Google Scholar] [CrossRef]
  37. Salunkhe, A.S.; Poornima, R.; Prince, K.S.; Kanagaraj, P.; Sheeba, J.A.; Amudha, K.; Suji, K.K.; Senthil, A.; Babu, R.C. Fine mapping QTL for drought resistance traits in rice (Oryza sativa L.) using bulk segregant analysis. Mol. Biotechnol. 2011, 49, 90–95. [Google Scholar] [CrossRef] [PubMed]
  38. Takagi, H.; Abe, A.; Yoshida, K.; Kosugi, S.; Natsume, S.; Mitsuoka, C.; Uemura, A.; Utsushi, H.; Tamiru, M.; Takuno, S.; et al. QTL-seq: Rapid mapping of quantitative trait loci in rice by whole genome resequencing of DNA from two bulked populations. Plant J. 2013, 74, 174–183. [Google Scholar] [CrossRef] [PubMed]
  39. Abe, A.; Takagi, H.; Fujibe, T.; Aya, K.; Kojima, M.; Sakakibara, H.; Uemura, A.; Matsuoka, M.; Terauchi, R. OsGA20ox1, a candidate gene for a major QTL controlling seedling vigor in rice. Theor. Appl. Genet. 2012, 125, 647–657. [Google Scholar] [CrossRef]
  40. Cheng, S.H.; Cao, L.Y.; Zhuang, J.Y.; Chen, S.G.; Zhan, X.D.; Fan, Y.Y.; Zhu, D.F.; Min, S.K. Super Hybrid Rice Breeding in China: Achievements and Prospects. J. Integr. Plant Biol. 2007, 49, 805–810. [Google Scholar] [CrossRef]
  41. Zhang, Q. Rice planting and pest control techniques. Mod. Agric. Res. 2020, 8, 139–140, (In Chinese with English Abstract). [Google Scholar]
  42. McCouch, S.R. Gene Nomenclature System for Rice. Rice 2008, 1, 72–84. [Google Scholar] [CrossRef] [Green Version]
  43. Rogers, S.O.; Bendich, A.J. Extraction of DNA from milligram amounts of fresh, herbarium and mummified plant tissues. Plant Mol. Biol. 1985, 5, 69–76. [Google Scholar] [CrossRef] [PubMed]
  44. Li, H.; Durbin, R. Fast and accurate short read alignment with Burrows–Wheeler transform. Bioinformatics 2009, 25, 1754–1760. [Google Scholar] [CrossRef] [Green Version]
  45. Cingolani, P.; Platts, A.; Wang, L.L.; Coon, M.; Nguyen, T.; Wang, L.; Land, S.J.; Lu, X.; Ruden, D.M. A program for annotating and predicting the effects of single nucleotide polymorphisms, SnpEff: SNPs in the genome of Drosophila melanogaster strain w1118; iso-2; iso-3. Fly 2012, 6, 80–92. [Google Scholar] [CrossRef] [PubMed] [Green Version]
  46. Fang, N.; Xu, R.; Huang, L.; Zhang, B.; Duan, P.; Li, N.; Luo, Y.; Li, Y. SMALL GRAIN 11 Controls Grain Size, Grain Number and Grain Yield in Rice. Rice 2016, 9, 64. [Google Scholar] [CrossRef] [Green Version]
  47. Wan, X.Y.; Wan, J.M.; Weng, J.F.; Jiang, L.; Bi, J.C.; Wang, C.M.; Zhai, H.Q. Stability of QTLs for rice grain dimension and endosperm chalkiness characteristics across eight environments. Theor. Appl. Genet. 2005, 110, 1334–1346. [Google Scholar] [CrossRef]
  48. Li, Z.F.; Wan, J.M.; Xia, J.F.; Zhai, H.Q. Mapping quantitative trait loci underlying appearance quality of rice grains (Oryza sativa L.). J. Genet. Genom. 2003, 30, 251–259. [Google Scholar]
  49. Xue, P.; Zhang, Y.; Lou, X.; Zhu, A.; Chen, Y.; Sun, B.; Yu, P.; Cheng, S.; Cao, L.; Zhan, X. Mapping and genetic validation of a grain size QTL qGS7.1 in rice (Oryza sativa L.). J. Integr. Agr. 2019, 18, 1838–1850. [Google Scholar] [CrossRef]
  50. Li, J.; Xiao, J.; Grandillo, S.; Jiang, L.; Wan, Y.; Deng, Q.; Yuan, L.; McCouch, S.R. QTL detection for rice grain quality traits using an interspecific backcross population derived from cultivated Asian (O. sativa L.) and African (O. glaberrima S.) rice. Genome 2004, 47, 697–704. [Google Scholar] [CrossRef]
  51. Li, X.; Wei, Y.; Li, J.; Yang, F.; Chen, Y.; Chen, Y.; Guo, S.; Sha, A. Identification of QTL TGW12 responsible for grain weight in rice based on recombinant inbred line population crossed by wild rice (Oryza minuta) introgression line K1561 and indica rice G1025. BMC Genet. 2020, 21, 10. [Google Scholar] [CrossRef] [Green Version]
  52. Qi, L.; Ding, Y.; Zheng, X.; Xu, R.; Zhang, L.; Wang, Y.; Wang, X.; Zhang, L.; Cheng, Y.; Qiao, W.; et al. Fine mapping and identification of a novel locus qGL12.2 control grain length in wild rice (Oryza rufipogon Griff.). Theor. Appl. Genet. 2018, 131, 1497–1508. [Google Scholar] [CrossRef]
  53. Ni, X.; Xia, Q.; Zhang, H.; Cheng, S.; Li, H.; Fan, G.; Guo, T.; Huang, P.; Xiang, H.; Chen, Q.; et al. Updated foxtail millet genome assembly and gene mapping of nine key agronomic traits by resequencing a RIL population. Gigascience 2017, 6, 1–8. [Google Scholar] [CrossRef]
  54. Sun, B.; Zhan, X.; Lin, Z.; Gao, Z.; Yu, P.; Liu, Q.; Shen, X.; Zhang, Y.; Chen, D.; Cheng, S.; et al. Correlation Analysis and QTL Mapping of Grain Shape and Grain Weight in Rice. Mol. Plant Breed. 2015, 13, 2663–2672. [Google Scholar]
  55. Quist, T.M.; Sokolchik, I.; Shi, H.; Joly, R.J.; Bressan, R.A.; Maggio, A.; Narsimhan, M.; Li, X. HOS3, an ELO-like gene, inhibits effects of ABA and implicates a S-1-P/ceramide control system for abiotic stress responses in Arabidopsis thaliana. Mol. Plant 2009, 2, 138–151. [Google Scholar] [CrossRef] [Green Version]
  56. Yang, Y.; Zhang, Y.; Ding, P.; Johnson, K.; Li, X.; Zhang, Y. The ankyrin-repeat transmembrane protein BDA1 functions downstream of the receptor-like protein SNC2 to regulate plant immunity. Plant Physiol. 2012, 159, 1857–1865. [Google Scholar] [CrossRef] [Green Version]
  57. Nardini, M.; Dijkstra, B.W. Alpha/beta hydrolase fold enzymes: The family keeps growing. Curr. Opin. Struct. Biol. 1999, 9, 732–737. [Google Scholar] [CrossRef]
  58. Dlakić, M. Functionally unrelated signalling proteins contain a fold similar to Mg2+-dependent endonucleases. Trends Biochem. Sci. 2000, 25, 272–273. [Google Scholar] [CrossRef]
Figure 1. The distribution of grain shape related traits in RISLs in four environments. The hollow arrow represents Nei2B, and the solid arrow represents R8006. GL, grain length. GW, grain length. LWR, length-width ratio.
Agronomy 11 00705 g001
Figure 2. The positions of detected QTLs for grain shape traits in RISLs.
Agronomy 11 00705 g002
Figure 3. Validation of qLWR-12c/qGW-12 by comparing groups genotyping by 12–26 in F10 progeny. (AD) Denote compare of two groups for grain width, grain length, length-width ratio, and 1000-grain weight, respectively. (E) Clustering analysis for all grain shape related traits in two groups with the opposite allele of qLWR-12c/qGW-12. Type I and Type II mean Nei2B-type and R8006-type at 12–26, respectively.
Agronomy 11 00705 g003
Figure 4. Candidate region of qLWR-12c/qGW-12. (A) Mixed pool sequencing depth. (B) Q42 sequencing depth. (C) Q43 sequencing depth. (D) Distribution of progeny all-index on chromosome 12.
Agronomy 11 00705 g004
Table 1. Twenty QTLs for grain shape identified in the RISL population across two or more environments.
QTLsChr.Physical (Mb) aEnv. bPeak BinLOD cPVE(%) dAdd e
qGL-1b134.45–37.2515LSBin3362.662.5−0.04
16FYBin3375.935−0.08
qGL-2b24.95–6.5515FYBin4742.622.76−0.07
16LSBin4724.444.13−0.84
16FYBin4712.983.51−0.07
qGL-2d226.05–28.8516FYBin6055.214.590.08
15FYBin6062.732.560.06
qGL-5526.25–28.9516FYBin154710.679.89−0.11
15LSBin15485.665.57−0.06
15FYBin15536.46.32−0.09
16LSB155310.4810.04−1.23
qGL-7a71.55–2.0515FYBin19042.642.550.06
15LSBin19043.223.210.05
qGL-7b719.95–23.6515LSBin20543.33.320.05
15FYBin20553.523.430.07
16LSBin20554.824.280.07
16FYBin20594.694.330.8
qGL-8822.70–22.0515FYBin23184.093.980.08
16LSBin23183.363.010.68
qGL-10b1020.55–23.3516FYBin27565.264.660.08
16LSBin27562.532.550.6
qGL-11a110.15–1.8515FYBin27912.72.540.06
16FYBin28063.072.60.06
qGW-1a10.05–4.2515FYBin74.674.20.03
16FYBin124.914.740.03
15LSBin202.992.980.02
16LSBin265.544.710.29
qGW-1c134.25–40.6515FYBin3373.32.83−0.02
16FYBin3372.742.53−0.02
qGW-2b232.25–36.2516FYBin6634.34.15−0.02
15FYBin6644.744.26−0.03
15LSBin6664.584.6−0.02
16LSBin6667.596.58−0.33
qGW-7718.85–20.2516LSBin20303.973.260.24
16FYBin20333.813.650.02
qGW-121223.55–25.8515FYBin32544.574.080.003
16LSBin325413.5211.930.045
16FYBin32563.823.680.002
15LSBin32703.73.690.002
qLWR-1a10.05–1.0516LSBin35.114.61−0.043
16FYBin42.652.38−0.029
15FYBin82.962.95−0.034
qLWR-1b11.45–4.2515LSBin285.515.45−0.033
16FYBin316.286.46−0.033
qLWR-2b21.35–3.1516LSBin4435.675.14−0.044
16FYBin4412.652.38−0.026
qLWR-2c231.05–34.7515FYBin6523.253.060.033
16FYBin525.495.190.038
16LSBin6656.135.560.044
qLWR-9a97.75–18.3516FYBin25213.83.54−0.033
16LSBin25203.453.070.034
qLWR-12c1223.15–26.5516LSBin32508.888.21−0.054
15LSBin32515.45.37−0.033
15FYBin32524.344.13−0.038
16FYBin32535.335.04−0.038
“a” denotes physical positions based on R498. “b” environment. “c” average correlation threshold of QTL. “d” phenotypic variation explained. “e” additive effect.
Table 3. Statistical results of sequence alignment.
SamplePool-HighQ42Q43
Clean reads234,038,246107,415,386122,679,378
Clean bases (bp)35,105,736,90016,112,307,90018,401,906,700
Mapped reads232,122,373106,376,621121,604,676
Mapped bases (bp)34,818,355,95015,956,493,15018,240,701,400
Mapping rate99.18%99.03%99.12%
Duplicate reads44,313,21019,409,66323,628,250
Duplicate rate19.09%18.25%19.43%
Mismatch bases (bp)242,427,045128,415,115132,032,810
Mismatch rate0.70%0.80%0.72%
Average sequencing depth70.232.7636.95
Coverage97.24%96.07%95.91%
Coverage at least 4X95.89%93.51%93.46%
Coverage at least 10X93.57%89.62%89.75%
Coverage at least 20X90.31%82.45%83.98%
Coverage at least 50X78.44%6.35%10.69%
Table 4. Candidate genes for qLWR-12c/qGW-12 obtained in bulk segregant analysis.
R498 IDGenebankTypeRef.Q42Q43Function
OsR498G1221877800LOC4352512upstreamGGARNA pseudouridine synthase 1-like
OsR498G1221877900ABA98931upstream---expressed protein
OsR498G1222155700LOC43528623′UTRTTCras-related protein RABF2a
OsR498G1222156200ABA99931upstreamC/TC/TA/Czinc finger family protein, putative, expressed
5′UTRAAG
OsR498G1222164100ABA999475′UTRAAGexpressed protein
OsR498G1222165500ABA99953upstreamT/TAAT/TAAC/TF-box domain containing protein
OsR498G1222170400LOC4352887upstreamATA/elongation of fatty acids protein 3-like
NMAGA
OsR498G1222170500ABA99966upstreamT/T/C/T/T/A/A/T/TC/C/T/C/C/G/G/C/CT/T/C/T/T/A/A/T/Tretrotransposon protein, putative, LINE subclass
NMC/TC/CT/T
FSAATCGTTTCTA
OsR498G1222171700LOC4352888upstreamC/CC/CT/TE3 ubiquitin-protein ligase RNF5
5′UTRC/CC/CA/G
OsR498G1222171900LOC4352889NMTTCankyrin-2
OsR498G1222173600LOC9267278downstream---expressed protein
OsR498G1222173400LOC4352891upstreamGGAepoxide hydrolase A
NMCCT
OsR498G1222177200LOC4352903upstreamCTCexpressed protein
OsR498G1222178200LOC43529055′UTRTCTprotein NRT1/ PTR FAMILY 2.11
OsR498G1222185100-NMTTC
OsR498G1222185500LOC4352920upstreamGGAvesicle-associated membrane protein 721
OsR498G1222185300LOC4352919downstream---beta-glucuronosyltransferase GlcAT14A
Upstream: upstream region of gene (within 1 Kb). Downstream: downstream region of gene (within 1 Kb). NM: nonsynonymous mutation. FS: frameshift substitution.
Publisher’s Note: MDPI stays neutral with regard to jurisdictional claims in published maps and institutional affiliations.

