Article

Evaluation of Maize Growth Following Early Season Foliar P Supply of Various Fertilizer Formulations and in Relation to Nutritional Status

by
Bruno Maximilian Görlach
*,
Jon Niklas Henningsen
,
Jens Torsten Mackens
and
Karl Hermann Mühling
Institute of Plant Nutrition and Soil Science, Kiel University; Hermann-Rodewald-Straße 2, 24118 Kiel, Germany
*
Author to whom correspondence should be addressed.
Agronomy 2021, 11(4), 727; https://doi.org/10.3390/agronomy11040727
Submission received: 4 March 2021 / Revised: 7 April 2021 / Accepted: 7 April 2021 / Published: 9 April 2021

Abstract

:
The efficiency of phosphorus (P) use in agriculture needs to be improved, with farmers being increasingly forced by law to reduce P soil fertilization. Thus, P foliar application might become more important in agriculture. The effect of foliar P fertilization has not been widely studied in maize, despite it being a crop with high P demand during juvenile development. Our aim was to investigate the effect of P foliar application during juvenile development on maize crop growth and yield. We conducted outdoor pot experiments to investigate the effect on P uptake, translocation, and dry matter following three applications of foliar fertilizer of various P formulations and with additional P soil fertilization between the 4th and 6th leaf stage during two growing seasons. To determine direct and possible long-term effects, plants were harvested at various developmental stages. P foliar application resulted in a significant increase in P concentration in all plant parts ten days after the last application, regardless of P form, nutritional status, or year. P concentration remained high only in those parts of the plant that were present during foliar application. Biomass effects were sporadically visible until flowering, but not at maturity. We conclude that foliar P fertilization during juvenile development does not increase yield but might nevertheless be a useful remedy for short-term P deficits.

1. Introduction

Phosphorus (P) is an essential and indispensable macronutrient for plant growth and is the second most frequent limiting macronutrient after nitrogen [1]. The nutrient is of prime importance as a structural component in nucleic acids, phospholipids, coenzymes, and phosphoproteins [2] and as an energy carrier in the form of adenosine diphosphate (ADP) or triphosphate (ATP) [3] and also plays a role in photosynthesis and respiration [4]. Thus, in the absence of an adequate P supply, plants show a range of P deficiency symptoms such as decreased plant height [2], reductions in tillering [5], restricted seed formation [6], reduced leaf area [7,8], and premature senescence of leaves [9]. However, plant uptake precedes biomass development, and so early season P-nutrition is crucial for the life cycle and growth of shoot and root [10]. Indeed, a persistent P deficiency during juvenile development cannot be subsequently recovered in the form of a late-season supply [2].
One of the arable crops with a close relationship to P is maize (Zea mays L.). Maize is the second-largest arable crop both worldwide [11] and in Germany [12]. In Central and Northern Europe, maize is sown in the springtime (April/May). Low temperatures are a major yield-limiting factor. In April, in particular, the air and soil temperatures are at a minimum for optimal growth conditions. Maize growth is slow at temperatures lower than 15 °C because the seedlings lose the ability to establish dry matter during the development of the root, which is weak under these conditions [13]. Moreover; nutrient acquisition is particularly limited by low temperatures since, under low soil temperatures, the solubility of nutrients and the speed of diffusion decrease [14]. Consequently, the availability of P, which is delivered by diffusion [1], is significantly reduced. Low soil temperatures cause two problems: (I) poor development of the root area [13,15] and (II) reduced availability of soil P to the plant [2,16]. In addition, the low availability of P ions in bulk soils (large reactivity relative to numerous soil constituents [17]) and a concentration below 10 µM in the soil solution limits plant uptake of P [1,18]. Since the diffusion rate of P is low, root uptake generates a rhizosphere that is depleted of P [1]. In consequence, P is one of the least available and most inaccessible macronutrients in soil [19]. Therefore, maize plants require the application of starter P at sowing to provide essential P for early growth [2]. The practical method of supplying P to provide sufficient water-soluble P in the root area and to increase P fertilizer efficiency is usually by banding the fertilizer near to or with the seed during sowing [2,20]. This method ensures P nutrition during juvenile development.
According to Hart et al. [21], the use of (mineral) fertilizer has massively increased over the last century. Furthermore, agricultural systems have changed from being a net sink of P to a net source of P, which increases the problem of diffuse P losses [22]. In order to protect the environment and maintain its ecological and chemical status, the European Union has adopted various directives (EU Nitrates Directive, EU Water Framework Directive) that have led to Fertilizer Ordinances being drawn up at the level of the individual states in the EU. The Fertilizer Ordinance regulates good professional practice with regard to the application of fertilizers on agricultural land and is intended to increase the efficiency of fertilizer use [23]. Thus, in the future, farmers will be increasingly forced by law to reduce P fertilization of the soil. Foliar application has become an increasingly important tool for sustainable and productive crop management [24] and is used worldwide. In addition, this method can be employed at times of high nutrient demand. The application of nutrients such as P by this technique might therefore lead to an increase in the efficiency of fertilizer use [10,25].
In the literature, many factors are mentioned that have an influence on the absorption and translocation of leaf fertilizers: (1) the physical and chemical properties of the sprayed nutrient solution (e.g., molecule size, solubility, surface tension); (2) environmental factors (e.g., relative humidity, temperature, radiation); (3) plant species and physiology of the plant (e.g., architecture of the cuticle, wax layer, mobility of the nutrient in the plant) [24,26,27]. However, the effectiveness depends not only on the uptake of nutrients into the leaf, but also on the subsequent transfer of nutrients to other parts of the plant, such as young leaves, grains, or fruits. Hence, nutrients with high phloem mobility are theoretically more likely to generate systemic effects in contrast to immobile elements [24]. The uptake of various forms of foliar P have previously been shown for some crops, especially for winter wheat [28,29,30,31]. Nevertheless, most of the research on foliar P fertilization has been conducted on winter wheat in the U.S. and Australia. According to Noack et al. [10], foliar fertilization is the most effective and efficient method for late-season P supply. We, therefore, wished to study the effect of P foliar application during juvenile development in maize and to determine whether this would lead to a more efficient design of P fertilization in maize. The effects of three P foliar applications were studied with regard to (1) the concentration and translocation of P within the plant, (2) biomass development, and (3) yield during a specific time course. These aspects were investigated as a function of two P foliar fertilizer forms and the nutritional status of the maize plants.

2. Materials and Methods

The experimental designs were completely randomized and were carried out in the outdoor area of the Experimental Station of the Institute of Plant Nutrition and Soil Science, Kiel University, Kiel, Germany (54°20′50′′ N, 10°6′55′′ E). Basic fertilization was mixed into the soil by using a (concrete) mixer. One gram N (as NH4NO3), 1.2 g K (as K2SO4), 1.2 g K (as KCl), 0.5 g Ca (as CaSO4), and 0.33 g Mg (as MgSO4) were applied to each pot (Mitscherlischpot, 6.2 L). To eliminate nutrient deficiencies other than P, additional nutrient solutions were surface-applied at 30 days after sowing (DAS) at levels (in g pot−1) of: 0.015 Fe (as Fe-EDTA), 0.010 Cu (as CuSO4), 0.015 Zn (as ZnSO4), 0.030 Mn (as MnSO4), 0.010 B (as H3BO3), and 0.002 Mo (as (NH4)6Mo7O24); at 43 DAS: 1 K (as KSO4) and 0.5 N (as NH4NO3); at 57 DAS: 1 K (as KSO4) and 0.5 N (as NH4NO3); at 71 DAS: 1 K (as KSO4), 0.5 N (as NH4NO3), 0.1 Ca (as CaSO4), and 0.1 Mg (as MgSO4). Two maize seeds (Zea mays L. var. Keops, KWS SAAT SE & Co. KGaA, Einbeck, Germany) were sown per pot at a depth of 3.5 cm. Five days after germination, the plants in the pots were separated into one plant per pot. Under natural weather conditions, plants were watered only if necessary. Excess rainwater was collected and returned. In anticipation of heavy rainfall, plants were moved to a rainout shelter. At times of high water demand, containers were placed in large buckets with a continuous water supply.
P foliar fertilizer was applied early in the morning (5.30–6 a.m.) to avoid leaf burn by high irradiation and to take advantage of the higher air humidity. Maize plants were sprayed from above by using an in-house spraying technology with three double flat fan nozzles (Air Injektor Kompakt-Doppelflachstrahldüsen IDKT 120, Lechler, Metzingen, Germany). The overlapping of leaves was avoided by the pots being aligned with appropriate spacing. To improve the wetting of the plants, 0.1% of the wetting agent Silwet® Gold (Spiess-Urania, Ochsenfurt, Germany) was added to the sprayed fluid. Contamination of the soil was prevented by covering the pots with aluminum foil and wrapping the stems with paper. The applied concentration was equivalent to 1.24 kg phosphorus ha−1 in a total volume of 200 L ha−1.

2.1. Experiment 1

Experiment 1 was conducted from May to October 2019 to investigate the uptake and influence of two different P foliar fertilizer formulations on growth, P concentration, and grain formation. Mitscherlich pots were filled with 6 kg air-dried and sieved soil (<4 mm). The soil substrate was an arable (with organic fertilization) loamy sand from the district of Plön (Schleswig-Holstein) with 79.3% sand, 13.3% silt, and 7.4% clay. Further details are summarized in Table 1. Three treatments were cultivated in five biological replicates: a control treatment (control) without foliar P application and two treatments with different foliar P fertilizers (KH2PO4, H3PO4). Foliar fertilizers were applied on 40, 46, and 53 DAS. The concentration of the fertilizer solution was 200 mM, and the pH was 4.5. For H3PO4, the pH had to be raised to 4.5 using NaOH, as otherwise, severe leaf burn would have occurred. To illustrate possible effects of P foliar application over time, maize plants were harvested at three dates, namely ten days after the last P application (BBCH 16), at flowering (BBCH 65), and at maturity (BBCH 89). This includes three crucial developmental stages of maize. The developmental stages of maize consisted of germination (BBCH 00–09), leaf development (BBCH 10–19); stem elongation (BBCH 30–39); inflorescence emergence, heading (BBCH 51–59); flowering, anthesis (BBCH 61–69); development of fruit (BBCH 71–79); ripening (BBCH 83–89); and senescence (BBCH 97–99) [32]. The total P concentration was studied in various parts of the plants for better evaluation.

2.2. Experiment 2

The second experiment was set up in the subsequent growing season from May to October 2020 in order to investigate whether soil fertilization with P had an influence on the effect of foliar-applied P. Mitscherlich pots were filled with 6 kg air-dried and sieved soil (<4 mm). The soil substrate was an arable loamy sand from the district of Ost-Holstein (Schleswig-Holstein) with 71.8% sand, 19.9% silt, and 8.3% clay. Further details are summarized in Table 1. The experiment comprised four treatments with five biological replicates: two control treatments with 200 and 300 mg KH2PO4 soil fertilization, respectively, and two treatments with additional foliar application. KH2PO4 was used as foliar fertilizer and was applied on 35, 42, and 49 DAS. The P concentration was 200 mM, and the pH was 4.5. Aboveground plant material was harvested ten days after the last P application (BBCH 16) and at maturity (BBCH 89) and was then separated into groups containing the various parts of the plants for better evaluation.

2.3. Plant Sampling and Analysis

Plants were cut aboveground. Afterward, the plant material was divided into those parts to be examined. All plant parts were washed three times in deionized water to avoid fertilizer residues remaining on the leaves. Oven-dried plants (65 °C) were weighed and then milled to a fine powder for further analysis (Cyclotec 1093, Foss Tecator, Höganäs, Sweden). For mineral nutrient analyses, 200 mg of finely ground plant material was digested with 10 mL of 69% HNO3 (ROTIPURAN Supra for ICP, 69%) for 45 min in an 1800 W microwave oven (MARS 6, Xpress, CEM, Matthews, MC, USA) and subsequently measured using inductively coupled plasma-mass spectrometry (ICP-MS; Agilent Technologies 7700 Series, Böblingen, Germany) according to the method described by Jezek et al. [33]. For starch analysis, the milled grain material was additionally ground with a ball mill (Schwingmühle MM 400, Retsch GmbH, Haan, Germany). Starch concentration and content were determined by enzymatic hydrolysis of starch to glucose as described by Brandt et al. [34].

2.4. Statistical Analysis

Data were statistically analyzed using SPSS software (version 17.0). Analysis was based on five biological replicates per treatment. Effects of treatments were tested using Student’s t-test in cases of two experimental groups or one-way ANOVA and following Duncan’s Multiple Range test at α ≤ 5%.

3. Results

3.1. Development of Biomass, P Concentration, and P Content Over Time

During the entire growth period, predominantly no significant difference was seen in the dry matter (DM) of the total plant. However, at flowering, plants with additional KH2PO4 foliar P application showed significantly higher dry matter than those receiving the control treatment, whereas those treated by foliar fertilization with H3PO4 were not significantly different from either treatment (Figure 1A). Mean dry matter values were 117.2 g pot−1 for the control, 130.0 g pot−1 for foliar application with KH2PO4, and 122.2 g pot−1 for foliar application with H3PO4. By the time that the plants had fully ripened, no significant difference could be determined in the dry matter of the plants (Figure 1A).
In contrast, significant differences in P concentrations were evident ten days after foliar application, but these diminished during the further progress of the growing season (Figure 1B). At 3.8 mg P g−1 DM, plants that had received an H3PO4 foliar application exhibited a significant increase of 44% compared with the control treatment. The P concentration of the plants that were foliar-fertilized with KH2PO4 (3.3 mg P g−1 DM) was at a lower level than those with foliar-applied H3PO4 but was significantly higher than those under the control treatment (2.6 mg P g−1 DM). At flowering, the P concentration was in a range of 1.8 mg P g−1 DM, and only the treatment with foliar-applied H3PO4 resulted in a significant increase in comparison with the control treatment. The lowest P concentrations (all showing no significant differences) were measured in plants at the third harvest. However, for P content, the values for the treatments with additional foliar applications were 25% higher than those from the control treatment with significant difference until flowering (Figure 1C).

3.2. P Concentration in Various Parts of Plants at 6 Leaf Stage, Flowering, and Maturity

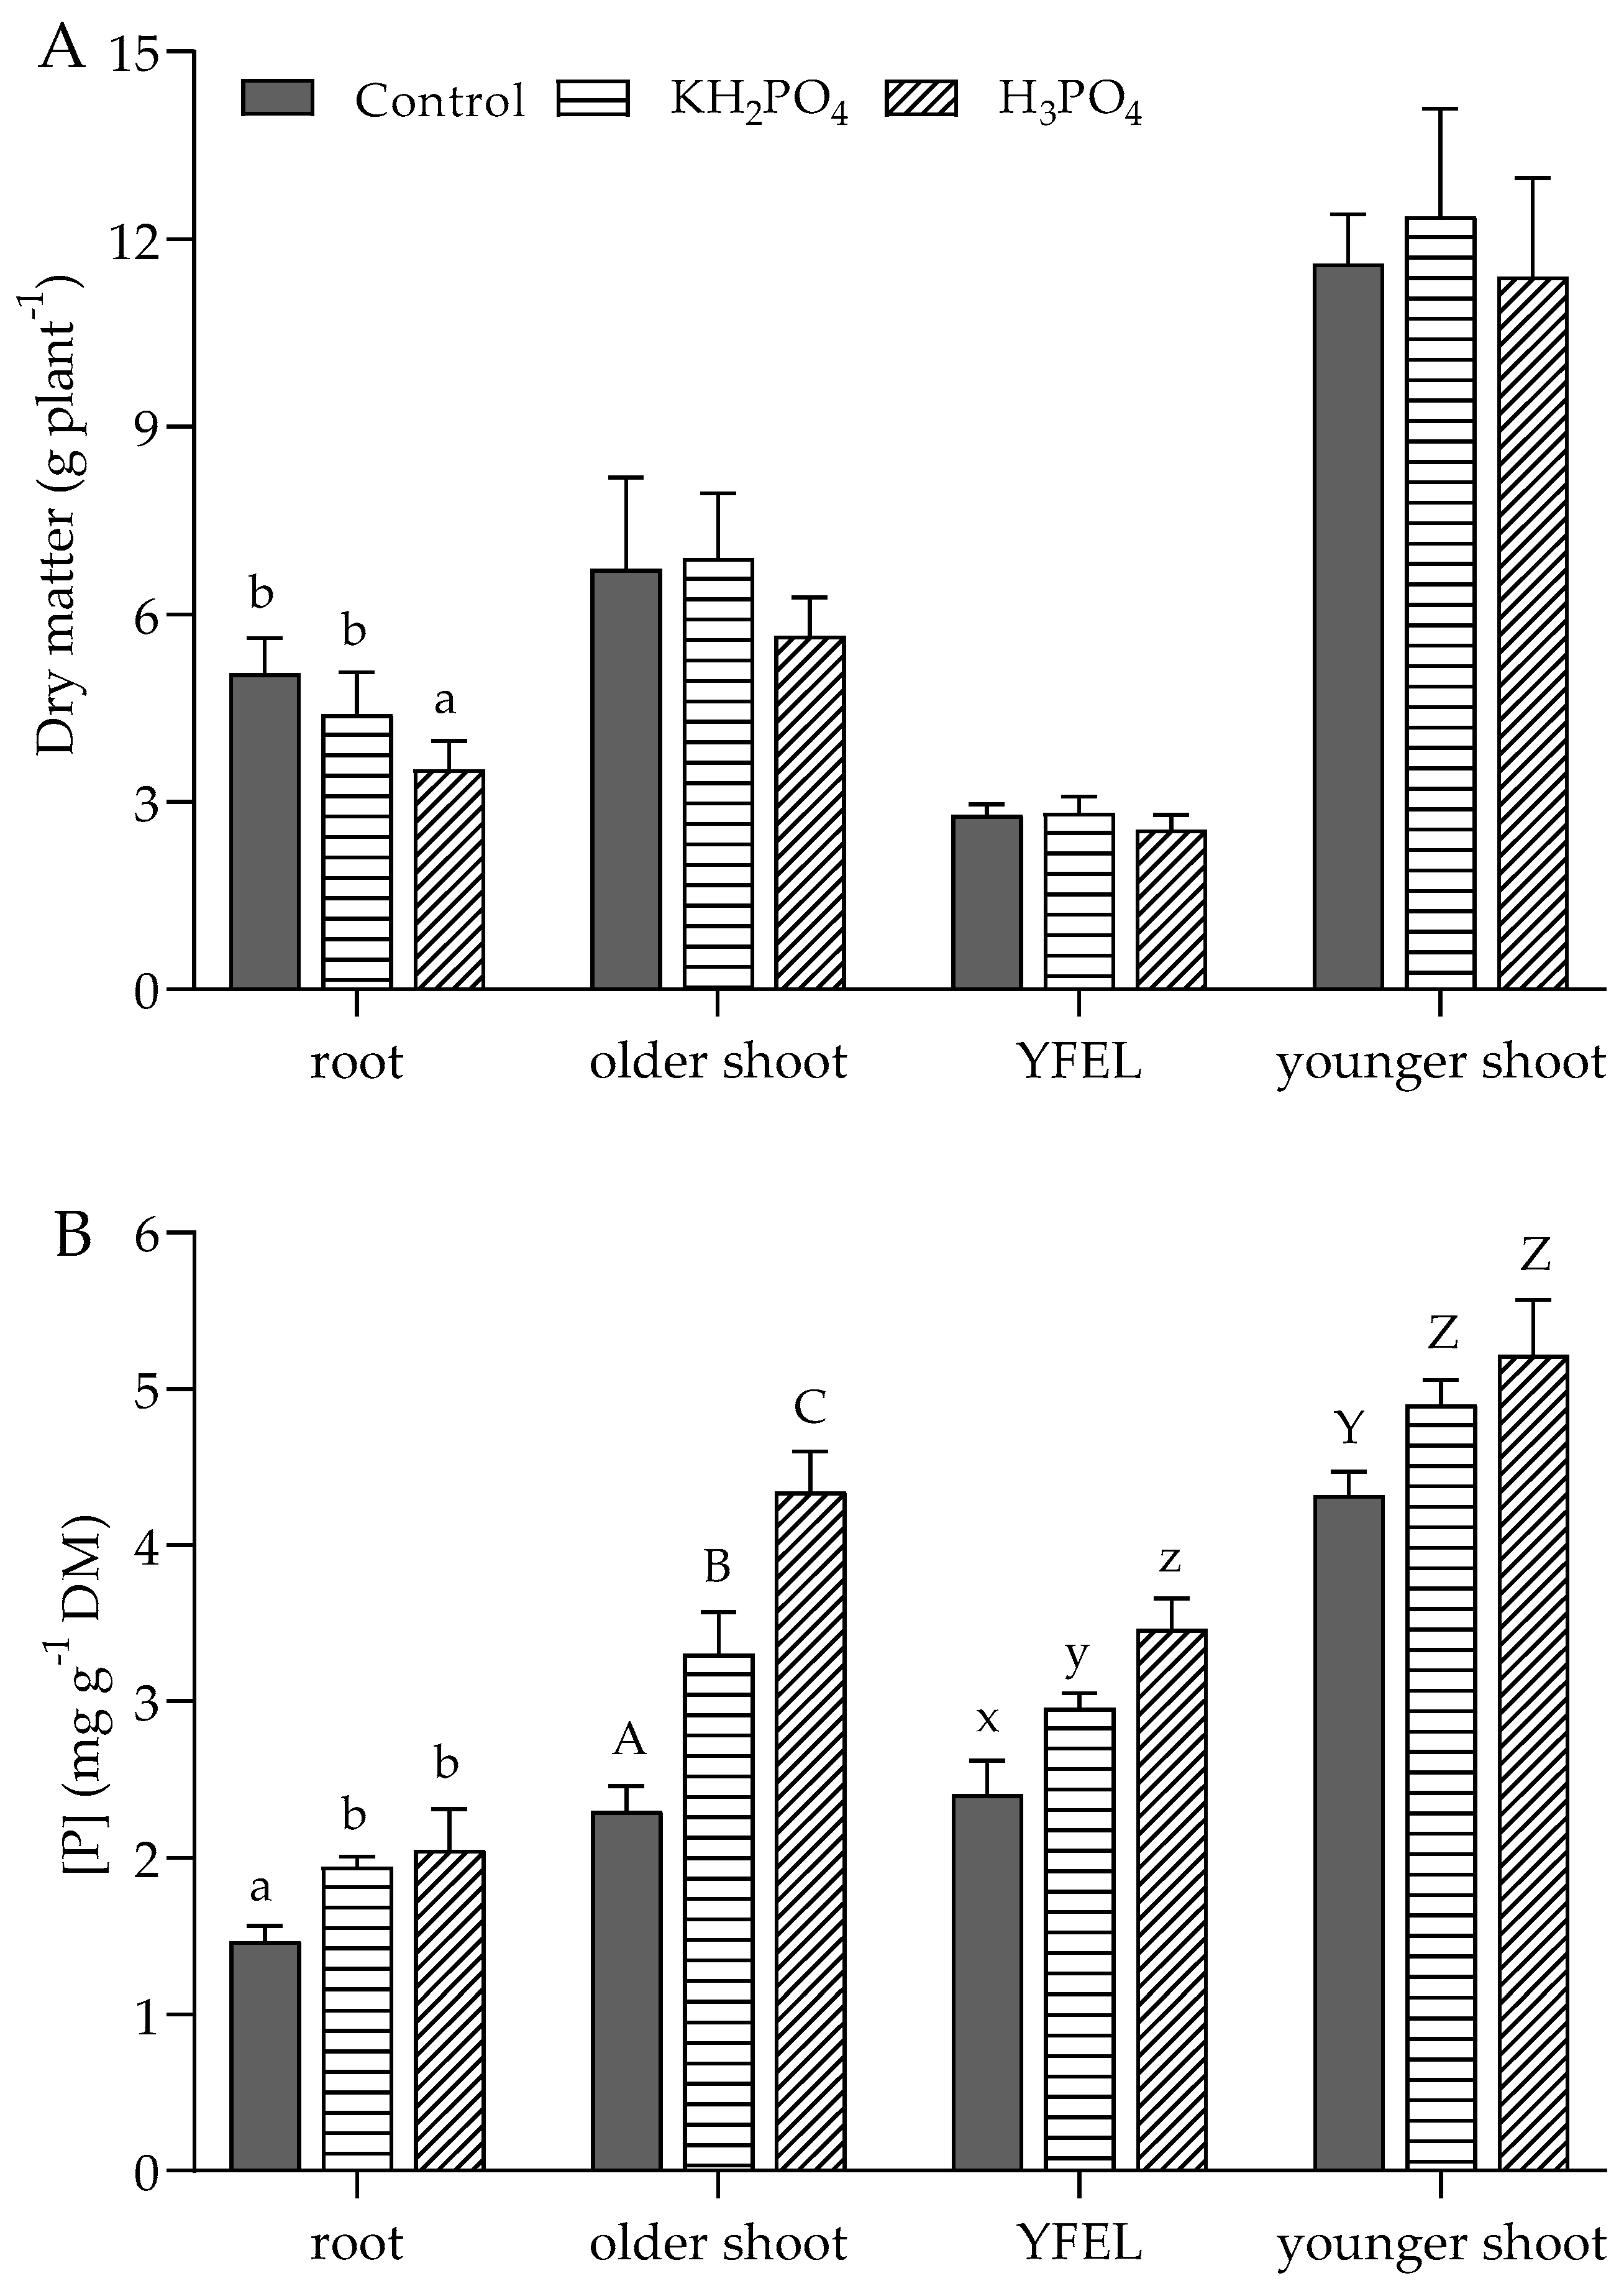
The determination of the dry matter of the various plant parts showed differences only in the roots. The root dry matter of the group with H3PO4 foliar fertilization was significantly reduced (Figure 2A). The studied parts of the control plants cultivated under no P supply exhibited the significantly lowest P concentrations in all parts of these plants (Figure 2B). The P concentrations were between 2.3 mg P g−1 DM in the older shoot, 2.4 mg P g−1 DM in the youngest fully expanded leaf (YFEL), and 4.3 mg P g−1 DM in the younger shoot; root tissue contained 1.5 mg P g−1 DM. Supply of P via the foliar application with KH2PO4 and H3PO4 resulted in an average percentage increase up to 17% in the younger shoot and 37% in the root (Figure 2B). In the older shoot and the YFEL, foliar application with H3PO4 showed a significant increase in concentration compared with foliar application with KH2PO4 (Figure 2B). In the older shoot, in particular, this resulted in an increase of P concentration by 88% above the mean value of the control plants compared with an increase of 44% when KH2PO4 was applied.
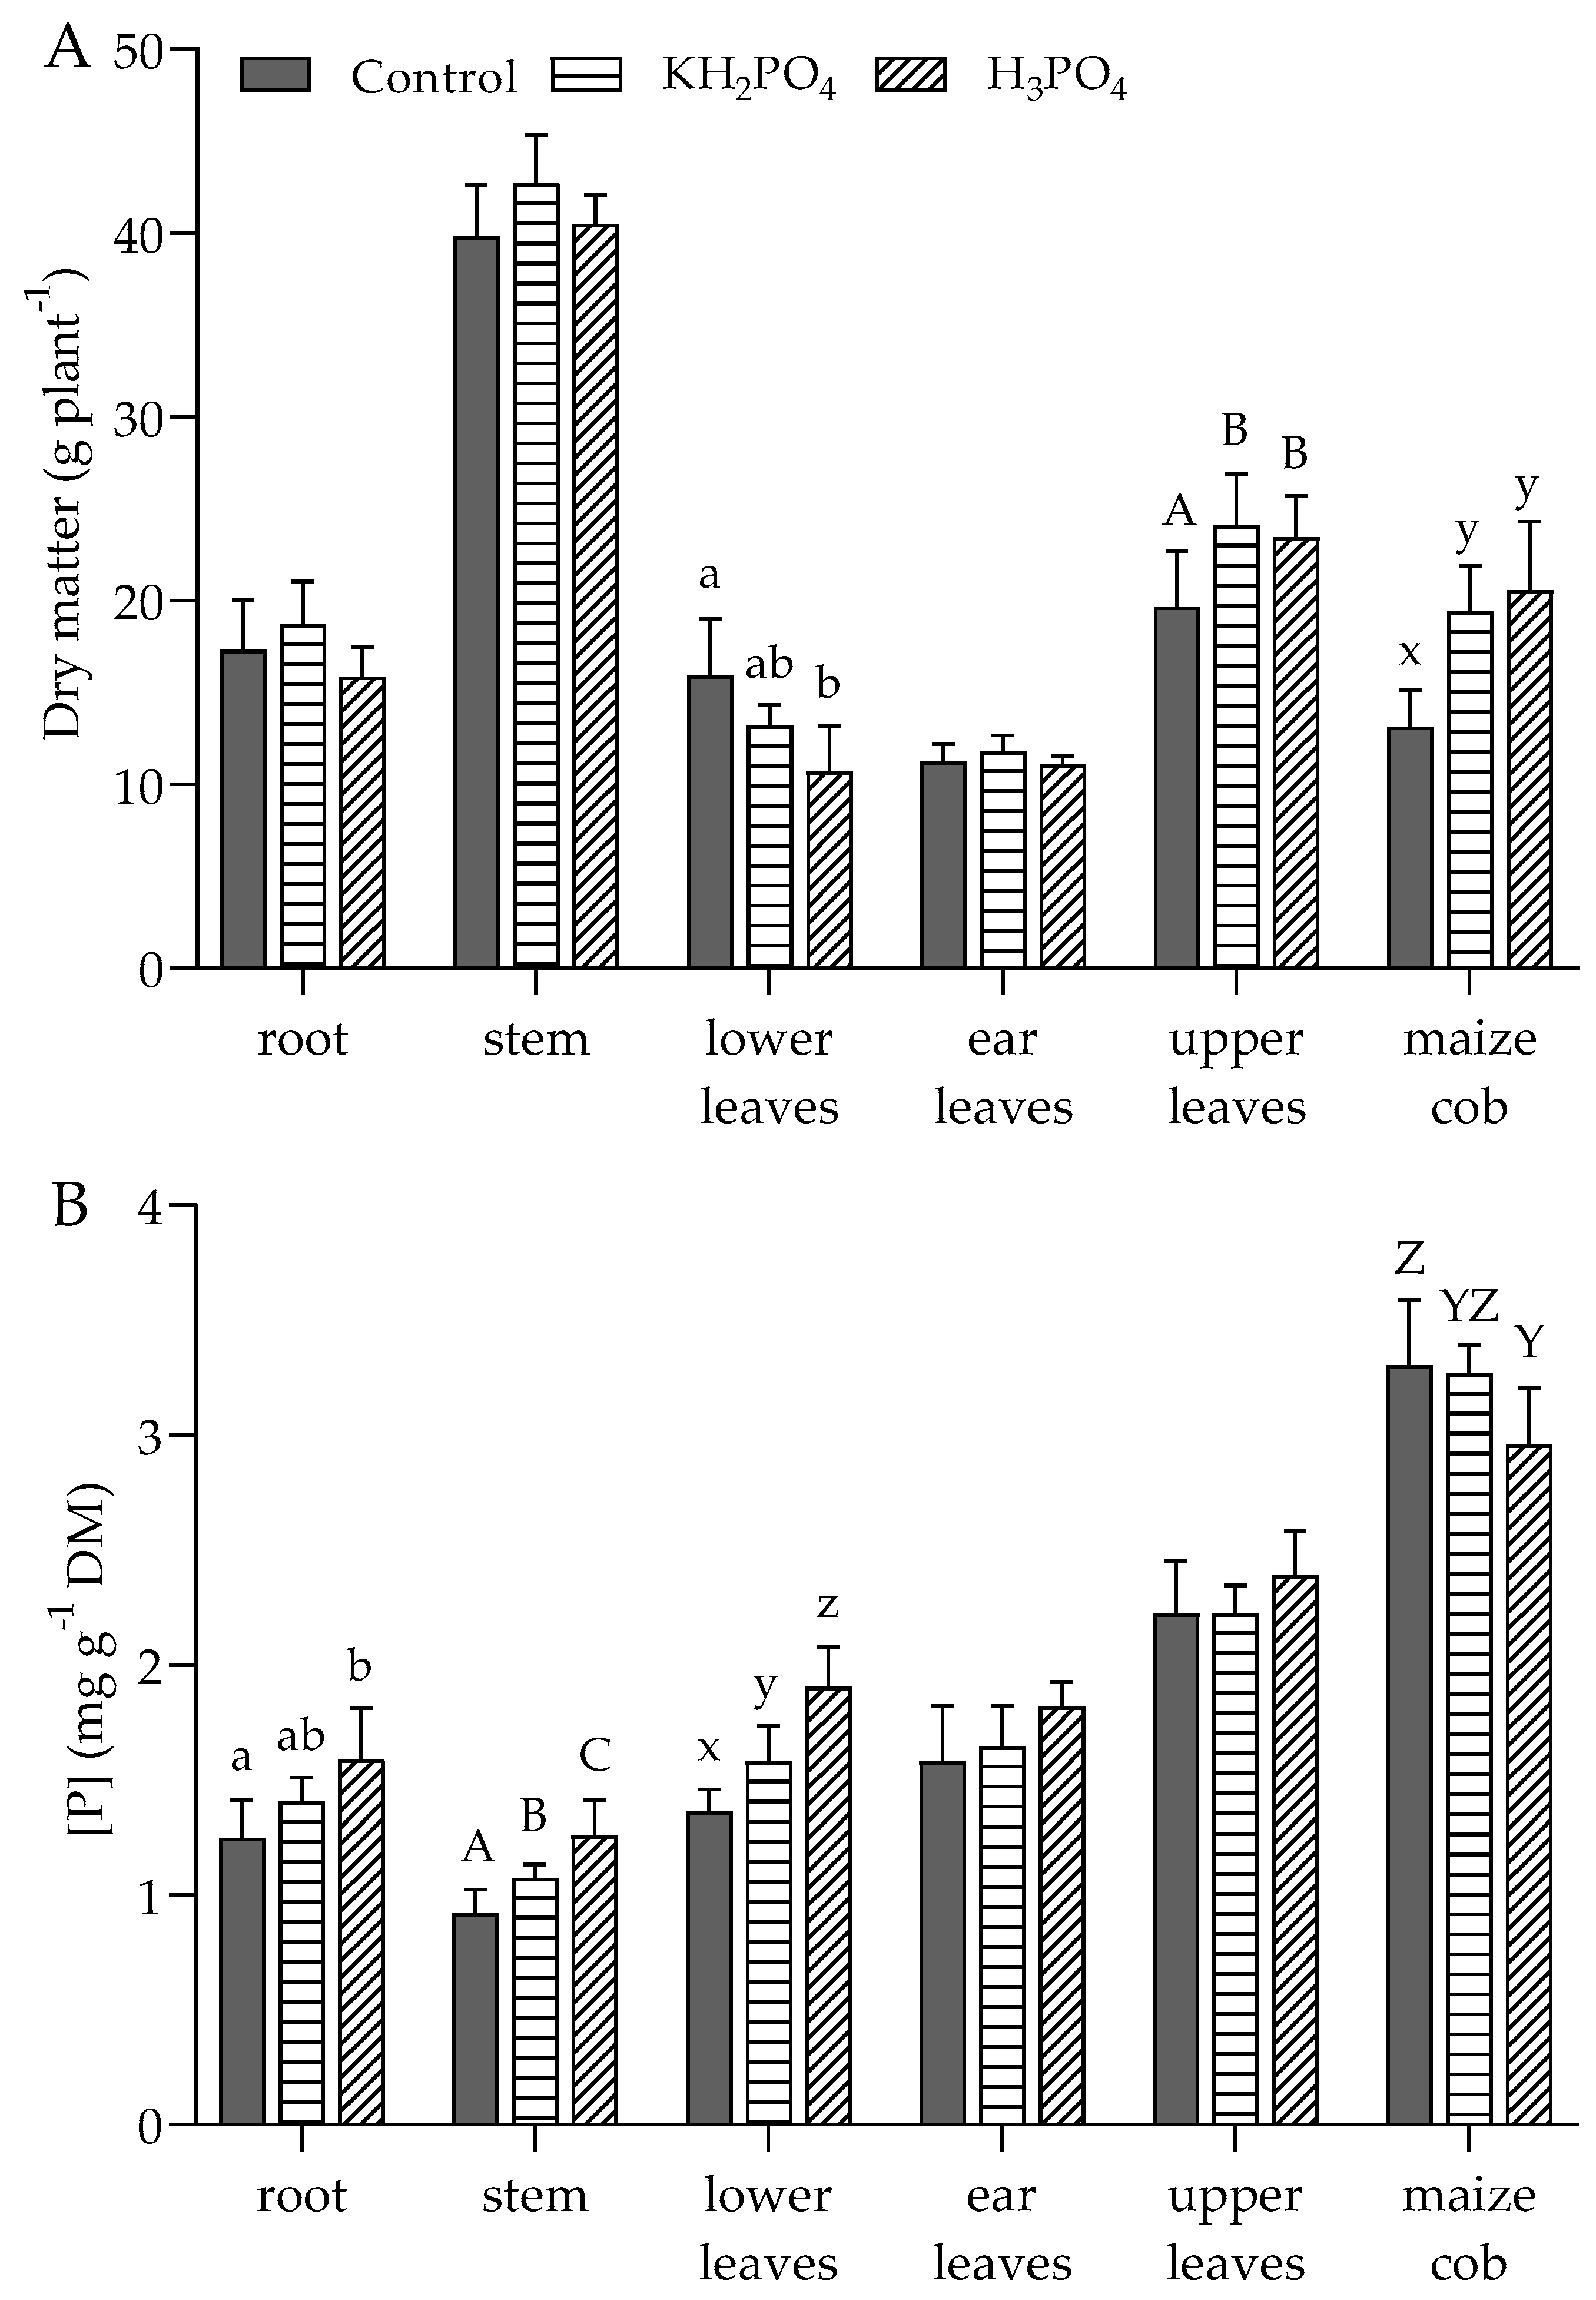
During flowering, the groups with supplemental foliar fertilization showed significantly lower dry matter in the leaves below the ear leaves (lower leaves) but significantly higher values in the leaves above the ear leaves (upper leaves) and the growing maize cobs (Figure 3A). No differences in P concentration could be measured in the ear leaves and the leaves above them (Figure 3B). However, significant differences in P concentration were evident in the leaves below the maize cobs. At 1.9 mg P g−1 DM, the P concentration in maize plants following H3PO4 foliar application was 24% higher compared with maize plants having KH2PO4 foliar application and 40% higher compared with maize plants without foliar application (Figure 3B). Foliar application of H3PO4 also showed the significantly highest concentrations in the roots and the stem. However, the application of KH2PO4 had the significantly second-highest concentration in the stem but showed no significant differences in the root from either the control or the treatment with H3PO4 (Figure 3B). The opposite was seen in the young maize cobs and the associated husk leaves. Significant effects were detected between the control and the H3PO4 group. At 3.3 mg P g−1 DM, the control group showed the highest P concentration (Figure 3B).
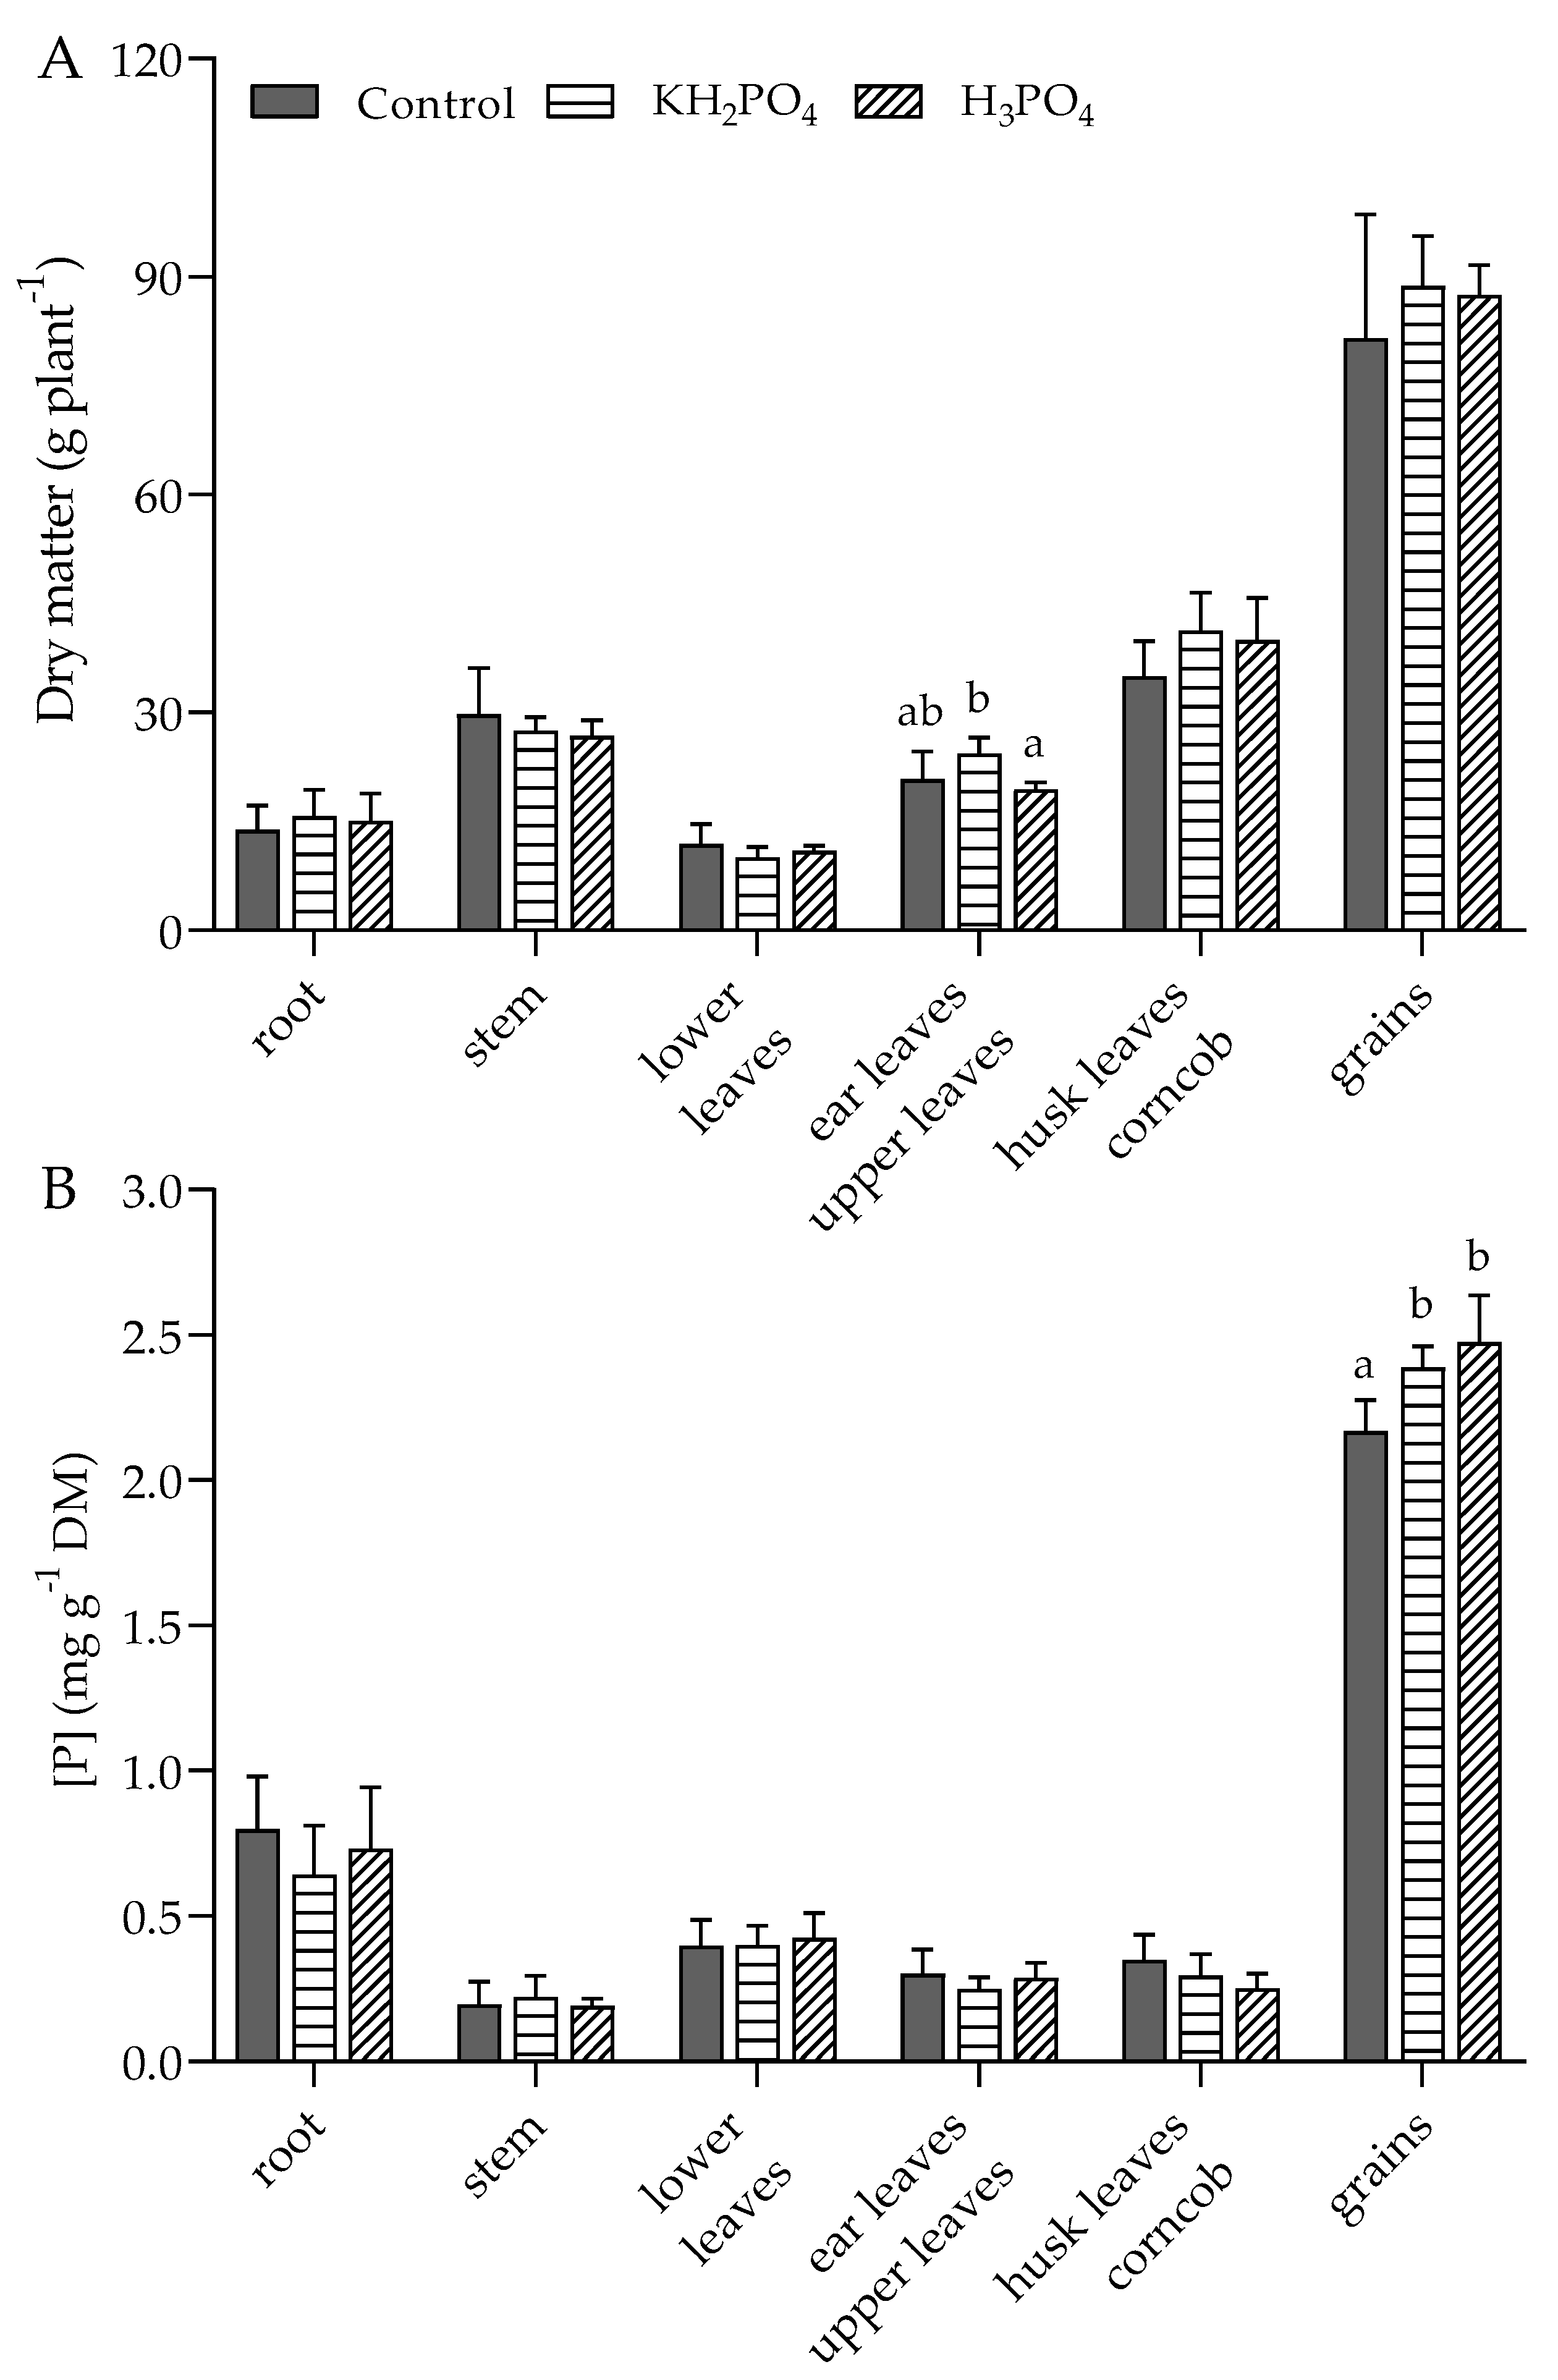
Once the plants had fully ripened, no significant differences were seen in their dry matter, except for the cob leaves and the leaves above them (Figure 4A). At maturity, the P concentrations in the roots were below a value of 1.0 mg P g−1 DM, which was however higher than the P concentrations of the individual shoot sections, which were below a value of 0.5 mg P g−1 DM, except for the P concentration in maize grains. In the individually studied plant regions, no significant differences were detected among the three treatments, even in the lower parts of the plant (root, stem, lower leaves), with the exception of the maize grains (Figure 4B). However, the measurement of the P concentration in the maize grains showed a significant increase in the groups with additional foliar fertilization compared with the control. At 2.39 mg P g−1 DM for the treatment with KH2PO4 and 2.47 mg P g−1 DM for the treatment with H3PO4, the concentrations were at similar levels, regardless of the foliar-applied P form. The P concentration in the control group was 13% lower at 2.17 mg P g−1 DM.

3.3. Dry Matter and P Concentration according to P Soil and Foliar Fertilization

Determination of total dry matter of shoots of maize plants at BBCH 16 showed a significant increase as a result of the foliar application in the group receiving soil fertilizer of 200 mg P (Figure 5A). A significant difference was shown in the older shoot, whereas no significant increase in dry matter was observed in the younger shoot (Figure 5B,C). In the group with soil fertilization of 300 mg P, the foliar application showed no effect on dry matter (Figure 5A–C). Regardless of the amount of P fertilized via soil, the P concentration in all examined parts of the plant and thus also in the total shoot was significantly increased by three foliar applications of P (Figure 5D–F). In the older shoot, the P concentration was increased by 40% (200 + foliar application, FA) or 20% (300 + FA) by foliar P fertilization compared with the control treatment. Moreover, the effect was stronger in the older shoot than in the younger shoot, in which an increase in concentration of only 27% and 7%, occurred, respectively.
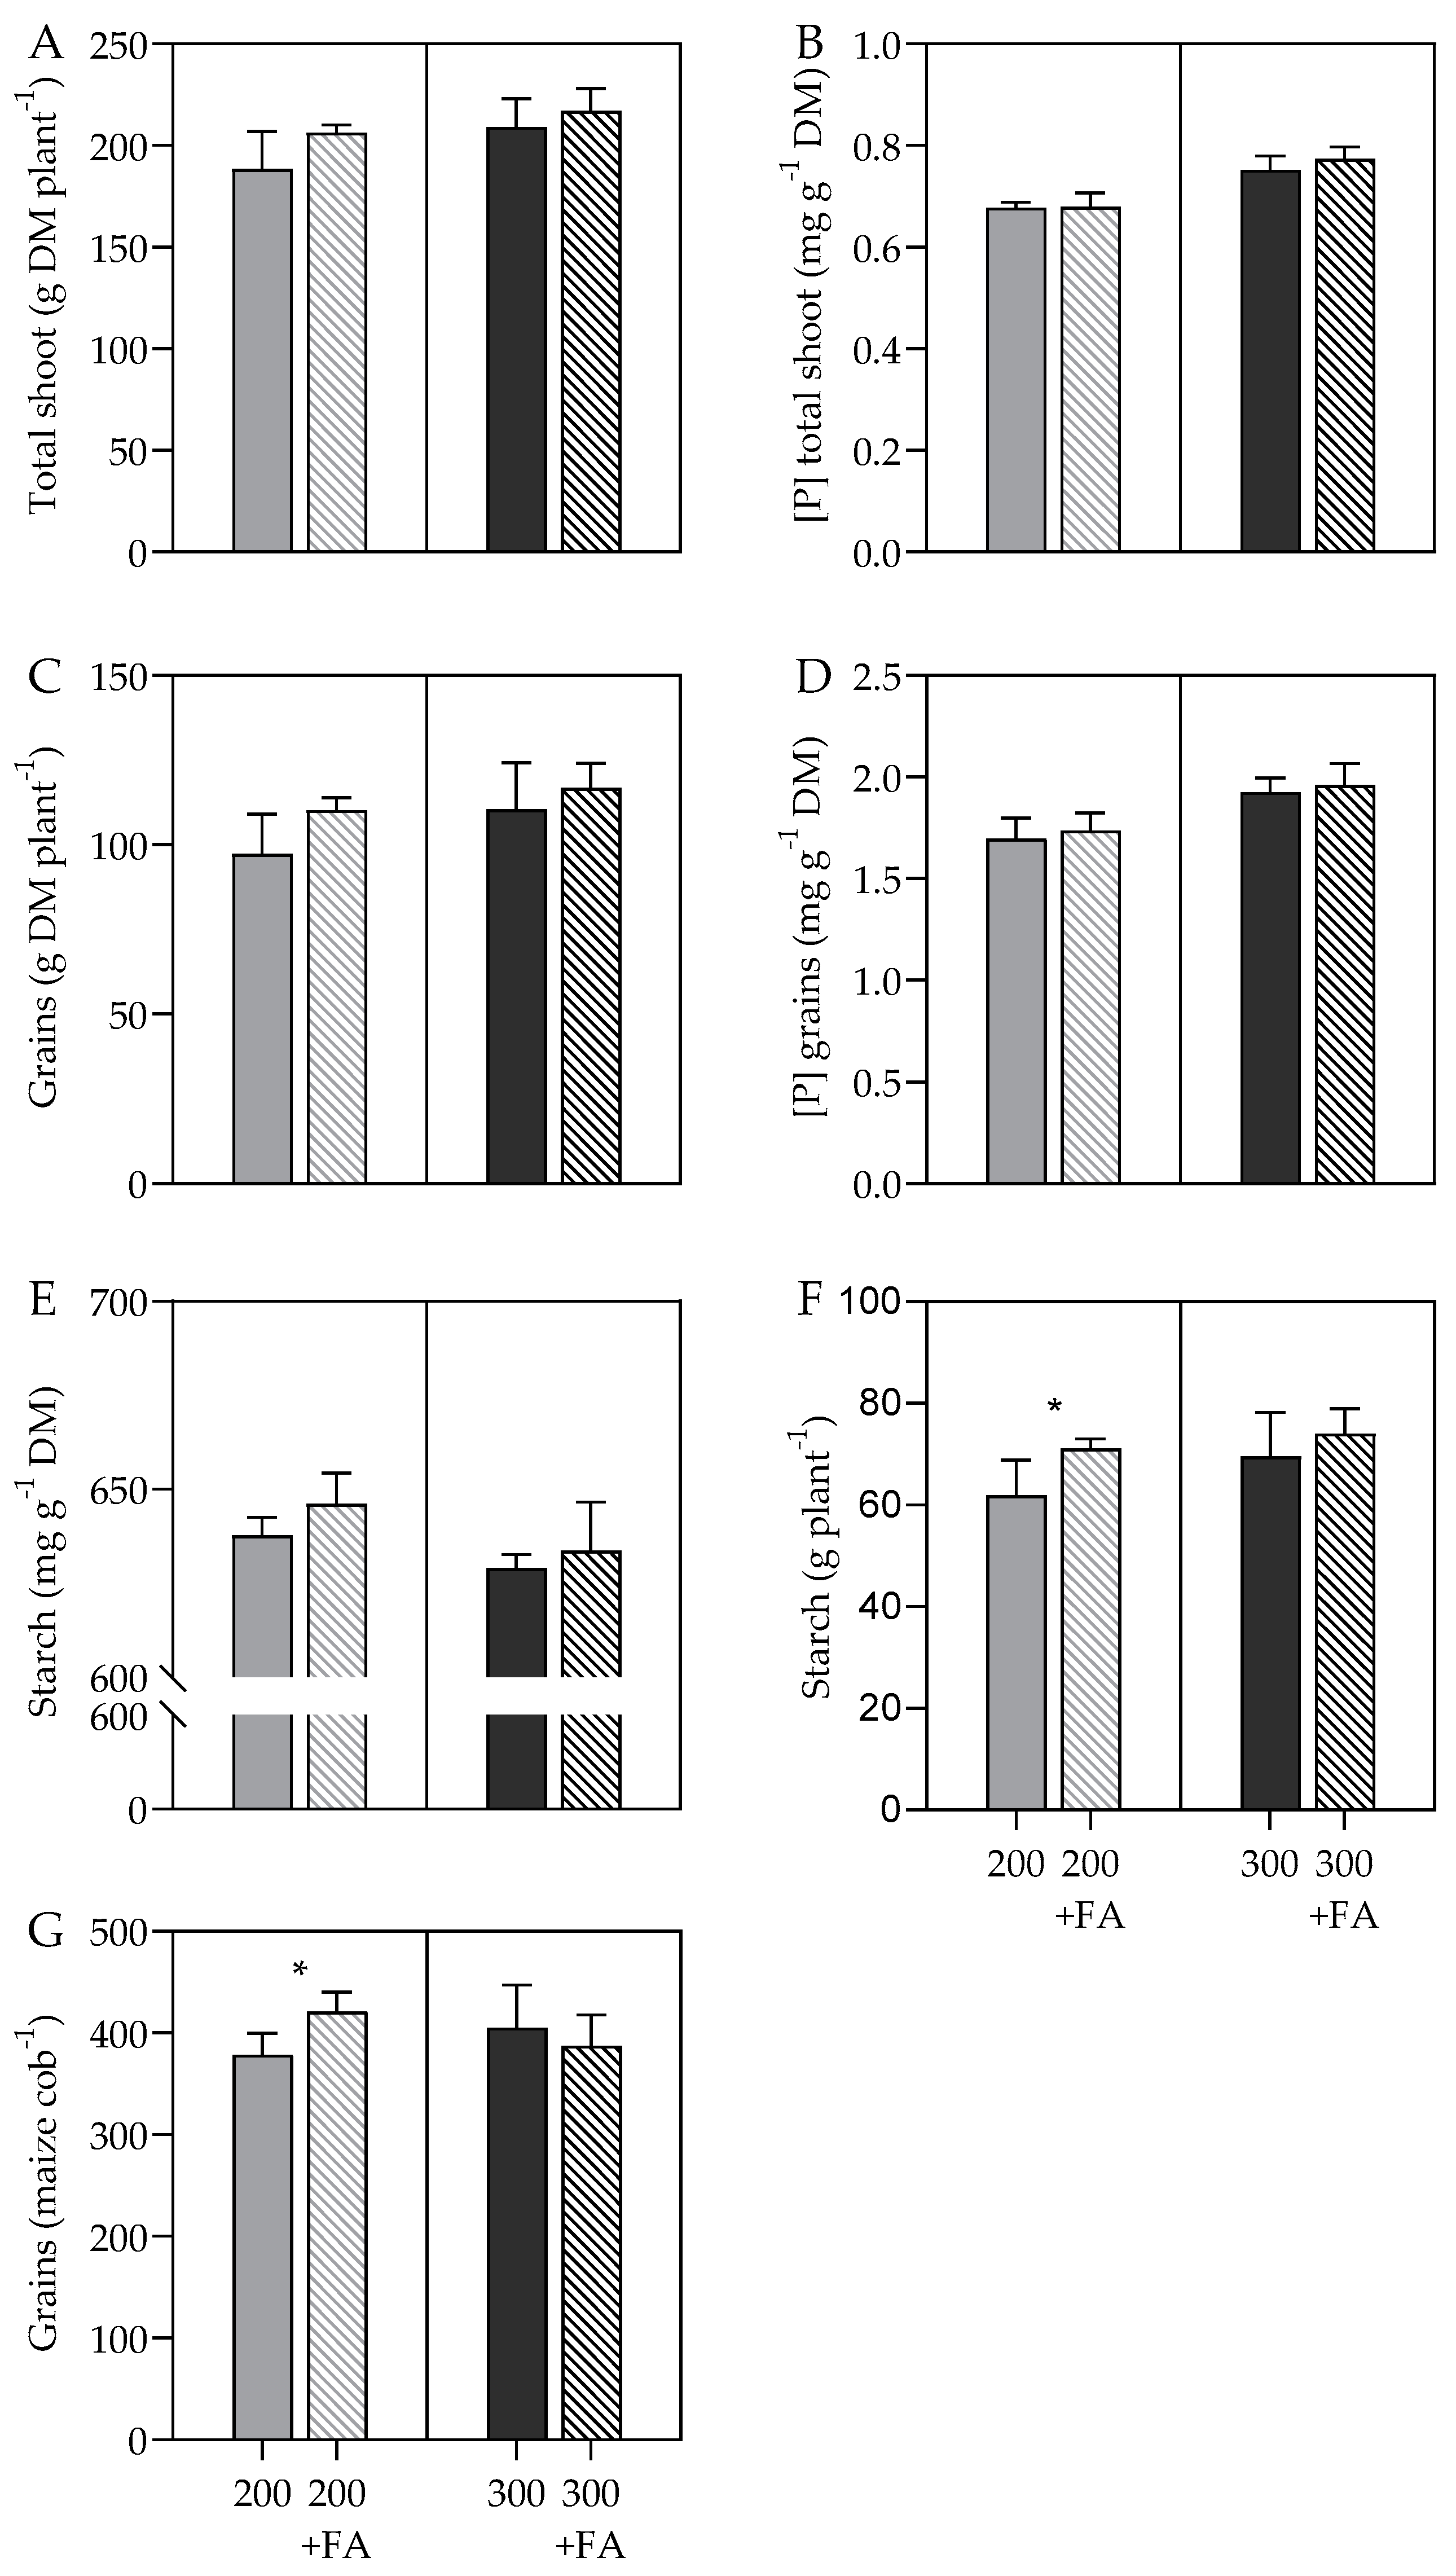
In fully ripened plants, a significant effect was no longer seen in shoot dry matter following three P foliar applications during juvenile development, regardless of P soil fertilization (Figure 6A). Moreover, no significant difference was measured in the P concentration of the total shoot (Figure 6B). In particular, in the examined maize grains, no significant increase in dry matter could be determined by a P foliar application (Figure 6C). In addition, P and starch concentrations were not increased in the grains (Figure 6D,E). Only the starch content in the group receiving soil fertilization of 200 mg P was significantly increased as a result of P foliar fertilization. However, this was not evident in the group with 300 mg of soil-applied P (Figure 6F).

4. Discussion

We have shown that early season P foliar fertilization has a significant effect on P concentration and P content but a marginal effect on biomass development in maize (Figure 1, Figure 5, and Figure 6). The effect of P foliar fertilization on P concentration is mainly measurable at the time of the first harvest at the 6th leaf stage. At this point, a significant increase is evident regardless of the foliar P fertilizer form or the P nutritional status of the plant (Figure 2B and Figure 5D–F). Previous studies have found that the application of H3PO4 results in a high uptake efficiency. According to Peirce et al. [35], the higher penetration rate of H3PO4 is associated with a higher percentage of scorch, which can cause significant leaf damage. Leaf damage is suggested to have a negative effect on the translocation of foliar-applied H3PO4 [35,36]. In addition, photosynthesis might also be negatively affected by leaf damage, resulting in reduced plant growth [37]. Therefore, the occurrence of scorch is suspected to be the cause of the lack of yield effect [35,38]. To prevent this, we raised the pH of the H3PO4 spray solution in the present study to 4.5. Thereafter, the application of H3PO4 still showed a significantly higher absorption than KH2PO4, confirming the higher uptake efficiency of H3PO4. This was mainly measurable in the plant regions directly affected by foliar fertilization (Figure 2B). The lower uptake efficiency of KH2PO4 might be attributable to the phenomenon of crystalline formation on the leaves. At low humidity, an increased accumulation of crystalline residues occurs that prevents the penetration of P into the leaf. This observation and the lower uptake rates of KH2PO4 compared with other P-containing products have also been reported by McBeath et al. [36] and Reed and Tukey [39]. The formation of crystalline residues in KH2PO4 was visible in our study but was probably not as strong as that in the study of McBeath et al. [36], and the differences in uptake were less pronounced. This is attributable to possible differences in relative humidity. A similar effect of crystalline formation was not observed with H3PO4, despite an increase in pH. Nevertheless, a high amount of sodium hydroxide is necessary to adjust the pH of the H3PO4 spray solution in order to avoid high leaf damage. Compared with KH2PO4, H3PO4 also provides no significant additional yield; hence, our decision to use KH2PO4 in our second experiment.
We observed no difference in P concentrations in the younger shoots and roots (which were not directly affected or only partially affected by foliar P) between the two P foliar fertilizers. This showed that the percent translocation of foliar fertilized H3PO4 was lower than that for KH2PO4, which was also confirmed by the data from the roots and growing corn cob during flowering (Figure 3B). Despite differences in pH during the application of H3PO4, this finding was also evident in the studies by Peirce et al. [35] and McBeath et al. [36]. Nevertheless, the assumption of translocation of foliar-applied P to the root by Peirce et al. [31] can be confirmed by the significantly increased P concentrations in the roots in the present investigation (Figure 2B and Figure 3B). The translocation of (foliar-applied) P to the roots is supported by the studies of Koontz and Biddulph [40] and Jeschke et al. [41]. Over time until grain maturity, the significant increase could not be maintained in the two experiments. At flowering, P concentration was still significantly increased only in the leaves below the ear leaf or in the roots and the stem. Thus, P concentration was further enhanced in plant parts that were also present during foliar fertilization (Figure 3B). This indicates that the foliar-applied P is not completely translocated. Moreover, in Peirce et al. [35], translocation of foliar-applied P from treated leaves to other plant parts was reduced in wheat when applied at early tillering compared with the application at flag leaf emergence. According to the authors, this might be attributable to high scorching and the reduced ability of the leaf cells of younger plants to translocate P to other parts of the plant. Possibly, the latter is more likely, since less (H3PO4) or even no scorching (KH2PO4) occurred in our experiment. However, the stress conditions that were experienced by the plant and that were possibly caused by the low incidence of scorch in the treatment with H3PO4 could have been the trigger for the lower translocation of H3PO4. In addition, compared with Peirce et al. [35], our results showed that scorching is enhanced by very low pH values. On the other hand, P uptake via the roots might also reduce re-translocation at younger growth stages, and complete re-mobilization might only occur with grain filling and end with leaf senescence. Translocation is probably more effective under severe P deficiency conditions because P uptake through the root is reduced. However, in the study by Fernández et al. [30], no difference in percent translocation was found at different P soil fertilization levels. On the other hand, a significant effect of P foliar application on biomass growth in maize under severe P deficiency has been shown in plants grown under hydroponics by Görlach and Mühling [42]. The findings of no (KH2PO4) or significantly lower (H3PO4) P concentrations in the growing maize cobs and husk leaves at flowering compared with the control indicate a dilution effect, as the dry matter of growing cobs was significantly increased in the groups with foliar fertilization (Figure 3B). With regard to the P content of the maize cobs and husk leaves, the results showed a significant increase of 43% in P contents for the treatments receiving foliar application (Figure S1). At maturity, no longer were any differences seen in the P concentrations of the individual shoot segments, apart from the grains (Figure 4B), a finding that supports the assumption of only complete translocation of foliar-applied P to grain filling. As described by Grant et al. [2], P re-mobilization within the plant is crucial for the P concentration in the grain and is the reason that P is effectively translocated from senescent plant parts to the grain until the plants have fully ripened [43]. This is in agreement with our results (Figure 4B) and also with other studies of P foliar fertilization in wheat [35,44,45]. The significantly elevated P concentrations in the maize grains can be attributed to P foliar fertilization. As seen at flowering (Figure 3B), the concentrations of P and the contents (Figure S1) in the plant parts affected by foliar fertilization are significantly increased and are only completely translocated into the grain at maturity. This suggests that no substitution of P occurs in the plant as a result of P foliar fertilization. Thus, root P uptake is unlikely to be strongly affected by P foliar fertilization, as also shown by McBeath et al. [36] for wheat. However, no significant effect on P concentration in the grains was determined in experiment 2 (Figure 6D), and we detected no differences in the P concentrations in all other examined plant parts (Figure S2). Furthermore, no significant difference could be measured in the P content at maturity in the plants of experiment 1 (Figure 1C). Consequently, a possible influence on P root uptake cannot be excluded and might occur because of an increased translocation of P from the older leaves into the grain.
Moreover, experiment 2 showed that the nutritional status of the plant has an influence on foliar-applied P absorption. The results suggest that foliar-applied P uptake is increased when the P nutritional status of the plant is lower. This might be mainly because the uptake rate is determined by the difference in concentration of the solutes within the spray solution and the interior of the leaf [26]. A better effect of P foliar fertilization at a lower nutritional status of the plant is consistent with the study of Mosali et al. [29] on wheat. However, Fernández et al. [30] have found that foliar-applied P absorption is higher in wheat plants with a higher soil P supply. The authors suggest that this is related to changes in leaf morphology. Furthermore, we have not detected an effect of P foliar fertilization on starch concentration in either experiment (Figure 6E,F, and Figure S3), only in the group with 200 mg P soil fertilization in experiment 2. The higher content was attributable to an increased grain dry matter and a slightly increased starch concentration, as a result of P foliar fertilization (Figure 6C,E). Similar results were obtained in the study of Leach and Hameleers [46]. Likewise, P foliar fertilization showed a significant effect in the group with 200 mg P soil fertilization with regard to the number of grains per cob, but not in the other groups (Figure 6G and Figure S4). This demonstrates the complexity of the efficacy of foliar-applied P and its dependence on numerous factors.
P foliar fertilization showed a significant dry matter effect at the first harvest date only in experiment 2 in the group with a soil fertilization of 200 mg P. The dry matter effect in experiment 1 at flowering can be attributed mainly to the more advanced development of the maize cob, possibly as a result of P foliar fertilization (Figure 3A). Despite three applications of foliar P fertilizer, concentration effects were not reflected in yield, but foliar fertilization prevented much variability in plant and grain dry weight between replicates compared with the controls (Figure 1A, Figure 4A, and Figure 6A,B). The absence of a yield effect, despite the increase in P concentration and content, might be attributable to the insufficient translocation of foliar-applied P. As described by McBeath et al. [36], the effect of P foliar fertilization depends on the effectiveness of translocation within the plant. As our results showed, complete translocation also did not occur until grain filling, as discussed above (Figure 3 and Figure 4). On the other hand, the yield effect of foliar P fertilization at the 6th leaf stage in experiment 1 was possibly reduced by the strong P replenishment capacity of the soil (Table 1), which was probably accelerated by warm temperatures and the small soil volume. However, the soil type was deliberately selected to test the effect of foliar P fertilization under regional conditions. Although our experiments were in the range of practical application rates of 1.24 kg phosphorus ha−1, the latter could be increased, because of the lack of leaf damage, in order to achieve a possible yield effect. The differences in the dry matter of the leaves above and below the ear leaves might be the result of a lower cob set since the overall number of leaves was the same in all treatments (Figure 3A, data not shown). In general, studies with P foliar applications show inconclusive results, as summarized in the review by Noack et al. [10]. The lack of a positive yield effect has been demonstrated in previous studies of wheat [29,47] and maize [25], whereas other investigations have detected a yield effect as a result of P foliar fertilization [48,49]. Nevertheless, the potential of P foliar application is apparent as revealed by the significant increases in P concentration and content. We assume that foliar P application can be used to bridge short-term P deficiencies in the root zone because P is applied directly to the plant and will not be influenced by any soil parameters. Foliar application from both the abaxial and adaxial leaf surface might improve the success of P foliar fertilization in practical field trials because more P would be available to the plant for the same amount of effort, as can be seen in the study of Görlach and Mühling [42].

5. Conclusions

The foliar application of P resulted in a significant increase in P concentration not only in the shoot, but also in the root, irrespective of the year, P form, or nutritional status of the treated maize plants. The increase in P concentration was significantly stronger in plants with no or less P soil fertilization. In plants with P foliar applications, P concentrations remained increased mainly in the plant segments that were also present at the time of applications (root, stem, lower leaves). Complete translocation of the grain occurred during maturity. Therefore, P foliar application is an effective fertilizer technique for the efficient P acquisition by maize plants. In general, foliar P fertilization resulted in a higher consistency in dry matter and grain yield. A possible negative effect of P foliar application on P uptake via the root cannot be excluded. The reason that the significant effect on plant P status resulting from P foliar application does not translate into increased biomass or grain yield remains unclear. However, other mechanisms need to be investigated to explain the lack of maize responses to foliar application of P. Thus, plants respond to P foliar application, but this method might be improved by foliar application on both sides of the leaf.

Supplementary Materials

The following are available online at https://www.mdpi.com/article/10.3390/agronomy11040727/s1, Figure S1: Phosphorus content (P) in mg plant−1 of the investigated parts of the plant were analyzed after harvest at flowering (BBCH 65). Plant material was separated into root, stem, lower leaves (leaves below the ear leaves), ear leaves, upper leaves (leaves above the ear leaves), and maize cobs (+husk leaves). Control without P fertilization (control) or three foliar applications of 200 mM potassium dihydrogen phosphate (KH2PO4) or phosphoric acid (H3PO4) at 40, 46, and 53 days after sowing. Bars represent means + SD (n = 5). Letters indicate significant differences between treatments (ANOVA with Duncan test, p ≤ 0.05). Figure S2: Phosphorus concentration (P) in mg g−1 dry matter of (A) stem, (B), lower leaves, and (C) ear + upper leaves. Plants were cultivated with 200 mg P soil fertilization (200) with additional foliar application (FA) (200 + FA) or with 300 mg P soil fertilization (300) with additional foliar application (300 + FA). KH2PO4 was used as foliar fertilizer and was applied at 35, 42, and 49 days after sowing. Bars represent means + SD (n = 5). Asterisks indicate significant differences between treatments of one fertilization level (student´s t-test, p ≤ 0.05). Figure S3: (A) Starch concentration in mg g−1 dry matter, and (B) starch content in g plant−1. Control without P fertilization (control) or three foliar applications of 200 mM potassium dihydrogen phosphate (KH2PO4) or phosphoric acid (H3PO4) at 40, 46, and 53 days after sowing. Bars represent means + SD (n = 5). Letters indicate significant differences between treatments (ANOVA with Duncan test, p ≤ 0.05). Figure S4: Number of grains per maize cob at maturity (BBCH 89). Control without P fertilization (control) or three foliar applications of 200 mM potassium dihydrogen phosphate (KH2PO4) or phosphoric acid (H3PO4) at 40, 46, and 53 days after sowing. Bars represent means + SD (n = 5). Letters indicate significant differences between treatments (ANOVA with Duncan test, p ≤ 0.05).

Author Contributions

Conceptualization, visualization, investigation, laboratory work, collected data, data analysis, and writing the original draft, B.M.G.; investigation, review and editing, J.N.H.; investigation, J.T.M.; project administration, supervision, and review, K.H.M. All authors have read and agreed to the published version of the manuscript.

Funding

This project was funded by a Federal State Scholarship from Kiel University.

Institutional Review Board Statement

Not applicable.

Informed Consent Statement

Not applicable.

Data Availability Statement

The data that support the findings of this study are available from the corresponding author upon reasonable request.

Acknowledgments

Language editing by R. Theresa Jones (freelance language-editor) is gratefully acknowledged. We acknowledge financial support by Land Schleswig-Holstein within the funding programme Open Access Publikationsfonds.

Conflicts of Interest

The authors declare no conflict of interest.

References

  1. Schachtman, D.P.; Reid, R.J.; Ayling, S. Phosphorus Uptake by Plants: From Soil to Cell. Plant Physiol. 1998, 116, 447–453. [Google Scholar] [CrossRef] [PubMed] [Green Version]
  2. Grant, C.A.; Flaten, D.N.; Tomasiewicz, D.J.; Sheppard, S.C. The importance of early season phosphorus nutrition. Can. J. Plant Sci. 2001, 81, 211–224. [Google Scholar] [CrossRef]
  3. Maathuis, F.J. Physiological functions of mineral macronutrients. Curr. Opin. Plant Biol. 2009, 12, 250–258. [Google Scholar] [CrossRef] [PubMed]
  4. Raghothama, K.G.; Karthikeyan, A.S. Phosphate Acquisition. Plant Soil 2005, 274, 37–49. [Google Scholar] [CrossRef]
  5. Rodriguez, D.; Andrade, F.; Goudriaan, J. Effects of phosphorus nutrition on tiller emergence in wheat. Plant Soil 1999, 209, 283–295. [Google Scholar] [CrossRef]
  6. Barry, D.A.J.; Miller, M.H. Phosphorus Nutritional Requirement of Maize Seedlings for Maximum Yield. Agron. J. 1989, 81, 95–99. [Google Scholar] [CrossRef]
  7. Plénet, D.; Etchebest, S.; Mollier, A.; Pellerin, S. Growth analysis of maize field crops under phosphorus deficiency. I. Leaf Growth. Plant Soil 2000, 223, 119–132. [Google Scholar] [CrossRef]
  8. Assuero, S.G.; Mollier, A.; Pellerin, S. The decrease in growth of phosphorus-deficient maize leaves is related to a lower cell production. Plant Cell Environ. 2004, 27, 887–895. [Google Scholar] [CrossRef]
  9. Hawkesford, M.; Horst, W.; Kichey, T.; Lambers, H.; Schjoerring, J.; Møller, I.S.; White, P. Chapter 6—Functions of Macronutrients. In Marschner’s Mineral Nutrition of Higher Plants, 3rd ed.; Marschner, H., Marschner, P., Eds.; Academic Press: Boston, MA, USA, 2012; pp. 135–189. ISBN 9780123849052. [Google Scholar]
  10. Noack, S.R.; McBeath, T.M.; McLaughlin, M.J. Potential for foliar phosphorus fertilisation of dryland cereal crops: A review. Crop Pasture Sci. 2010, 61, 659–669. [Google Scholar] [CrossRef] [Green Version]
  11. Bundesministerium für Ernährung und Landwirtschaft. Statistisches Jahrbuch über Ernährung, Landwirtschaft und Forsten der Bundesrepublik Deutschland 2018; Bundesministerium für Ernährung und Landwirtschaft: Berlin, Germany, 2018; ISBN 978-3-8308-1365-1. [Google Scholar]
  12. Statistisches Bundesamt. Anbauflächen, Hektarerträge und Erntemengen Ausgewählter Anbaukulturen im Zeitvergleich. Available online: https://www.destatis.de/DE/Themen/Branchen-Unternehmen/Landwirtschaft-Forstwirtschaft-Fischerei/Feldfruech-te-Gruenland/Tabellen/liste-feldfruechte-zeitreihe.html;jsessionid=E85220EAEAA06CA3538A26C0E2CD633F.internet711 (accessed on 11 March 2021).
  13. Stamp, P. Chilling stress in maize. In Breeding of Silage Maize; Dolstra, O., Miedema, P., Eds.; Pudoc: Wageningen, Germany, 1986; pp. 43–50. ISBN 90-220-0895-9. [Google Scholar]
  14. Imran, M.; Mahmood, A.; Römheld, V.; Neumann, G. Nutrient seed priming improves seedling development of maize exposed to low root zone temperatures during early growth. Eur. J. Agron. 2013, 49, 141–148. [Google Scholar] [CrossRef]
  15. Pregitzer, K.; King, J. Effects of Soil Temperature on Nutrient Uptake. In Nutrient Acquisition by Plants: An Ecological Perspective; Bassiri Rad, H., Ed.; Springer: Berlin/Heidelberg, Germany, 2005; pp. 277–310. [Google Scholar]
  16. Sutton, C.D. Effect of low soil temperature on phosphate nutrition of plants—A review. J. Sci. Food Agric. 1969, 20, 1–3. [Google Scholar] [CrossRef]
  17. Hinsinger, P. Bioavailability of soil inorganic P in the rhizosphere as affected by root-induced chemical changes: A review. Plant Soil 2001, 237, 173–195. [Google Scholar] [CrossRef]
  18. Bieleski, R.L. Phosphate Pools, Phosphate Transport, and Phosphate Availability. Annu. Rev. Plant Physiol. 1973, 24, 225–252. [Google Scholar] [CrossRef]
  19. Vance, C.P.; Uhde-Stone, C.; Allan, D.L. Phosphorus acquisition and use: Critical adaptations by plants for securing a nonrenewable resource. New Phytol. 2003, 157, 423–447. [Google Scholar] [CrossRef] [Green Version]
  20. Pedersen, I.F.; Rubæk, G.H.; Sørensen, P. Cattle slurry acidification and application method can improve initial phosphorus availability for maize. Plant Soil 2017, 414, 143–158. [Google Scholar] [CrossRef] [Green Version]
  21. Hart, M.R.; Quin, B.F.; Nguyen, M.L. Phosphorus Runoff from Agricultural Land and Direct Fertilizer Effects: A Review. J. Environ. Qual. 2004, 33, 1954–1972. [Google Scholar] [CrossRef] [PubMed]
  22. Sharpley, A.N.; McDowell, R.W.; Kleinman, P.J.A. Phosphorus loss from land to water: Integrating agricultural and environmental management. Plant Soil 2001, 237, 287–307. [Google Scholar] [CrossRef]
  23. Bundesanstalt für Landwirtschaft und Ernährung. Die Neue Düngeverordnung, 2nd ed.; Bundesanstalt für Landwirtschaft und Ernährung: Berlin, Germany, 2018; ISBN 978-3-8308-1323-1. [Google Scholar]
  24. Fernández, V.; Brown, P.H. From plant surface to plant metabolism: The uncertain fate of foliar-applied nutrients. Front. Plant Sci. 2013, 4, 289. [Google Scholar] [CrossRef] [PubMed] [Green Version]
  25. Girma, K.; Martin, K.L.; Freeman, K.W.; Mosali, J.; Teal, R.K.; Raun, W.R.; Moges, S.M.; Arnall, D.B. Determination of Optimum Rate and Growth Stage for Foliar-Applied Phosphorus in Corn. Commun. Soil Sci. Plant Anal. 2007, 38, 1137–1154. [Google Scholar] [CrossRef] [Green Version]
  26. Fernández, V.; Eichert, T. Uptake of Hydrophilic Solutes Through Plant Leaves: Current State of Knowledge and Perspectives of Foliar Fertilization. Crit. Rev. Plant Sci. 2009, 28, 36–68. [Google Scholar] [CrossRef] [Green Version]
  27. Fernández, V.; Sotiropoulos, T.; Brown, P.H. Foliar Fertilization: Scientific Principles and Field Pratices; International Fertilizer Industry Association (IFA): Paris, France, 2013; ISBN 979-10-92366-00-6. [Google Scholar]
  28. Arif, M.; Chohan, M.A.; Ali, S.; Gul, R.; Khan, S. Response of wheat to foliar application of nutrients. Am. J. Agric. Biol. Sci. 2006, 1, 30–34. [Google Scholar]
  29. Mosali, J.; Desta, K.; Teal, R.K.; Freeman, K.W.; Martin, K.L.; Lawles, J.W.; Raun, W.R. Effect of Foliar Application of Phosphorus on Winter Wheat Grain Yield, Phosphorus Uptake, and Use Efficiency. J. Plant Nutr. 2006, 29, 2147–2163. [Google Scholar] [CrossRef]
  30. Fernández, V.; Guzmán, P.; Peirce, C.A.E.; McBeath, T.M.; Khayet, M.; McLaughlin, M.J. Effect of wheat phosphorus status on leaf surface properties and permeability to foliar-applied phosphorus. Plant Soil 2014, 384, 7–20. [Google Scholar] [CrossRef]
  31. Peirce, C.A.E.; McBeath, T.M.; Fernández, V.; McLaughlin, M.J. Wheat leaf properties affecting the absorption and subsequent translocation of foliar-applied phosphoric acid fertiliser. Plant Soil 2014, 384, 37–51. [Google Scholar] [CrossRef]
  32. Lancashire, P.D.; Bleiholder, H.; Van Den Boom, T.; Langelüddeke, P.; Stauss, R.; Weber, E.; Witzenberger, A. A uniform decimal code for growth stages of crops and weeds. Ann. Appl. Biol. 1991, 119, 561–601. [Google Scholar] [CrossRef]
  33. Jezek, M.; Geilfus, C.-M.; Bayer, A.; Mühling, K.H. Photosynthetic capacity, nutrient status, and growth of maize (Zea mays L.) upon MgSO4 leaf-application. Front. Plant Sci. 2015, 5, 781. [Google Scholar] [CrossRef] [PubMed] [Green Version]
  34. Brandt, M.; Schuldt, A.; Mannerkorpi, P.; Vearasilp, T. Zur enzymatischen Stärkebestimmung im Darminhalt und Kot von Kühen mit hitzestabiler Amylase. Arch. Anim. Nutr. 1987, 37, 455. [Google Scholar]
  35. Peirce, C.A.E.; McBeath, T.M.; Priest, C.; McLaughlin, M.J. The Timing of Application and Inclusion of a Surfactant Are Important for Absorption and Translocation of Foliar Phosphoric Acid by Wheat Leaves. Front. Plant Sci. 2019, 10, 1532. [Google Scholar] [CrossRef] [PubMed] [Green Version]
  36. McBeath, T.M.; Facelli, E.; Peirce, C.A.E.; Arachchige, V.K.; McLaughlin, M.J. Assessment of foliar-applied phosphorus fertiliser formulations to enhance phosphorus nutrition and grain production in wheat. Crop Pasture Sci. 2020, 71, 795. [Google Scholar] [CrossRef]
  37. Fageria, N.K.; Filho, M.B.; Moreira, A.; Guimarães, C.M. Foliar Fertilization of Crop Plants. J. Plant Nutr. 2009, 32, 1044–1064. [Google Scholar] [CrossRef]
  38. Barel, D.; Black, C.A. Effect of neutralization and addition of urea, sucrose, and various glycols on phosphorus absorption and leaf damage from foliar-applied phosphate. Plant Soil 1979, 52, 515–525. [Google Scholar] [CrossRef]
  39. Reed, D.W.; Tukey, H.B. Effect of pH on foliar absorption of phosphorus compounds by chrysanthemum. J. Am. Soc. Hortic. Sci. 1978, 103, 337–340. [Google Scholar]
  40. Koontz, H.; Biddulph, O. Factors Affecting Absorption and Translocation of Foliar Applied Phosphorus. Plant Physiol. 1957, 32, 463–470. [Google Scholar] [CrossRef] [PubMed] [Green Version]
  41. Jeschke, W.D.; Kirkby, E.A.; Peuke, A.D.; Pate, J.S.; Hartung, W. Effects of P deficiency on assimilation and transport of nitrate and phosphate in intact plants of castor bean (Ricinus communis L.). J. Exp. Bot. 1997, 48, 75–91. [Google Scholar] [CrossRef] [Green Version]
  42. Görlach, B.M.; Mühling, K.H. Phosphate foliar application increases biomass and P concentration in P deficient maize. J. Plant Nutr. Soil Sci. 2021, 183, 1472. [Google Scholar] [CrossRef]
  43. Batten, G.; Wardlaw, I.; Aston, M. Growth and the distribution of phosphorus in wheat developed under various phosphorus and temperature regimes. Aust. J. Agric. Res. 1986, 37, 459–469. [Google Scholar] [CrossRef]
  44. Marshall, C.; Wardlaw, I. A Comparative Study of the Distribution and Speed of Movement of 14C Assimilates and Foliar-Applied 32P-Labelled Phosphate in Wheat. Aust. J. Biol. Sci. 1973, 26, 1–14. [Google Scholar] [CrossRef]
  45. McBeath, T.M.; McLaughlin, M.J.; Noack, S.R. And Wheat grain yield response to and translocation of foliar-applied phosphorus. Crop. Pasture Sci. 2011, 62, 58–65. [Google Scholar] [CrossRef]
  46. Leach, K.A.; Hameleers, A. The effects of a foliar spray containing phosphorus and zinc on the development, composition and yield of forage maize. Grass Forage Sci. 2001, 56, 311–315. [Google Scholar] [CrossRef]
  47. Froese, S.; Wiens, J.; Warkentin, T.; Schoenau, J. Response of canola, wheat, and pea to foliar phosphorus fertilization at a phosphorus-deficient site in eastern Saskatchewan. Can. J. Plant Sci. 2020, 100, 642–652. [Google Scholar] [CrossRef]
  48. Benbella, M.; Paulsen, G.M. Efficacy of Treatments for Delaying Senescence of Wheat Leaves: II. Senescence and Grain Yield under Field Conditions. Agron. J. 1998, 90, 332–338. [Google Scholar] [CrossRef]
  49. Sherchand, K.; Paulsen, G.M. Response of wheat to foliar phosphorus treatments under field and high temperature regimes. J. Plant Nutr. 1985, 8, 1171–1181. [Google Scholar] [CrossRef]
Figure 1. (A) Dry matter in g plant−1. (B) Phosphorus concentration (P) in mg g−1 dry matter. (C) Phosphorus content (P) in mg plant−1 of the total maize plant. Control without P fertilization (control), three foliar applications of 200 mM potassium dihydrogen phosphate (KH2PO4) or phosphoric acid (H3PO4) at 40, 46, and 53 days after sowing. Maize plants were harvested during the 6th leaf stage (BBCH 16), flowering (BBCH 65), or maturity (BBCH 89) over time. Bars represent means + SD (n = 5). Upper and lower case letters indicate significant differences between treatments within the development stages (ANOVA with Duncan test, p ≤ 0.05).
Agronomy 11 00727 g001
Figure 2. (A) Dry matter in g plant−1 and (B) phosphorus concentration (P) in mg g−1 dry matter at BBCH 16 (6th leave unfolded) following the three treatments: control without P fertilization (control) or three foliar applications of 200 mM potassium dihydrogen phosphate (KH2PO4) or phosphoric acid (H3PO4) at 40, 46, and 53 days after sowing. Maize plant material was separated into root, older shoot, youngest fully developed leave (YFEL), and younger shoot. Bars represent means + SD (n = 5). Upper and lower case letters indicate significant differences between treatments within the examined parameters (ANOVA with Duncan test, p ≤ 0.05).
Agronomy 11 00727 g002
Figure 3. (A) Dry matter in g plant−1 and (B) phosphorus concentration (P) in mg g−1 dry matter of the investigated parts of the plant were analyzed after harvest at flowering (BBCH 65). Plant material was separated into root, stem, lower leaves (leaves below the ear leaves), ear leaves, upper leaves (leaves above the ear leaves), and maize cobs (+husk leaves). Control without P fertilization (control) or three foliar applications of 200 mM potassium dihydrogen phosphate (KH2PO4) or phosphoric acid (H3PO4) at 40, 46, and 53 days after sowing. Bars represent means + SD (n = 5). Upper and lower case letters indicate significant differences between treatments within the examined parameters (ANOVA with Duncan test, p ≤ 0.05).
Agronomy 11 00727 g003
Figure 4. (A) Dry matter in g plant−1 and (B) phosphorus concentration (P) in mg g−1 dry matter of the investigated parts of the plant were analyzed after harvest at maturity (BBCH 89). Plant material was separated into root, stem, lower leaves (leaves below the ear leaves), ear leaves and upper leaves, husk leaves and corncob, and grains. Control without P fertilization (control) and three foliar applications of 200 mM potassium dihydrogen phosphate (KH2PO4) or phosphoric acid (H3PO4) at 40, 46, and 53 days after sowing. Bars represent means + SD (n = 5). Upper and lower case letters indicate significant differences between treatments within the examined parameters (ANOVA with Duncan test, p ≤ 0.05).
Agronomy 11 00727 g004
Figure 5. Dry matter in g plant−1 and phosphorus concentration (P) in mg g−1 dry matter of (A,D) total shoot, (B,E) older shoot, and (C,F) younger shoot at BBCH 16 (6th leaf unfolded). Plants were cultivated with 200 mg P soil fertilization (200) with additional foliar application (FA) (200 + FA) or with 300 mg P soil fertilization (300) with additional foliar application (300 + FA). KH2PO4 was used as foliar fertilizer and was applied at 35, 42, and 49 days after sowing. Bars represent means + SD (n = 5). Asterisks indicate significant differences between treatments of one fertilization level (student´s t-test, p ≤ 0.05).
Agronomy 11 00727 g005
Figure 6. Total shoot (A) dry matter in g plant−1, (B) phosphorus concentration (P) in mg g−1 dry matter, (C) grain dry matter in g plant−1, (D) grain phosphorus concentration (P) in mg g−1 dry matter, (E) starch concentration in mg g−1 dry matter, (F) starch content in g plant−1, and (G) number of grains per maize cob at maturity (BBCH 89). Plants were cultivated with 200 mg P soil fertilization (200) with additional foliar application (FA) (200 + FA) or with 300 mg P soil fertilization (300) with additional foliar application (300 + FA). KH2PO4 was used as foliar fertilizer and was applied at 35, 42, and 49 days after sowing. Bars represent means + SD (n = 5). Asterisks indicate significant differences between treatments of one fertilization level (Student´s t-test, p ≤ 0.05).
Agronomy 11 00727 g006
Table 1. Physico-chemical characteristics of the soils.
Soil Experiment 1Soil Experiment 2
pH (CaCl2)5.96.1
Phosphorus (mg 100 g−1 soil)7.55.0
Phosphorus release rate (µg kg−1*10 min)825519
Potassium (mg 100 g−1 soil)8.67.9
Magnesium (mg 100 g−1 soil)8.75.1
Copper (mg 100 g−1 soil)1.30.9
Manganese (mg 100 g−1 soil)23.6145.5
Zinc (mg 100 g−1 soil)1.41.3
Boron (mg 100 g−1 soil)0.330.38
Sulfur (mg 100 g−1 soil)5.75.9
Publisher’s Note: MDPI stays neutral with regard to jurisdictional claims in published maps and institutional affiliations.