Article

Effect of Soil Water Availability on Physiological Parameters, Yield, and Seed Quality in Four Quinoa Genotypes (Chenopodium quinoa Willd.)

1
Department of Water Resources, School of Agricultural Engineering, University of Concepción, Chillán 3812120, Chile
2
Water Research Center for Agriculture and Mining (CRHIAM), Chillán 3812120, Chile
3
Department of Plant Production, School of Agronomy, University of Concepción, Chillán 3812120, Chile
*
Author to whom correspondence should be addressed.
Agronomy 2021, 11(5), 1012; https://doi.org/10.3390/agronomy11051012
Submission received: 15 April 2021 / Revised: 17 May 2021 / Accepted: 18 May 2021 / Published: 20 May 2021
(This article belongs to the Section Water Use and Irrigation)

Abstract

:
Drought represents significant environmental stress, and improving agriculture water management and yield is a priority goal. The effect of diminishing soil water content in the grain filling (GF) stage, throughout physiological maturity (GM), on the yield and grain quality, leaf water potential (LWP), and maximum quantum yield (Fv/Fm) in four long photoperiod quinoa genotypes was evaluated in the South-Central zone of Chile, during the 2014–2015 and 2015–2016 seasons. Five irrigation treatments (T) were established. Irrigation was carried out when the available water (AW) of the root zone reached values of 100%, 70%, 40%, 20%, and 0%. The lowest LWP values were obtained by T20 and T0 (−1.95 MPa). The ‘Morado’ genotype reached the lowest LWP at both seasons, while the highest average LWP was achieved by the ‘AG 2010’ (2014–2015) and ‘Cahuil’ genotypes (2015–2016). A global trend of Fv/Fm values was observed from GF to GM: 0.74 toward 0.79 (2014/2015), and 0.74 toward 0.82 (2015/2016). Only during the second season, Fv/Fm showed differences among irrigation treatments. Total average grain yields in the second season (2.97 t ha−1) were greater than those in the first season (1.43 t ha−1). In both seasons, the ‘Cahuil’ genotype and T100 reached the highest yields. A significative decrease in yield was observed when AW diminished. A direct relationship between seed yield and leaf water potential (ΔY/ΔLWP) was found in all genotypes, varying between 5.53 (‘Cahuil’) and 2.86 t ha−1 MPa−1 (‘AG 2010’). Total proteins, albumins, and globulins varied between seasons, with almost no differences among irrigation treatments. Only the ‘Morado’ genotype showed a slight trend to obtain a higher content of total protein in both seasons. It is possible to grow quinoa under irrigation deficit conditions between GF throughout GM, maintaining yield parameters and nutritional quality.

1. Introduction

Drought has devastating effects on agriculture and economy [1,2], reduces the morphological and physiological traits, diminishes the leaf water potential and sap movement, and alters the xylem anatomical features in plants [3]. Drought and high temperature are also especially considered as key stress factors with high potential impacts on crop yield [4]. Due to the water scarcity that exists in a large part of the world, it is necessary to select crops that are tolerant to this condition. According to Zurita-Silva et al. [5], quinoa is characterized by its exceptional nutritional qualities, its adaptability to different agroecological conditions, and its contribution to diets, especially under food scarcity and malnutrition conditions [6,7]. Quinoa is also characterized by its high diversity of ecotypes, which depend on the edaphoclimatic conditions of the sub-centers of diversity; therefore, the ecotypes adapt to different soil and environmental conditions [8]. Additionally, quinoa is a multipurpose plant [9] as its seeds and leaves are considered as human food, animal feed, cover crops, and phytoremediation tools for environmental cleaning [10]. Therefore, the cultivation of quinoa is projected as an alternative to be incorporated in the crop rotation in different areas, especially where drought events occur and where there is a presence of salinity in the soil. Physiological, biochemical, and morphological responses of quinoa have been shown to indicate that it has a high tolerance and plasticity to various adverse abiotic conditions [10,11].
One of the most recurrent abiotic factors is drought, where quinoa has proven to be a tolerant crop [10]. Hence, in some varieties grown on different types of soil, the reduction in water availability did not imply a significant reduction in yield [12,13]. On the other hand, a high morphological and yield variability was found under different water regimes [14]. In response to the water deficit, the physiological parameters of the plants are altered; however, the quinoa plant is capable of having stable parameters, such as the leaf water potential and the chlorophyll fluorescence, maintaining a high water use efficiency [15,16,17]. According to Maxwell and Johnson [18], the measurement of the fluorescence provides information about the ability of a plant to tolerate environmental stress and how this could damage the photosynthetic apparatus. The most significant yield reduction as a result of water deficit is in the phenological state of grain filling in wheat, rice, corn, and quinoa [19,20,21]. Studies carried out on the varieties of quinoa from the coastal and highlands zones show that the yield is not affected in the variety of the coast, due to water deficit through the grain filling phenological period. However, for the highlands varieties, the yield was altered [22]. A relevant aspect in previous work is that two or three varieties are normally compared for a particular environment [22,23,24,25,26], where the majority of the research has been conducted in the highlands [27,28,29,30].
In general, quinoa displays a favorable behavior against different abiotic stresses. However, there is little information under Mediterranean conditions that relate the response of quinoa to water stress in a determined phenological period, such as grain filling [22,31]. Normally, in a mild Mediterranean environment, drought occurs late in the irrigation season corresponding with the most susceptible phenological stages of the crop [29]. The aim of this research was to evaluate the response of four long-day quinoa genotypes subjected to differential irrigation regimes from the beginning of grain filling throughout physiological maturity. The yield and quality of seeds, leaf water potential, and chlorophyll fluorescence were evaluated under field conditions in the Central Valley of Chile, where these phenological periods coincide with the drought season.

2. Materials and Methods

2.1. Experimental Site

The experiment was carried out in Chillan at ‘El Nogal Experimental Station’ (36°35′43.2″ S, 72°04′39.9″ W and 140 m.a.s.l.), which belongs to Universidad de Concepcion, located in the province of Punilla, Ñuble Region, Central Valley of Chile, in the growing seasons of 2014–2015 (first season) and 2015–2016 (second season) under field conditions. The soil in the site of the experiment is flat, with a silty loam texture belonging to the Arrayan series, a medium thermal family of Humic Haploxerands, with a medium texture, an average bulk density of 1.3 Mg m−3, field capacities ranging from 0.33 on the surface to 0.35 m3 m−3 at a depth of 1.2 m, and a permanent wilting point of 0.26 m3 m−3 on the surface varying at 0.25 m3 m−3 in depth [32], as determined by the pressure plate method [33]. The soil has good internal drainage, and the presence of a water table was not detected up to 2.0 m in depth. The study area presents an average annual precipitation of 1035 mm, concentrated between the months of May and August, and a dry period of four to five months. The weather of the area corresponds to supra-thermal warm mild Mediterranean, with a dry sub-humid humidity regime, an average annual temperature of 13.4 °C, an average maximum temperature of 29.5 °C in January, and an average minimum temperature of 3.5 °C in July [34]. Air temperature, solar radiation, relative humidity, and precipitation were recorded in a meteorological station (Data logger ThiesClima model DLx-Met, AdolfThies GmbH & Co., Göttingen, DE-NI) located onsite (Figure 1).
Cumulative thermal time or growing degree-days (GDDAcc) for each season were estimated using:
G D D A c c = i = 1 n   T M A X + T M I N 2 T B Δ t    
where the unit of G D D A c c is degree-days, T M A X is the maximum daily air temperature, T M I N is the minimum daily air temperature, T B is the base temperature (3.5 °C as indicated by Bertero [35]), Δ t is the time step (one day), and n is the number of days.

2.2. Experimental Design

A completely randomized block experimental design was established, with a divided plots arrangement and four replicates. The treatment in the main plot corresponded to the level of available water (AW) in the root zone, from the beginning of the grain filling stage throughout physiological maturity. Five irrigation application treatments were established when the soil in a 60 cm-deep root zone reached 100%, 70%, 40%, 20%, and 0% of AW (T100, T70, T40, T20, and T0, respectively). Equation 2 was used to determine AW:
A W = i = 1 2 θ i a w c θ i p w p Δ Z i i = 1 2 θ i f c θ i p w p Δ Z i × 100
where θ i is the soil water content in a 0.3 m deep root zone ( Δ Z i ), and the superscripts indicate the actual water content ( a w c ) measured by a neutron probe, as well as the water content at the field capacity ( f c ) and permanent wilting point ( p w p ) in m3 m−3. AW was calculated in a total 0.6 m deep root zone ( i = 2 ).
The sub-plot corresponded to four quinoa genotypes: Regalona, AG 2010, Cahuil, and Morado, which correspond to sea-level type cultivars. Each experimental unit consisted of 4 rows with a length of 5 m, spaced 0.5 m apart. The quinoa genotypes used correspond to long-day [35], which is important as most of the research is carried out with short-day quinoa plants [25,29].

2.3. Management of the Experiments

The trial was established on 5 October 2014, in the 2014/2015 season, and on September 20, 2015, in the 2015/2016 season. The dose of seeds was 15 kg ha−1, and once the six true leaves were reached, seedlings were thinned, leaving 12 plants per linear meter. The application of fertilizers was carried out according to the soil analysis. Phosphorus was applied and incorporated at the moment of soil preparation at 4 cm deep in the last tilling before sowing, in doses of 100 kg of P2O5 in the form of Ca(H2PO4)2 and 50 kg of K2O ha−1 using K2SO4. The application of nitrogen was 160 kg N ha−1, applied as CO(NH2)2 in two partialities: 50% in the stage of the second true leaf, and the other 50% at the beginning of the reproductive stage.
Broadleaf weeds and grasses were controlled with glyphosate (N-(phosphonomethyl) glycine) in pre-emergence, applying 0.96 a.i. L ha−1. After the emergence of the quinoa plants, all the weeds were manually controlled.
The irrigation system was installed after the emergence of the quinoa plants. The water was applied with irrigation tape with drippers every 10 cm and with an average flow rate of 5 L m−1 h−1 throughout the season from sowing until the beginning of the grain filling phenological stage, and experimental units were irrigated each time the soil moisture reached 70% of the AW at the root depth. To homogenize the soil water content before starting with the differential irrigation treatments, the experimental field was irrigated until achieving field capacity in a 1.0 m deep root zone.

2.4. Evaluations

The soil water content was measured with a neutron probe (CPN, 503-DR Hydroprobe, Campbell Pacific Nuclear International, CA, USA) previously calibrated onsite. Eighty access tubes 1.2 m deep were installed at the center of each experimental unit. The soil moisture content was determined weekly from the emergence of the plant to the grain filling stage. Once differential irrigation was initiated at the beginning of the grain filling stage, the soil moisture content was determined three times per week, at depths of 0–0.30, 0.30–0.60, 0.60–0.90, and 0.90–1.20 m.
The leaf water potential (LWP) was determined through the Scholander pressure chamber (Eijkelkamp 3000). For each experimental unit, an undamaged leaf from the upper middle third of the plant, exposed to the sun, was cut and covered immediately with a plastic bag and aluminum foil to avoid loss of water by evaporation, determining the LWP while still covered with the bag.
The behavior and performance of the photosynthetic apparatus of the plants were determined by recording the chlorophyll fluorescence, using a portable fluorometer (OS5p+, Opti-Sciences, Hudson, NH, USA). Chlorophyll fluorescence was measured in the upper leaves’ middle third of the plant. With the recorded data, the maximum quantum yield was obtained (Fv/Fm), where Fv is the difference between the maximum and minimum fluorescence after adapting the plant to darkness. The maximum fluorescence (Fm) is measured during the first saturation pulse after the adaptation of the plant to darkness. The Fv/Fm ratio estimates the maximum portion of the absorbed light that is used in the reaction centers of the photosystem II (PSII). That represents the maximum potential of quantum efficiency of the PSII, where the optimal values vary between 0.79 and 0.83, and lower values could be an indicator of some types of stress in the plant [18].
LWP and fluorescence measurements were carried out once a week on average in the first season and every two days in the second season, between 12:00 and 15:00 civil time, in all the experimental units, once 50% of the plants reached the phenological state of the beginning of grain filling. This measurement period until physiological maturity lasted 20 days in the 2014–2015 season and 30 days in the 2015–2016 season.
The harvest was carried out once 50% of the panicles had reached physiological maturity. Once harvested, the plants were left to dry in the open air until reaching constant weight (approximately 7 days), to then be threshed in stationary equipment (Bill’s Welding Pullman, WA, USA). The yield was determined by weighing the harvested seed in 1.0 linear meter of the two central rows of each experimental unit. Additionally, quantification of the total proteins, albumin and globulin, and other proteins contained in the seeds was performed as described by Fischer et al. [31].

2.5. Statistical Analysis

A combined analysis was carried out based on a randomized complete blocks design with divided plots, to which analysis of variance (ANOVA) was performed, and when significant differences were found between the treatments, the results were subjected to the multiple comparison LSD test (p = 0.05) with SAS University Edition (SAS/STAT v 9.3) (SAS Institute, Cary, NC, USA).

3. Results

3.1. Environmental Conditions

Relating temperature to the crop growth stages is important because the average temperature increments and increased frequency of extreme high-temperature events may reduce crop yields [36]. The plant growth cycles (from sowing to harvest) in the 2014/2015 and 2015/2016 seasons were 129 and 135 days, respectively. The days after sowing (DAS) to grain filling in the 2014/2015 and 2015/2016 seasons were 87 and 89 days, respectively, and the DAS to physiological maturity were 107 (2014/2015) and 116 (2015/2016) days. Differences in the weather conditions between the two seasons were observed. During the first growing season, the average maximum air temperature was 25.1 °C, while in the second season, it was 22.5 °C. In addition, the absolute TMAX in the 2014/2015 season was 34.0 °C and, in the 2015/2016 season, it was 33.5 °C. Solar radiation in the 2014/2015 season was 2584 MJ m−2 season−1 and, in the 2015/2016 season, it was 2806 MJ m−2 season−1.

3.2. Water Availability Treatments

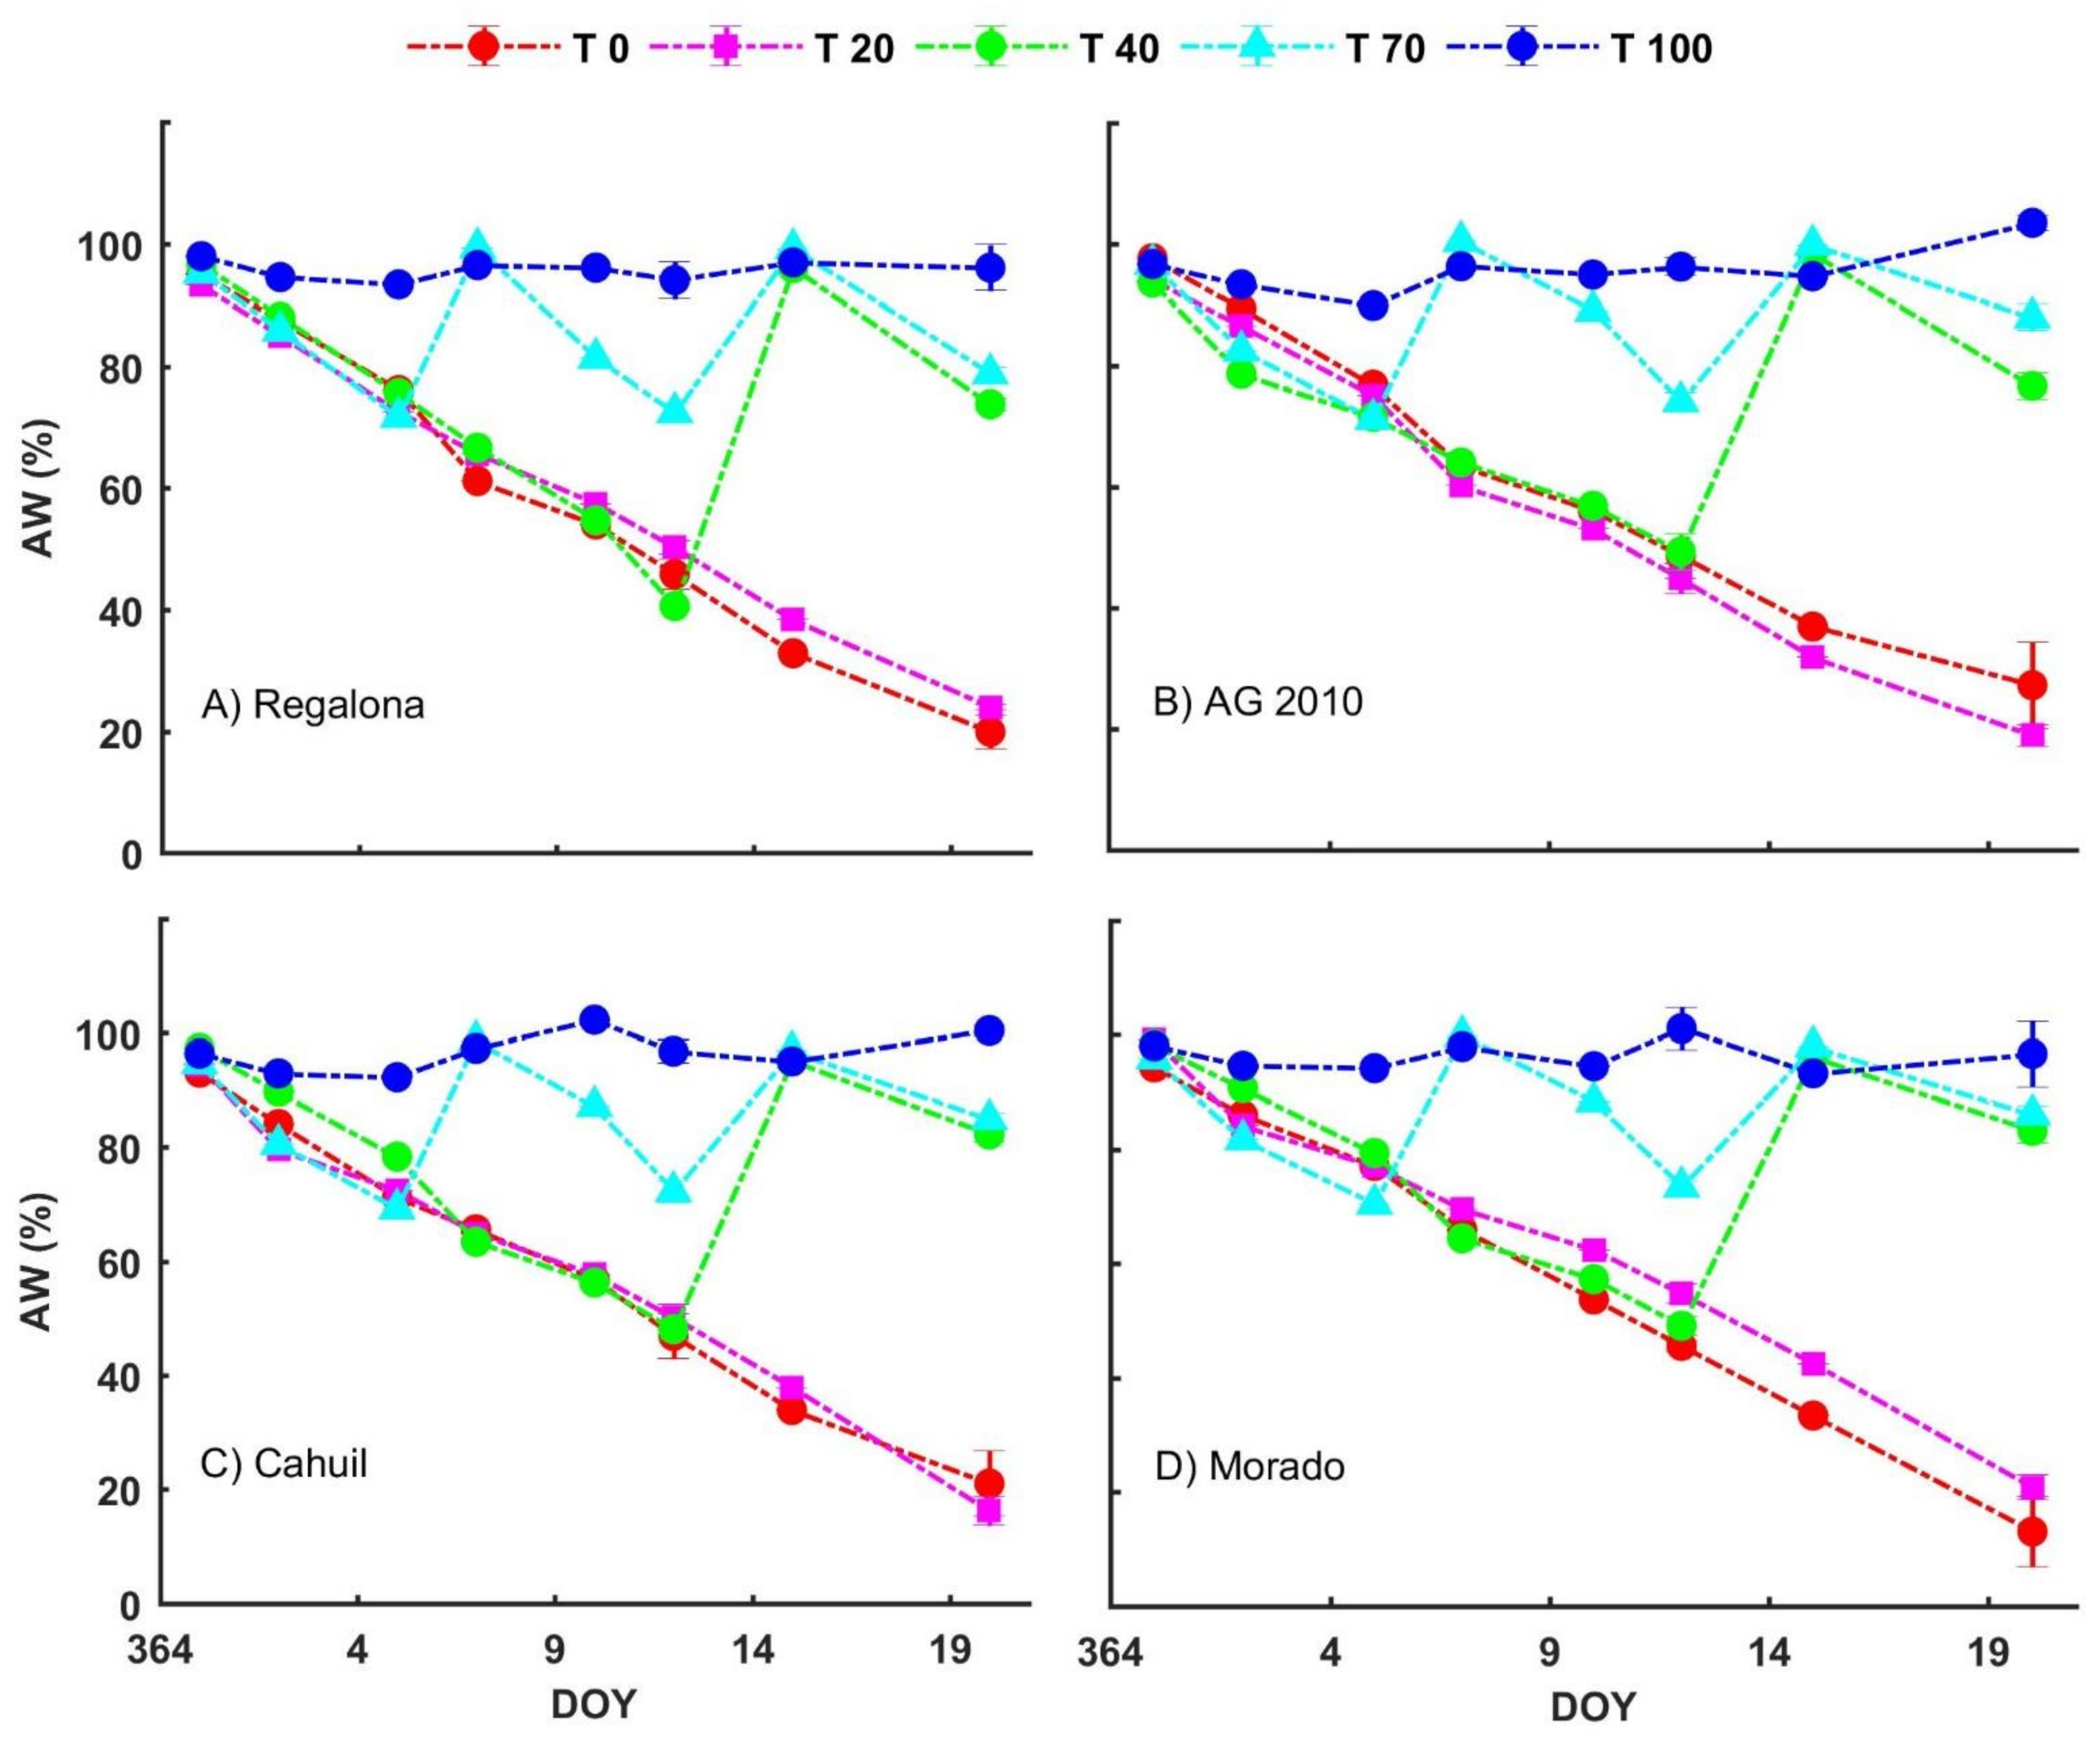
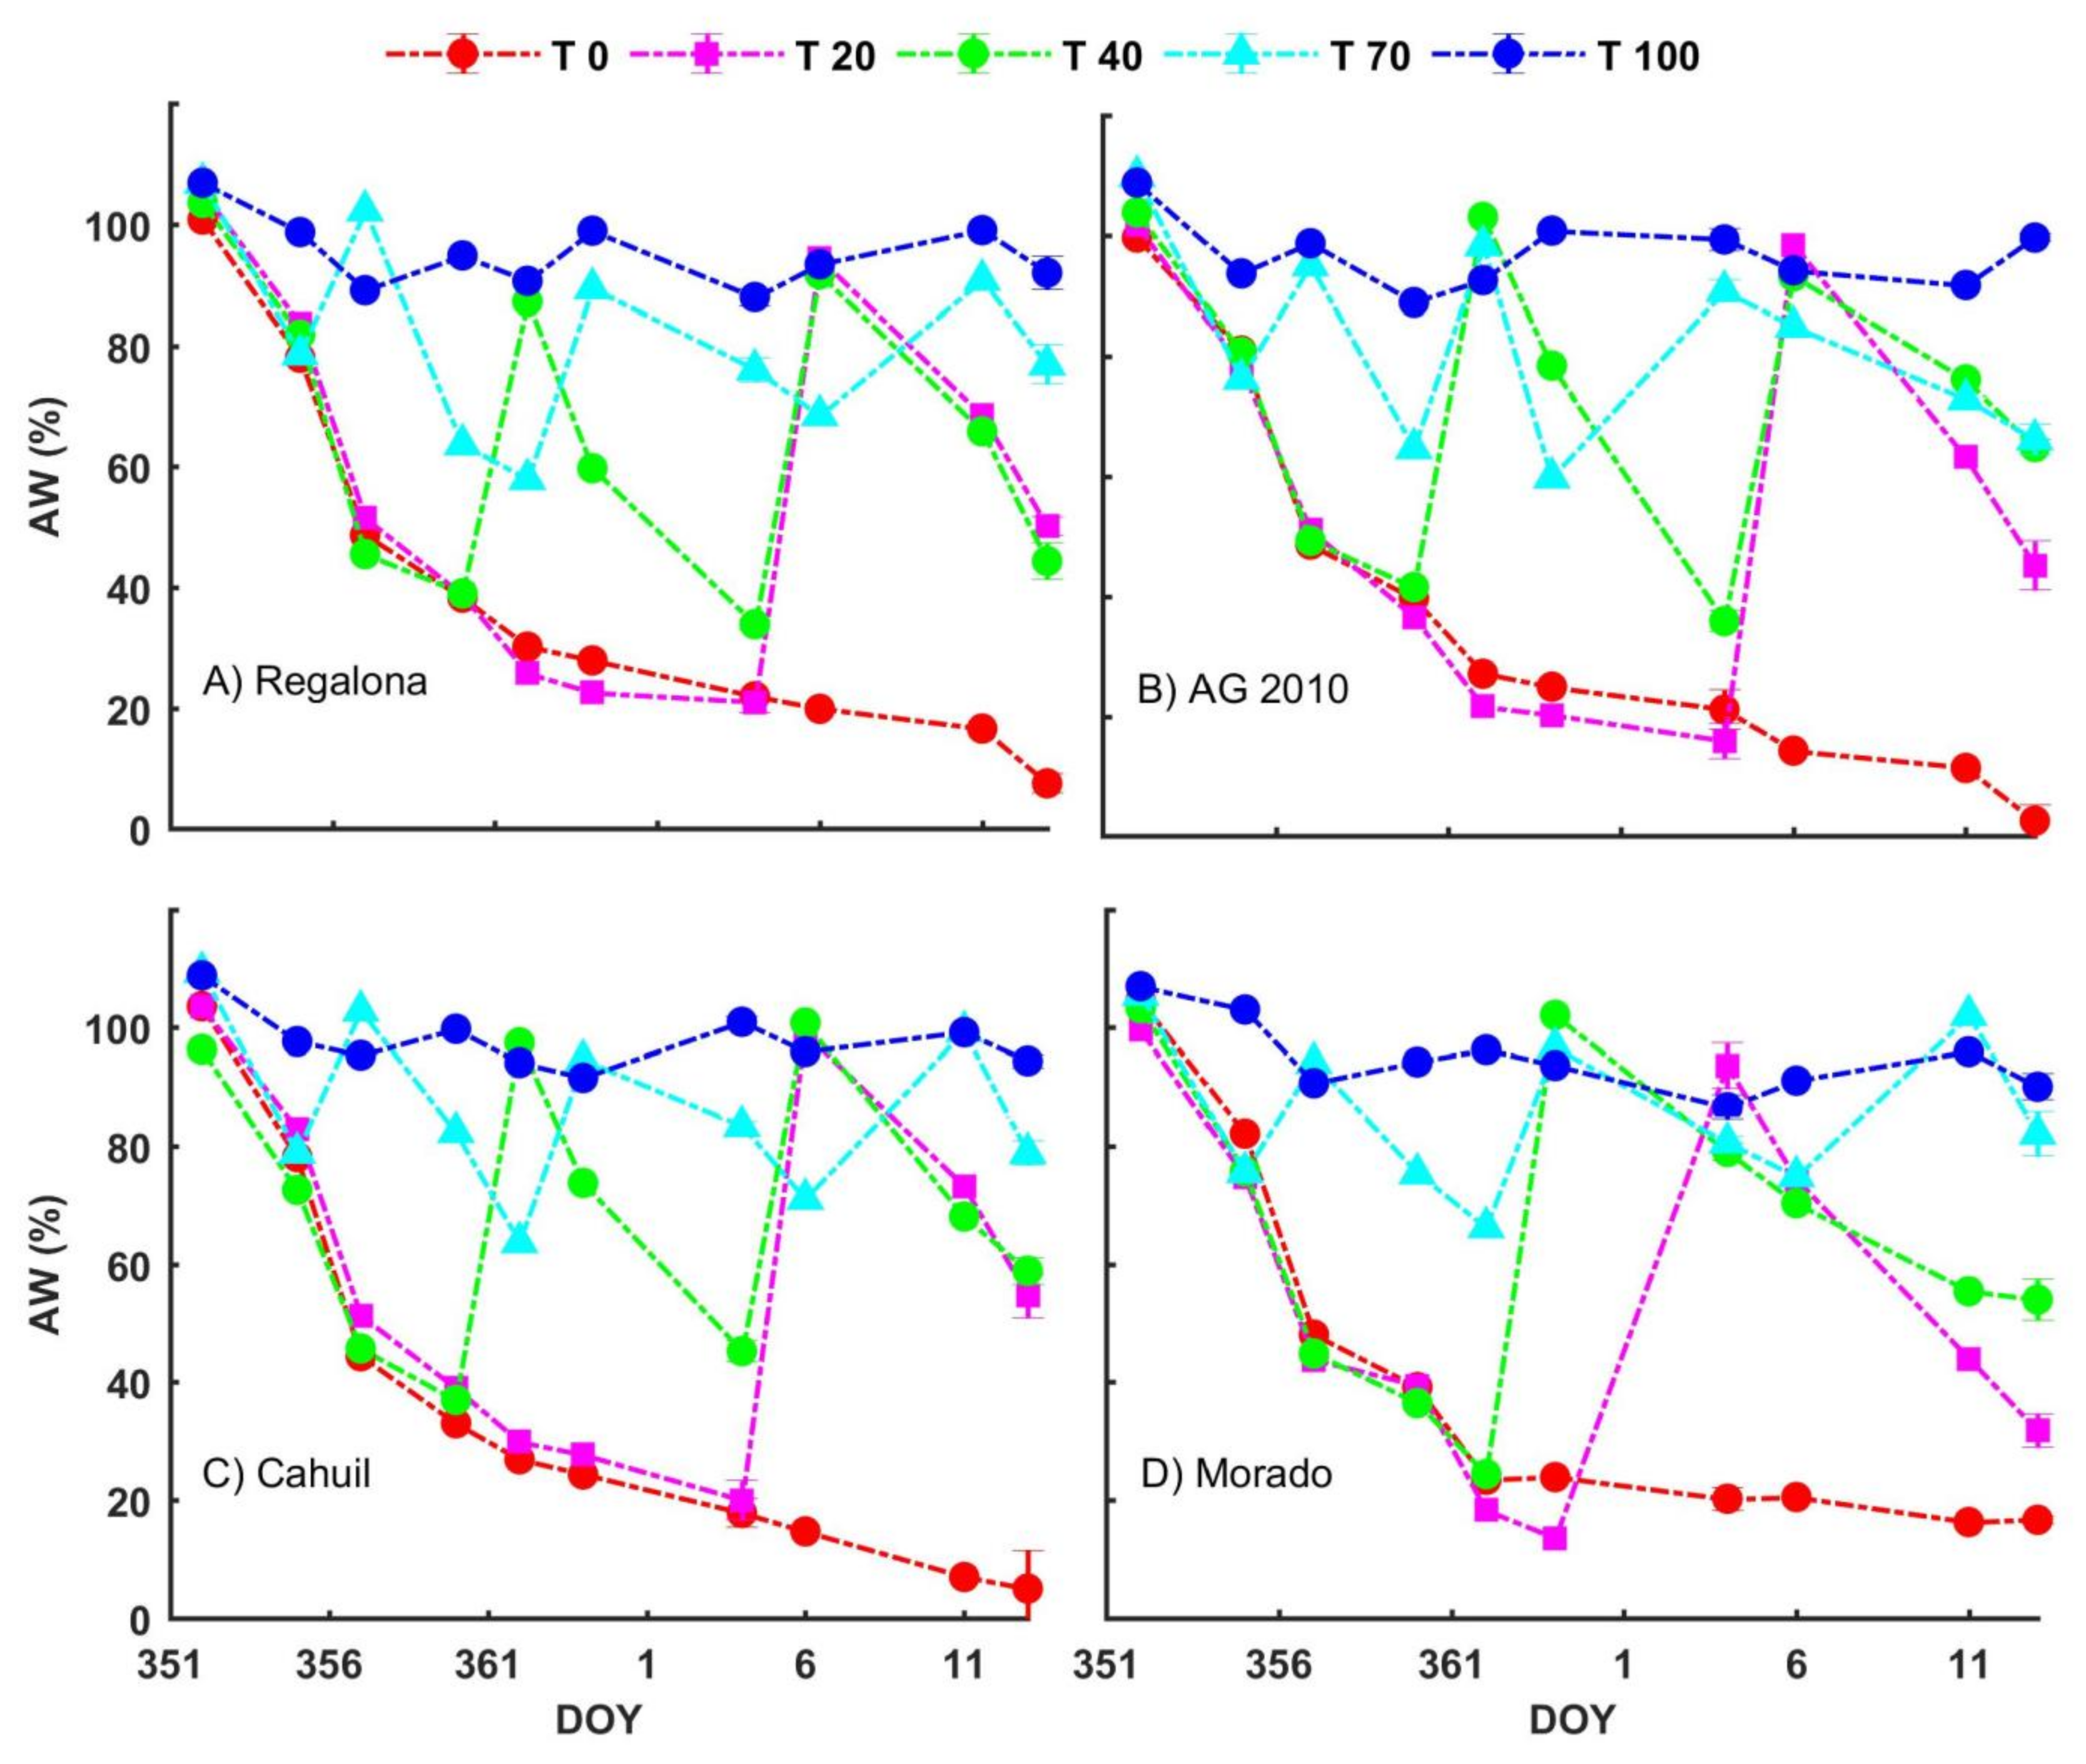
Regarding the evolution of the water content in the soil, the established criteria for the management of available water on the soil for the treatments were reached. In both seasons, severe stress levels were reached for the treatments with 0% AW and 20% AW. It was observed that the 100% AW treatment maintained values between 95 and 100% AW in both seasons, maintaining an adequate available water level in the soil for the development of the crop. In summary, in the 2014/2015 season, five irrigations were applied in the T100 treatment, two in the T70, one in the T40, and nil in the T20 and T0. In the 2015/2016 season, seven irrigations were applied in the T100, three in the T70, two in the T40, one in the T20, and nil in the T0. For the four genotypes, similar irrigation regimes were accomplished in both seasons. The application period of the water availability treatments, from the beginning of grain filling throughout the physiological maturity stages, lasted 20 days in the 2014–2015 season and 30 days in the 2015–2016 season (Figure 2 and Figure 3, respectively).

3.3. Leaf Water Potential (LWP)

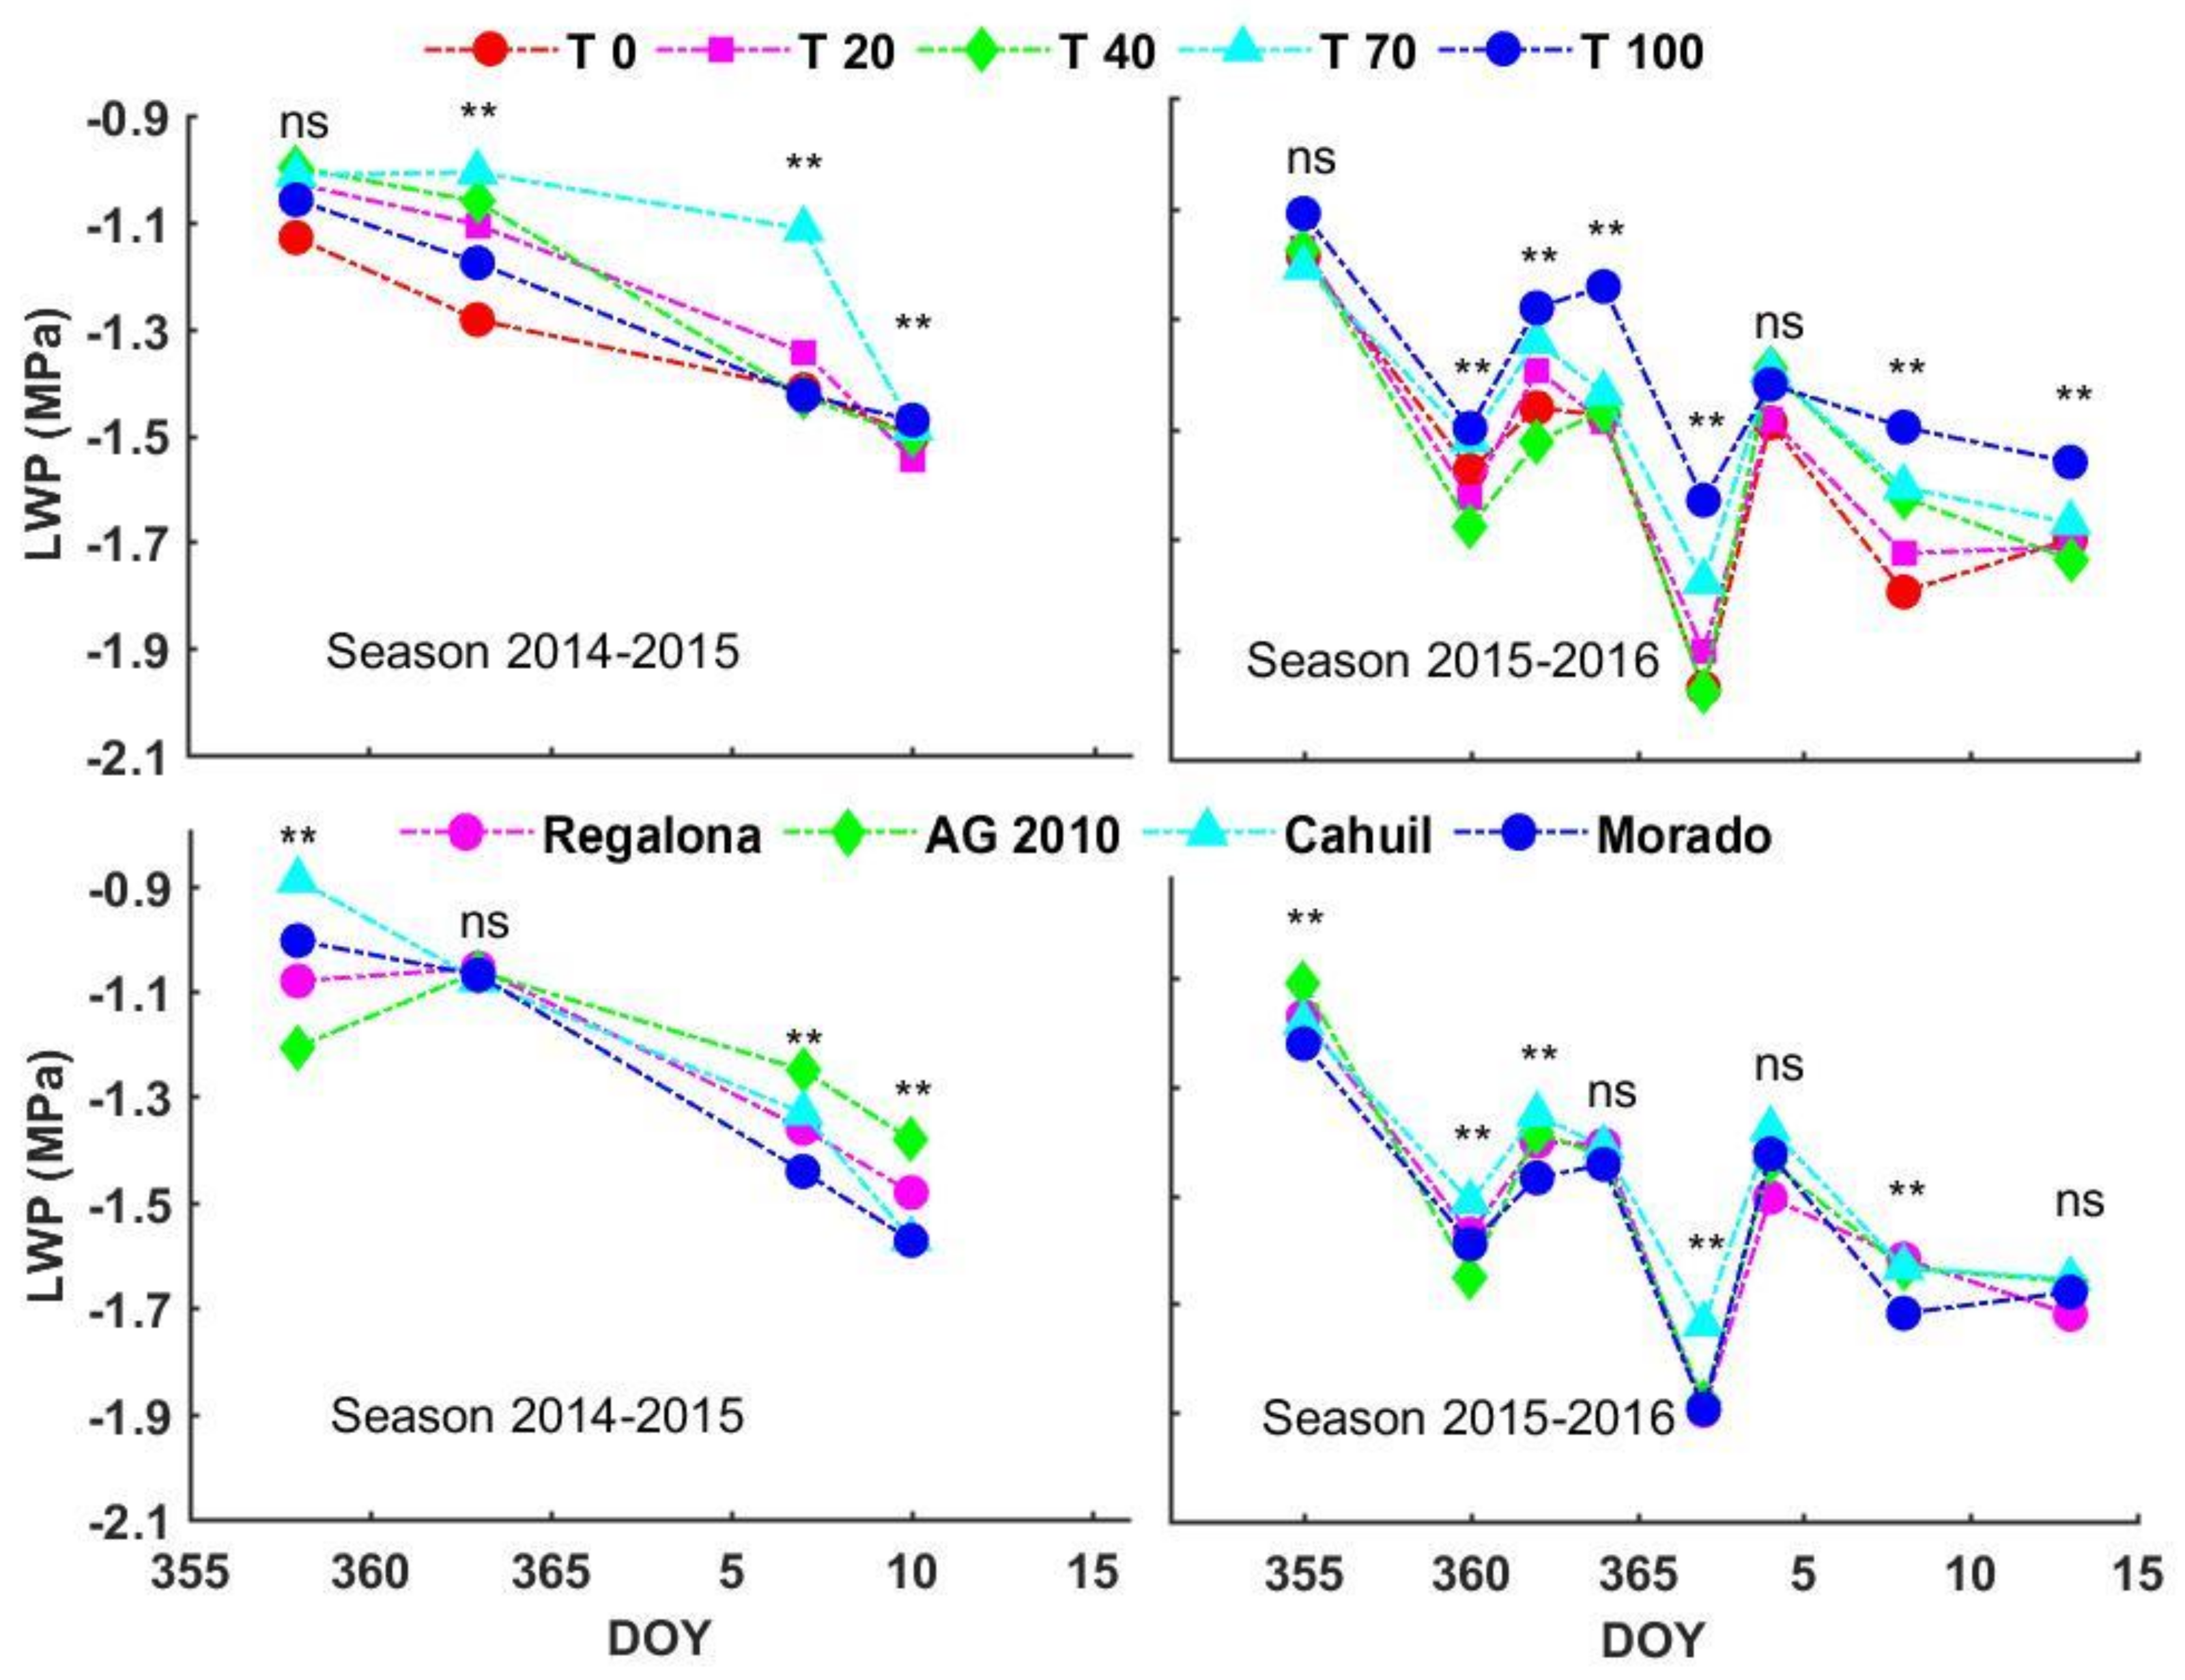
The LWP diminished throughout the period from grain filling to physiological maturity, with this decrease being more noticeable in the first season (Figure 4). The highest value of LWP was obtained at the beginning of the grain filling stage in both seasons when the soil moisture in all treatments was close to field capacity. In the 2014/2015 season, the lowest values of LWP were obtained by the T20 treatment, while in the 2015/2016 season, they were for T0, T20, and T40. In the 2014/2015 season, at the beginning of the water availability treatments (DOY 358), an average LWP of −1.04 MPa was recorded, while, at the end of the season (DOY 10), an average LWP of −1.50 MPa was measured (Figure 4). In the 2014/2015 season, the trend in highest LWP was recorded in T70 and the lowest in T0. In the 2015/2016 season, the LWP varied between −1.11 and -1.95 MPa on average, with a trend of higher LWP in the T100 treatment and lower in the T0, T20, and T40 treatments. On average, at the end of the season, in DOY 13, an average LWP of −1.58 MPa was recorded.
In both seasons, there were no interactions determined between the treatments and genotypes (p ≤ 0.05). However, there were significant differences (p ≤ 0.05) between AW treatments (Figure 4) for some LWP measurement days. However, it was not always possible to establish a direct relationship with the availability of water in the soil.
Although there were significant differences (p ≤ 0.05) between the genotypes on different dates of both seasons, a clear trend in the LWP values was not observed. It was determined that the LWP decreased in all genotypes throughout both seasons, with the ‘Morado’ genotype reaching the lowest values of LWP (−1.55 MPa). In the 2014/2015 season, the highest LWP values were achieved by the AG 2010 genotype (−1.2 MPa average). However, in the 2015/2016 season, the highest values were recorded by the ‘Cahuil’ genotype (−1.53 MPa average).

3.4. Chlorophyll Fluorescence

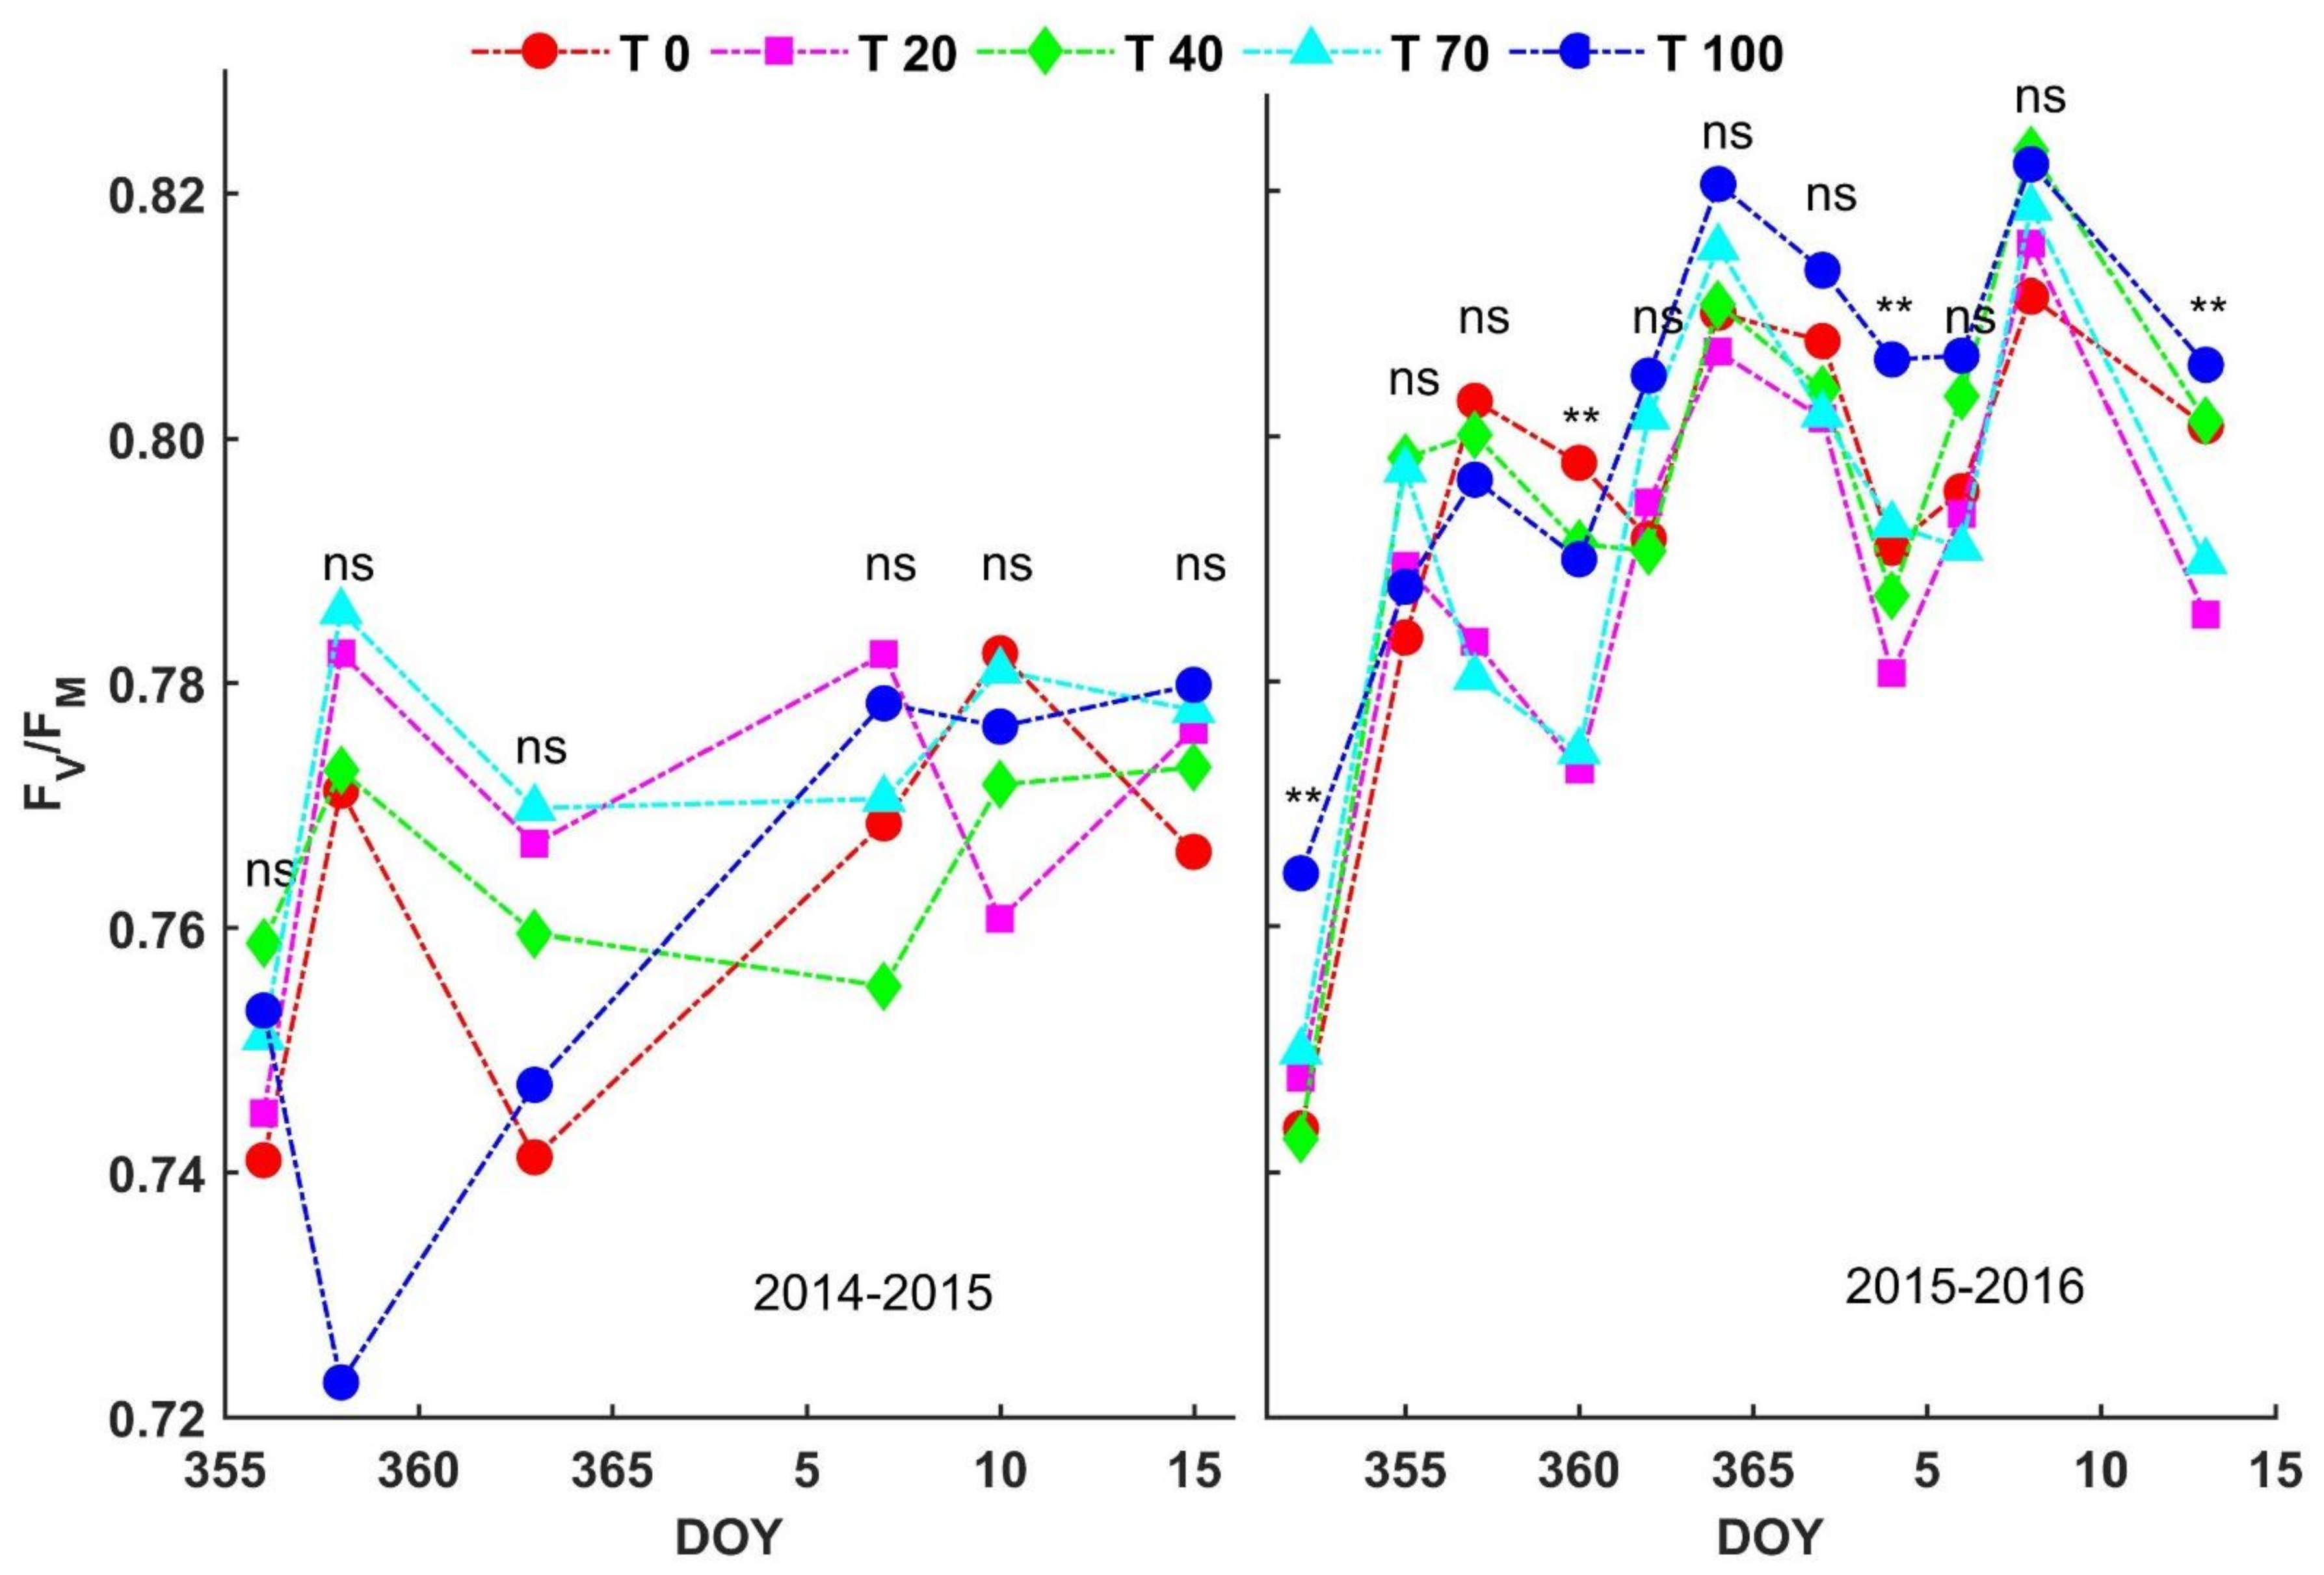
Figure 5 shows the maximum quantum yield (Fv/Fm) obtained by the AW treatments in both seasons. The statistical analysis revealed that there was no interaction between the AW treatments and genotypes in both seasons. In the 2014/2015 season, the Fv/Fm values of all AW treatments varied between 0.74 and 0.79, and in the 2015/2016 season, the Fv/Fm values varied between 0.74 and 0.82. The normal ranges considered for this Fv/Fm index vary between 0.79 to 0.83 [18], which would indicate that in the 2014/2015 season, values below the optimum were recorded, and in the 2015/2016 season, a better performance of the plant photosynthetic apparatus was obtained in all water availability treatments. In general, in the 2014/2015 season, there was a global trend toward lower Fv/Fm values than in the 2015/2016 season. Since DOY 362 of the 2015/2016 season, in all genotypes, the Fv/Fm values remained within the normal ranges for this index, showing that the PSII reaction centers were not damaged by stress or that they performed within normal parameters, despite the applied water stress.
In the 2014/2015 season, there were no differences (p ≤ 0.05) between the genotypes, while in the 2015/2016 season, the ‘Morado’ genotype showed a trend to values above the other genotypes (data not shown).

3.5. Seed Yield

Table 1 shows the seed yield obtained by the five AW treatments and four quinoa genotypes, in both seasons. There were statistical differences between seasons (p ≤ 0.05), recording greater yields in the second season for all treatments and genotypes examined, for which the data are presented separated by year. There were no interactions between the treatments and genotypes.
In both seasons, T100 reached the highest yields. In the 2014/2015 season, there was a decrease in the yield of 76% in T0, 54% in T20, 42% in T40, and 24% in T70, compared to T100. In terms of the genotypes, ‘Cahuil’ is that with the highest yield, differing statistically only from the ‘Morado’ genotype, which obtained a 34% lower yield.
In the 2015/2016 season, the water availability treatments maintained the yield trend; however, the magnitude of the decrease was to a smaller extent. Regarding T100, the T0 treatment obtained a decrease of 21%, T20 of 24%, T40 of 9%, and T70 of 12%. The yields of the ‘Cahuil’ and ‘Morado’ genotypes were significantly higher than those of the other genotypes. Therefore, the ‘Regalona’ and ‘AG 2010’ genotypes obtained 14% and 30% lower yields than the ‘Cahuil’ genotype did. In both seasons, the results indicate that, under greater water restriction conditions (T0 and T20), there is less grain production. In terms of the yield, the ‘Cahuil’ genotype obtained the highest yield in both seasons.
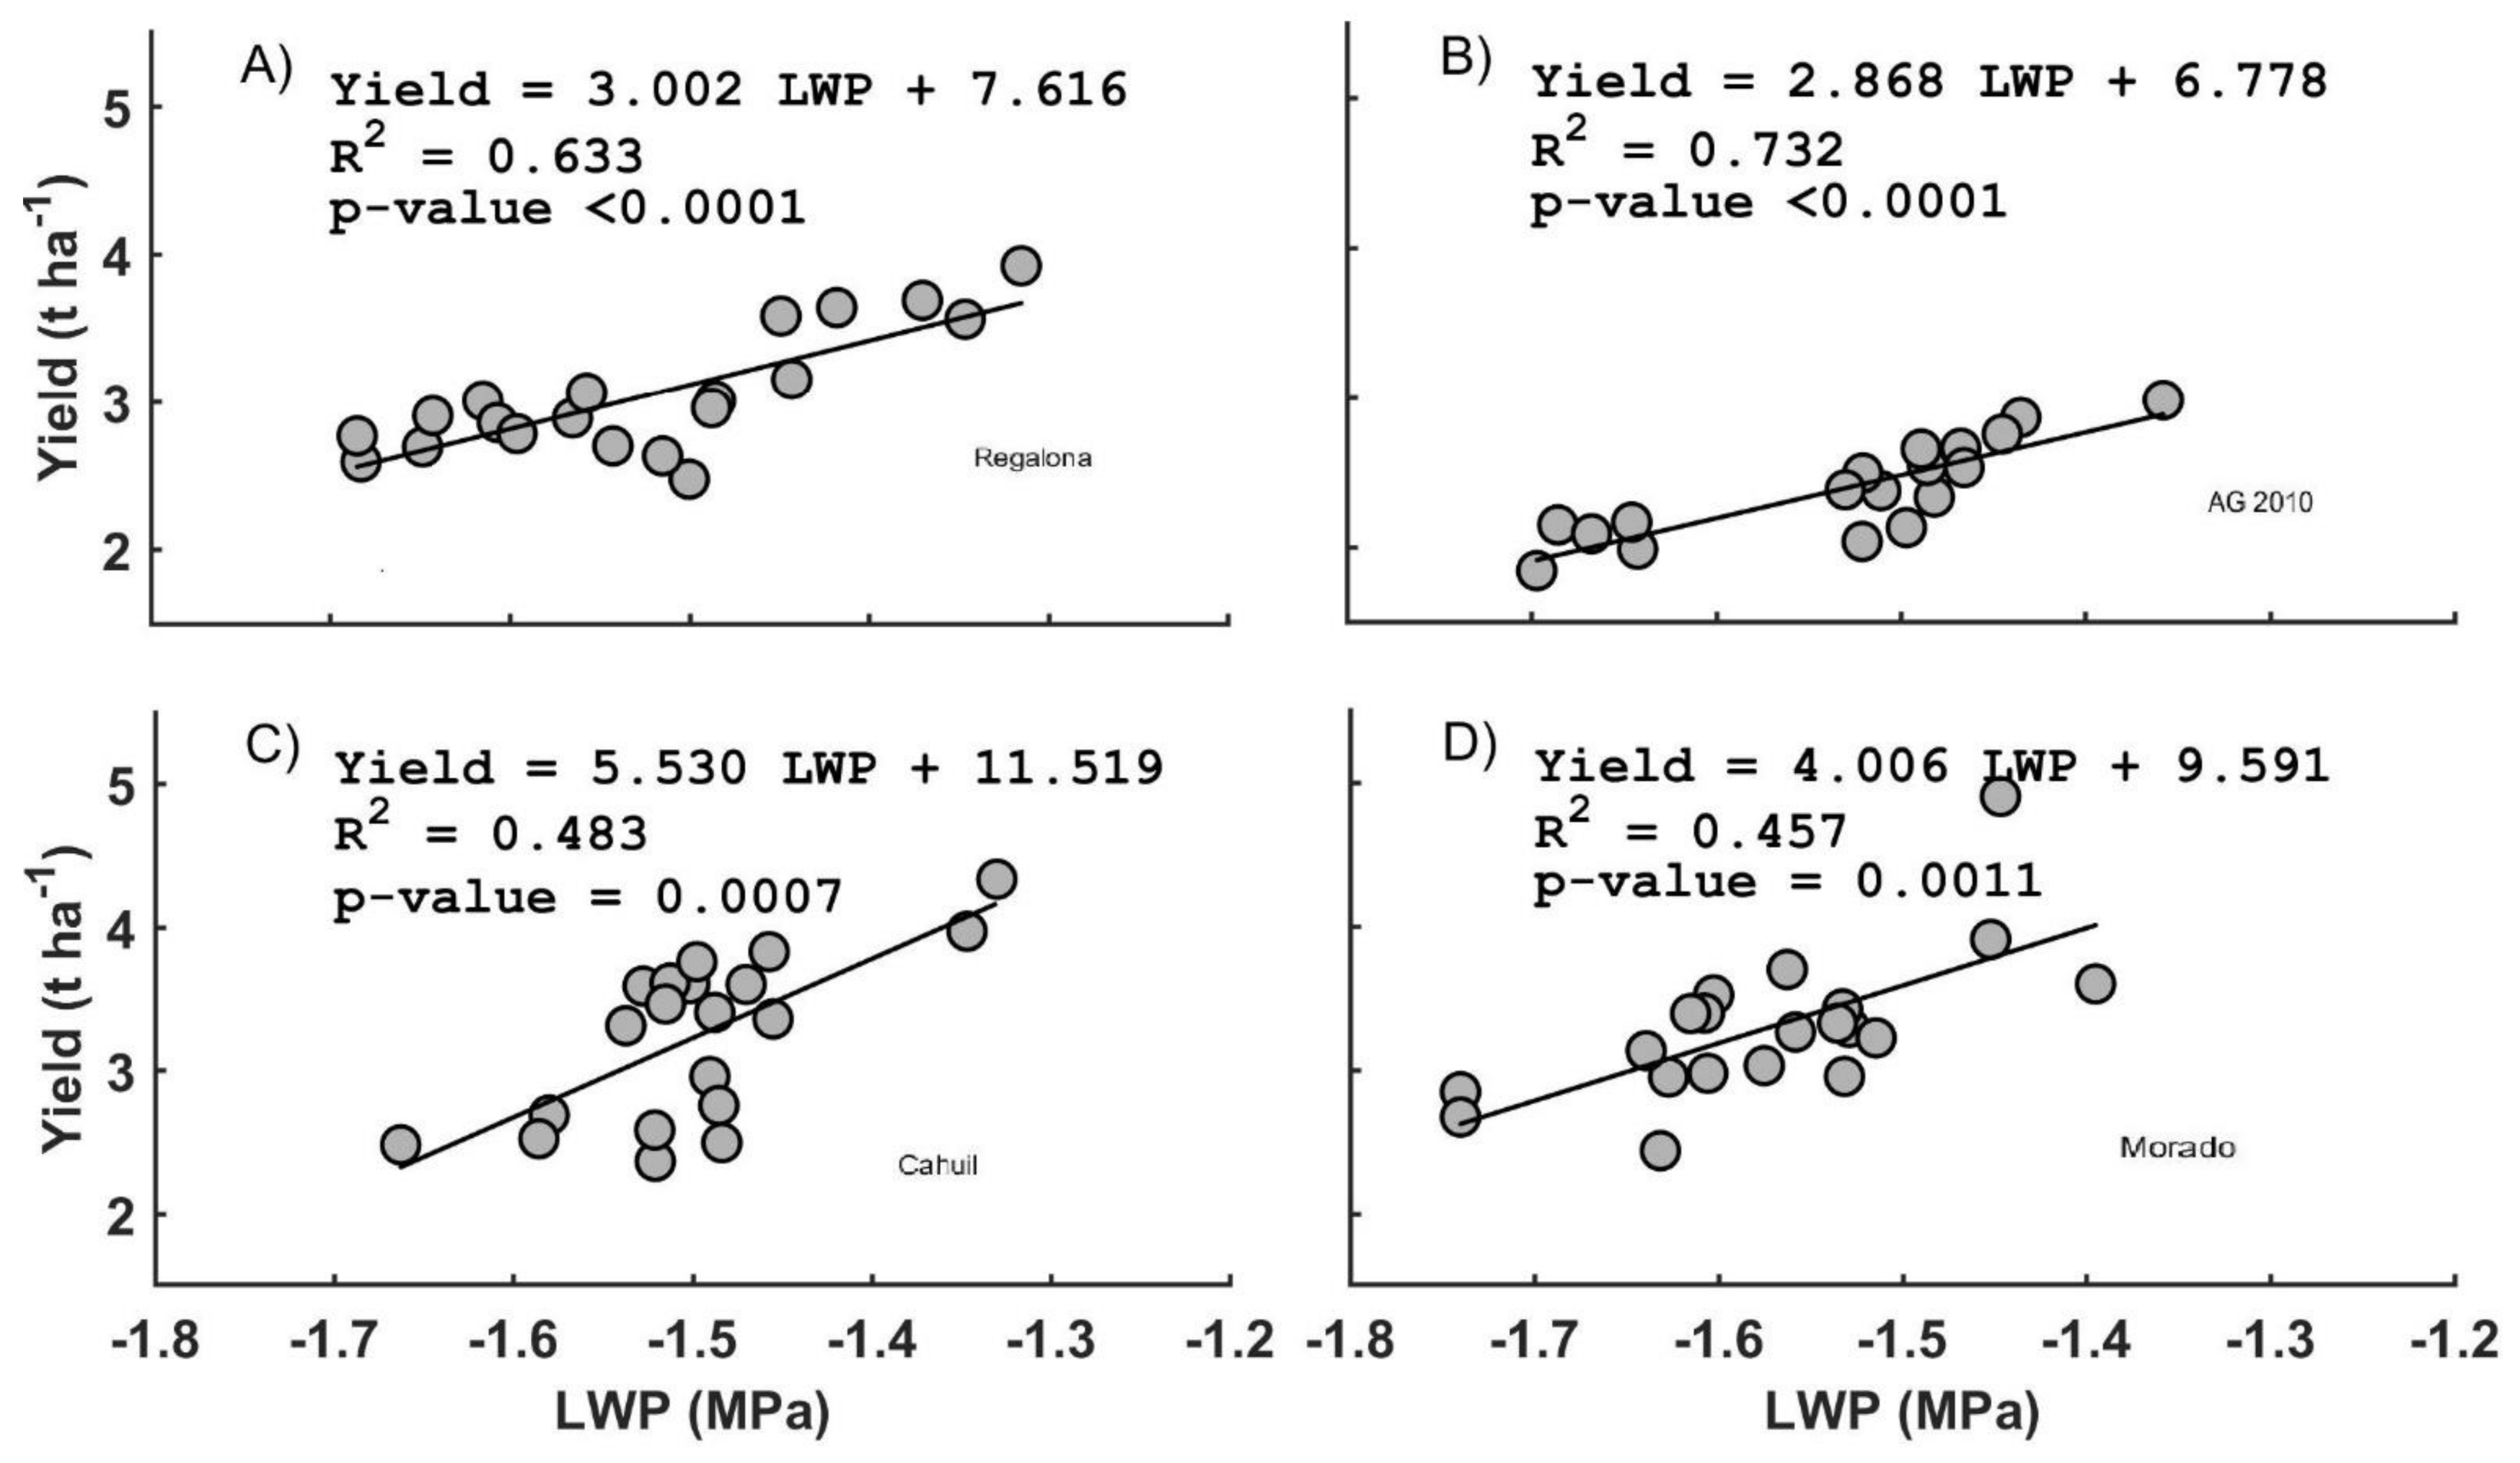
In general, seed yield decreases as LWP decreases, a situation clearly observed in the 2015/2016 season (Figure 6), but not in the first season (data not shown). Regarding LWP, it was observed that the genotype that reached the lowest values was ‘Morado’.
It was observed that the yield of the ‘AG 2010’ genotype, despite having a LWP variation similar to those of the other genotypes, was lower than those of the other genotypes. The ‘Morado’ genotype is highlighted, which had more limited LWP values (between −1.4 and −1.7 MPa) with higher yields than those of the ‘AG 2010’ genotype. Similarly, the ‘Regalona’ and ‘Cahuil’ genotypes obtained high yields associated with higher LWP values in the treatments that were not subjected to severe water stress in the phenological period of grain filling to physiological maturity.

3.6. Protein Content

Average total protein contents (TP) of 13.42 and 10.88 g 100 g−1 of seeds were determined in the 2014/2015 and 2015/2016 seasons, respectively. The TP content observed in the 2015/2016 season was 19% lower than that registered for the 2014/2015 season (Table 2).
In the 2014/2015 season, the highest TP content registered was in T40 (14.0 g 100 g−1), but not different (p > 0.05) regarding T100 and T70. However, the differences determined (p ≤ 0.05) were related to T20 and T0. The lowest content was observed in T20 with 12.5 g 100 g−1. The TP content registered for T40 did not differ from the control treatment without water stress (T100), and it was 9% higher than the treatment with less water availability (T0). Meanwhile, the highest TP content registered by genotype in the 2014/2015 season was the ‘Morado’ genotype with 13.9 g 100 g−1. The TP content reached by ‘Morado’ was 12% higher than that determined for the ‘AG 2010’ genotype, which obtained the lowest TP content. In the 2015/2016 season, the maximum TP content was registered in the T100 with 11.2 g 100 g−1, not detecting significant differences (p > 0.05) between the water availability treatments. In this season, the genotype that presented the highest TP content was ‘Morado’ (11.2 g 100 g−1) and registered differences (p ≤ 0.05) only with ‘Cahuil’, with a 5% TP higher content. In general, it was found that the TP content was higher in the 2014/2015 season, where, in turn, the yields were lower.
The average contents of albumin were 33.0 and 34.3 mg g−1 in the 2014/2015 and 2015/2016 seasons, respectively (Table 2). In the 2014/2015, no significant differences (p > 0.05) were found both between the treatments and between the genotypes. For the 2015/2016 season, a higher albumin content was observed for T100 and T40, with 43.5 and 41.5 mg g−1, respectively. The T100 treatment presented differences (p ≤ 0.05) regarding T20 and T0, treatments that obtained 35.7 and 32.3 mg g−1, respectively. The highest albumin content during the 2015/2016 season was registered in the ‘Regalona’ genotype (41.3 mg g−1), which was only statistically different than ‘Cahuil’ (p ≤ 0.05) that registered the lowest albumin content (36.3 mg g−1).
The average contents of globulin extracted were 34.2 and 40.0 mg g−1 in the 2014/2015 and 2015/2016 seasons, respectively. No significant differences (p > 0.05) were found both between the available water treatments and between the genotypes in the 2014/2015 season. For the 2015/2016 season, a higher globulin content was registered in the T100 availability water treatment (44.1 mg g−1) and the lowest content was registered in T20, with 36.7 mg g−1. However, no statistical differences (p > 0.05) were found between the available water treatments. The genotype that presented a higher content of globulins for the 2015/2016 season was ‘Morado’ with 42.2 mg g−1 and was more statistically different (p ≤ 0.05) than the ‘Regalona’ and ‘AG 2010′ genotypes were. The lowest content was registered in ‘Regalona’ with 38.6 mg g−1.
For the fraction of other soluble proteins (Table 2), average contents of 49.7 and 41.8 mg g−1 were quantified for the 2014/2015 and 2015/2016 seasons, respectively. In the 2014/2015 season, the highest content was registered in the T40 treatment, with 51.1 mg g−1. However, T40 was only statistically different (p ≤ 0.05) with T0, whose content of other soluble proteins was lowest (45.5 mg g−1). No statistically significant differences were registered between genotypes. In the 2015/2016 season, the maximum content of other soluble proteins was registered by the T70 treatment (46.1 mg g−1), and no significant differences (p > 0.05) were registered between the five AW treatments. Similarly, no significant differences were found between the four genotypes.

4. Discussion

4.1. Leaf Water Potential

The present study found that when the soil water content decreases, the values of LWP decrease, and they become negative as the water stress is greater and coincides with findings in other studies. As informed by Fghire et al. [24], in quinoa plants irrigated at 100%, 50%, and 33% of the crop evapotranspiration (ETc), and for treatment without irrigation, it was found that the LWP decreased in all treatments with water restriction. Their LWP values in the control plants (100% ETc) were significantly higher than those of the stressed plants, which reached LWP values of −3.0 MPa. Sun et al. [25] found similar values to the present study, observing that quinoa plants subjected to 9 days of water stress and then irrigated increased their LWP to values similar to those from treatments without stress. This plant response showed a recovery of the water status of the crop despite being subjected to severe drought conditions. Razzaghi et al. [37] found that the LWP in irrigated quinoa plants was constant, −0.8 MPa, and when it was subjected to a drought, the LWP values decreased to −2.1 MPa. This decrease in LWP coincides with the results obtained in the present study; nevertheless, for the same period of time in which the plants were subjected to stress, a higher value of −1.5 MPa was achieved.
Jacobsen et al. [38] indicated that as the soil dries, the LWP varies from −0.7 to −2.4 MPa from the vegetative to flowering phenological stages, and it decreases to −3.2 MPa in the stage of seed production (highlands type cultivars). These values are below those found in the present study (sea-level type cultivars). Besides the type of cultivar, the extreme weather conditions and shallow soils with low moisture retention complement the explanation of the differences found with the present research. In other studies [16,17], it was found that after 10 days without irrigation, the LWP value of the quinoa plants remained around −1.0 MPa to decrease afterward to −2.0 MPa. In the present trial, the LWP in the first 10 days of soil water availability treatment remained, on average, above −1.34 MPa (2014/2015 season) and −1.42 MPa (2015/2016 season) to, subsequently, decrease to minima of −1.50 and −1.67 MPa in the 2014/2015 and 2015/2016 seasons, respectively.
In general, the seed yield decreases as LWP decreases (Figure 6). A positive linear relationship and regression slope (ΔY/ΔLWP) was observed in all genotypes that varied between 2.86 (‘AG 2010’) and 5.53 (‘Cahuil’). The genotype that showed a lower ΔY/ΔLWP value would be more resistant to drought conditions, as when water stress occurs, the yield would not appear significantly affected. However, the decrease in yield from T100 to T0 was 21% with the ‘AG2010’ genotype, while it was only 17% with the ‘Cahuil’ genotype, 23% with ‘Regalona,’ and 21% with ‘Morado.’ These results could indicate a generalized adaptation to water stress conditions of the genotypes studied. Even though no information that relates the yield and LWP in quinoa is available, the type of response found has been informed for other crops, such as wheat [39,40].

4.2. Chlorophyll Fluorescence

The LWP values obtained in this study indicate that the plants were subjected to a certain degree of stress, which is also partly explained by the lower values of FV/FM in the first season. However, in the second season, a better performance of the photosynthetic apparatus was obtained in all treatments. This coincides with that described by other authors for quinoa [41,42,43], where the indicators of the photosynthetic capacity of the leaf were insensitive to water stress. Nevertheless, experiments with the ‘Titicaca’ variety conducted in greenhouses [20] indicated that FV/FM decreased as quinoa plants were exposed to drought. Jacobsen et al. [17] indicated that quinoa plants can photosynthesize for a long period with extremely limited irrigation, even for three days once stomata are closed. Furthermore, as a result of the low water requirement, quinoa plants would present the ability to face water scarcity and resume their photosynthetic activity after a drought period [16,17,38]. Therefore, the indices derived from chlorophyll fluorescence could be related to other parameters associated with water stress, such as LWP.

4.3. Seed Yield

In different countries, it has been reported that the yield of quinoa, without water stress conditions throughout its growth period, varies between 1.0 and 4.5 ton ha−1 of seed [6]. Under stress conditions, seed yields of 0.5−1.5 ton ha−1 have been obtained [6,7,24,26,29,44,45]. Razzaghi et al. [13] indicated a yield variation according to the type of soil, with significantly lower yields on sandy soil (2.3 ton ha−1) compared to sandy clay loam (3.3 ton ha−1) and sandy loam soils (3.0 to ton ha−1); however, no significant differences were found between full irrigated and water stress treatments. Al-Naggar et al. [14] found for five well-irrigated quinoa genotypes (820 mm of applied water per season), average yields of 2.1 ton ha−1, in Egypt. However, under conditions of severe water stress (237 mm of applied water), significant decreases in yields from 12% for the CICA-17 genotype to 56% for the QL-3 genotype was observed. In our study, from T100 to T0 treatment, seed yields decreased 71% (‘Cahuil’) to 79% (AG 2010’) during the first season; nevertheless, seed yields decreased only 17% (‘Cahuil’) to 23% (‘Regalona’) during the second season.
Several authors reported that temperature does not affect seed yield, due to the plasticity of the quinoa crop; however, they did find an effect on pollen production and on grain quality [46,47,48]. Notwithstanding, Bunce et al. [36] indicated that high temperatures can affect quinoa cultivation. Hinojosa et al. [10] mentioned several studies where high temperatures do reduce quinoa seed yield. This agrees with this study as, in the first season, higher temperatures were measured. Therefore, there was a high accumulation of G D D A c c between sowing and the beginning of the grain filling stage, and the quinoa growing process was faster. It has been shown that high temperatures accelerate the ontogenetic processes of plants [49] and is detrimental to dry matter accumulation. As a matter of fact, the T0 treatments yielded 0.57 and 2.71 t ha−1 in the 2014/2015 and 2015/2016 seasons, respectively. In the same way, T100 yielded 2.35 and 3.41 t ha−1 in the 2014/2015 and 2015/2016 seasons, respectively. Muchow et al. [49] indicated that adequate temperatures promote a long duration of growth period, which leads to a greater solar radiation intercepted by the crop, resulting in higher yields, which occurred in the second season. It was observed that G D D A c c from the sowing to grain filling stage was 1080.2 and 940.0 °C-day in the 2014/2015 and 2015/2016 seasons, respectively (Figure 7). Those thermal accumulations occurred in a similar period of time in both seasons (87 and 89 days in the 2014/2015 and 2015/2016 seasons, respectively). Nevertheless, the period between grain filling and physiological maturity was shorter in the 2014/2015 season (20 days) compared to 30 days in the 2015/2016 season.

4.4. Protein Content

The values of total protein determined in this study were less than the 14−16 g 100 g−1 reported for quinoa [50,51,52]. These differences could be explained by the high genetic variability observed in quinoa [53,54,55,56], or due to the fact that the 6.25 value has been widely used as a conversion factor for standard protein. However, Fujihara et al. [57] determined that the conversion factor of total nitrogen to protein in quinoa seeds is 5.39. Therefore, the use of the 6.25 factor could overestimate the contents of total protein and, for this reason, it does not coincide with the present study, in which the conversion factor of 5.39 was used. In studies where a closer conversion factor to that indicated [57] was used, total protein contents in quinoa seeds between 11.7 and 12.5 g 100 g−1 have been found, values close to what was obtained in this study.
There was a decrease in total protein contents in the 2015/2016 season compared to the 2014/2015 season; however, there was a higher accumulation of albumin and globulin (Table 2). This could indicate that, despite decreasing the accumulation of total proteins in the grain, a higher quantity of soluble proteins (albumin and globulin type) was synthesized. The variation in total proteins has been found in other studies [48] as well. The ‘Morado’ genotype presented the highest content of total proteins (Table 2). In the 2014/2015 season, ‘Morado’ was not statistically different than the ‘Regalona’ and ‘Cahuil’ genotypes (p > 0.05), and in the 2015/2016 season, it was only statistically different than ‘Cahuil’ (p ≤ 0.05). The trend of the ‘Morado’ genotype to obtain a higher content of total protein in both seasons (Table 2) could indicate that it has the genetic potential to produce a quantity of protein higher than those of the other genotypes studied. The quantity of total proteins reported for ‘Morado’ is similar to or higher than 11 g 100 g−1 of seed that has been reported for other quinoa genotypes [51,58].
Environmental conditions can increase or decrease the accumulation of certain metabolites in seeds, such as antioxidants, reserve carbohydrates, and proteins, as it mainly affects the distribution of molecules and assimilated elements in the plant [53,59,60]. Specifically, drought-exposed plants produce antioxidant, flavonoids, and other secondary metabolites that play roles in protecting the plant against ROS detoxifying and abnormal conditions (i.e., stress) [61,62]. In some cases, water stress can increase the accumulation of metabolites in seeds, as an ecophysiological strategy to improve nutritional conditions available to the embryo when germination occurs [60,63,64,65]. Annual species, such as wheat [60,66], sorghum [67], rice [68,69], soybean [70], and quinoa [53,71], increase the accumulation of proteins, and other metabolites in seeds have been detected under water stress conditions.
In this study, it was determined that the percentage of albumin represents 25 and 36% of the total proteins in seeds for the 2014/2015 and 2015/2016 seasons, respectively. Albumin values of 29% of the protein fraction have been informed [58]. The highest content of albumin in the second season may be a consequence of the high environmental temperature in that season (2015/2016). It could have also been a consequence of the greatest variation in the maximum and minimum temperatures and changes in the intensity of photosynthetically active radiation. Hence, future research should aim to analyze the interaction of environmental factors as a product of climate change (temperature and/or radiation) and the restriction of available water to the crop. It has been determined that heat stress due to high temperatures during the growth period in the field changes the protein composition of wheat grain, favoring the synthesis and accumulation of protein and polypeptides [72]. In quinoa, high temperatures can reduce the synthesis and accumulation of albumin, being compensated with a greater accumulation of nonsoluble proteins, which can contribute to the maintenance of cellular and biochemical functions. Or, instead of albumin, peptides of low molecular weight and free amino acids, osmotically active [53], could have been synthesized. In this manner, quinoa plants, in general, could tolerate these major temperatures [65,73].
A greater accumulation of metabolites in seeds is an ecophysiological compensation mechanism against water stress, as other parameters can be affected, such as seed yield [63,74]. For instance, in some genotypes of wheat grown under stress conditions by drought, an increase in total proteins has been detected, associated with a decrease in plant height, grain volumetric weight, peduncle length, weight of grains, grain diameter, and grain yield [66]. The accumulation of proteins in the seed, being a complex strategy, does not solely respond to the pressure of one environmental factor, such as water availability in this case [65,75]. Therefore, more specific studies are necessary to determine the stability of this response in different genotypes and environments.
In general, the differences found between genotypes in the measured parameters could be attributable to the morphological variances of each one of them. For example, ‘Regalona’ and ‘AG 2010’ genotypes are shorter plants with average heights ranging from 0.6 to 1.0 m, with vigorous vegetation. On the other hand, ‘Cahuil’ and ‘Morado’ genotypes are taller plants, with average heights ranging from 1.3 to 1.7 m. Moreover, the biomass at harvest found in the ‘Regalona’ genotype were 201.2 and 272 g m−2 in the 2014/2015 and 2015/2016 seasons, respectively. For its part, the ‘Cahuil’ genotype obtained 220.1 and 308.8 g m−2 in the 2014/2015 and 2015/2016 seasons, respectively (data not shown).
Faced with the scenario of climate change at the regional and global levels, it becomes relevant to look for alternatives that allow the diversification of agricultural systems, so that food production would be possible in spite of defying climate conditions [53,76]. The results obtained in this study have made it possible to propose an irrigation strategy, tested in field trials, that can potentially increase the content of proteins in quinoa seeds when grown with 40 to 70% of AW between the phenological periods of the beginning of grain filling throughout physiological maturity in Mediterranean-type climates. The obtained results are consistent with studies that have observed increases in fractions of proteins, amino acids, and free polypeptides in quinoa seeds grown under water deficit conditions [31,53].

5. Conclusions

Leaf water potential is a good indicator of plant water status and is related to seed yield. Even though the genotypes analyzed were under drought conditions, they showed good performance of the photosynthetic apparatus, a characteristic that can be analyzed in future research on long-day quinoa plants.
The ‘Cahuil’ genotype maintained high yields in both seasons for all soil available water content treatments, which would suggest high genotype plasticity conditions. Replenishing irrigation when there was only 40% of available water (AW) in a 60 cm deep root zone, between grain filling throughout physiological maturity, was observed to allow genotypes to have acceptable yields.
The ‘Cahuil’ genotype showed the highest stability in seed yield despite plant water status (changes in leaf water potential did not represent important decreases in yield).
High temperatures promote rapid crop development to the detriment of dry matter accumulation and, therefore, grain yield, which leads to season-to-season variation.
Future research should focus on the relationship between grain quality and irrigation strategies used. It is possible to cultivate quinoa under controlled available water content conditions from the grain filling to physiological maturity stages, without significantly altering seed production and protein accumulation in the seed, maintaining yield parameters and nutritional quality.

Author Contributions

Conceptualization, W.V.-C., S.F. and J.J.; methodology, W.V.-C., S.F., J.J., L.B. and R.W.; formal analysis, W.V.-C. and L.B.; investigation, W.V.-C. and L.B.; data curation, W.V.-C. and L.B.; writing—original draft preparation, W.V.-C.; writing—review and editing, W.V.-C., J.J., S.F. and E.H.; visualization, W.V.-C.; project administration, S.F.; funding acquisition, S.F., J.J. and E.H. All authors have read and agreed to the published version of the manuscript.

Funding

This research was funded by the National Commission for Scientific and Technological Research (CONICYT) Fondecyt Regular Nº 1140661, and ANID/FONDAP/15130015: Water Research Center for Agriculture and Mining (CRHIAM), Chile.

Institutional Review Board Statement

Not applicable.

Informed Consent Statement

Not applicable.

Data Availability Statement

Not applicable.

Acknowledgments

Authors thank the technical staff of the Water Resources Laboratory, Faculty of Agricultural Engineering, University of Concepción.

Conflicts of Interest

The authors declare no conflict of interest.

References

  1. Mittler, R. Abiotic stress, the field environment and stress combination. Trends Plant Sci. 2006, 11, 15–19. [Google Scholar] [CrossRef] [PubMed]
  2. Dai, M.; Huang, S.; Huang, Q.; Leng, G.; Guo, Y.; Wang, L.; Fang, W.; Li, P.; Zheng, X. Assessing agricultural drought risk and its dynamic evolution characteristics. Agric. Water Manag. 2020, 231, 106003. [Google Scholar] [CrossRef]
  3. Bhusal, N.; Han, S.-G.; Yoon, T.-M. Impact of drought stress on photosynthetic response, leaf water potential, and stem sap flow in two cultivars of bi-leader apple trees (Malus × domestica Borkh.). Sci. Hortic. 2019, 246, 535–543. [Google Scholar] [CrossRef]
  4. Barnabás, B.; Jäger, K.; Fehér, A. The effect of drought and heat stress on reproductive processes in cereals. Plant Cell Environ. 2008, 31, 11–38. [Google Scholar] [CrossRef] [PubMed]
  5. Zurita-Silva, A.; Jacobsen, S.-E.; Razzaghi, F.; Alvarez-Flores, R.; Ruiz, K.; Morales, A.; Silva, H. Quinoa Drought Responses and Adaptation. In State of the Art Report of Quinoa in the World in 2013; FAO & CIRAD: Rome, Italy, 2015; pp. 157–171. [Google Scholar]
  6. Bazile, D.; Pulvento, C.; Verniau, A.; Al-Nusairi, M.S.; Ba, D.; Breidy, J.; Hassan, L.; Mohammed, M.I.; Mambetov, O.; Otambekova, M.; et al. Worldwide Evaluations of Quinoa: Preliminary Results from Post International Year of Quinoa FAO Projects in Nine Countries. Front. Plant Sci. 2016, 7, 850. [Google Scholar] [CrossRef] [PubMed] [Green Version]
  7. Bhargava, A.; Shukla, S.; Ohri, D. Chenopodium quinoa—An Indian perspective. Ind. Crop. Prod. 2006, 23, 73–87. [Google Scholar] [CrossRef]
  8. Bertero, H.; De La Vega, A.; Correa, G.; Jacobsen, S.; Mujica, A. Genotype and genotype-by-environment interaction effects for grain yield and grain size of quinoa (Chenopodium quinoa Willd.) as revealed by pattern analysis of international multi-environment trials. Field Crop. Res. 2004, 89, 299–318. [Google Scholar] [CrossRef]
  9. Jaikishun, S.; Li, W.; Yang, Z.; Song, S. Quinoa: In Perspective of Global Challenges. Agronomy 2019, 9, 176. [Google Scholar] [CrossRef] [Green Version]
  10. Hinojosa, L.; González, J.A.; Barrios-Masias, F.H.; Fuentes, F.; Murphy, K.M. Quinoa Abiotic Stress Responses: A Review. Plants 2018, 7, 106. [Google Scholar] [CrossRef] [Green Version]
  11. Stoleru, V.; Slabu, C.; Vitanescu, M.; Peres, C.; Cojocaru, A.; Covasa, M.; Mihalache, G. Tolerance of Three Quinoa Cultivars (Chenopodium quinoa Willd.) to Salinity and Alkalinity Stress During Germination Stage. Agronomy 2019, 9, 287. [Google Scholar] [CrossRef] [Green Version]
  12. Pulvento, C.; Riccardi, M.; Lavini, A.; Iafelice, G.; Marconi, E.; D’Andria, R. Yield and Quality Characteristics of Quinoa Grown in Open Field Under Different Saline and Non-Saline Irrigation Regimes. J. Agron. Crop. Sci. 2012, 198, 254–263. [Google Scholar] [CrossRef]
  13. Razzaghi, F.; Plauborg, F.; Jacobsen, S.-E.; Jensen, C.R.; Andersen, M.N. Effect of nitrogen and water availability of three soil types on yield, radiation use efficiency and evapotranspiration in field-grown quinoa. Agric. Water Manag. 2012, 109, 20–29. [Google Scholar] [CrossRef]
  14. Al-Naggar, A.M.M.; El-Salam, R.M.A.; Badran, A.E.E.; El-Moghazi, M.M.A. Genotype and Drought Effects on Morphological, Physiological and Yield Traits of Quinoa (Chenopodium quinoa Willd.). Asian J. Adv. Agric. Res. 2017, 3, 1–15. [Google Scholar] [CrossRef]
  15. Krause, G.H.; Weis, E. Chlorophyll Fluorescence and Photosynthesis: The Basics. Ann Rev Plant Physiol. 1991, 42, 313–349. [Google Scholar] [CrossRef]
  16. Jensen, C.; Jacobsen, S.-E.; Andersen, M.; Núñez, N.; Andersen, S.; Rasmussen, L.; Mogensen, V. Leaf gas exchange and water relation characteristics of field quinoa (Chenopodium quinoa Willd.) during soil drying. Eur. J. Agron. 2000, 13, 11–25. [Google Scholar] [CrossRef]
  17. Jacobsen, S.-E.; Liu, F.; Jensen, C.R. Does root-sourced ABA play a role for regulation of stomata under drought in quinoa (Chenopodium quinoa Willd.). Sci. Hortic. 2009, 122, 281–287. [Google Scholar] [CrossRef] [Green Version]
  18. Maxwell, K.; Johnson, G.N. Chlorophyll fluorescence—A practical guide. J. Exp. Bot. 2000, 51, 659–668. [Google Scholar] [CrossRef] [PubMed]
  19. Daryanto, S.; Wang, L.; Jacinthe, P.-A. Global synthesis of drought effects on cereal, legume, tuber and root crops production: A review. Agric. Water Manag. 2017, 179, 18–33. [Google Scholar] [CrossRef] [Green Version]
  20. Yang, A.; Akhtar, S.S.; Amjad, M.; Iqbal, S.; Jacobsen, S.-E. Growth and Physiological Responses of Quinoa to Drought and Temperature Stress. J. Agron. Crop. Sci. 2016, 202, 445–453. [Google Scholar] [CrossRef]
  21. Farooq, M.; Wahid, A.; Kobayashi, N.; Fujita, D.; Basra, S.M.A. Plant Drought Stress: Effects, Mechanisms and Management. In Sustainable Agriculture; Springer: Dordrecht, The Netherlands, 2009; Volume 29, pp. 153–188. [Google Scholar] [CrossRef] [Green Version]
  22. Gámez, A.L.; Soba, D.; Zamarreño, Á.M.; García-Mina, J.M.; Aranjuelo, I.; Morales, F. Effect of Water Stress during Grain Filling on Yield, Quality and Physiological Traits of Illpa and Rainbow Quinoa (Chenopodium quinoa Willd.) Cultivars. Plants 2019, 8, 173. [Google Scholar] [CrossRef] [Green Version]
  23. Issa Ali, O.; Fghire, R.; Anaya, F.; Benlhabib, O.; Wahbi, S. Physiological and Morphological Responses of Two Quinoa Cul-tivars (Chenopodium Quinoa Willd.) to Drought Stress. Gesunde Pflanz 2019, 71, 123–133. [Google Scholar] [CrossRef]
  24. Fghire, R.; Anaya, F.; Ali, O.I.; Benlhabib, O.; Ragab, R.; Wahbi, S. Physiological and photosynthetic response of quinoa to drought stress. Chil. J. Agric. Res. 2015, 75, 174–183. [Google Scholar] [CrossRef] [Green Version]
  25. Sun, Y.; Liu, F.; Bendevis, M.; Shabala, S.; Jacobsen, S.-E. Sensitivity of Two Quinoa (Chenopodiumquinoa Willd.) Varieties to Progressive Drought Stress. J. Agron. Crop. Sci. 2013, 200, 12–23. [Google Scholar] [CrossRef]
  26. Martínez, E.A.; Veas, E.; Jorquera, C.; Martín, R.S.; Jara, P. Re-Introduction of Quínoa into Arid Chile: Cultivation of Two Lowland Races under Extremely Low Irrigation. J. Agron. Crop. Sci. 2009, 195, 1–10. [Google Scholar] [CrossRef]
  27. Geerts, S.; Raes, D.; Garcia, M.; Mendoza, J.; Huanca, R. Crop water use indicators to quantify the flexible phenology of quinoa (Chenopodium quinoa Willd.) in response to drought stress. Field Crop. Res. 2008, 108, 150–156. [Google Scholar] [CrossRef]
  28. Geerts, S.; Raes, D.; Garcia, M.; Condori, O.; Mamani, J.; Miranda, R.; Cusicanqui, J.; Taboada, C.; Yucra, E.; Vacher, J. Could deficit irrigation be a sustainable practice for quinoa (Chenopodium quinoa Willd.) in the Southern Bolivian Altiplano? Agric. Water Manag. 2008, 95, 909–917. [Google Scholar] [CrossRef]
  29. Geerts, S.; Raes, D.; Garcia, M.; Vacher, J.; Mamani, R.; Mendoza, J.; Huanca, R.; Morales, B.; Miranda, R.; Cusicanqui, J.; et al. Introducing deficit irrigation to stabilize yields of quinoa (Chenopodium quinoa Willd.). Eur. J. Agron. 2008, 28, 427–436. [Google Scholar] [CrossRef]
  30. Garcia, M.; Raes, D.; Jacobsen, S.-E. Evapotranspiration analysis and irrigation requirements of quinoa (Chenopodium quinoa) in the Bolivian highlands. Agric. Water Manag. 2003, 60, 119–134. [Google Scholar] [CrossRef]
  31. Fischer, S.; Wilckens, R.; Jara, J.; Aranda, M.; Valdivia, W.; Bustamante, L.; Graf, F.; Obal, I. Protein and antioxidant composition of quinoa (Chenopodium quinoa Willd.) sprout from seeds submitted to water stress, salinity and light conditions. Ind. Crop. Prod. 2017, 107, 558–564. [Google Scholar] [CrossRef]
  32. Stolpe, N. Descripciones de Los Principales Suelos de La VIII Región de Chile; Universidad de Concepción, Departamento de Suelos y Recursos Naturales: Chillán, Chile, 2006. [Google Scholar]
  33. Klute, A. Water Retention: Laboratory Methods. In Methods of Soil Analysis Part. 5-Mineralogical Methods; Wiley Online Library: Hoboken, NJ, USA, 2018; volume 5, pp. 635–662. [Google Scholar]
  34. AGRIMED; Tome, I.V. Center of Agriculture and Environment; University of Chile: Santiago, Chile, 2017. [Google Scholar]
  35. Bertero, H.D. Response of Developmental Processes to Temperature and Photoperiod in Quinoa (Chenopodium quinoa Willd.). Food Rev. Int. 2003, 19, 87–97. [Google Scholar] [CrossRef]
  36. Bunce, J.A. Variation in Yield Responses to Elevated CO2 and a Brief High Temperature Treatment in Quinoa. Plants 2017, 6, 26. [Google Scholar] [CrossRef] [Green Version]
  37. Razzaghi, F.; Ahmadi, S.H.; Adolf, V.I.; Jensen, C.R.; Jacobsen, S.-E.; Andersen, M.N. Water Relations and Transpiration of Quinoa (Chenopodium quinoa Willd.) Under Salinity and Soil Drying. J. Agron. Crop. Sci. 2011, 197, 348–360. [Google Scholar] [CrossRef]
  38. Jacobsen, S.-E.; Mujica, A.; Jensen, C.R. The Resistance of Quinoa (Chenopodium quinoa Willd.) to Adverse Abiotic Factors. Food Rev. Int. 2003, 19, 99–109. [Google Scholar] [CrossRef]
  39. Alghory, A.; Yazar, A. Evaluation of crop water stress index and leaf water potential for deficit irrigation management of sprinkler-irrigated wheat. Irrig. Sci. 2019, 37, 61–77. [Google Scholar] [CrossRef]
  40. Xue, Q.; Zhu, Z.; Musick, J.T.; Stewart, B.; Dusek, D.A. Physiological mechanisms contributing to the increased water-use efficiency in winter wheat under deficit irrigation. J. Plant Physiol. 2006, 163, 154–164. [Google Scholar] [CrossRef]
  41. Sanchez, H.B.; LeMeur, R.; Van Damme, P.; Jacobsen, S.-E. Ecophysiological Analysis Of Drought And Salinity Stress Of Quinoa (Chenopodium Quinoawilld.). Food Rev. Int. 2003, 19, 111–119. [Google Scholar] [CrossRef]
  42. Killi, D.; Haworth, M. Diffusive and Metabolic Constraints to Photosynthesis in Quinoa during Drought and Salt Stress. Plants 2017, 6, 49. [Google Scholar] [CrossRef] [PubMed] [Green Version]
  43. Winkel, T.; Méthy, M.; Thenot, F. Radiation Use Efficiency, Chlorophyll Fluorescence, and Reflectance Indices Associated with Ontogenic Changes in Water-Limited Chenopodium quinoa Leaves. Photosynth 2002, 40, 227–232. [Google Scholar] [CrossRef]
  44. Fischer, S.; Wilckens, R.; Jara, J.; Aranda, M. Variation in antioxidant capacity of quinoa (Chenopodium quinoa Will) subjected to drought stress. Ind. Crop. Prod. 2013, 46, 341–349. [Google Scholar] [CrossRef]
  45. Fghire, R.; Wahbi, S.; Anaya, F.; Ali, O.I.; Benlhabib, O.; Ragab, R. Response of Quinoa to Different Water Management Strategies: Field Experiments and Saltmed Model Application Results. Irrig. Drain. 2015, 64, 29–40. [Google Scholar] [CrossRef]
  46. Becker, V.I.; Goessling, J.W.; Duarte, B.; Caçador, I.; Liu, F.; Rosenqvist, E.; Jacobsen, S.-E. Combined effects of soil salinity and high temperature on photosynthesis and growth of quinoa plants (Chenopodium quinoa). Funct. Plant Biol. 2017, 44, 665–678. [Google Scholar] [CrossRef] [PubMed]
  47. Hinojosa, L.; Matanguihan, J.B.; Murphy, K.M. Effect of high temperature on pollen morphology, plant growth and seed yield in quinoa (Chenopodium quinoa Willd.). J. Agron. Crop. Sci. 2018, 205, 33–45. [Google Scholar] [CrossRef] [Green Version]
  48. Präger, A.; Munz, S.; Nkebiwe, P.M.; Mast, B.; Graeff-Hönninger, S. Yield and Quality Characteristics of Different Quinoa (Chenopodium quinoa Willd.) Cultivars Grown under Field Conditions in Southwestern Germany. Agronomy 2018, 8, 197. [Google Scholar] [CrossRef] [Green Version]
  49. Muchow, R.C.; Sinclair, T.R.; Bennett, J.M. Temperature and Solar Radiation Effects on Potential Maize Yield across Locations. Agron. J. 1990, 82, 338–343. [Google Scholar] [CrossRef]
  50. Navarro-Lisboa, R.; Herrera, C.; Zúñiga, R.; Enrione, J.; Guzmán, F.; Matiacevich, S.; Astudillo-Castro, C. Quinoa proteins (Chenopodium quinoa Willd.) fractionated by ultrafiltration using ceramic membranes: The role of pH on physicochemical and conformational properties. Food Bioprod. Process. 2017, 102, 20–30. [Google Scholar] [CrossRef]
  51. Föste, M.; Elgeti, D.; Brunner, A.-K.; Jekle, M.; Becker, T. Isolation of quinoa protein by milling fractionation and solvent extraction. Food Bioprod. Process. 2015, 96, 20–26. [Google Scholar] [CrossRef]
  52. Kozioł, M. Chemical composition and nutritional evaluation of quinoa (Chenopodium quinoa Willd.). J. Food Compos. Anal. 1992, 5, 35–68. [Google Scholar] [CrossRef]
  53. Bascuñán-Godoy, L.; Reguera, M.; Abdel-Tawab, Y.M.; Blumwald, E. Water deficit stress-induced changes in carbon and nitrogen partitioning in Chenopodium quinoa Willd. Planta 2015, 243, 591–603. [Google Scholar] [CrossRef]
  54. Bazile, D.; Martínez, E.A.; Fuentes, F. Diversity of Quinoa in a Biogeographical Island: A Review of Constraints and Potential from Arid to Temperate Regions of Chile. Not. Bot. Horti Agrobot. Cluj-Napoca 2014, 42, 289–298. [Google Scholar] [CrossRef] [Green Version]
  55. Zurita-Silva, A.; Fuentes, F.; Zamora, P.; Jacobsen, S.-E.; Schwember, A.R. Breeding quinoa (Chenopodium quinoa Willd.): Potential and perspectives. Mol. Breed. 2014, 34, 13–30. [Google Scholar] [CrossRef]
  56. Ruiz, K.B.; Biondi, S.; Oses, R.; Acuña-Rodríguez, I.S.; Antognoni, F.; Martinez-Mosqueira, E.A.; Coulibaly, A.; Canahua-Murillo, A.; Pinto, M.; Zurita-Silva, A.; et al. Quinoa biodiversity and sustainability for food security under climate change. A review. Agron. Sustain. Dev. 2013, 34, 349–359. [Google Scholar] [CrossRef] [Green Version]
  57. Fujihara, S.; Sasaki, H.; Aoyagi, Y.; Sugahara, T. Nitrogen-to-Protein Conversion Factors for Some Cereal Products in Japan. J. Food Sci. 2008, 73, C204–C209. [Google Scholar] [CrossRef] [PubMed]
  58. Watanabe, K.; Ibuji, A.; Chen, Y.; Kawamura, Y.; Mitsunaga, T. Composition of Quinoa Protein Fractions. Nippon Shokuhin 762 Kagaku Kogaku Kaishi 2003, 50, 546–549. [Google Scholar] [CrossRef]
  59. McDowell, N.G. Mechanisms Linking Drought, Hydraulics, Carbon Metabolism, and Vegetation Mortality. Plant. Physiol. 2011, 155, 1051–1059. [Google Scholar] [CrossRef] [PubMed] [Green Version]
  60. Parchin, R.A.; Shaban, M. Protein profile and seeds storage proteins changes in wheat genotypes under control and drought stress conditions. Sci. Agric. 2014, 1, 6–8. [Google Scholar] [CrossRef]
  61. Khaleghi, A.; Naderi, R.; Brunetti, C.; Maserti, B.E.; Salami, S.A.; Babalar, M. Morphological, physiochemical and antioxidant responses of Maclura pomifera to drought stress. Sci. Rep. 2019, 9, 1–12. [Google Scholar] [CrossRef]
  62. Bhusal, N.; Lee, M.; Lee, H.; Adhikari, A.; Han, A.R.; Kim, H.S. Evaluation of morphological, physiological, and biochemical traits for assessing drought resistance in eleven tree species. Sci. Total. Environ. 2021, 779, 146466. [Google Scholar] [CrossRef]
  63. Blum, A. Drought resistance, water-use efficiency, and yield potential—are they compatible, dissonant, or mutually exclusive? Aust. J. Agric. Res. 2005, 56, 1159–1168. [Google Scholar] [CrossRef]
  64. Fábián, A.; Jäger, K.; Rakszegi, M.; Barnabás, B. Embryo and endosperm development in wheat (Triticum aestivum L.) kernels subjected to drought stress. Plant Cell Rep. 2011, 30, 551–563. [Google Scholar] [CrossRef]
  65. Farooq, M.; Bramley, H.; Palta, J.A.; Siddique, K.H. Heat Stress in Wheat during Reproductive and Grain-Filling Phases. Crit. Rev. Plant Sci. 2011, 30, 491–507. [Google Scholar] [CrossRef]
  66. Li, P.; Chen, J.; Wu, P. Agronomic Characteristics and Grain Yield of 30 Spring Wheat Genotypes under Drought Stress and Nonstress Conditions. Agron. J. 2011, 103, 1619–1628. [Google Scholar] [CrossRef] [Green Version]
  67. Yi, B.; Zhou, Y.-F.; Gao, M.-Y.; Zhang, Z.; Han, Y.; Yang, G.-D.; Xu, W.; Huang, R.-D. Effect of Drought Stress During Flowering Stage on Starch Accumulation and Starch Synthesis Enzymes in Sorghum Grains. J. Integr. Agric. 2014, 13, 2399–2406. [Google Scholar] [CrossRef]
  68. Jeong, J.S.; Kim, Y.S.; Baek, K.H.; Jung, H.; Ha, S.-H.; Choi, Y.D.; Kim, M.; Reuzeau, C.; Kim, J.-K. Root-Specific Expression of OsNAC10 Improves Drought Tolerance and Grain Yield in Rice under Field Drought Conditions. Plant Physiol. 2010, 153, 185–197. [Google Scholar] [CrossRef] [PubMed] [Green Version]
  69. You, J.; Zong, W.; Hu, H.; Li, X.; Xiao, J.; Xiong, L. A STRESS-RESPONSIVE NAC1-Regulated Protein Phosphatase Gene Rice Protein Phosphatase18 Modulates Drought and Oxidative Stress Tolerance through Abscisic Acid-Independent Reactive Oxygen Species Scavenging in Rice. Plant Physiol. 2014, 166, 2100–2114. [Google Scholar] [CrossRef] [Green Version]
  70. Arumingtyas, E.L.; Savitri, E.S.; Purwoningrahayu, R.D. Protein Profiles and Dehydrin Accumulation in Some Soybean Varieties (Glycine max L. Merr) in Drought Stress Conditions. Am. J. Plant Sci. 2013, 4, 134–141. [Google Scholar] [CrossRef] [Green Version]
  71. Carjuzaa, P.; Castellión, M.; Distéfano, A.J.; Del Vas, M.; Maldonado, S. Detection and subcellular localization of dehydrin-like proteins in quinoa (Chenopodium quinoa Willd.) embryos. Protoplasma 2008, 233, 149–156. [Google Scholar] [CrossRef]
  72. Laino, P.; Shelton, D.; Finnie, C.; De Leonardis, A.M.; Mastrangelo, A.M.; Svensson, B.; Lafiandra, D.; Masci, S. Comparative proteome analysis of metabolic proteins from seeds of durum wheat (cv. Svevo) subjected to heat stress. Proteomics 2010, 10, 2359–2368. [Google Scholar] [CrossRef] [Green Version]
  73. Wang, W.; Vinocur, B.; Altman, A. Plant responses to drought, salinity and extreme temperatures: Towards genetic engineering for stress tolerance. Planta 2003, 218, 1–14. [Google Scholar] [CrossRef]
  74. Gambãn, B.; Borrás, L.; Gambín, B. Resource distribution and the trade-off between seed number and seed weight: A comparison across crop species. Ann. Appl. Biol. 2010, 156, 91–102. [Google Scholar] [CrossRef]
  75. Hand, S.C.; Menze, M.A.; Toner, M.; Boswell, L.; Moore, D. LEA Proteins During Water Stress: Not Just for Plants Anymore. Annu. Rev. Physiol. 2011, 73, 115–134. [Google Scholar] [CrossRef] [Green Version]
  76. Iizumi, T.; Yokozawa, M.; Sakurai, G.; Travasso, M.I.; Romanenkov, V.; Oettli, P.; Newby, T.; Ishigooka, Y.; Furuya, J. Historical changes in global yields: Major cereal and legume crops from 1982 to 2006. Glob. Ecol. Biogeogr. 2013, 23, 346–357. [Google Scholar] [CrossRef]
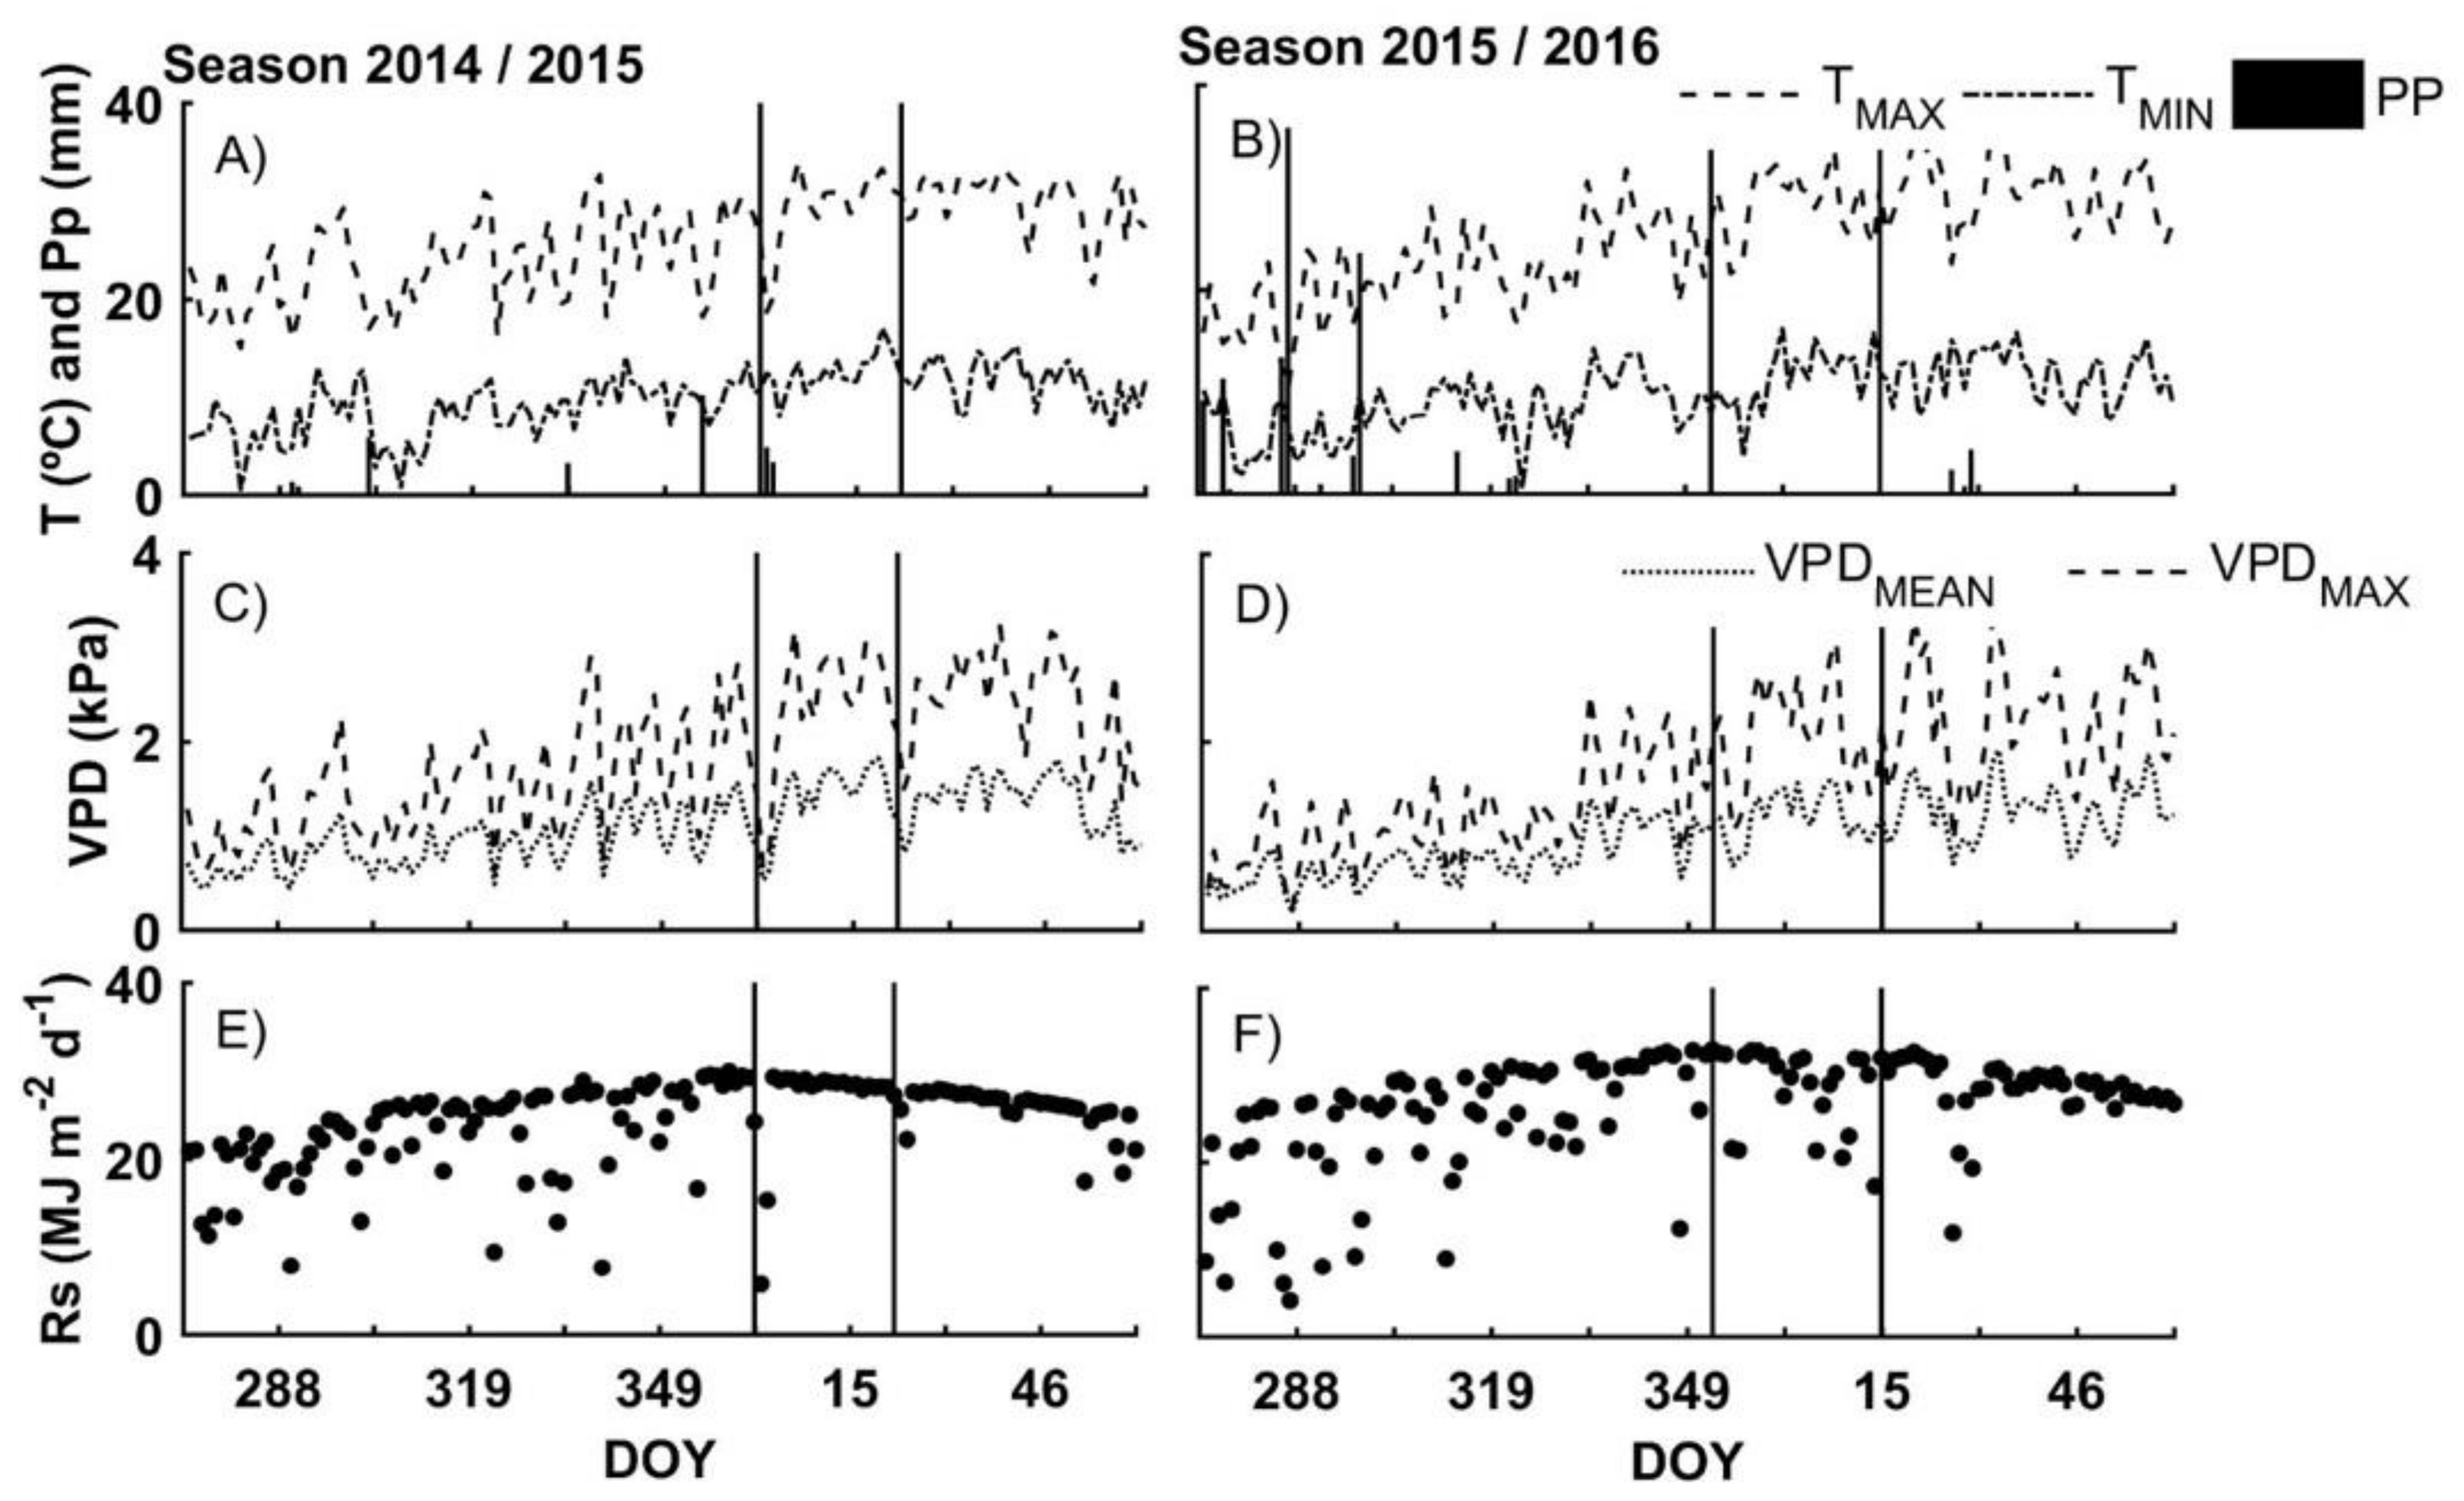
Figure 1. Maximum daily temperature (TMAX), minimum daily temperature (TMIN), daily precipitation (PP) (A,B); average daily vapor pressure deficit (VPDMEAN), maximum daily vapor pressure deficit (VPDMAX) (C,D); and daily solar radiation (Rs) (E,F) measured in both seasons (2014/2015 and 2015/2016). Vertical thin lines indicate the period of application of irrigation treatments. DOY is the day of year.
Agronomy 11 01012 g001
Figure 2. Evolution of available water (AW) in five irrigation treatments (T), T0, T20, T40, T70, and T100, and four quinoa genotypes: (A) Regalona, (B) AG 2010, (C) Cahuil, and (D) Morado, between the beginning of grain filling throughout the physiological maturity stages, in the 2014/2015 season. AW and 0, 20, 40, 70, and 100 represent the levels of available water to the plant in a 0.6 m deep root zone just before irrigation. DOY is the day of year. Bars indicate ± one standard error.
Agronomy 11 01012 g002
Figure 3. Evolution of available water (AW) in five irrigation treatments (T): T0, T20, T40, T70, and T100, and four quinoa genotypes: (A) Regalona, (B) AG 2010, (C) Cahuil, and (D) Morado, between the beginning of grain filling throughout the physiological maturity stages, in the 2015/2016 season. AW and 0, 20, 40, 70, and 100 represent the levels of available water to the plant in a 0.6 m deep root zone just before irrigation. DOY is the day of year. Bars indicate ± one standard error.
Agronomy 11 01012 g003
Figure 4. Leaf water potential (LWP) at midday under five irrigation treatments (T) and four quinoa genotypes, between the beginning of grain filling throughout the physiological maturity stages, in the 2014/2015 and 2015/2016 seasons. T0, T20, T40, T70, and T100 represent the levels of available water to the plant in a 0.6 m deep root zone just before irrigation. For water availability treatments, each point represents the average of 16 measurements, and for genotypes, each point represents the average of 20 measurements. DOY is the day of year. **, measurement date indicating that significant differences were found. ns, measurement date indicating that no significant differences were found.
Agronomy 11 01012 g004
Figure 5. Maximum quantum yield (FV/FM) under five irrigation treatments (T): T0, T20, T40, T70, and T100 in 2014/2015 and 2015/2016 seasons. Each point represents the average of 16 measurements (4 quinoa genotypes and 4 replicates each). T and 0, 20, 40, 70, and 100 represent the levels of available water to the plant in a 0.6 m deep root zone just before irrigation. DOY is the day of year. **, measurement date indicating that significant differences were found. ns, measurement date indicating that no significant differences were found.
Agronomy 11 01012 g005
Figure 6. Relationship between seed yield and leaf water potential (LWP) at midday for four quinoa genotypes: (A) Regalona, (B) AG 2010, (C) Cahuil, and (D) Morado, season 2015/2016. Each point represents the yield of an experimental unit and the average of eight LWP measurements made from grain filling throughout the physiological maturity stage at the same experimental unit.
Agronomy 11 01012 g006
Figure 7. Daily growing degree-days (GDD, vertical bars) and cumulative growing degree-days ( G D D A c c , in 2014/2015 and 2015/2016 seasons. DAS is days after sowing. Vertical thin lines indicate (1) sowing, (2) grain filling stage, (3) physiological maturity stage, and (4) harvest time. Sowing in the 2014/2015 season was on 5 October 2014; and sowing in the 2015/2016 season was on 20 September 2015.
Agronomy 11 01012 g007
Table 1. Grain yield for five water availability treatments (T) and four quinoa genotypes in the 2014/2015 and 2015/2016 seasons.
Season 2014/2015
AW (%)Genotype
RegalonaAG 2010CahuilMoradoAverage
Grain Yield (t ha−1)
T 00.560.500.810.410.57 d
T 201.321.211.110.661.07 c
T 401.501.591.251.121.37 c
T 701.791.942.091.321.78 b
T 1002.472.332.811.792.35 a
Average1.53 a1.51 a1.61 a1.06 b
Season 2015/2016
AW (%)Genotype
RegalonaAG 2010CahuilMoradoAverage
Grain yield (t ha−1)
T 02.822.073.042.912.71 bc
T 202.402.072.992.952.60 c
T 402.692.603.573.583.11 ab
T 702.792.433.483.323.01 abc
T 1003.682.613.663.693.41 a
Average2.88 b2.36 c3.35 a3.29 a
Different letters in the column and row averages show significant differences between water availability treatments and between genotypes (p ≤ 0.05). AW and 0, 20, 40, 70, and 100 represent the levels of available water to the plant in a 0.6 m deep root zone just before irrigation from grain filling throughout the physiological maturity stage.
Table 2. Total protein (TP) content, albumin (Alb), globulin (Glob), and other dissolved proteins (OP) in five water availability treatments (T) and four quinoa genotypes for the 2014/2015 and 2015/2016 seasons.
Season 2014/2015
AW (%)TP (g 100 g−1)Alb (mg g−1)Glob (mg g−1)OP (mg g−1)
T 012.9b30.4a32.3a45.5b
T 2012.5b30.4a32.9a50.7a
T 4014.0a35.0a36.5a51.1a
T 7013.6ab34.0a37.2a50.5a
T 10013.8a35.1a32.5a50.5a
Genotype
Regalona13.8a33.7a35.9a50.3a
AG 201012.4b32.3a31.3a48.8a
Cahuil13.6ab33.0a36.2a50.2a
Morado13.9a32.9a33.5a49.4a
Season 2015/2016
AW (%)TP (g 100 g−1)Alb (mg g−1)Glob (mg g−1)OP (mg g−1)
T 011.1a32.3c39.4a38.3a
T 2010.5a35.7bc36.7a39.3a
T 4010.8a41.5ab39.5a41.8a
T 7010.8a40.3ab40.2a46.1a
T 10011.2a43.5a44.1a43.5a
Genotype
Regalona10.8ab41.3a38.6b41.6a
AG 201010.8ab37.0ab38.7b43.4a
Cahuil10.7b36.3b40.3ab39.7a
Morado11.2a40.1ab42.4a42.5a
Different letters in columns show significant differences between water availability treatments and between genotypes (p ≤ 0.05). AW and 0, 20, 40, 70, and 100 represent the levels of available water to the plant in a 0.6 m deep root zone just before irrigation from grain filling throughout the physiological maturity stage.
Publisher’s Note: MDPI stays neutral with regard to jurisdictional claims in published maps and institutional affiliations.