Article

Using UAV Borne, Multi-Spectral Imaging for the Field Phenotyping of Shoot Biomass, Leaf Area Index and Height of West African Sorghum Varieties under Two Contrasted Water Conditions

1
Centre d’Etude Régional pour l’Amélioration de l’Adaptation à la Sécheresse (CERAAS), Institut Sénégalais de Recherches Agricoles (ISRA), Route de Khombole, Thiès BP 3320, Senegal
2
Laboratoire Campus de Biotechnologies Végétales, Département de Biologie Végétale, Faculté des Sciences et Techniques, Université Cheikh Anta Diop de Dakar, Dakar BP 5005, Senegal
3
Centre de coopération Internationale en Recherche Agronomique pour le Développement (CIRAD), UMR AGAP Institut, F-34398 Montpellier, France
4
UMR AGAP Institut, Université Montpellier, CIRAD, INRAE, Institut Agro, F-34398 Montpellier, France
*
Authors to whom correspondence should be addressed.
Agronomy 2021, 11(5), 850; https://doi.org/10.3390/agronomy11050850
Submission received: 21 January 2021 / Revised: 19 February 2021 / Accepted: 22 February 2021 / Published: 27 April 2021
(This article belongs to the Section Innovative Cropping Systems)

Abstract

:
Meeting food demand for the growing population will require an increase to crop production despite climate changes and, more particularly, severe drought episodes. Sorghum is one of the cereals most adapted to drought that feed millions of people around the world. Valorizing its genetic diversity for crop improvement can benefit from extensive phenotyping. The current methods to evaluate plant biomass, leaves area and plants height involve destructive sampling and are not practical in breeding. Phenotyping relying on drone based imagery is a powerful approach in this context. The objective of this study was to develop and validate a high throughput field phenotyping method of sorghum growth traits under contrasted water conditions relying on drone based imagery. Experiments were conducted in Bambey (Senegal) in 2018 and 2019, to test the ability of multi-spectral sensing technologies on-board a UAV platform to calculate various vegetation indices to estimate plants characteristics. In total, ten (10) contrasted varieties of West African sorghum collection were selected and arranged in a randomized complete block design with three (3) replicates and two (2) water treatments (well-watered and drought stress). This study focused on plant biomass, leaf area index (LAI) and the plant height that were measured weekly from emergence to maturity. Drone flights were performed just before each destructive sampling and images were taken by multi-spectral and visible cameras. UAV-derived vegetation indices exhibited their capacity of estimating LAI and biomass in the 2018 calibration data set, in particular: normalized difference vegetative index (NDVI), corrected transformed vegetation index (CTVI), seconded modified soil-adjusted vegetation index (MSAVI2), green normalize difference vegetation index (GNDVI), and simple ratio (SR) (r2 of 0.8 and 0.6 for LAI and biomass, respectively). Developed models were validated with 2019 data, showing a good performance (r2 of 0.92 and 0.91 for LAI and biomass accordingly). Results were also promising regarding plant height estimation (RMSE = 9.88 cm). Regression plots between the image-based estimation and the measured plant height showed a r2 of 0.83. The validation results were similar between water treatments. This study is the first successful application of drone based imagery for phenotyping sorghum growth and development in a West African context characterized by severe drought occurrence. The developed approach could be used as a decision support tool for breeding programs and as a tool to increase the throughput of sorghum genetic diversity characterization for adaptive traits.

1. Introduction

The human population is expected to reach 9.7 billion by 2050, thus meeting food demand for the growing population will require an increase in crop production between 25 and 70% above the current levels [1]. The greatest challenge for agriculture is the changing climate caused by increasing greenhouse gas emissions leading to extreme temperatures and adverse weather conditions [2]. Sorghum is one of the most adapted cereals to abiotic constraints characterizing climate change [3,4]. Its huge genetic diversity provides considerable sources of adaptations to future climatic stresses [5,6,7] and, probably, it will play a key role for ensuring food security of millions of people worldwide in the future. In order to take advantages of genetic diversity in a breeding context, it is required to characterize available germplasm for adaptive traits in contrasting stressful situations using controlled environments, as well as in multi-environments field trials [8,9,10,11]. The assessment of plant growth, development, and physiological responses in the field often implies manual measurement or visual scoring that must be performed during the day under high radiation conditions, i.e., during four hours per day; this is for example the case of leaf area index measurement using a Sunscan Septometer (Delta-T Devices, Cambridge, UK) [12,13]. In addition, comparing genotypes for their physiological response to a climatic variable implies to make measurements in a short period. This becomes problematic when dealing with breeding populations with a high number of accessions to be compared for a given physiological processes. The time spent between the measurement of the first and the last genotype makes the comparison irrelevant. Thus, improving the throughput of phenotyping in the field become a big challenge [14]. With climate changes, quantitative breeding for traits that enhance yield in water-limited environments is becoming a high priority [15]. Among these traits, leaf area index (LAI), as the size of the crop canopy has important consequences on water use [16,17]. Crops with smaller leaf area index can consume less water and can be in some situation suitable for water limited environment [18]. In addition, LAI is a useful tool to evaluate the fraction of absorbed photosynthetically active radiation, which is required to model canopy photosynthesis [19]. Being able to monitor leaf area development over time would therefore allow to capture information not only of the water use pattern of a genotype, but also on its light interception efficiency. Beside LAI, plants height and biomass are essential to monitor as they are key indicators of plant growth and of yield elaboration [20,21,22,23]. The above ground biomass is an important phenotype that indicates the crop condition that is appropriate for crop monitoring and yield estimation [24]. An efficient and timely method for the prediction of sorghum biomass will help to speed the development of higher biomass varieties for fodder breeding programs. The benefits of sorghum as a biomass crop could be further enhanced if genotypes with high tolerance to stresses such as water deficit can be more easily identified, which will be facilitated by integrating sorghum genotyping and phenotyping technologies [25]. Plant height is a good indicator of carbohydrate storage capacity and susceptibility to lodging [26]. Measured over time, plant height enabled the assessment of critical genetic traits, fundamental plant physiology, and the influence of environmental conditions on plant performance [27,28]. However, commonly used plant height measurement methods including manual field measurement are slow, expensive, and do not scale well when large fields and repeated measurements are involved [27]. Remote sensing using a low-altitude unmanned aerial vehicle (UAV), such as radio-controlled multicopter, already proved its relevance for tackling these phenotyping challenges [29,30]. UAV have its importance in the experimental field in less accessible regions and with less instrumentation facilities breaking the use of more expensive technological means (phenomobile, satellites, etc.). Previous studies already demonstrated the potential of UAV phenotyping for capturing vegetation index like Normalized Difference Vegetation Index (NDVI) and assess the seasonal leaf area dynamics of sorghum [31] and plants biomass growth in barley [32]. Other studies even developed relationship between sorghum grain yield and NDVI measured during the vegetative stage [33]. Such vegetation indices is more commonly used to estimate LAI (e.g., in soybean and maize [34], wheat [35], sorghum [33]). Shafian et al. [33] used an unmanned aerial system (UAS) for monitoring growth traits including LAI, fractional vegetation cover, and yield on six grain sorghum hybrids. Potgieter et al. [31] used UAS based multispectral imaging to assess seasonal leaf area dynamics of sorghum breeding lines. Li et al. [25] investigated the potential use of UAS-derived traits to elucidate biomass, nitrogen, and chlorophyll content in sorghum lines under nitrogen stress treatments. However, to our knowledge these technologies have never been applied to deal with growth traits underlying sorghum crop yield and their variability within sorghum genetic diversity panel underlying by huge morphological variability and in response to drought.
The objective of this study was to set up and to assess the suitability of UAV based vegetation indices to estimate the temporal dynamics of leaf area, shoot biomass, and plants height within a sorghum panel representative of the genetic and phenotypic diversity of African sorghum under contrasted water situations. Once results presented, they are discussed particularly with respect to the need of supporting breeding innovation effort in West Africa.

2. Materials and Methods

2.1. Plant Materials

The two field trials were carried out in the Bambey experimental station of ISRA/CERAAS (14°42′37″ N; 16°28′49″ W, WGS84 reference system) in 2018 and 2019 (Figure 1A). The plant material consisted of 10 elite varieties of sorghum from Mali, Nigeria, and Senegal countries of West Africa (Table 1). These varieties differ in terms of days to ma-turity (90 to 128 days for maturity), height (120 to 450 cm height), response to inputs (hy-brid vs. open pollinated varieties caudatum or guinea), and yield (2 to 4.5 t ha−1). These varieties are widely cultivated by the farmers due to their adaptability and agronomic characteristics [36,37,38,39].

2.2. Experimental Design and Field Trials

The experimental design consisted of a randomized complete block design with three replicates and two water treatments (well-watered and drought stress). Rows were spaced by 60.0 cm and the replicates by 100 cm. The experiments were conducted in a sandy soil (Sand = 94.2%, silt = 3.5%, clay = 2.3%) in 2018 and 2019 during the dry season. Water supply was ensured by a sprinkler irrigation system from sowing until physiological maturity (on average 50 mm of water per week in two supplies). It was calculated to cover the weekly average evapotranspiration of sorghum that varied between 26 to 44 mm with an average of 37.2 mm (data not shown). Fertilizers were applied as NPK and urea following standard recommendation i.e., 150 kg ha−1 of NPK (15-15-15) after sowing and 100 kg ha−1 of urea before the panicle initiation. Plots in the drought stress (ds) treatment were applied a withholding of irrigation from the 30th day after sowing (DAS) and during three (3) weeks before being re-watered at the level of the well-watered (ww) treatment. The quantity of irrigated water was measured using rain gauges distributed over the test.

2.3. Data Collection and Processing

2.3.1. Data Collection

Morphological measurements were performed each week on three randomly tagged plants from the crop emergence (25 DAS) to flowering-maturity stage (89 DAS) in the field trial 2018 (Figure 1B). Seven sampling weeks of data were used for LAI (LAI, m2·m−2), and biomass (g per plot) and five weeks of data were recorded for the plant height (PHT, cm). LAI was measured using the sunscan septometer (Delta-T Devices, Cambridge, England) and PHT using a ruler. Non-destructive measurements (LAI, PHT) were performed just before UAV flights. Then plants were sampled and let dry outdoors for two weeks and oven for 3 days before biomass measurements using adventurer pro precision balance (OHAUS Corporation, Pine Brook, Parsippany, NJ, USA).
UAV flights were performed once or twice a week at the altitude of 25 m and a constant speed of 2.2 m s−1 with hexacopter drone (FeHexaCopterV2, MikroKopter Company, Moormerland, Germany). Nine grey colored ground control points (GCPs) were uniformly distributed over the entire field area with fixed position for all the flights throughout the experiment and were surveyed using Precis BX305 Real Time Kinematics (RTK) GNSS unit (Tersus GNSS Inc., Shanghai, China). They were made of painted PVC disks of 60 cm diameter where the central 40 cm diameter disk was 20% gray level and was surrounded by a 60% gray level color external crown. These gray levels were selected to avoid saturation and allow automatic target detection on the images. The UAV system (Figure 1C), equipped with six motors, can perform user-defined waypoint flights with a differential global navigation satellite system (GNSS) receiver. The UAV support software (Mikrokopter tools, Mikrokopter Company, Moormerland, Germany) that implements a flight plan, monitors the flight and allow information’s including drone position. We perform a flight with an RGB ILCE-6000 digital camera (Sony Corporation, New York, NY, USA) with a 6000 × 4000 pixel sensor equipped with a 60 mm focal length lens. To minimize the blurring effect and noise in the images, the camera was set on speed priority (1/1250 s) and auto ISO mode. Then after, we perform another flight with an Airphen multispectral camera (hiphen, Avignon, France, https://www.hiphen-plant.com/, accessed on 15 December 2020) equipped with an 8 mm focal length lens and acquiring 1280 × 960 pixel images). The Airphen comprises six individual cameras equipped with filters centered on 450, 530, 560, 675, 730 and 850 nm, with a spectral resolution of 10 nm. For each camera (RGB and MS), the flight lasted about 15 min with around 10 min of preparing the second flight. The cameras captured images at one-second intervals and recorded them in JPG and Tiff format on the SD memory card. The drone did round trip spaced of 4 m that allow a side and forward overlapping fraction of 0.75. To reduce effects of ambient light condition, we limited flight to clear and cloudless days between 10:00 to 12:00 A.M. (Greenwich Mean Time, GMT) that allowed to reduce the plants shadow effect as its contribution between rows in mature stages can greatly affect spectral measures.

2.3.2. Extraction of Vegetation INDICES and Height Estimation at Plot Scale

An automatic image-processing pipeline was designed to generate radiometrically calibrated and geometrically corrected multiband orthoimages using Agisoft PhotoScan digital photogrametric software version 1.4.0 (Agisoft LLC, St. Petersburg, Russia, https://www.agisoft.com/downloads/installer/, accessed on 15 December 2020). Radiometric calibration included automatic correction of vignetting effects [40]. Real reflectances were computed using a reference target positioned to the ground during UAV flights. This target was previously spectrally characterized in controlled conditions. Geometric correction involved, firstly, multiband co-registration to modify and adjust the images’ coordinate system to decrease geometric distortions and make pixels in different pictures coincide with the corresponding map-grid points. The co-registration process was based upon the internal GNSS from raw image metadata. Orthorectification was then performed using GCPs to increase the accuracy of the generated orthoimage. As agisoft photoscan manages multilayer images, we used the 450 nm band for tie point searching. For a better plots segmentation, we uploaded the RGB orthoimage in QGIS (Geographical Information SYSTEMS, version 3.10.0, QGIS Development Team, open source 2019, https://www.qgis.org/fr/site/forusers/download.html, accessed on 15 December 2020) and designed the plots boundaries (Figure 2A). The created shapefile with the GNSS coordinates of each plot was exported as spatial vector data. The extraction of the average values of vegetation index in each plot of a variety was performed according to the GNSS coordinates of plots, extracted on QGIS and MS orthoimage. The computation was performed using R software (version 3.6.0) libraries (sf, raster, rgdal, RSToolbox and uavRst) [41]. Five vegetation indices were used to estimate LAI and biomass during the dry-season 2018 and 2019 (Table 2). These vegetation indices are single value computed by grid calculation. They are invariant to the difference in illumination conditions, slope, seasons, etc. They represent a quick way to distinguish green leaves from other objects and estimate the relative biomass present in the image, therefore, distinguish stressed vegetation from non-stressed one [25,42,43,44].
The digital surface model (DSM) data were constructed from images taken by the UAV with the geographic coordinates of GCPs. The structure- from-motion algorithm has some advantages in feature point matching and generating point clouds. In the algorithm, feature point matching is performed by taking into account the correspondence between overlapping images estimated from their geographic coordinates. As a result, spatial skew hardly occurs. In the generation of point clouds, all pixels were analyzed to detect matching points. This decreased the number of missing matches and prevented point clouds from being sparse. The derivation of digital terrain model (DTM) approach is based on the extraction of ground points from the dense point cloud and interpolation between them to generate the DTM. The phenotyping platform was split into 13 m × 13 m cells with a 75% overlapping (in both x and y directions) [50]. The size of the cell is a compromise between a small one that allows to get of finer description of digital terrain model variations, and a large one that will ensure to get at least few background points from the dense cloud points. DSM and DTM values were calculated based on the World Geodetic System 1984 and a resolution about 1.09 cm/pixel. Overall, the plants height estimation was obtained by subtracting the digital terrain model (DTM) from the digital surface model (DSM) (Figure 2B).

2.4. Statistical Analyses

Statistical analyses were performed in R version 3.6.0 [41] using tydiverse and caret packages. Ordinary least squares linear regression models were applied. Regression models were developed to predict LAI, Biomass and PHT using vegetation indices and UAV height proxy. Data from the first trial in 2018 were used to calibrate the image-based models and data from the second trial for validation. The performance of regression models in estimating LAI, biomass and PHT were evaluated by calculating the root mean squared error (RMSE), the coefficient of determination (r2) and p-values at 0.05 level of probability.
An analysis of variance (ANOVA) was performed after testing normality on residuals using R (agricolae and Rcmdr packages) [41] for the ground measured LAI and biomass; the calculated LAI and biomass and the vegetation indices (NDVI, CTVI, MSAVI2, GNDVI and SR) studied. The combined analysis of variance was performed to test the effect of variety, water regime and the interaction between variety and water regime (variety × water regime) using the method of ANOVA over combined locations suggested by Mcintosh [51]. The homogeneity between residual variances was tested using Bartlett’s test [52]. Treatment means were compared using the Least Significant Difference (LSD) at the 5% level of probability.

3. Results

3.1. Calibration of LAI and Biomass Using UAV-Derived Spectral Indices

Results presented in Table 3 show the relationship between LAI, biomass and vegetation indices. Non-linear and linear regression models were fitted using the 2018 field data set (n = 390, calibration data). Regression analysis revealed good relationship between LAI or biomass with NDVI, CTVI, GNDVI, MSAVI2 and SR. To assess the performance of vegetation indices to estimate LAI and biomass, we compared the coefficients of determination (r2) of the relationships between NDVI, CTVI, GNDVI, MSAVI2, SR and LAI that were respectively of 0.83, 0.82, 0.82, 0.76 and 0.77 with highly significant p values. However, the r2 for biomass estimation using the same indices were comparatively lower (0.6, 0.6, 0.6, 0.57, and 0.47 respectively). Figure 3 shows the different plots of VIs with the corresponding LAI and biomass. The LAI and biomass values varied from 0.3 to 5.7 m2 m−2 and 0.6 to 101.7 g per plant respectively among genotypes, treatments and developmental stages in 2018 trial. A saturation of the different vegetation indices observed above LAI and biomass values upper than 4 m2 m−2 and 75 g per plant, respectively. To test the variance of calibration models, anordinary least squares linear regressions between calculated and measured LAI and biomass revealed an r2 values of 0.8 and 0.5 for LAI and biomass respectively (Figure 4).

3.2. Validation LAI and Shoot Biomass Predictive Models

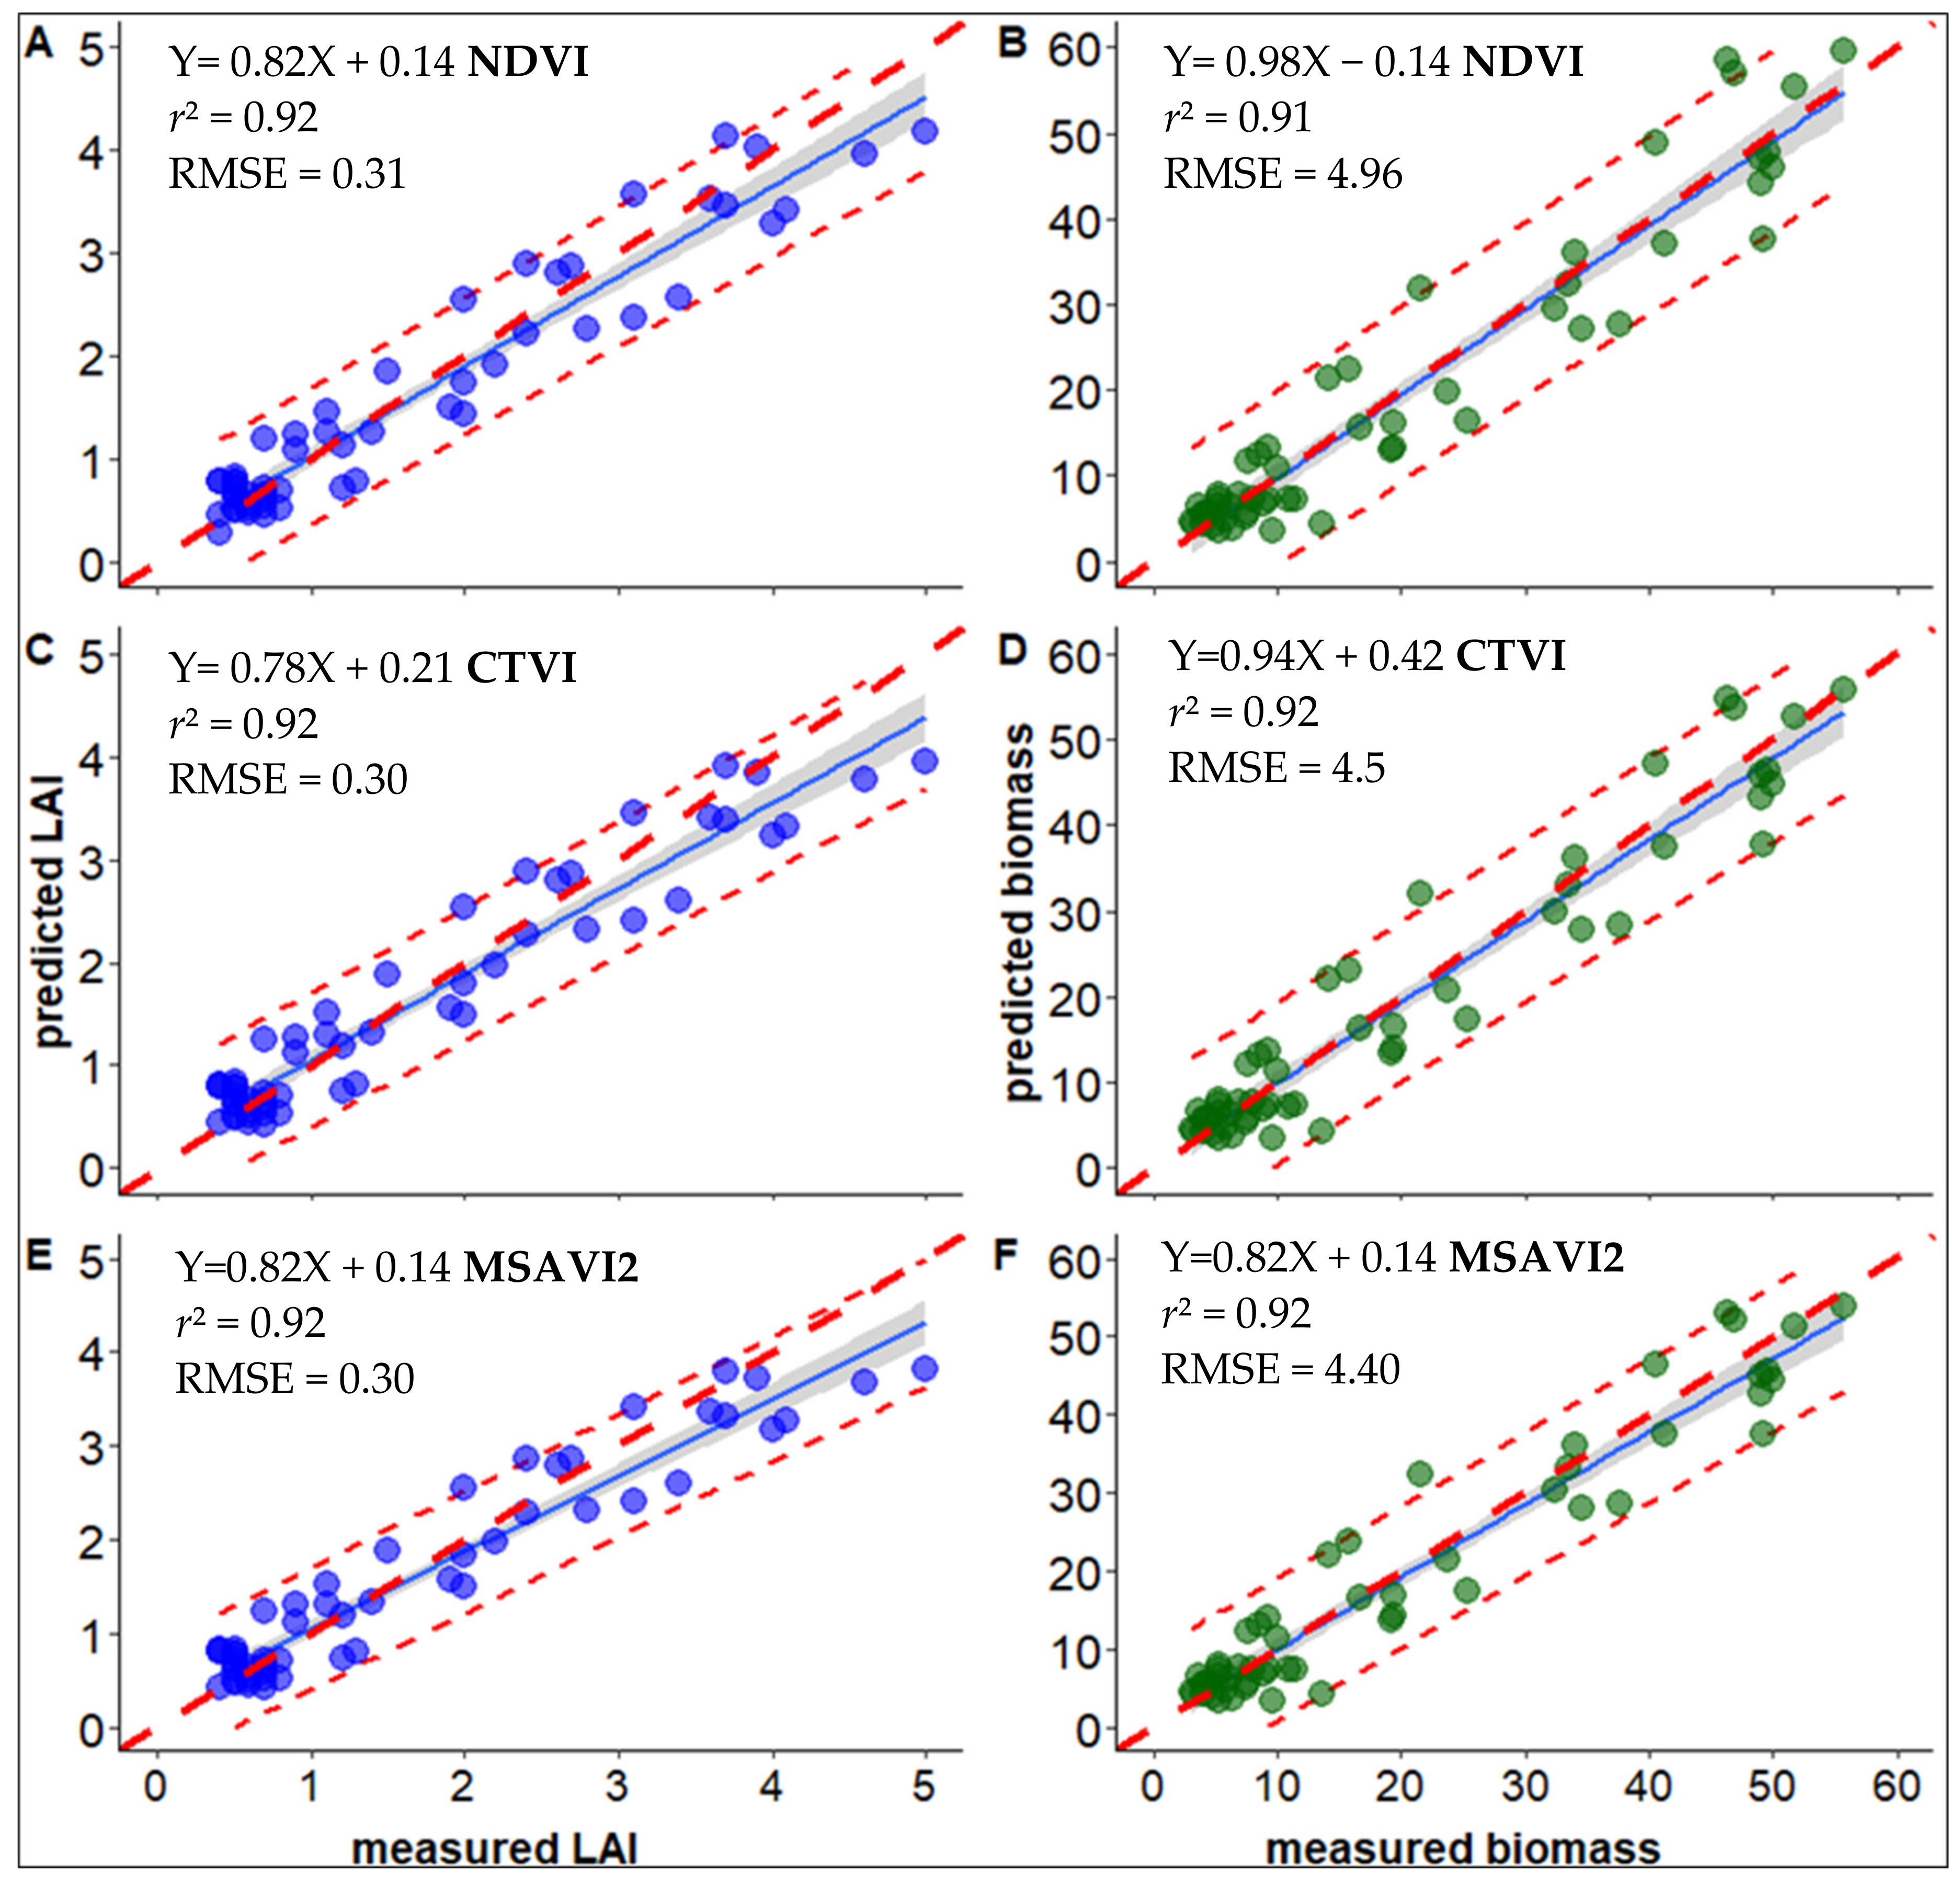
The models developed were evaluated using the data acquired at the end of stress period in 2019, i.e., when variability among genotypes and treatments was the highest. Figure 5 presents the linear regressions between predicted and measured LAI and shoot biomass, respectively. The relationship between LAI and VIs was highly significant with stronger r2 values for NDVI, CTVI and MSAVI2 (p < 0.001, r2 = 0.92, rmse = 0.3) and SR (p < 0.001, r2 = 0.89, RMSE = 0.37) (Table 4). However, the GNDVI index was the less able to predict LAI (p < 0.001, r2 = 0.80, RMSE = 0.44). An overestimation of small LAI values and an underestimation of higher LAI values could be highlighted for all indices although more significant with GNDVI. In the same way, results obtained in validating biomass prediction models were also satisfactory (r2 ranged from 0.77 for GNDVI to 0.92 for CTVI and MSAVI2 while the rmse ranged from 7.06 for GNDVI to 4.4 g per plant for MSAVI2) with high significant linear regression (p < 0.001). The rmse for LAI and biomass represent about 18 and 22% of the grand mean of varieties respectively.

3.3. Assessment of UAV-Based Plant Height

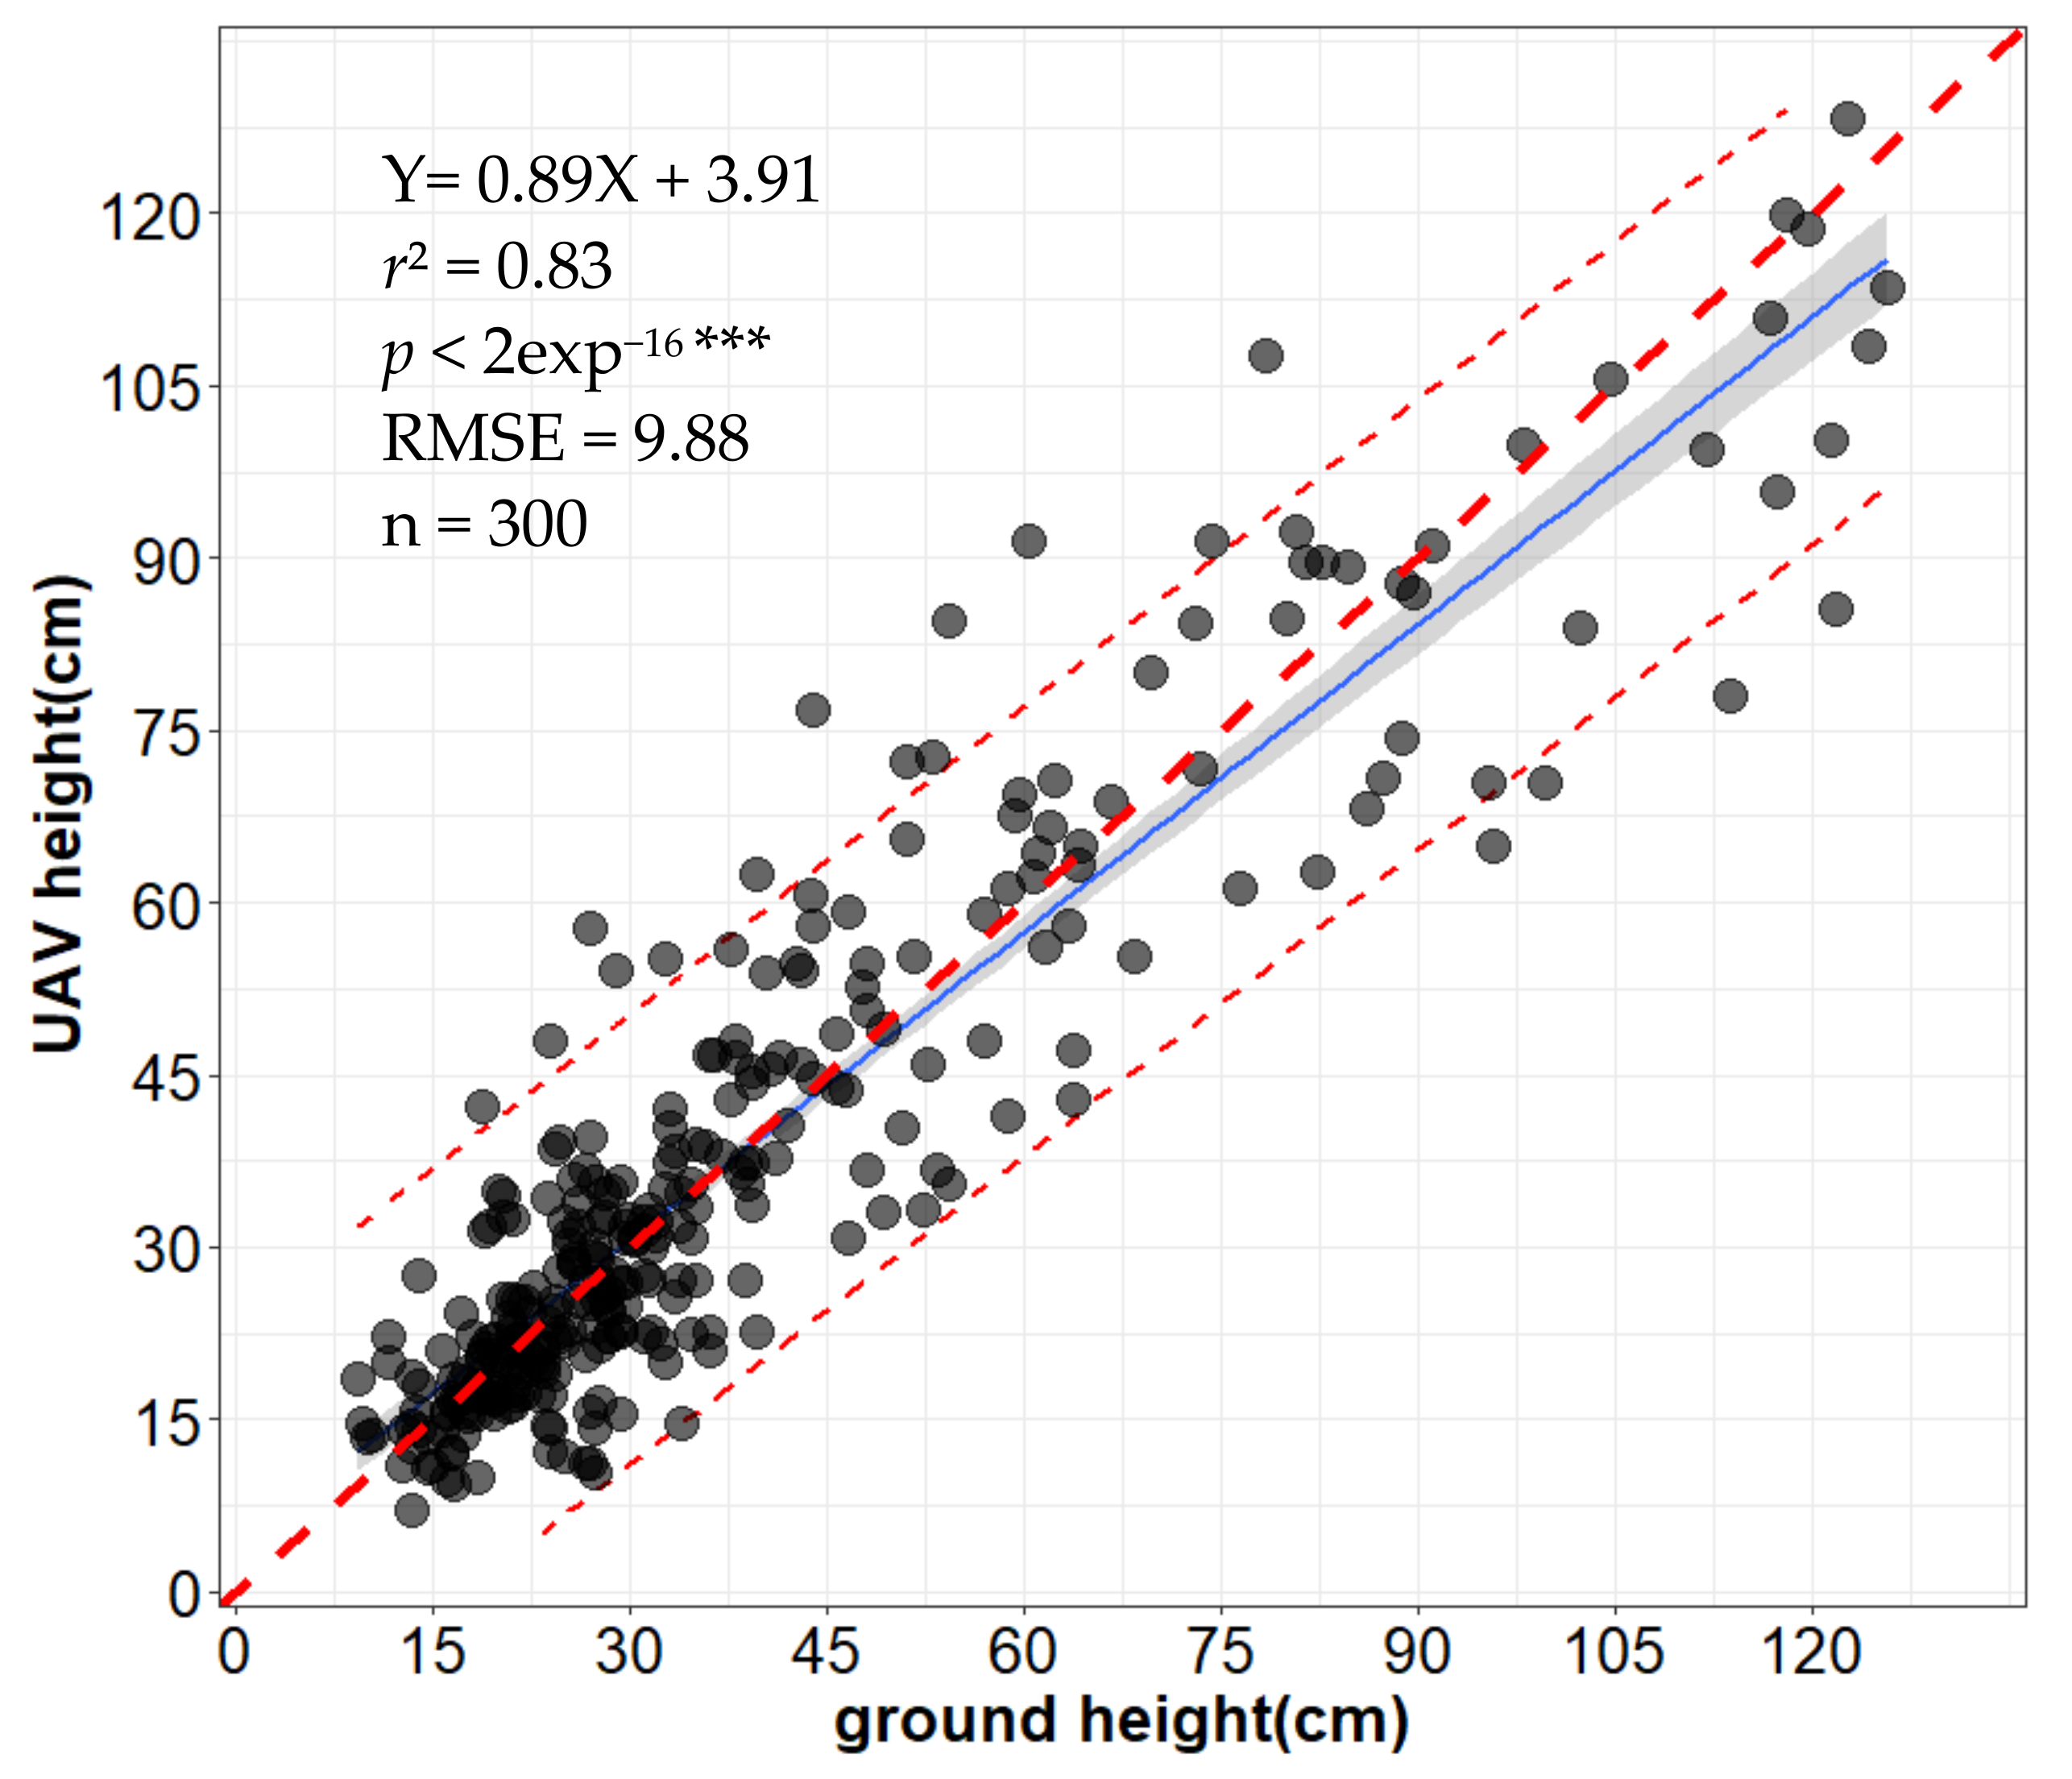
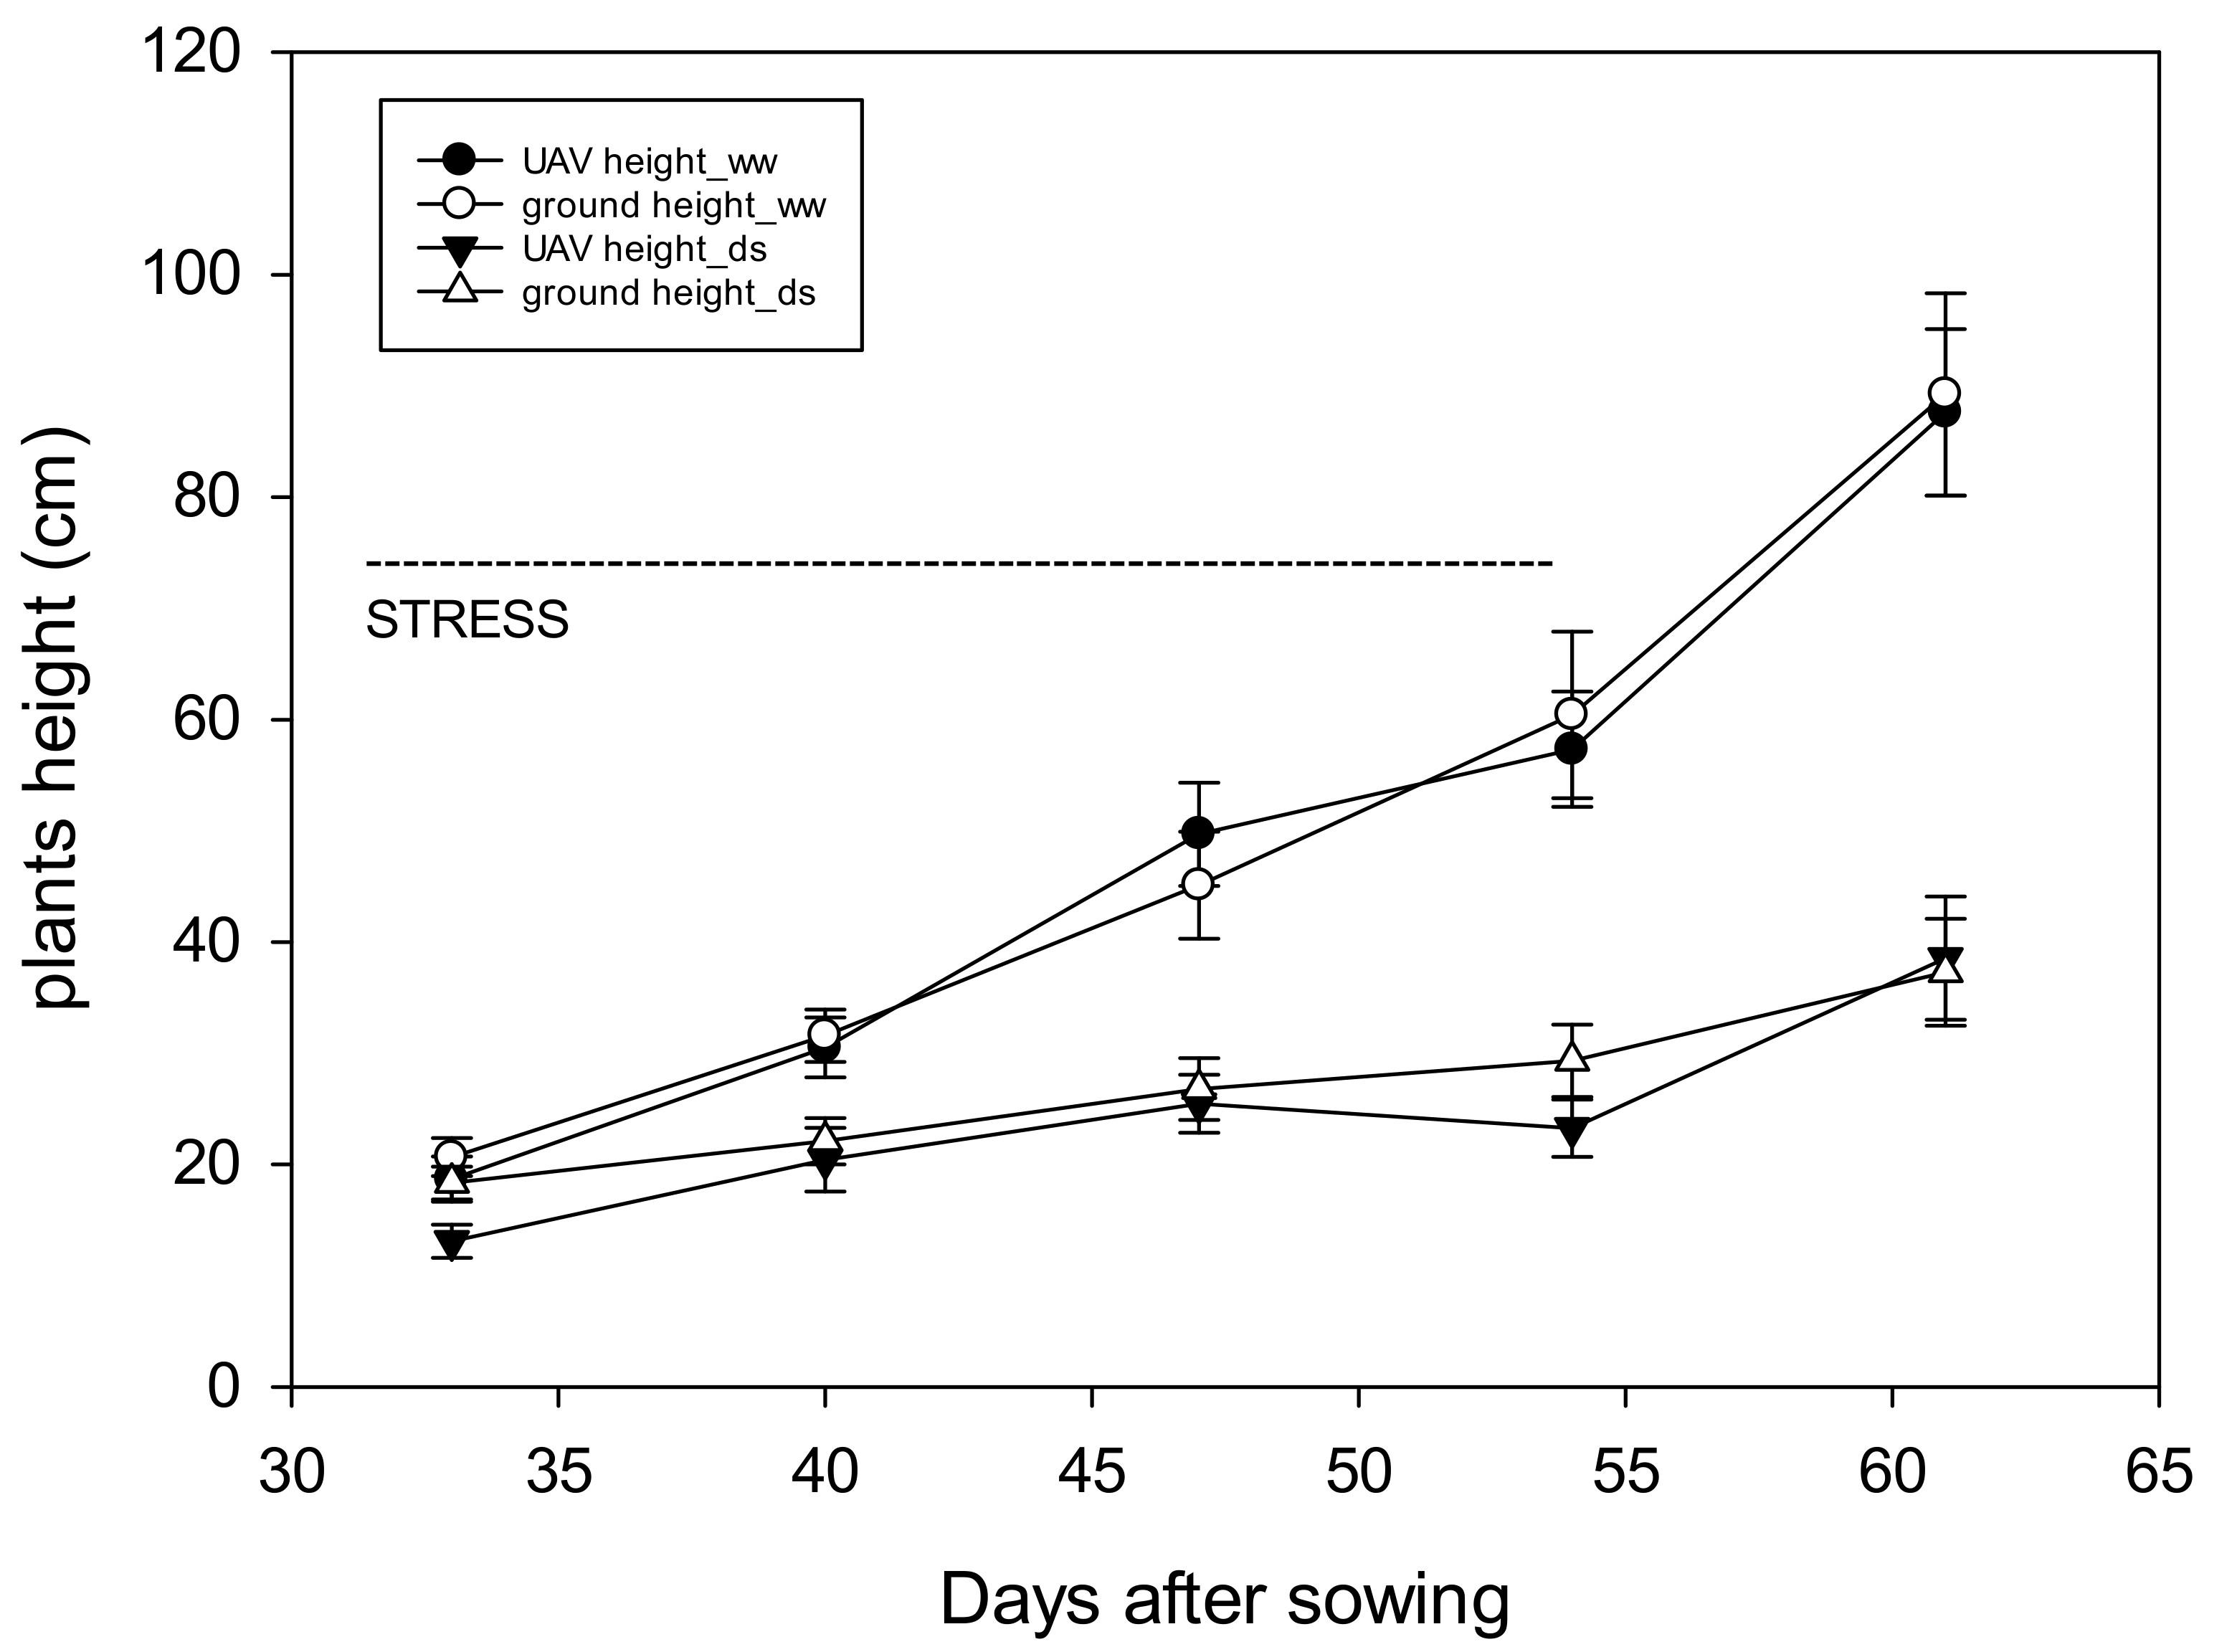
Plant height is an important selection target since it is associated with yield potential, stability and particularly with lodging resistance in various environments. Rapid and cost-effective estimation of plant height from UAVs using a digital surface model integrated academic research and practical sorghum breeding programs. Regression analysis performed in this study showed the relationship between UAV and ground-based plant height dynamic (p < 0.001, r2 = 0.83, rmse = 9.88 cm, Figure 6). The average of varieties over time in measured height comprised between 9 to 125 cm while the UAV based height comprised between 7 to 128 cm. Moreover, the results presented in Figure 7 showed similar dynamics of PHT between observed and estimated across the two water treatments (well-watered and drought stress). The PHT increase gradually after emergence with a weaker growth in stressed plants.

3.4. Monitoring Plant Development by UAV Based Vegetation Indices (VIs)

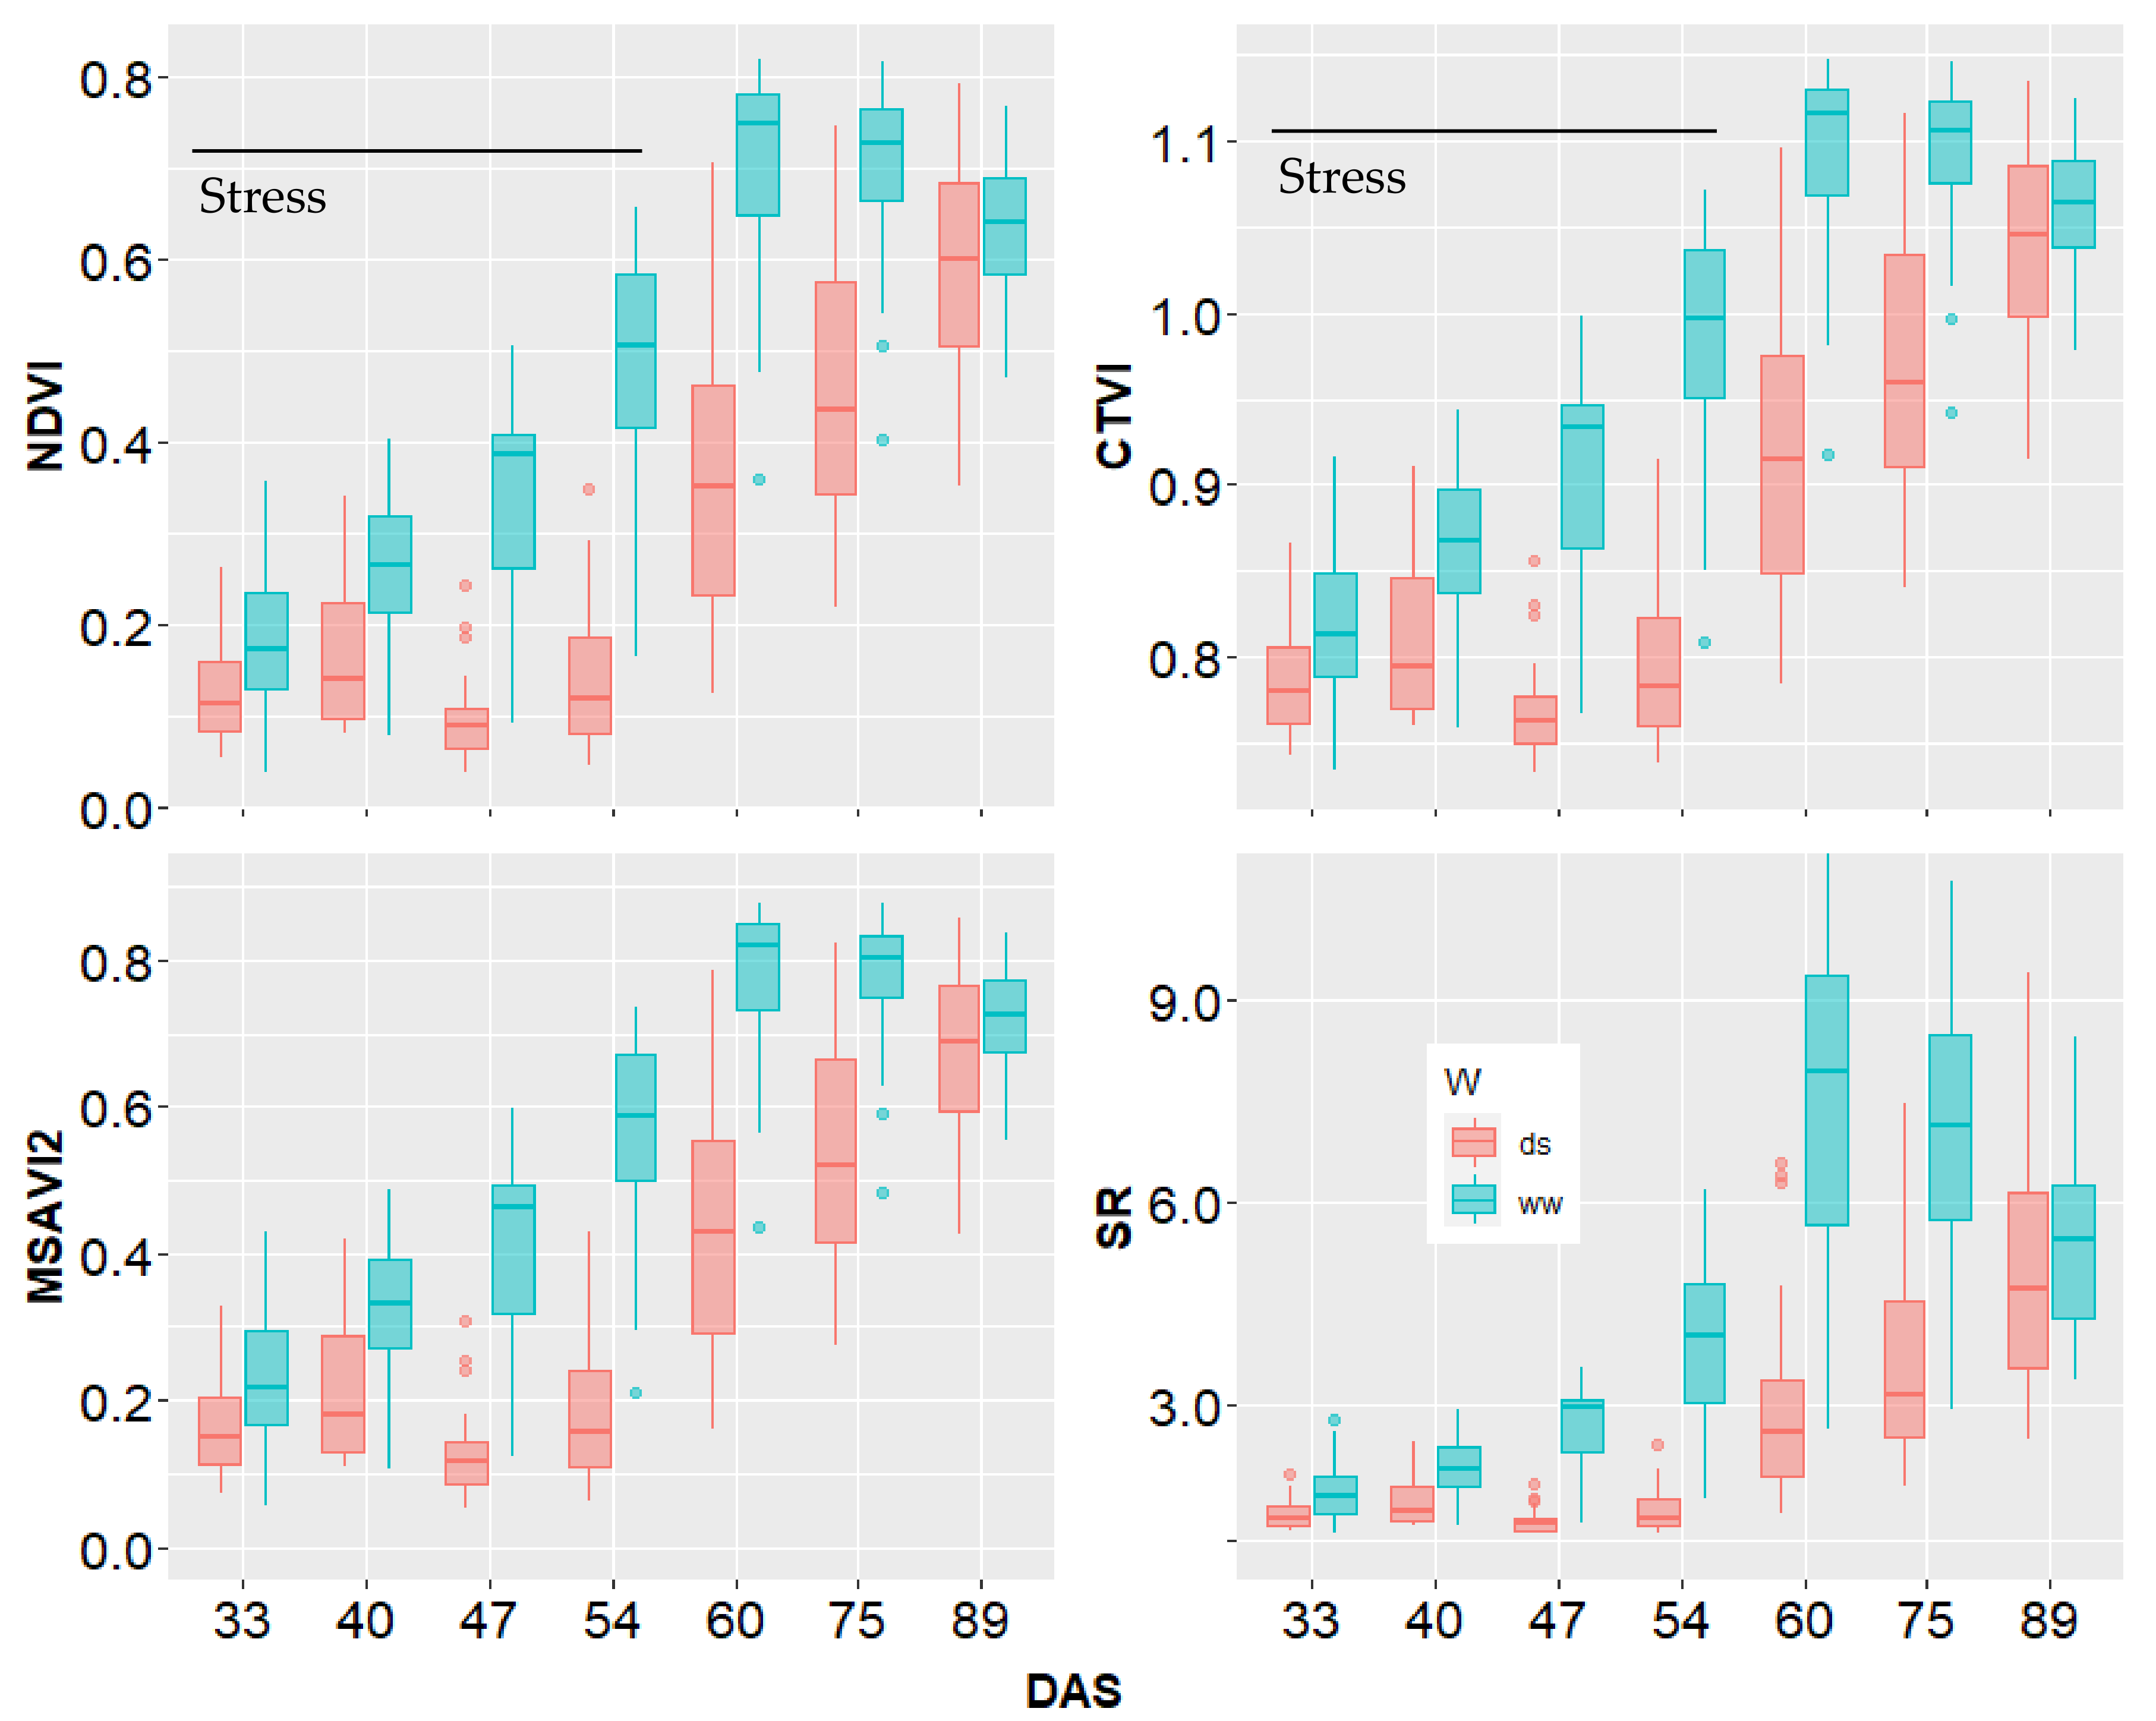
Table 5 presents the ANOVA of assessed UAV vegetation indices. The combined analysis of variance revealed highly significant differences (p ≤ 0.05) between varieties, water regime and the interaction between both for all Vis. This is in line with that observed for field measurements of LAI (Table 6) and biomass (Table 7). The water deficit led to a reduction of growth rate and biomass accumulation which induced a decrease in vegetation. In the drought treatment, variety V3 recorded the highest values for all Vis as well as calculated LAI and biomass while V10 exhibited the lowest one. Moreover, the varieties V3 and V1 recorded the highest measured LAI and biomass while V4 and V10 had the lowest one, respectively (Table 6 and Table 7). Indeed, under well-watered conditions, variety V6 had the lowest values of VIs as well as calculated LAI and biomass while V8 and V3 recorded the highest vegetation indices and calculated LAI respectively. In the field measured traits, V8 and V7 revealed the highest LAI and biomass respectively while V4 exhibited the lowest LAI and biomass. Figure 8 shows the dynamics of vegetation indices during plant growth in both well-watered and drought stress conditions. The vegetation indices of non-stressed plants gradually increased to reach maximum values at the 60th day after sowing (flowering time) before dropping slightly. In the stressed plots, the vegetation indices initially recorded a slight increase but then water deficit induced a reduction and despite of an increase after re-watering, the VIs values did not recover values of non-stressed plants.

4. Discussion

Recent advances in high throughput field phenotyping have boosted the capacity of introducing physiological information into the breeding process [27,53,54,55]. Currently, UAV technology is an alternative to the manual collection of crop data, offering information on traits and factors affecting crop development and productivity with relatively shorter time and lower cost [56,57]. In this study, the moderate to strong significant correlations (r varied from 0.68 to 0.91; p < 0.001) found between the UAV-derived spectral vegetation indices and the sorghum LAI, shoot biomass temporal dynamics indicate that these methods can be deployed for phenotyping extremely large genetic and phenotypic diversity as encountered within African sorghum genotypes. This huge variability contributed to the performance of the model and explained the relatively good r2 values obtained between calculated and measured traits. However, a drawback to the empirical models used in this study is that they strictly depend to the ground truth data collection and quality. Thus, errors could occur in both ground truth measurements and UAV estimates [58]. The saturation of NDVI observed at high LAI (LAI > 4 m2 m−2) and shoot biomass (biomass > 75 g per plant) was previously reported by many studies [31,59,60,61] and could be caused by the post flowering slight decrease of the vegetation observed in well-watered treatment, where plant have grown up enough. In this kind of situations, Mutanga et al. [62] reported that other indices like NDRE could be more efficient than NDVI, after canopy closure due to the saturation in the red spectral band at the mid to late growth stages.
In our study biomass prediction was less good than LAI. The complexity of biomass traits, which is not necessarily linked to vegetation dragged to a fairly good correlation (r2 = 0.6). Challenges remain also in dealing with the large variability among genotypes and their response under drought conditions. Indeed, some varieties of caudatum sorghum race have much biomass with a low vegetation cover, big size or small size. Moreover, the breeding program allowed much diversity in the collection that constitute a lot of challenge for technologist but the rise of analysis at collection level drive to face this challenge. Thus, the rapid development of GPU and machine learning technologies in recent years could improve the model capabilities [63]. However, it could be interesting to develop vegetation indices that care about plant height, vegetation cover quantity and the type of leaves for biomass estimation. Therefore, the biomass calibration model found in this study allowed a moderate relationship between predicted and measured data and could distort the prediction accuracy. Thus, further research are necessary to improve biomass prediction through the inclusion of additional morphological traits such as stem diameter, leaves thickness and additional or customized spectral bands [64]. Varela et al. [65] demonstrated the ability to increase the biomass estimation accuracy when combined with manually measured stem diameter on the UAVs-derived plant height. This approach allowed to significantly increase (r from 0.56 to 0.93) the biomass prediction using a volumetric cylinder equation in corn. The combination of hyperspectral canopy reflectance and plant height improved the accuracy of estimating winter wheat biomass (r from 0.73 to 0.91) [66]. Chen et al. [67] observed a significant difference in NIR reflectance in barley plants under drought conditions as NIR reflectance can be influenced by leaf thickness in addition to leaf water content [68]. Neilson et al. found that leaf thickness was the primary factor behind the differences observed between two sorghum varieties tested in a drought experiment [10]. Thus, our next challenge will be to implement such additional traits to improve the model estimation and validate it for the West African sorghum collection [5,69]. The moderate correlations (r2 = 0.6) observed for biomass could be related also to the application of the plot segmentation in this study. We could have improved plot segmentation accuracy by enlarging the experiment plot size or using drones with higher resolution cameras. This may not be a problem when dealing with large agronomic or agricultural fields. The overestimation of the small values of LAI in younger plants and the underestimation of high values of LAI and PHT in mature plants might be explained by many reasons. Malambo et al. [70] stated that time lags between the UAV-based measurements and the field-based measurements could cause over or under estimation, while others suggested that biased estimation of height is more likely a result from inaccuracies in the point cloud generation process and is, thus, likely to be related to a biomass increase during the crop development, which could complicate the SfM processing [71,72]. In fact, the RMSE (9.88 cm) of plant height model found in this study suggest a limited monitoring of sorghum height since during the growing season you find relative height increase of few centimeters along the same plant. Nevertheless, the plants height model approach used to extract DTM and DSM was found to be efficient for comparison with ground ruler measurements considering the spatial variability over each microplot. Noteworthy that in terms of geometric quality, the accumulated horizontal and vertical error was 1.09 cm pixel−1 in orthomosaic. UAVs based plants height estimation were studied in many crop genotypes and different growing conditions [50,55,73,74,75]. We used here these different technologies to compute prediction model that would interest in phenotyping for West Africa sorghum genotypes breeding.
The results highlighted in this study testified the availability of VIs to capture the difference induced by drought that occurs from the 30th to 54th days after sowing, thus the capacities of such vegetation indices to monitor sorghum growth both under well-watered and drought stress conditions. Hence, monitoring plants development at multiple times demonstrates the potential of these methods to study canopy temporal dynamics. Our result on Figure 8 showed the efficiency of VIs to phenotype sorghum because the monitoring of plants growth in the two water regime reveled very promising. Previous findings [62,76,77,78] have promoted VIs related to NDVI as an important multi spectral index to track the agro-physiological temporal dynamics of key traits such as biomass, LAI, yield etc. However, breeders are not well aware and have less understanding about the application of the different reflectance bands ratio on monitoring crops development. Higher level of NDVI is associated with faster growth rate, higher biomass accumulation during the vegetative stage and a longer grain filling period by delaying leaf senescence during the ripening phase thereby increasing yield [79]. Moreover, monitoring crops throughout the vegetation period is one prerequisite for precision agriculture [80,81]. This study demonstrates the ability to estimate sorghum plant height, above ground biomass, and canopy LAI using UAV RGB and multispectral images. These attempts benefitted the phenotyping of sorghum breeding. However, there was one limitation that are worth noting. It is that there were only three phenotypic parameters that were studied. This is just a glimpse into phenotyping using a UAV technique. There are more phenotypic parameters that should and can be estimated from UAV images [82,83] to mine the big potential of UAV techniques and promote modern sorghum breeding development.

5. Conclusions

The use of UAVs high-throughput phenotyping systems imaging is widely regarded as a key technology allowing scientists and breeders to develop crops with the ability to perform well under diverse environmental conditions. Estimating above-ground biomass helps to monitor crop vitality and to predict yield. The image-based traits and models-derived parameters found in this study are promising and might be improved for subsequent genetic mapping to uncover the genetic basis of sorghum drought tolerance. The results presented here will be useful to advance our views of phenotypic trait components underlying plant development and their responses to environmental stress. We are investigating data augmentation strategies to generate additional training data. Data from other modalities like thermal and LiDAR will also be acquired in the future, and evaluated for improving the models.

Author Contributions

Conceptualization, B.G., A.A., J.S.B.D.; methodology, B.G., J.S.B.D., A.A.; software, B.G., J.S.B.D., A.N.; validation, B.G., A.A., D.D., D.L., G.B.; formal analysis, B.G., J.S.B.D.; investigation, B.G., A.A, J.S.B.D., A.N.; resources, B.G., A.A., A.N.; data curation, B.G., J.S.B.D., A.N.; writing—original draft preparation, B.G.; writing—review and editing, B.G., D.L., G.B., D.D., A.A.; visualization, D.L., G.B., A.A.; supervision, A.A., D.D.; project administration, A.A.; funding acquisition, A.A. All authors have read and agreed to the published version of the manuscript.

Funding

This work constitutes part of doctoral research studies. The scholarship was funded by DAAD, the German academic exchange service. The research was conducted with the financial support of the sgt terra gates project funded by Bill and Melinda Gates foundation and benefit the facilities of the Centre d’Etude Régional pour l’Amélioration de l’Adaptation à la Sécheresse (CERAAS).

Institutional Review Board Statement

Not applicable.

Informed Consent Statement

Not applicable.

Data Availability Statement

The data presented in this study are available on request from the corresponding author.

Acknowledgments

The authors would like to thank the Hiphen company staff for their help in the use of the Airphen multispectral camera. The authors also thank Seynabou Touré Seck, Bakary Vieux Diallo and Ndeye Fama Diouf for their gracious aid toward the field data collection during their master training period.

Conflicts of Interest

The authors declare no conflict of interest. The funders had no role in the design of the study; in the collection, analyses, or interpretation of data; in the writing of the manuscript, or in the decision to publish the results.

References

  1. Hunter, M.C.; Smith, R.G.; Schipanski, M.E.; Atwood, L.W.; Mortensen, D.A. Agriculture in 2050: Recalibrating targets for sustainable intensification. Bioscience 2017, 67, 386–391. [Google Scholar] [CrossRef] [Green Version]
  2. Altieri, M.A.; Nicholls, C.I. The adaptation and mitigation potential of traditional agriculture in a changing climate. Clim. Chang. 2013, 140, 33–45. [Google Scholar] [CrossRef]
  3. Tari, I.; Laskay, G.; Takács, Z.; Poór, P. Response of sorghum to abiotic stresses: A review. J. Agron. Crop Sci. 2013, 199, 264–274. [Google Scholar] [CrossRef] [Green Version]
  4. Hadebe, S.T.; Modi, A.T.; Mabhaudhi, T. Drought Tolerance and Water Use of Cereal Crops: A Focus on Sorghum as a Food Security Crop in Sub-Saharan Africa. J. Agron. Crop Sci. 2017, 203, 177–191. [Google Scholar] [CrossRef]
  5. Billot, C.; Ramu, P.; Bouchet, S.; Chantereau, J.; Deu, M.; Gardes, L.; Noyer, J.L.; Rami, J.F.; Rivallan, R.; Li, Y.; et al. Massive Sorghum Collection Genotyped with SSR Markers to Enhance Use of Global Genetic Resources. PLoS ONE 2013, 8, 1–16. [Google Scholar] [CrossRef] [PubMed] [Green Version]
  6. Romana, K.K.; Chander, G.; Deshpande, S.; Gupta, R. Genomic-assisted enhancement in stress tolerance for productivity improvement in sorghum. Biotechnol. Crop Improv. 2018, 3, 265–288. [Google Scholar] [CrossRef]
  7. Bodian, A.; Ouattara, B.; Sarr, A.; Gano, B.; Sall, M.-N.; Ndir, K.-N.; Cissé, N.; Falalou, H. Genetic structure and diversity in Sorghum bicolor (L.) Moench landraces from marginal sorghum production lands in Senegal, based on SSR markers. J. Plant Breed. Genet. 2020, 7, 134–144. [Google Scholar] [CrossRef]
  8. Perrier, L.; Rouan, L.; Jaffuel, S.; Clément-Vidal, A.; Roques, S.; Soutiras, A.; Baptiste, C.; Bastianelli, D.; Fabre, D.; Dubois, C.; et al. Plasticity of sorghum stem biomass accumulation in response to water deficit: A multiscale analysis from internode tissue to plant level. Front. Plant Sci. 2017, 8, 1–14. [Google Scholar] [CrossRef] [PubMed] [Green Version]
  9. Belko, N.; Zaman-Allah, M.; Cisse, N.; Diop, N.N.; Zombre, G.; Ehlers, J.D.; Vadez, V. Lower soil moisture threshold for transpiration decline under water deficit correlates with lower canopy conductance and higher transpiration efficiency in drought-tolerant cowpea. Funct. Plant Biol. 2012, 39, 306–322. [Google Scholar] [CrossRef] [PubMed] [Green Version]
  10. Neilson, E.H.; Edwards, A.M.; Blomstedt, C.K.; Berger, B.; Møller, B.L.; Gleadow, R.M. Utilization of a high-throughput shoot imaging system to examine the dynamic phenotypic responses of a C4 cereal crop plant to nitrogen and water deficiency over time. J. Exp. Bot. 2015, 66, 1817–1832. [Google Scholar] [CrossRef] [PubMed]
  11. Gholipoor, M.; Sinclair, T.R.; Prasad, P.V.V. Genotypic variation within sorghum for transpiration response to drying soil. Plant Soil 2012, 357, 35–40. [Google Scholar] [CrossRef]
  12. Yan, G.; Hu, R.; Luo, J.; Weiss, M.; Jiang, H.; Mu, X.; Xie, D.; Zhang, W. Review of indirect optical measurements of leaf area index: Recent advances, challenges, and perspectives. Agric. For. Meteorol. 2019, 265, 390–411. [Google Scholar] [CrossRef]
  13. Larue, F.; Fumey, D.; Rouan, L.; Soulié, J.-C.; Roques, S.; Beurier, G.; Luquet, D. Modelling tiller growth and mortality as a sink-driven process using Ecomeristem: Implications for biomass sorghum ideotyping. Ann. Bot. 2019, 124, 675–690. [Google Scholar] [CrossRef] [PubMed]
  14. Shakoor, N.; Lee, S.; Mockler, T.C. High throughput phenotyping to accelerate crop breeding and monitoring of diseases in the field. Curr. Opin. Plant Biol. 2017, 38, 184–192. [Google Scholar] [CrossRef] [PubMed]
  15. Eggen, M.; Ozdogan, M.; Zaitchik, B.; Ademe, D.; Foltz, J.; Simane, B. Vulnerability of sorghum production to extreme, sub-seasonal weather under climate change. Environ. Res. Lett. 2019, 14. [Google Scholar] [CrossRef]
  16. Borrell, A.K.; Mullet, J.E.; George-jaeggli, B.; Van Oosterom, E.J. Drought adaptation of stay-green sorghum is associated with canopy development, leaf anatomy, root growth, and water uptake. J. Exp. Bot. 2014, 65, 6251–6263. [Google Scholar] [CrossRef] [PubMed]
  17. Borrell, A.K.; Van Oosterom, E.J.; Mullet, J.E.; George-Jaeggli, B.; Jordan, D.R.; Klein, P.E.; Hammer, G.L. Stay-green alleles individually enhance grain yield in sorghum under drought by modifying canopy development and water uptake patterns. New Phytol. 2014, 203, 817–830. [Google Scholar] [CrossRef] [PubMed]
  18. He, J.; Jin, Y.; Du, Y.L.; Wang, T.; Turner, N.C.; Yang, R.P.; Siddique, K.H.M.; Li, F.M. Genotypic variation in yield, yield components, root morphology and architecture, in soybean in relation to water and phosphorus supply. Front. Plant Sci. 2017, 8, 1–11. [Google Scholar] [CrossRef] [Green Version]
  19. Weiss, M.; Baret, F.; Smith, G.J.; Jonckheere, I.; Coppin, P. Review of methods for in situ leaf area index (LAI) determination Part II. Estimation of LAI, errors and sampling. Agric. For. Meteorol. 2004, 121, 37–53. [Google Scholar] [CrossRef]
  20. Wang, L.; Zhou, X.; Zhu, X.; Dong, Z.; Guo, W. Estimation of biomass in wheat using random forest regression algorithm and remote sensing data. Crop J. 2016, 4, 212–219. [Google Scholar] [CrossRef] [Green Version]
  21. Hensgen, F.; Bühle, L.; Wachendorf, M. The effect of harvest, mulching and low-dose fertilization of liquid digestate on above ground biomass yield and diversity of lower mountain semi-natural grasslands. Agric. Ecosyst. Environ. 2016, 216, 283–292. [Google Scholar] [CrossRef]
  22. Huang, J.; Sedano, F.; Huang, Y.; Ma, H.; Li, X.; Liang, S.; Tian, L.; Zhang, X.; Fan, J.; Wu, W. Assimilating a synthetic Kalman filter leaf area index series into the WOFOST model to improve regional winter wheat yield estimation. Agric. For. Meteorol. 2016, 216, 188–202. [Google Scholar] [CrossRef]
  23. Barrero Farfan, I.D.; Murray, S.C.; Labar, S.; Pietsch, D. A multi-environment trial analysis shows slight grain yield improvement in Texas commercial maize. Field Crops Res. 2013, 149, 167–176. [Google Scholar] [CrossRef]
  24. Feng, W.; Guo, B.; Zhang, H.; He, L.; Zhang, Y.; Wang, Y.; Zhu, Y.; Guo, T. Remote estimation of above ground nitrogen uptake during vegetative growth in winter wheat using hyperspectral red-edge ratio data. Field Crops Res. 2015, 180, 197–206. [Google Scholar] [CrossRef]
  25. Li, J.; Shi, Y.; Veeranampalayam-Sivakumar, A.N.; Schachtman, D.P. Elucidating sorghum biomass, nitrogen and chlorophyll contents with spectral and morphological traits derived from unmanned aircraft system. Front. Plant Sci. 2018, 9, 1–12. [Google Scholar] [CrossRef] [PubMed]
  26. Chapman, S.C.; Merz, T.; Chan, A.; Paul, J.; Hrabar, S.; Dreccer, M.F.; Holland, E.; Zheng, B.; Ling, T.J.; Jimenez-Berni, J. Pheno-Copter: A Low-Altitude, Autonomous Remote-Sensing Robotic Helicopter for High-Throughput Field-Based Phenotyping. Agronomy 2014, 4, 279–301. [Google Scholar] [CrossRef] [Green Version]
  27. Araus, L.; Cairns, J.E. Field high-throughput phenotyping: The new crop breeding frontier. Trends Plant Sci. 2014, 19. [Google Scholar] [CrossRef]
  28. Ghanem, M.E.; Marrou, H.; Sinclair, T.R. Physiological phenotyping of plants for crop improvement. Trends Plant Sci. 2015, 20, 139–144. [Google Scholar] [CrossRef]
  29. Su, W.; Zhang, M.; Bian, D.; Liu, Z.; Huang, J.; Wang, W.; Wu, J.; Guo, H. Phenotyping of corn plants using unmanned aerial vehicle (UAV) images. Remote Sens. 2019, 11, 2021. [Google Scholar] [CrossRef] [Green Version]
  30. Han, X.; Thomasson, J.A.; Bagnall, G.C.; Pugh, N.A.; Horne, D.W.; Rooney, W.L.; Jung, J.; Chang, A.; Malambo, L.; Popescu, S.C.; et al. Measurement and Calibration of Plant-Height from Fixed-Wing UAV Images. Sensors 2018, 18, 4092. [Google Scholar] [CrossRef] [PubMed] [Green Version]
  31. Potgieter, A.B.; George-Jaeggli, B.; Chapman, S.C.; Laws, K.; Cadavid, L.A.S.; Wixted, J.; Watson, J.; Eldridge, M.; Jordan, D.R.; Hammer, G.L. Multi-Spectral Imaging from an Unmanned Aerial Vehicle Enables the Assessment of Seasonal Leaf Area Dynamics of Sorghum Breeding. Front. Plant Sci. 2017, 8, 1–11. [Google Scholar] [CrossRef]
  32. Bendig, J.; Bolten, A.; Bennertz, S.; Broscheit, J.; Eichfuss, S.; Bareth, G. Estimating biomass of barley using crop surface models (CSMs) derived from UAV-based RGB imaging. Remote Sens. 2014, 6, 10395–10412. [Google Scholar] [CrossRef] [Green Version]
  33. Shafian, S.; Rajan, N.; Schnell, R.; Bagavathiannan, M.; Valasek, J.; Shi, Y.; Olsenholler, J. Unmanned aerial systems-based remote sensing for monitoring sorghum growth and development. PLoS ONE 2018, 13, 1–15. [Google Scholar] [CrossRef] [Green Version]
  34. Viña, A.; Gitelson, A.A.; Nguy-Robertson, A.L.; Peng, Y. Comparison of different vegetation indices for the remote assessment of green leaf area index of crops. Remote Sens. Environ. 2011, 115, 3468–3478. [Google Scholar] [CrossRef]
  35. Haghighattalab, A.; González Pérez, L.; Mondal, S.; Singh, D.; Schinstock, D.; Rutkoski, J.; Ortiz-Monasterio, I.; Singh, R.P.; Goodin, D.; Poland, J. Application of unmanned aerial systems for high throughput phenotyping of large wheat breeding nurseries. Plant Methods 2016, 12, 1–15. [Google Scholar] [CrossRef] [Green Version]
  36. Ndiaye, M.; Adam, M.; Ganyo, K.K.; Guissé, A.; Cissé, N.; Muller, B. Genotype-environment interaction: Trade-Offs between the Agronomic Performance and Stability of Dual-Purpose Sorghum (Sorghum bicolor L. Moench) genotypes in Senegal. Agronomy 2019, 9, 867. [Google Scholar] [CrossRef] [Green Version]
  37. Ndiaye, M.; Adam, M.; Muller, B.; Guissé, A.; Cissé, N. Performances agronomiques et stabilité phénotypique de génotypes de Sorgho (Sorghum bicolor (L.) Moench) au Sénégal: Une étude des interactions. J. Appl. Biosci. 2018, 125, 12617–12629. [Google Scholar] [CrossRef] [Green Version]
  38. Dembele, J.S.B.; Gano, B.; Vaksmann, M.; Dembele, L.L.; Doumbia, M.; Teme, N.; Diouf, D.; Audebert, A. Response of eight sorghum varieties to plant density and nitrogen fertilization in the Sudano-Sahelian zone in Mali. Afr. J. Agric. Res. 2020, 16, 1401–1410. [Google Scholar] [CrossRef]
  39. Gano, B.; Dembele, J.S.B.; Tovignan, T.K.; Sine, B.; Vadez, V.; Diouf, D.; Audebert, A. Adaptation Responses to Early Drought Stress of West Africa Sorghum Varieties. Agronomy 2021, 11, 443. [Google Scholar] [CrossRef]
  40. Iqbal, F.; Lucieer, A.; Barry, K. Simplified radiometric calibration for UAS-mounted multispectral sensor. Eur. J. Remote Sens. 2018, 51, 301–313. [Google Scholar] [CrossRef]
  41. R Core Team. R: A Language and Environment for Statistical Computing; R Foundation for Statistical Computing: Vienna, Austria, 2010. [Google Scholar]
  42. Zhang, Z.; Masjedi, A.; Zhao, J.; Crawford, M.M. Prediction of sorghum biomass based on image based features derived from time series of UAV images. In Proceedings of the International Geoscience and Remote Sensing Symposium (IGARSS), Fort Worth, TX, USA, 23–28 July 2017; pp. 6154–6157. [Google Scholar]
  43. Steven, M.D.; Malthus, T.J.; Baret, F. Toward Standardization of Vegetation Indices. In Remotely Sensed Data Characterization, Classification, and Accuracies; Thenkabail, P.S., Ed.; Taylor & Francis Group, LLC: Oxford, UK, 2015; pp. 175–193. ISBN 9781482217872. [Google Scholar]
  44. Shi, Y.; Murray, S.C.; Rooney, W.L.; Valasek, J.; Olsenholler, J.; Pugh, N.A.; Henrickson, J.; Bowden, E.; Zhang, D.; Thomasson, J.A. Corn and Sorghum Phenotyping Using a Fixed-Wing UAV-Based Remote Sensing System. In Autonomous Air and Ground Sensing Systems for Agricultural Optimization and Phenotyping; Valasek, J., Thomasson, J.A., Eds.; SPIE Digital Library: Bellingham, WA, USA, 2016; Volume 9866, ISBN 9781510601079. [Google Scholar]
  45. Rouse, J.W.; Hass, R.H.; Schell, J.A.; Deering, D.W. Monitoring Vegetation Systems in the Great Plains with ERTS. In Proceedings of the Third Earth Resources Technology Satellite (ERTS) Symposium, Washington, DC, USA, 10–14 December 1973; Volume 1, pp. 309–317. [Google Scholar]
  46. Perry, C.R.; Lautenschlager, L.F. Functional equivalence of spectral vegetation indices. Remote Sens. Environ. 1984, 14, 169–182. [Google Scholar] [CrossRef]
  47. Gitelson, A.A.; Merzlyak, M.N. Remote sensing of chlorophyll concentration in higher plant leaves. Adv. Sp. Res. 1998, 22, 689–692. [Google Scholar] [CrossRef]
  48. Qi, J.; Chehbouni, A.; Huete, A.R.; Kerr, Y.H.; Sorooshian, S. A modified soil adjusted vegetation index. Remote Sens. Environ. 1994, 48, 119–126. [Google Scholar] [CrossRef]
  49. Birth, G.S.; McVey, G.R. Measuring the Color of Growing Turf with a Reflectance Spectrophotometer. Agron. J. 1968, 60, 640–643. [Google Scholar] [CrossRef]
  50. Madec, S.; Baret, F.; De Solan, B.; Thomas, S.; Dutartre, D.; Jezequel, S.; Hemmerlé, M.; Colombeau, G.; Comar, A. High-throughput phenotyping of plant height: Comparing unmanned aerial vehicles and ground lidar estimates. Front. Plant Sci. 2017, 8, 1–14. [Google Scholar] [CrossRef] [PubMed] [Green Version]
  51. Mclntosh, M.S. Analysis of combined experiments. Agron. J. 1983, 75, 153–155. [Google Scholar] [CrossRef]
  52. Bartlett, M.S. Properties of sufficiency and statistical tests. Proc. R. Soc. Lond. Ser. A 1937, 160, 268–282. [Google Scholar] [CrossRef]
  53. Fahlgren, N.; Gehan, M.A.; Baxter, I. ScienceDirect Lights, camera, action: High-throughput plant phenotyping is ready for a close-up. Curr. Opin. Plant Biol. 2015, 24, 93–99. [Google Scholar] [CrossRef] [Green Version]
  54. Reynolds, M.; Langridge, P. Physiological breeding. Curr. Opin. Plant Biol. 2016, 31, 162–171. [Google Scholar] [CrossRef] [PubMed] [Green Version]
  55. Hu, P.; Chapman, S.C.; Wang, X.; Potgieter, A.; Duan, T.; Jordan, D.; Guo, Y.; Zheng, B. Estimation of plant height using a high throughput phenotyping platform based on unmanned aerial vehicle and self-calibration: Example for sorghum breeding. Eur. J. Agron. 2018, 95, 24–32. [Google Scholar] [CrossRef]
  56. Yu, N.; Li, L.; Schmitz, N.; Tian, L.F.; Greenberg, J.A.; Diers, B.W. Development of methods to improve soybean yield estimation and predict plant maturity with an unmanned aerial vehicle based platform. Remote Sens. Environ. 2016, 187, 91–101. [Google Scholar] [CrossRef]
  57. Du, M.; Noguchi, N. Monitoring of wheat growth status and mapping of wheat yield’s within-field spatial variations using color images acquired from UAV-camera System. Remote Sens. 2017, 9, 289. [Google Scholar] [CrossRef] [Green Version]
  58. Shi, Y.; Alex Thomasson, J.; Murray, S.C.; Ace Pugh, N.; Rooney, W.L.; Shafian, S.; Rajan, N.; Rouze, G.; Morgan, C.L.S.; Neely, H.L.; et al. Unmanned aerial vehicles for high-throughput phenotyping and agronomic research. PLoS ONE 2016, 11, 1–26. [Google Scholar] [CrossRef] [Green Version]
  59. Huete, A.; Didan, K.; Miura, T.; Rodriguez, E.P.; Gao, X.; Ferreira, L.G. Overview of the radiometric and biophysical performance of the MODIS vegetation indices. Remote Sens. Environ. 2002, 83, 195–213. [Google Scholar] [CrossRef]
  60. Myneni, R.B.; Hoffman, S.; Knyazikhin, Y.; Privette, J.L.; Glassy, J.; Tian, Y.; Wang, Y.; Song, X.; Zhang, Y.; Smith, G.R.; et al. Global products of vegetation leaf area and fraction absorbed PAR from year one of MODIS data. Remote Sens. Environ. 2002, 83, 214–231. [Google Scholar] [CrossRef] [Green Version]
  61. Huang, J.; Ma, H.; Su, W.; Zhang, X.; Huang, Y.; Fan, J.; Wu, W. Jointly Assimilating MODIS LAI and et Products into the SWAP Model for Winter Wheat Yield Estimation. IEEE J. Sel. Top. Appl. Earth Obs. Remote Sens. 2015, 8, 4060–4071. [Google Scholar] [CrossRef]
  62. Mutanga, O.; Skidmore, A.K. Narrow band vegetation indices overcome the saturation problem in biomass estimation. Int. J. Remote Sens. 2004, 25, 3999–4014. [Google Scholar] [CrossRef]
  63. Singh, A.; Ganapathysubramanian, B.; Singh, A.K.; Sarkar, S. Machine Learning for High-Throughput Stress Phenotyping in Plants. Trends Plant Sci. 2016, 21, 110–124. [Google Scholar] [CrossRef] [PubMed] [Green Version]
  64. Sun, W.; Zhang, L.; Member, S.; Du, B.; Member, S.; Li, W.; Lai, Y.M. Band selection using improved sparse subspace clustering for hyperspectral imagery classification. IEEE J. Sel. Top. Appl. Earth Obs. Remote Sens. 2015, 8, 2784–2797. [Google Scholar] [CrossRef]
  65. Varela, S.; Assefa, Y.; Vara Prasad, P.V.; Peralta, N.R.; Griffin, T.W.; Sharda, A.; Ferguson, A.; Ciampitti, I.A. Spatio-temporal evaluation of plant height in corn via unmanned aerial systems. J. Appl. Remote Sens. 2017, 11, 1. [Google Scholar] [CrossRef] [Green Version]
  66. Yue, J.; Yang, G.; Li, C.; Li, Z.; Wang, Y.; Feng, H.; Xu, B. Estimation of winter wheat above-ground biomass using unmanned aerial vehicle-based snapshot hyperspectral sensor and crop height improved models. Remote Sens. 2017, 9. [Google Scholar] [CrossRef] [Green Version]
  67. Chen, D.; Neumann, K.; Friedel, S.; Kilian, B.; Chen, M.; Altmann, T.; Klukas, C. Dissecting the phenotypic components of crop plant growthand drought responses based on high-throughput image analysisW open. Plant Cell 2014, 26, 4636–4655. [Google Scholar] [CrossRef] [Green Version]
  68. Seelig, H.D.; Hoehn, A.; Stodieck, L.S.; Klaus, D.M.; Adams, W.W.; Emery, W.J. The assessment of leaf water content using leaf reflectance ratios in the visible, near-, and short-wave-infrared. Int. J. Remote Sens. 2008, 29, 3701–3713. [Google Scholar] [CrossRef]
  69. Ramu, P.; Billot, C.; Rami, J.F.; Senthilvel, S.; Upadhyaya, H.D.; Ananda Reddy, L.; Hash, C.T. Assessment of genetic diversity in the sorghum reference set using EST-SSR markers. Theor. Appl. Genet. 2013, 126, 2051–2064. [Google Scholar] [CrossRef] [PubMed] [Green Version]
  70. Malambo, L.; Popescu, S.C.; Murray, S.C.; Putman, E.; Pugh, N.A.; Horne, D.W.; Richardson, G.; Sheridan, R.; Rooney, W.L.; Avant, R.; et al. Multitemporal field-based plant height estimation using 3D point clouds generated from small unmanned aerial systems high-resolution imagery. Int. J. Appl. Earth Obs. Geoinf. 2018, 64, 31–42. [Google Scholar] [CrossRef]
  71. Niederheiser, R.; Rutzinger, M.; Bremer, M.; Wichmann, V. Dense image matching of terrestrial imagery for deriving high-resolution topographic properties of vegetation locations in alpine terrain. Int. J. Appl. Earth Obs. Geoinf. 2018, 66, 146–158. [Google Scholar] [CrossRef]
  72. Moeckel, T.; Dayananda, S.; Nidamanuri, R.R.; Nautiyal, S.; Hanumaiah, N.; Buerkert, A.; Wachendorf, M. Estimation of vegetable crop parameter by multi-temporal UAV-borne images. Remote Sens. 2018, 10, 805. [Google Scholar] [CrossRef] [Green Version]
  73. Khan, Z.; Chopin, J.; Cai, J.; Eichi, V.R.; Haefele, S.; Miklavcic, S.J. Quantitative estimation of wheat phenotyping traits using ground and aerial imagery. Remote Sens. 2018, 10, 950. [Google Scholar] [CrossRef] [Green Version]
  74. Watanabe, K.; Guo, W.; Arai, K.; Takanashi, H.; Kajiya-kanegae, H. High-Throughput Phenotyping of Sorghum Plant Height Using an Unmanned Aerial Vehicle and Its Application to Genomic Prediction Modeling. Front. Plant Sci. 2017, 8, 1–11. [Google Scholar] [CrossRef] [Green Version]
  75. Hassan, M.A.; Yang, M.; Fu, L.; Rasheed, A.; Zheng, B.; Xia, X.; Xiao, Y.; He, Z. Accuracy assessment of plant height using an unmanned aerial vehicle for quantitative genomic analysis in bread wheat. Plant Methods 2019, 15, 1–12. [Google Scholar] [CrossRef] [PubMed] [Green Version]
  76. Magney, T.S.; Eitel, J.U.H.; Huggins, D.R.; Vierling, L.A. Proximal NDVI derived phenology improves in-season predictions of wheat quantity and quality. Agric. For. Meteorol. 2016, 217, 46–60. [Google Scholar] [CrossRef]
  77. Foster, A.J.; Kakani, V.G.; Mosali, J. Estimation of bioenergy crop yield and N status by hyperspectral canopy reflectance and partial least square regression. Precis. Agric. 2017, 18, 192–209. [Google Scholar] [CrossRef]
  78. Samborski, S.M.; Gozdowski, D.; Walsh, O.S.; Lamb, D.W.; Stępień, M.; Gacek, E.S.; Drzazga, T. Winter wheat genotype effect on canopy reflectance: Implications for using NDVI for in-season nitrogen topdressing recommendations. Agron. J. 2015, 107, 2097–2106. [Google Scholar] [CrossRef]
  79. Babar, M.A.; Reynolds, M.P.; Van Ginkel, M.; Klatt, A.R.; Raun, W.R.; Stone, M.L. Spectral reflectance indices as a potential indirect selection criteria for wheat yield under irrigation. Crop Sci. 2006, 46, 578–588. [Google Scholar] [CrossRef]
  80. Mulla, D.J. Twenty five years of remote sensing in precision agriculture: Key advances and remaining knowledge gaps. Biosyst. Eng. 2013, 114, 358–371. [Google Scholar] [CrossRef]
  81. Laudien, R.; Bareth, G.; Doluschitz, R. Multitemporal Hyperspectral Data Analysis for Regional Detection of Plant Stress by Using an Airborne-and Tractor-Based Spectrometer—Case Study: Sugar Beet Disease Rhizoctonia Solani. In Proceedings of the Analysis and Applications, International Society for Photogrammetry and Remote Sensing (ISPRS), Beijing, China, 17–19 October 2005; pp. 1–5. [Google Scholar]
  82. Sankaran, S.; Khot, L.R.; Espinoza, C.Z.; Jarolmasjed, S.; Sathuvalli, V.R.; Vandemark, G.J.; Miklas, P.N.; Carter, A.H.; Pumphrey, M.O.; Knowles, R.R.N.; et al. Low-altitude, high-resolution aerial imaging systems for row and field crop phenotyping: A review. Eur. J. Agron. 2015, 70, 112–123. [Google Scholar] [CrossRef]
  83. Yang, G.; Liu, J.; Zhao, C.; Li, Z.; Huang, Y. Unmanned Aerial Vehicle Remote Sensing for Field-Based Crop Phenotyping: Current Status and Perspectives. Front. Plant Sci. 2017, 8. [Google Scholar] [CrossRef] [PubMed]
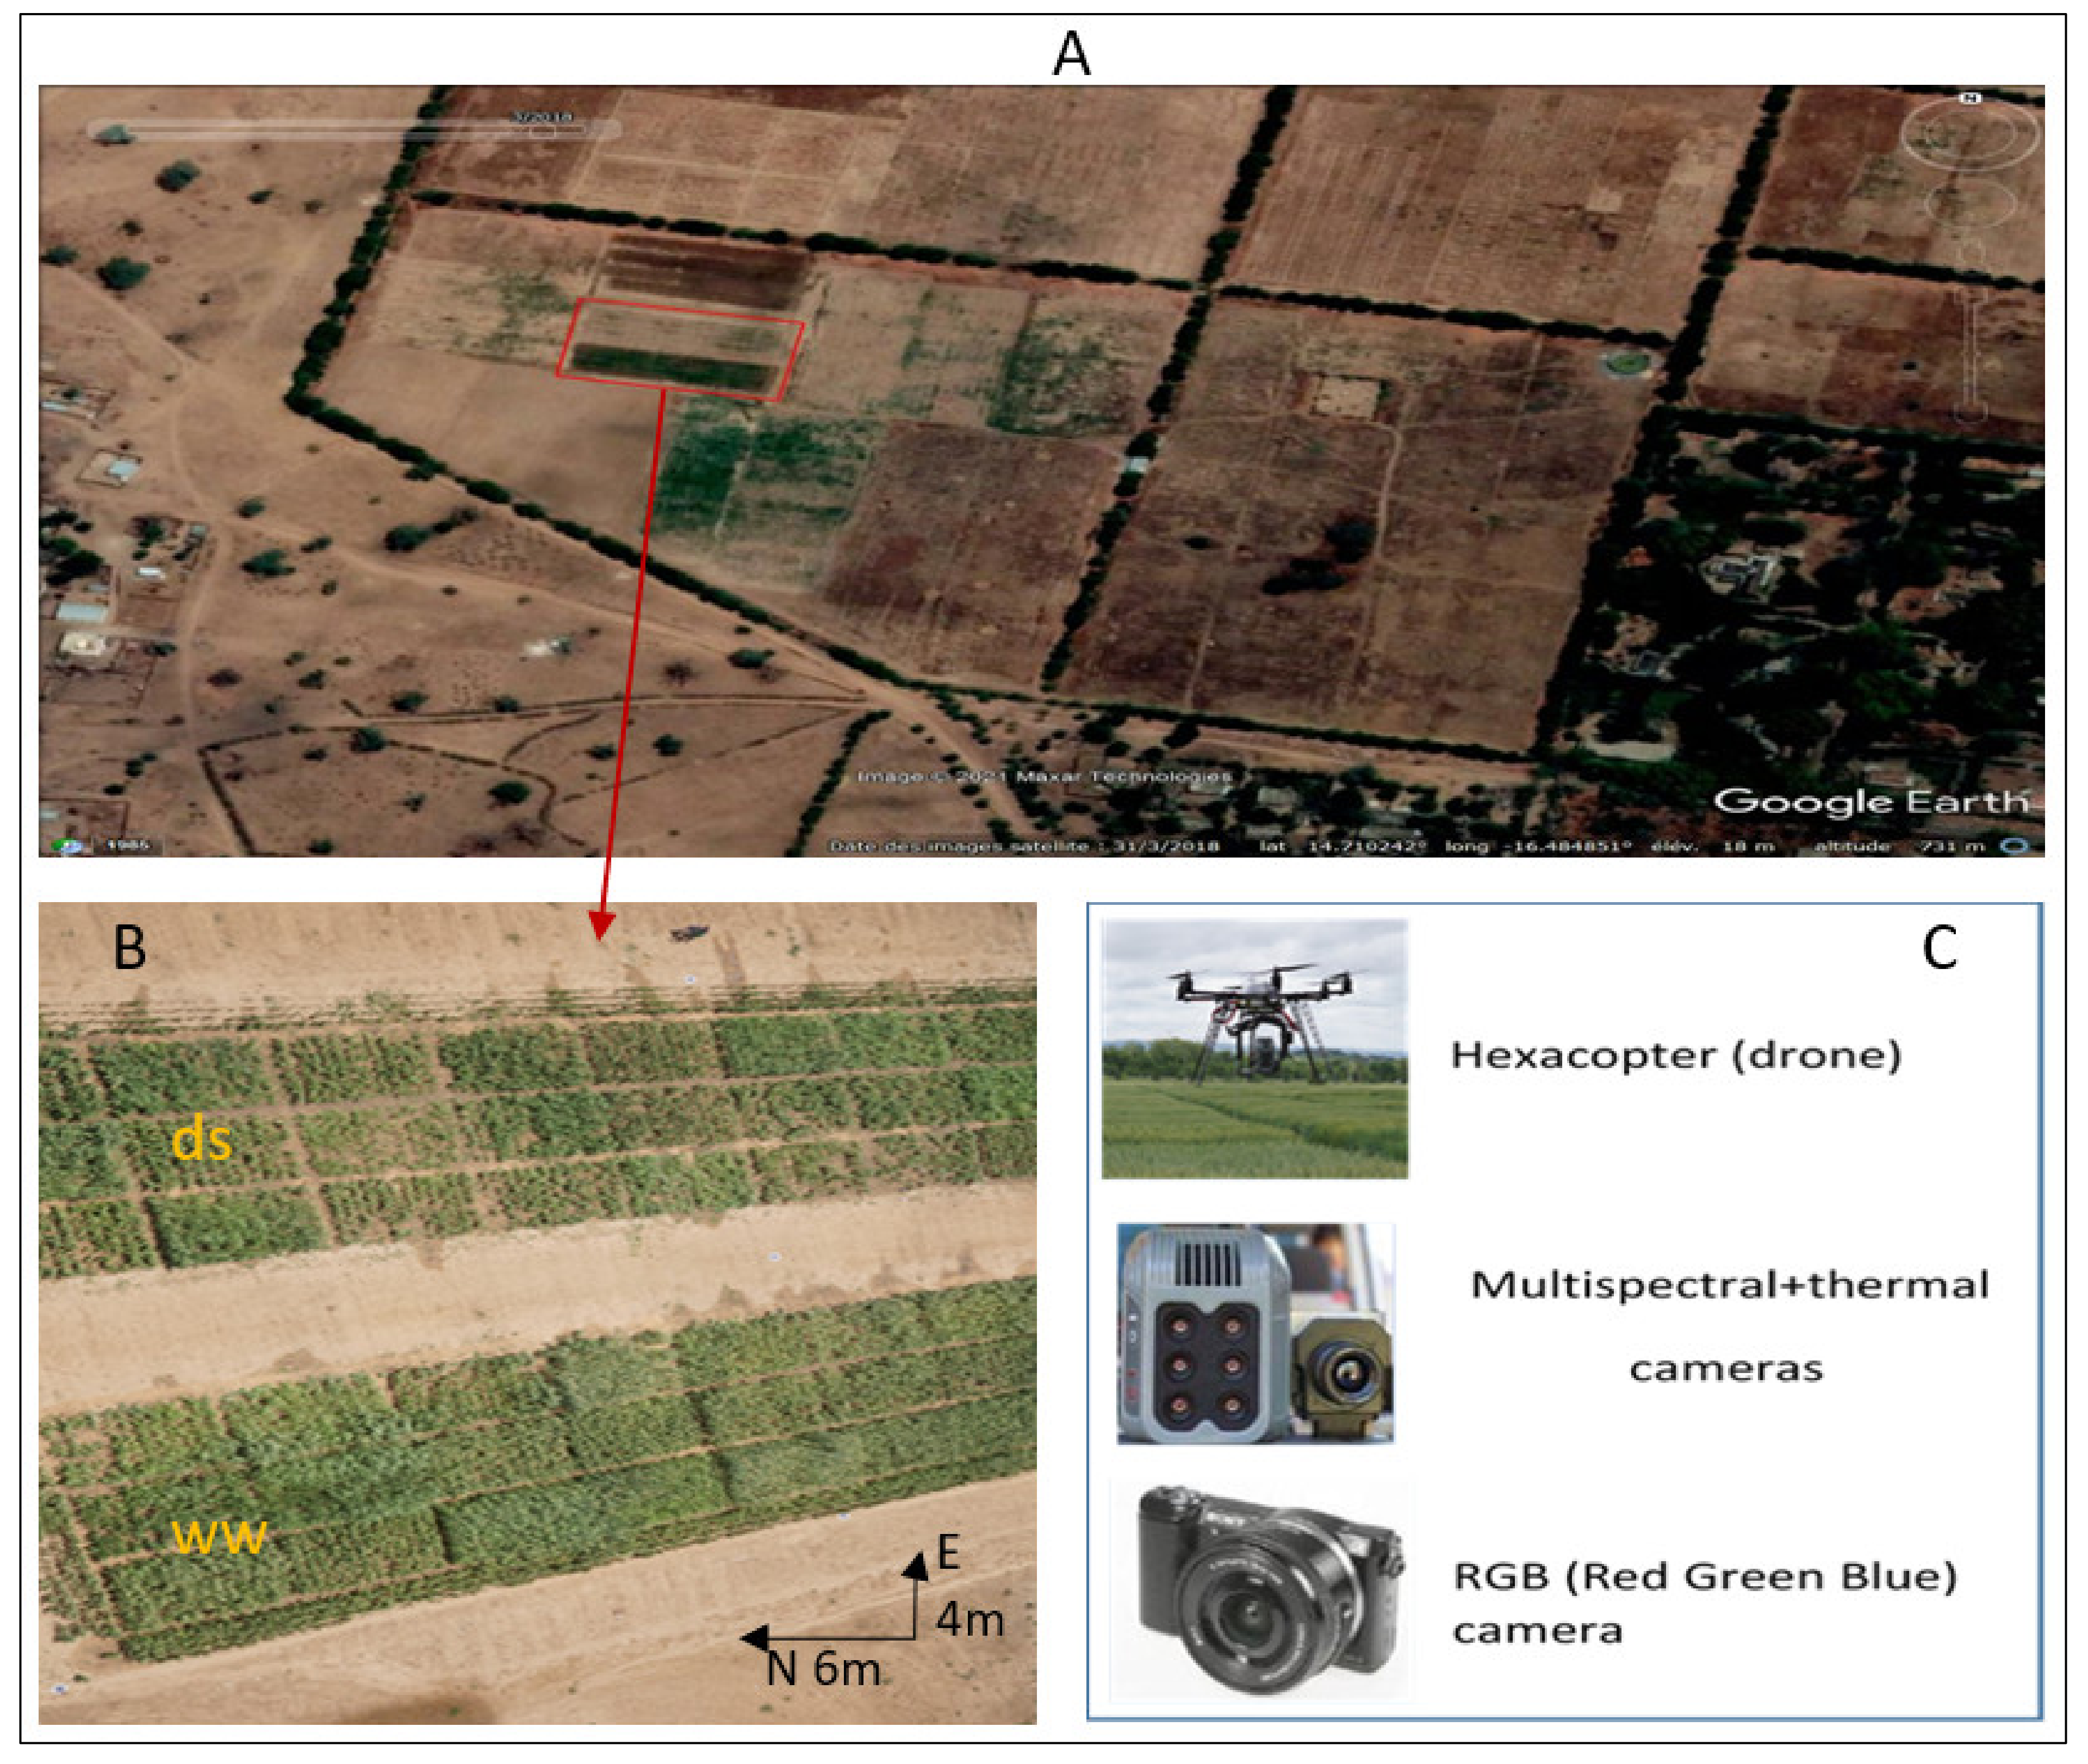
Figure 1. Field experiment and UVA with its accessories used in this study. (A) Google Earth map of experimental field location on 31 March 2018 (45th days after sowing), (B) picture depicting the overview of varieties under well-watered (ww) and drought stress (ds) conditions at the 76th days after sowing in 2018 field trial, (C) Drone and sensors. ww: well-watered; ds: drought stress.
Agronomy 11 00850 g001
Figure 2. An overview of images analysis process in the 2018 sorghum field trial under well-watered and drought stress conditions. (A) RGB (Red Green Blue) orthomosaic showing field design with plots segmentation at the 76th days after sowing; (B) DSM (Digital Surface Model) map. ww: well-watered; ds: drought stress.
Agronomy 11 00850 g002
Figure 3. Calibration of LAI and biomass prediction models from vegetation indices using data from 2018 trial. Relationship between LAI and NDVI (A), CTVI (C), MSAVI2 (E); biomass and NDVI (B), CTVI (D), MSAVI2 (F). NDVI, CTVI and MSAVI2: vegetation indices; the green line in plots is the regression line; r2: coefficient of determination.
Agronomy 11 00850 g003
Figure 4. Calibration of measured and calculated (using vegetation indices) LAI (m2 m−2) and shoot biomass (g per plant) in 2018 field trial. Relationship between measured and calculated LAI from NDVI (A), CTVI (C), MSAVI2 (E); and calculated biomass from NDVI (B), CTVI (D), MSAVI2 (F). NDVI, CTVI and MSAVI2: vegetation indices; LAI: leaf area index; r2: coefficient of determination; the blue line is the regression line; the dashed dark red line in the graph is the 1:1 line; the dashed light red lines represent the 95% confidence interval of the regression.
Agronomy 11 00850 g004
Figure 5. Validation of LAI and biomass prediction models from vegetation indices using 2019 field trial data. Relationship between measured and predicted LAI from NDVI (A), CTVI (C), MSAVI2 (E); biomass from NDVI (B), CTVI (D), MSAVI2 (F). NDVI, CTVI, MSAVI2, GNDVI and SR: vegetation indices; LAI: leaf area index (m2 m−2); r2: coefficient of determination and RMSE: root mean square error; the blue line is the regression line; the dashed dark red line in the graph is the 1:1 line, the dashed light red lines represent the 95% confidence interval of the regression.
Agronomy 11 00850 g005
Figure 6. Regression plots between UAV-based and ground measurements plant height measured along crop cycle in 2018 field trial. r2: coefficient of determination and RMSE: root mean square error; *** significant at p < 0.001; exp: exponential; the dashed red line in the graph is the 1:1 line. dashed red lines represents the 95% confidence interval of the regression.
Agronomy 11 00850 g006
Figure 7. Dynamics of UAV and ground-based plant height in well-watered (ww) and drought stress (ds) treatments in 2018 field trial. Each point is the average of the 10 studied sorghum varieties with standard error.
Agronomy 11 00850 g007
Figure 8. Dynamics of estimated vegetation indices under well-watered and drought stress conditions. Box plots gather estimations for the 10 studied sorghum varieties at a given stage. NDVI, CTVI, MSAVI2 and SR: vegetation indices; DAS: days after sowing; W: water regime, ds: drought stress, ww: well-watered.
Agronomy 11 00850 g008
Table 1. Characteristics of the varieties used in this study and their origin.
VarietyCodeTypeMaturity (days)Height (cm)Potential Yield (t/ha)Panicle FormPhotoperiod- SensitivityIsohyet (mm)Origin
FaddaV1Guinea (hybrid)128200–3004.5non compactmoderate700–1000Mali (IER/ICRISAT)
NIELENIV2Guinea (hybrid)1153004semi compactlow700–800Mali (IER/ICRISAT)
IS15401V3Guinea-Caudatum115400–4502semi compacthigh900–1200Mali (IER/ICRISAT)
PABLOV4Guinea (hybrid)1254004non compactmoderate700–1000Mali (IER/ICRISAT)
CSM63EV5Guinea904002non compactlow600–1000Mali (IER/ICRISAT)
SK5912V6Caudatum1702002.5–3.5semi compacthigh700–900Nigeria
GRINKANV7Caudatum901204semi compactnon500–800Mali (IER/ICRISAT)
SOUMBAV8Caudatum1152502.5semi compactlow600–1000Mali (IER/ICRISAT)
621BV9Caudatum1051752.5–3semi compactnon600–900Senegal (ISRA)
F2-20V10Caudatum1102103–5.3semi compactlow600–900Senegal (ISRA)
Table 2. Vegetation indices used in this study.
Vegetation IndicesFormulasRef.
Normalized Difference Vegetation IndexNDVI = (ρNIR − ρRed)/(ρNIR + ρRed)[45]
The Corrected Transformed Vegetation IndexCTVI = [(NDVI + 0.5)/ABS(NDVI + 0.5)] × [√ABS(NDVI + 0.5)][46]
Green Normalized Difference Vegetation IndexGNDVI = (ρNIR − ρGreen)/(ρNIR + ρGreen)[47]
Modified Soil-Adjusted Vegetation Index 2 modelMSAVI2 = [(2 × ρNIR + 1 − √((2 × ρNIR+1)2 − 8(ρNIR − ρRed))]/2[48]
Simple RatioSR = ρNIR/ρRed[49]
NDVI, CTVI, GNDVI, MSAVI2 and SR are the index value; ρNIR (850nm) and ρRed (675 nm) are respectively the Near Infrared and Red band reflectance from the UAV sensor; ABS is the absorbance; ref. stand for references.
Table 3. Regression between sorghum LAI and shoot biomass values and vegetation indices using data in 2018 field trial (n = 390).
Vegetation IndicesRegression Modelsrr2p-Value
NDVILAI = 0.3732 × exp (2.9648 × NDVI)0.910.83<0.001
CTVILAI = 0.0069 × exp (5.5322 × CTVI)0.90.82<0.001
MSAVI2LAI = 0.3392 × exp (2.7498 × MSAVI2)0.90.82<0.001
GNDVILAI = 0.1841 × exp (4.9761 × GNDVI)0.870.76<0.001
SRLAI = 0.4438 × SR + 0.01260.870.77<0.001
NDVIBiomass = 3.1153 × exp (3.7021 × NDVI)0.770.6<0.001
CTVIBiomass = 0.0206 × exp (6.9446 × CTVI)0.770.6<0.001
MSAVI2Biomass = 2.7357 × exp (3.4587 × GNDVI)0.770.6<0.001
GNDVIBiomass = 1.3612 × exp (6.0606 × MSAVI2)0.720.52<0.001
SRBiomass = 6.0128 × SR + 0.89470.680.47<0.001
NDVI, CTVI, GNDVI, MSAVI2 and SR are vegetation indices; r and r2 are the coefficients of correlation and determination respectively; LAI is the leaf area index; exp: exponential.
Table 4. Correlations accuracies between predicted Leaf area index (m2 m−2) and shoot biomass (g per plant) using calibration models and the measured data in the 2019 validation field trial (n = 60).
LAIBiomass
Vegetation Indicesr2RMSESignif.r2RMSESignif.
NDVI0.920.31***0.914.96***
CTVI0.920.30***0.924.50***
MSAVI20.920.30***0.924.40***
GNDVI0.800.44***0.777.06***
SR0.890.37***0.885.26***
NDVI, CTVI, MSAVI2, GNDVI and SR: vegetation indices; LAI: leaf area index (m2 m−2); r2: coefficient of determination; RMSE: root mean square error; signif.: significativity; *** significant at p < 0.001.
Table 5. ANOVA of the vegetation indices of varieties under well-watered and drought stress.
NDVICTVIMSAVI2SR
Vwwdswwdswwdswwds
V10.630.381.060.920.710.466.833.00
V20.680.371.080.910.760.446.773.00
V30.730.591.110.940.810.667.974.02
V40.700.331.090.890.770.407.532.71
V50.710.391.100.940.790.477.912.85
V60.620.361.050.890.700.425.693.24
V70.740.281.110.880.810.358.592.20
V80.740.451.110.940.810.538.174.46
V90.700.401.090.940.780.496.992.92
V100.670.201.080.830.750.257.331.74
Mean0.690.371.080.900.760.447.373.01
V** ** *** *
W*** *** *** ***
V × W* * * *
V: variety; W: water regime; NDVI, CTVI, GNDVI, MSAVI2 and SR: vegetation indices (VIs); ww: well-watered; ds: drought stress; *** significant at p < 0.001; ** significant at p < 0.01; * significant at p < 0.05; the bold indicate the highest and lowest value measured.
Table 6. ANOVA of leaf area index measured (LAIm) and calculated from vegetation index (LAI_NDVI and LAI_CTVI) of varieties under well-watered and drought stress.
LAI_NDVILAI_CTVILAI_m
Vwwdswwdswwds
V11.500.621.530.621.900.60
V21.560.611.590.611.900.80
V32.090.702.120.721.570.90
V41.600.581.630.571.400.45
V51.950.561.970.562.230.60
V61.390.701.430.701.630.57
V72.010.532.030.521.900.47
V81.930.681.960.692.630.80
V91.780.641.810.651.530.67
V101.740.481.770.471.570.53
Mean1.750.611.780.611.830.64
V* * **
W*** *** ***
V × W* * *
V: variety; W: water regime; ww: well-watered; ds: drought stress; CTVI and NDVI: vegetation index; *** significant at p < 0.001; ** significant at p < 0.01; * significant at p < 0.05; the bold indicate the highest and lowest value measured.
Table 7. ANOVA of the measured biomass per plant (biomass_m) and calculated from vegetation index (biomass_MSAVI2 and biomass_SR) under well-watered and drought stress.
Biomass_MSAVI2Biomass_SRBiomass_m
Vwwdswwdswwds
V117.625.5321.129.6918.3015.70
V218.275.3822.089.5422.5510.79
V325.856.6527.5610.5019.1112.36
V418.734.9622.389.0117.387.90
V523.944.7326.108.9329.8211.84
V615.776.6220.4910.4923.8711.39
V724.474.3528.258.5735.728.00
V823.596.3226.8410.3627.329.21
V921.525.7624.519.8722.4918.88
V1021.003.7524.557.9118.285.86
Mean21.085.4224.399.5023.4811.31
V* * ***
W*** *** ***
V × W* ** ***
V: variety; W: water regime; ww: well-watered; ds: drought stress; MSAVI2 and SR: vegetation indices; *** significant at p < 0.001; ** significant at p < 0.01; * significant at p < 0.05; the bold indicate the highest and lowest value measured.
Publisher’s Note: MDPI stays neutral with regard to jurisdictional claims in published maps and institutional affiliations.