Article

RNA-Seq Transcriptome Analysis of Potato with Differential Tolerance to Bentazone Herbicide

1
College of Agronomy, Northeast Agricultural University, Harbin 150030, China
2
College of Geographical Sciences, Lingnan Normal University, Zhanjiang 524048, China
*
Author to whom correspondence should be addressed.
Agronomy 2021, 11(5), 897; https://doi.org/10.3390/agronomy11050897
Submission received: 20 March 2021 / Revised: 27 April 2021 / Accepted: 29 April 2021 / Published: 2 May 2021

Abstract

:
Potato (Solanum tuberosum), an important food crop worldwide, is threatened by broadleaf weeds. Bentazone is an effective herbicide for controlling weeds; however, as a photosynthesis inhibitor, it can also affect potato plants. Therefore, screening potato seedlings for bentazone resistance and determining the genes involved is essential. Herein, we selected potato varieties with tolerance and sensitivity to bentazone. The photosynthetic rate of sensitive plants was notably affected by bentazone application, whereas the tolerant plants showed a significantly higher photosynthetic rate. We observed 95.7% bentazone degradation within 24 d after application in the tolerant plants. Transcriptome sequencing revealed that the numbers of differentially expressed genes (DEGs) between the tolerant and sensitive potato seedlings were 2703 and 11,024 before and after bentazone application, respectively. Kyoto Encyclopedia of Genes and Genomes (KEGG) enrichment analysis revealed that the majority of DEGs were enriched in metabolic pathways, biosynthesis of secondary metals, carbon metabolism, glutathione metabolism, and photosynthesis. Polyphenol oxidase (PPO), flavonoid 3′,5′-methyltransferase-like (AOMT3), ribulose bisphosphate carboxylase small chain C (RBCS-C), and chalcone synthase 2 (CHS2) were identified as candidates contributing to bentazone tolerance. These results provide a theoretical basis for selecting potato stress-resistant resources in the future.

1. Introduction

Potato (Solanum tuberosum L.) is the most important non-grain food crop worldwide and is central to maintaining global food security. Potato is cultivated for its underground storage stems (tubers), which are rich in starch and nutrients [1]. As the fourth major food crop worldwide, S. tuberosum provides an important source of high-quality starch in addition to being a nutritious food staple. Thus, potato plays an important role in the daily lives of many, contributing to personal livelihood and diet as well as the economy [2,3,4]. Broadleaf weeds pose a substantial threat to potato production, impacting crop yields through competition for resources and resulting in economic losses [5].
Bentazone (C10H12N2O3S), which is an important component of chemical herbicides used in potato fields, is applied to control broadleaf weeds such as Galium spp. [6]. Bentazone is a postemergence herbicide that is applied in early spring to early summer. Crop plants can rapidly metabolize bentazone to 6-OH- and 8-OH-bentazone, whereas the target weeds cannot; thus, bentazone only disrupts photosynthesis in weeds, inhibiting their ability to fix carbon and causing them to die [7,8]. For bentazone to be an effective herbicide, the crop plants must not be sensitive to bentazone. Bentazone can produce phytotoxic effects in some potato crops, which limits its usefulness for controlling broadleaf weeds in potato fields. Screening potato seedlings for bentazone resistance can effectively solve this problem, allowing for further development of bentazone as an efficient herbicide for potato fields.
At present, research on bentazone resistance and the associated genes is very limited. Lundegardh [9] discovered that bentazone resistance in a strain of the unicellular green alga Monoraphidium pussilum was the result of a modified thylakoid membrane as well as a metabolic change. In 2007, Zhang et al. identified the CYP81A6 (Bel) gene in rice (Oryza sativa), which encodes a P450 hydroxylase that detoxifies the herbicide by catalyzing bentazone hydroxylation [10]. The CYP81A6 gene was then introduced to Arabidopsis and tobacco; plants expressing the protein showed tolerance to bentazone [11]. Recently, Tao et al. [5] screened potato tissues for bentazone resistance; however, the molecular mechanism of resistance has not been elucidated.
Many studies have investigated gene expression to determine plant defense and stress mechanisms [12,13]. The transcriptional regulation of gene expression has been recognized as an important component of plant response, resulting in changes at the biochemical, cellular, and physiological levels [14,15]. Understanding the molecular mechanisms underlying herbicide resistance could facilitate the development of resistant crops, reducing the impact of weeds on production. In this study, photosynthesis and bentazone degradation were measured in resistant potato materials. To elucidate candidate genes involved in tolerance to bentazone, transcriptome sequencing was conducted to identify the differential gene expression between bentazone-sensitive and -tolerant potato materials.

2. Materials and Methods

2.1. Plant Materials

Potato seedlings with different resistance levels to bentazone were preserved in the Department of Pesticide Research of Northeast Agricultural University. Bentazone aqueous solution (48%) was purchased from Xingnong Pharmaceutical Co., Zhangzhou, China.

2.2. Potato Seedling Resistance to Bentazone

When the potato plantlets reached the five-leaf stage, the stems and leaves of the sensitive (4–0) and tolerant (4–19) varieties were treated with bentazone at concentrations of 1296 g a.i./ha, 648 g a.i./ha, and 324 g a.i./ha, at three replicates per concentration, with each replicate containing 50 seedlings. The varieties were examined for damage, and the survival rate was investigated on the fourth day after treatment. The leaves were scored as follows: −, no damage to the leaves; X, focal burned spots on the leaves were <2 cm2; XX, focal burned spots on the leaves were 2–4 cm2; XXX, the whole leaves were burned.

2.3. Determination of Photosynthetic Rate in Bentazone-Treated Potato Seedlings

When potato seedlings grew to the five-leaf stage under natural conditions, bentazone was applied to the leaves and stems of sensitive and tolerant potato seedlings at concentrations of 1296 g a.i./ha, 648 g a.i./ha, and 324 g a.i./ha. A photosynthetic assay apparatus was used to determine the photosynthetic rate of potato leaves (sampling at 9:00–11:00 a.m.) 0–15 d after spraying (randomly measure three plants, three leaves per plant, and obtain the average value).

2.4. Determination of Bentazone Residues in Bentazone-Treated Potato Seedlings

When potato seedlings grew to the five-leaf stage under natural conditions, the stems and leaves of bentazone-sensitive and -tolerant potato seedlings were treated with 1296 g a.i./ha bentazone, and treatment without bentazone was used as the control. Six to ten fresh samples were collected at each time point, and the collection amount was greater than 10 g, which was repeated three times. The sampling times were 0, 2, 4, 6, 8, 10, 12, and 24 d after bentazone application, and the samples were stored at −80 °C until analysis. To measure the bentazone residue, 10 g of potato seedlings with different resistance levels were weighed, ground, and suspended in 80 mL of methanol. After oscillating for 2 h, the extracted solution was placed in a 50 mL of polypropylene plug centrifugal tube and concentrated to 5 mL using a rotary evaporator. The concentrated solution was then diluted with 80 mL of acetonitrile and extracted with 30 mL of n-hexane twice. The acetonitrile phase was rotationally evaporated to 5 mL. High-performance liquid chromatography was used to determine bentazone content in the sample [16].

2.5. Pretranscriptome Sample Preparation

The potato seedlings of the sensitive and tolerant varieties were treated with bentazone (1296 g a.i./ha) when they reached the five-leaf stage, with each treatment consisting of three biological repeats and each repetition including 10 potato seedlings. Potato seedlings were collected after 24 h bentazone treatment and untreated. Then, 3 g of potato leaf tissues were collected from each repetition, frozen in liquid nitrogen, and then stored at −80 °C.

2.6. Transcriptome Sequencing and Assembly

We collected leaf tissues from nontreated and treated, confirmed sensitive and tolerant potato plants. The treatments were designated as nontreated (susceptible without treatment, TS), nontreated tolerant (tolerant without treatment, NT), treated susceptible (TS), and treated tolerant (TT) plants. Tissues were collected for RNA extraction 24 h after bentazone application, with three biological replicates per treatment. The samples were then sent to Genesky Biotechnologies Inc., Shanghai, China, for transcriptome sequencing. Total RNA was extracted from the samples and purified using a TruSeq Stranded Total RNA Library Prep Kit (Illumina, San Diego, CA, USA). Agarose gel electrophoresis and an Agilent 2100 Bioanalyzer were used to detect the degree of RNA degradation (required RNA sample concentration ≥100 ng/μL, total >2 μg, and RNA integrity number ≥6.5). Subsequently, poly (A) mRNA was enriched using oligo (dT) magnetic beads and fragmented using a fragmentation buffer (Agilent Technologies, Santa Clara, CA, USA). RNA fragments were reverse transcribed into cDNA and detected using the Agilent 2100 Bioanalyzer (required concentration >5 ng/µL; fragment length 300–400 bp; Agilent Technologies, Santa Clara, CA, USA). The final sequencing products were validated for size using an Agilent 2100 Bioanalyzer (Agilent Technologies, Santa Clara, CA, USA) and sequenced using a 2 × 125-bp paired-end sequencing module on an Illumina HiSeq 2500 (Illumina, San Diego, CA, USA). Raw sequence reads were assessed for quality using the FastQC software package (http://www.bioinformatics.babraham.ac.uk/projects/fastqc/ (accessed on 30 September 2020)) and preprocessed to remove sequence adapters and low-quality bases using Trimmomatic software [17].

2.7. Differential Gene Expression

HISAT2 software (https://ccb.jhu.edu/software/hisat2/index.shtml (accessed on 30 September 2020)) [18] was used to compare the filtered clean reads with the reference database annotations (SolTub 3.0). The results of HISAT2 alignment were used to statistically evaluate experimental database abnormalities using RNA_seQc (http://www.broadinstitute.org/cancer/cga/rna-seqc (accessed on 2 October 2020)) [19]. The known mRNA was quantified using Cufflinks analysis protocol (http://cole-trapnell-lab.github.io/cufflinks/ (accessed on 2 October 2020)), and Cuffdiff software was used to analyze the differential gene expression between the experimental group and the control group [20]. The variance between samples was visualized using principal component analysis (PCA); M-A plots were generated for each comparison of samples. The criteria for differential gene expression included | log2 (fold change) | ed | log2 was visualized using principal component analysis p fold ch [21]. Gene expression was compared between nontreated tolerant and nontreated sensitive (NT vs. NS), treated tolerant and treated sensitive (TT vs. TS), treated tolerant and nontreated resistant (TT vs. NT), and treated sensitive and nontreated sensitive (TS vs. NS).

2.8. Validation of Expression Using Quantitative Real-Time Polymerase Chain Reaction

According to the differential gene expression of sensitive and resistant varieties before and after treatment, four candidate genes (AOMT3, CHS2, RBCS-C, and PPO) were selected for verification. Total RNA was extracted from the potato leaves using an RNA out kit (Sangong, Shanghai, China), and cDNA synthesis was performed using PrimeScript™ II 1st Strand cDNA Synthesis Kit (TaKaRa, Shanghai, China). The mRNA expression levels of the seven genes were determined using SYBR Premix Ex Taq (TaKaRa) in ABI 7300 real-time PCR system (Applied Biosystems, Foster City, CA, USA). Their expressions were measured using quantitative real-time polymerase chain reaction (q-PCR) based on the sequence of the gene EF1α (elongation factor) [22]. Three biological replicates were performed for each experiment. The relative gene expression was determined using the threshold cycle method, and the FCs were calculated using the 2−∆∆ng formula [23]. The primers of the genes and the internal reference genes provided in Table S1 in Supplementary Materials were synthesized by Sangong in Shanghai. Gene amplification was performed, and the dissolution curve is shown in Table S2.

3. Results

3.1. Difference Analysis of Potato Seedling Resistance to Bentazone

The sensitive (4–0) and tolerant (4–19) potato varieties could grow well at a low concentration of 324 g a.i./ha, and the survival rate was >90%. However, at a concentration of 1296 g a.i./ha, the survival rate of tolerant varieties was 90%, and that of sensitive varieties was only 12% (Table 1). At the highest concentration of 1296 g a.i./ha, the leaves of the sensitive (S) seedlings were entirely burned, whereas the leaves of the tolerant (T) seedlings were slightly browned (Figure 1a). In the 648 g a.i./ha treatment, the leaves of the S seedlings were scorched, whereas those of the T seedlings were not damaged (Figure 1b). In the 324 g a.i./ha treatment, the leaves of both S and T potato seedlings showed no damage (Figure 1c) (Table 2).

3.2. Effects of Bentazone on the Photosynthetic Rate of Sensitive and Resistant Potato Seedlings

The stem and leaves of potato seedlings were treated with 1296 g a.i./ha of bentazone. A significant difference in photosynthetic rate was observed between the S-CK and T-CK potato seedlings (p ≤ 0.01). From 0 to 15 d, there was a significant difference between the T and S seedlings after bentazone treatment, and the photosynthetic rate decreased by 6.7% and 79.4%, respectively. Significant differences were observed between S and S-CK (p ≤ 0.05) from day 1 and between T and T-CK from day 5 (p ≤ 0.05) (Figure 2).

3.3. Bentazone Residues in Sensitive and Resistant Potato Seedlings After Treatment

We examined the remaining bentazone residues in sensitive and resistant seedlings after treatment with the same concentration of bentazone to identify differences in their ability to metabolize bentazone. Bentazone was detected in S and T varieties on day 0 (2 h), but there was no significant difference between S and T varieties. There was a significant difference in the residual amount of bentazone between S and T at 2 d. Bentazone was gradually metabolized over time in both varieties; however, degradation was faster in the tolerant variety. At 24 d, the amounts of residual bentazone in the T and S seedlings were 1.4 µg/kg and 13.6 µg/kg, respectively, with degradation rates of 95.7% and 60.6%, respectively (Figure 3).

3.4. Quality Identification of Potato Seedlings with Different Resistance Levels

The transcriptomes of tolerant and sensitive potato seedlings were sequenced before and after treatment with bentazone to detect differences in gene expression. As shown in Table S3, the Q20 and Q30 values (i.e., the proportion of sequencing error rate of bases less than 1% and 0.1%, respectively) of each sample was greater than 90%, and the percentage of clean reads was greater than 99%. These results indicate that the genetic sequences of each sample had high accuracy and quality, meeting the requirements for follow-up tests.

3.5. Principal Component Analysis

The individual samples in each of the four groups (NS, TS, NT, and TT) were gathered together, showing that the individual differences among groups were small. In addition, the main components of NT and TT were similar. However, the main components of the NS and TS were different, confirming that mRNA expression in non-resistant varieties was affected by the bentazone treatment (Figure 4). The resistant varieties showed little change in mRNA expression before and after treatment; thus, we can conclude that the resistant varieties were not sensitive to bentazone.

3.6. mRNA Differential Expression Analysis

In this experiment, the type standard was used to screen differentially expressed genes (DEGs), satisfying p-values < 0.05 and | log2 (fold change) | > 1 for differential genes, where log2 (fold change) > 1 is labeled as an upregulated gene (Up); log2 (fold change) < −1 is labeled as a downregulated gene (Down). There were more significant differences in the susceptible varieties before and after treatment; a total of 10,661 DEGs were detected, among which 5329 were upregulated, and 5332 were downregulated. In the resistant varieties, there were fewer differential genes before and after treatment; 1963 DEGs were detected, including 1097 upregulated genes and 866 downregulated. Comparing the resistant and susceptible varieties before treatment, there were 2703 DEGs in total, of which 1696 were upregulated, and 1007 were downregulated; however, comparing the two varieties after treatment, a total of 11,024 DEGs were detected, 5766 upregulated genes and 5258 downregulated genes (Table 3; Figure 5). There were 923 (539 + 384) DEGs among TT vs. NT, TT vs. TS, TS vs. NS (Figure 6). In summary, fewer significant differences between the resistant and susceptible varieties were present before treatment than after treatment, the gene expression of the susceptible variety showed significant changes after treatment, and the resistant variety had relatively fewer changes in gene expression after treatment. Thus, bentazone does not have a significant effect on the gene expression of the resistant variety.

3.7. Pathway Enrichment Analysis

The Kyoto Encyclopedia of Genes and Genomes (KEGG) is widely used as a reference database of pathway networks for large-scale datasets generated using high-throughput sequencing technology. In order to understand the resistance mechanism of the bentazone-tolerant potato variety, the TT vs. NT unigenes were compared with KEGG (p ≤ 0.05), and the corresponding pathways were elucidated. Among 1963 DEGs, 677 (34.49%) were assigned to KEGG pathways. Among the 677 unigenes, 203 (29.99%) were assigned to metabolic pathways, which was the largest group among the KEGG categories. The next largest pathway group was the biosynthesis of secondary metabolites, which included 149 (22.01%) unigenes. The remaining pathway groups included carbon metabolism (36, 5.32%), protein processing in the endoplasmic reticulum (31, 4.58%), glutathione metabolism (17, 2.51%), carbon fixation in photosynthetic organisms (16, 2.36%), photosynthesis (14, 2.07%), and flavonoid biosynthesis (13, 1.92%) (Table S4).

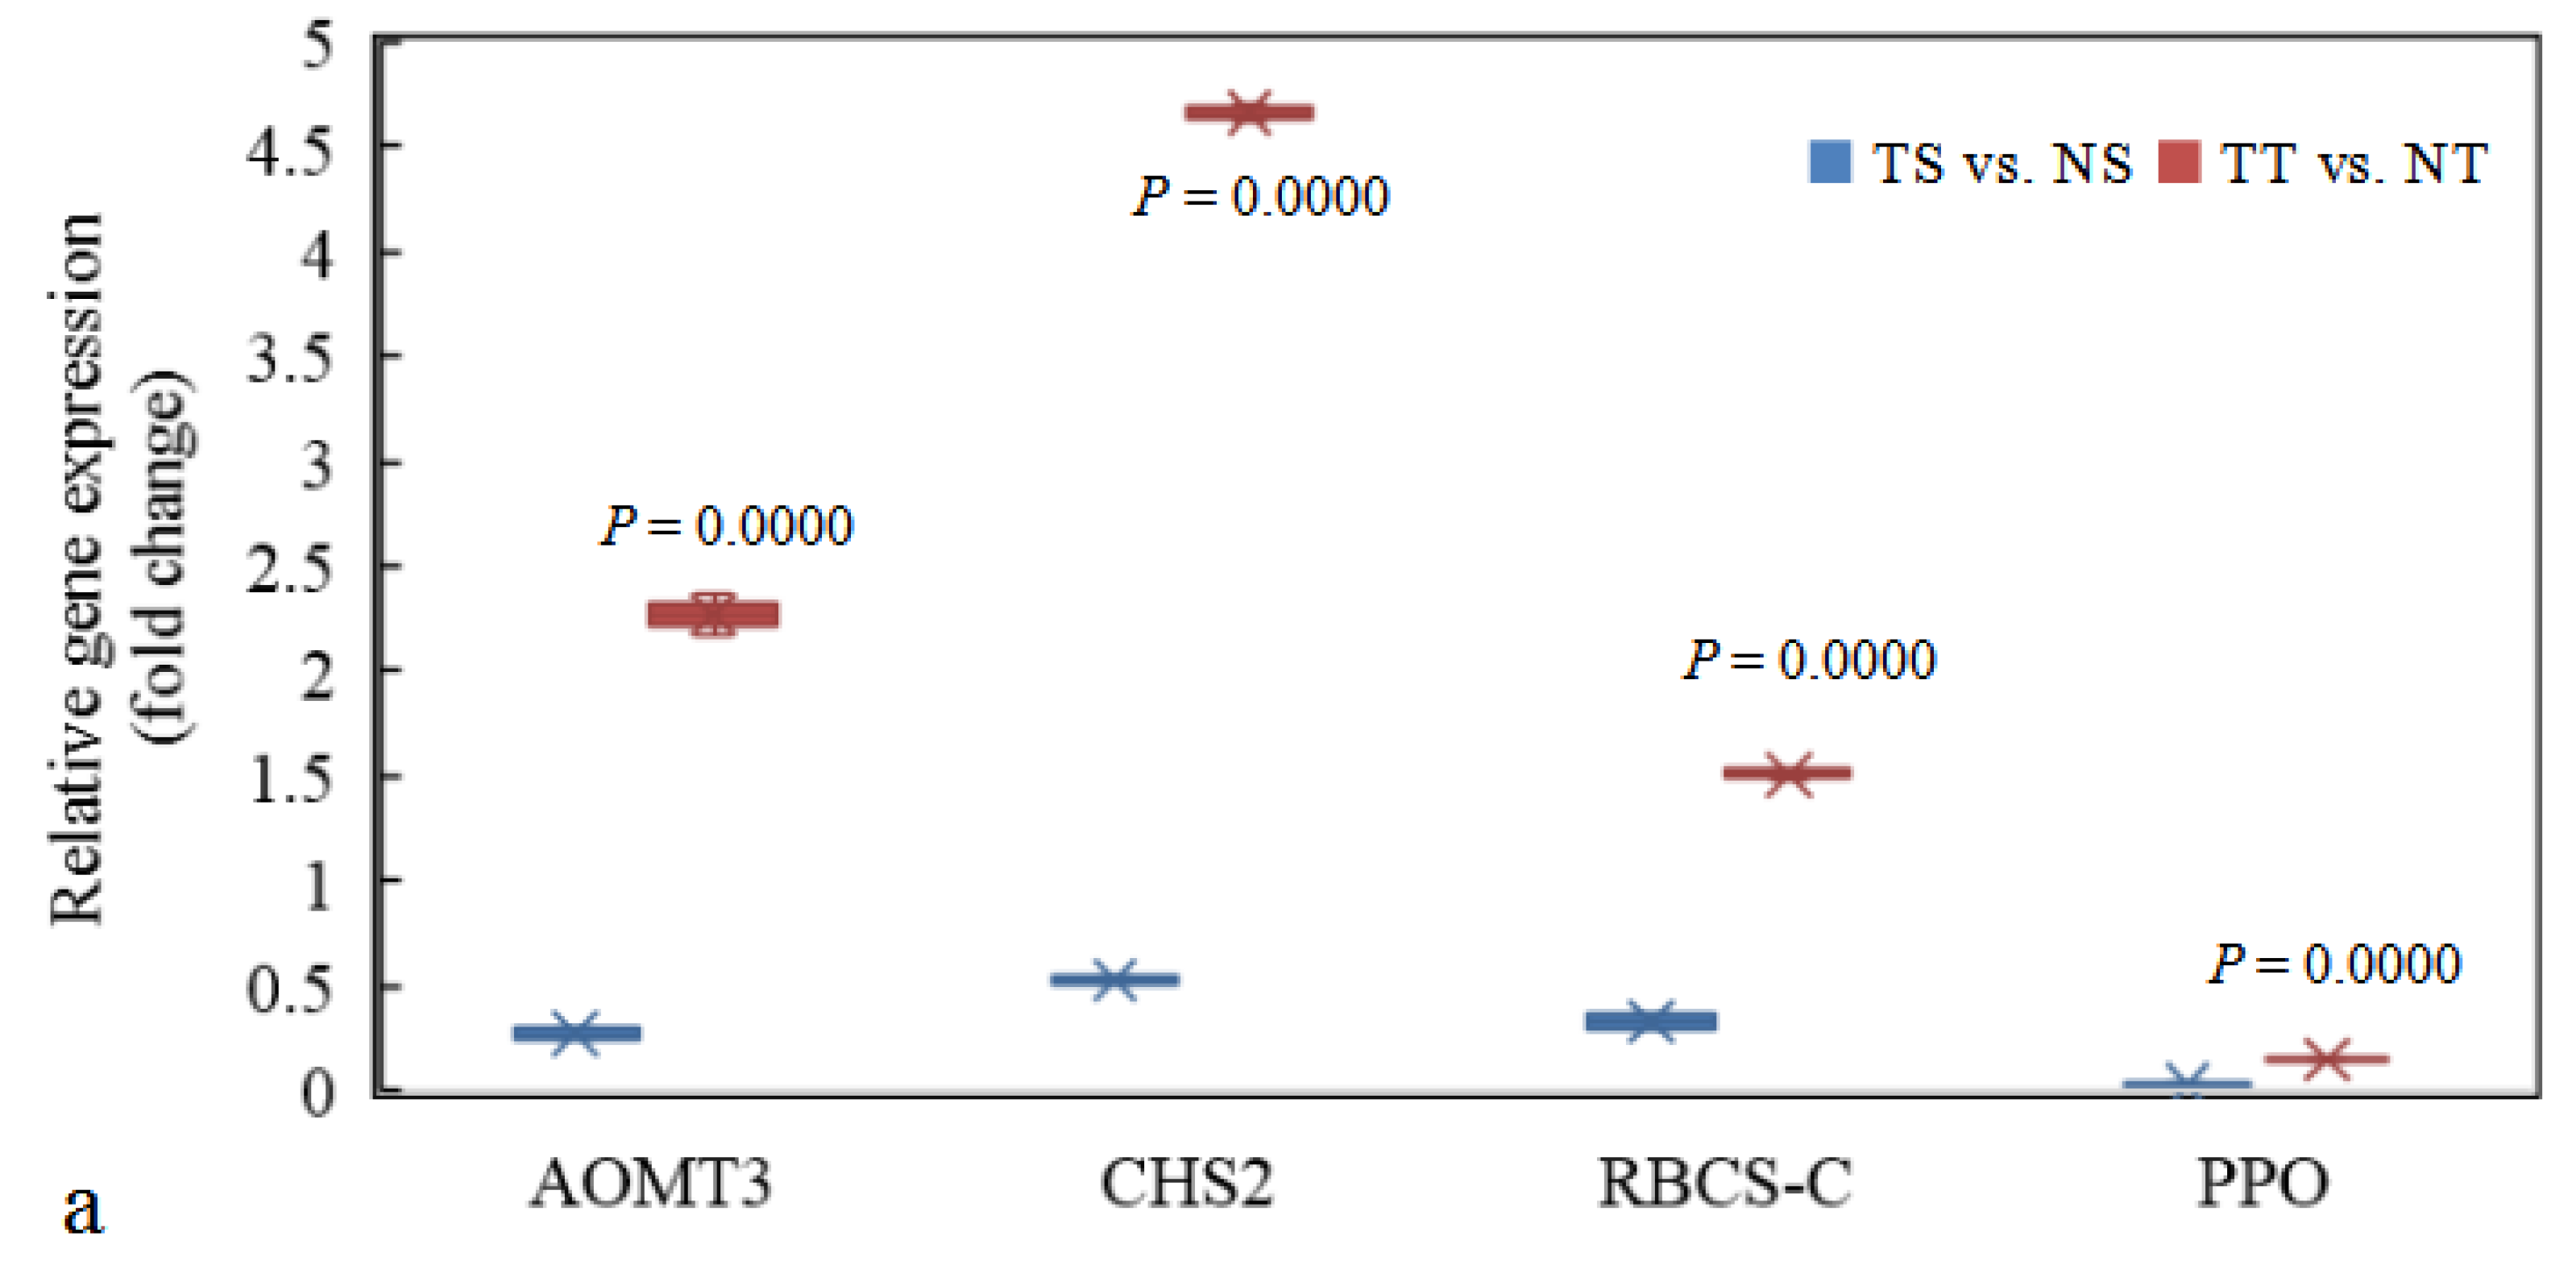
3.8. Identification and q-PCR Validation of DEGs

Four candidate differential genes, polyphenol oxidase (PPO), flavonoid 3′,5′-methyltransferase-like (AOMT3), ribulose bisphosphate carboxylase small chain C (RBCS-C), and chalcone synthase 2 (CHS2) were screened from the DEGs in resistant and sensitive plants based on the KEGG pathway enrichment analysis results. These four DEGs were significantly downregulated in TS vs. NS and upregulated in TT vs. TS. In TT vs. NT, PPO was significantly downregulated, whereas AOMT3, RBCS-C, and CHS2 were significantly upregulated. PPO expression in resistant and sensitive varieties was significantly affected by bentazone treatment; the | log2 (fold change) | value of the PPO gene in TS vs. NS (7.59) was higher than that in TT vs. NT (1.78) group (Table S5). q-PCR results also showed that the AOMT3, RBCS-C, CHS2, and PPO genes in resistant potato seedlings were significantly upregulated after bentazone application, showing a significant difference with sensitive varieties (p ≤ 0.01), but PPO expression was downregulated after bentazone application in both sensitive and tolerant varieties (Figure 7a). The expressions of AOMT3, RBCS-C, CHS2, and PPO in tolerant and sensitive varieties after bentazone treatment were significantly higher than those in the nontreated varieties (p 0.01) (Figure 7b). Although PPO in sensitive and resistant varieties was downregulated owing to the action of bentazone, PPO expression in resistant varieties was significantly higher than that in sensitive varieties.

4. Discussion

4.1. Effects of Bentazone Application on Sensitive and Resistant Potato Varieties

Bentazone is a selective-contact herbicide that is widely used as a postemergence treatment on soybean, wheat, and rice fields. Bentazone irreversibly blocks photosynthetic electron transport in higher plants, inhibiting photosynthesis [24] and provoking oxidative stress [25]. Bentazone is readily absorbed by leaves; however, the absorption and translocation rate varies among plant species and varieties. In tolerant plants, absorption and translocation of bentazone may be slower than in susceptible plants [26].
In this study, potato seedlings with different resistance levels were treated with bentazone at concentrations of 1296 g a.i./ha, 648 g a.i./ha, and 324 g a.i./ha. As the concentration increased, leaves of the sensitive variety gradually curled or even died, while the resistant variety showed little to no damage (Figure 1). The photosynthetic indices of T and S potato seedlings were inhibited after treatment with bentazone (1296 g a.i./ha). However, the inhibition effect was significantly higher in the S seedlings, and the photosynthetic rate decreased dramatically over time (Figure 2). In the tolerant seedlings, the bentazone in the leaves was 95.7% degraded at 24 d, which indicated that the tolerant variety could rapidly metabolize bentazone (Figure 3). Plant tolerance to bentazone can be attributed to increased metabolic breakdown [27].

4.2. DEGs in Bentazone-Resistant and -Susceptible Potato Seedlings

Functional genomics research using transcriptome sequencing technology is useful for understanding the effects of gene expression regulation on potato gene functions and the molecular mechanisms underlying important agronomic traits [1,28]. In this study, transcriptome sequencing technology was used to examine gene expression in bentazone-tolerant and -susceptible potato plants. Before bentazone application, 2703 DEGs were detected among the two varieties. However, the number of DEGs significantly increased to 11,024 after bentazone application (Table 3).
In addition, several genes related to metabolism, photosynthesis, and anti-oxidation, such as catalase, carboxylic oxidase, flavonoid transferase, polyphenol oxidase, and glutathione-metabolizing enzyme, were affected by bentazone application. Zhu et al. [25] reported that soybeans treated with bentazone exhibited a similar response. Many of the bentazone-responsive genes identified are functionally categorized as protein families involved in metabolism, stress response, and defense; the majority of these genes are associated with abiotic stress response signaling and chemical detoxification pathways. Numerous other herbicides and stress factors can induce stress response genes. In general, abiotic stressors (such as herbicides, salinity, and drought) regulate the expression of genes involved in signal cascades and transcriptional control [29]. These genes are activated to counteract the effects of stress and maintain homeostasis. Metabolic enzymes, glutathione-metabolizing genes, stress-signaling genes, detoxification-related genes, and antioxidants were activated upon bentazone treatment in both sensitive and resistant potato plants (Figure S1). Flavonoid transferase and polyphenol oxidase, for example, were upregulated to counteract the oxidative stress resulting from lipid peroxidation after bentazone treatment. This indicates that plants undergo extensive transcriptional adjustment in response to herbicide-induced stress [30].

4.3. Screening of DEGs in Resistant Potato Plants

When comparing the DEGs among resistant and susceptible potato plants in this study, PPO, AOMT3, RBCS-C, and CHS2 were significantly affected by bentazone application. In plants, RBCS-C and PPO are important genes related to photosynthesis, and AOMT3 and CHS2 are important enzymes involved in flavonoid biosynthesis and metabolism. PPO (polyphenol oxidase) is an enzyme with a dinuclear copper center that is mainly associated with enzymatic browning [31]. It has also been shown to play an important role in plant metabolism [32]. Additionally, PPO participates in the process of molecular oxygen photoreduction in the plant photosynthetic system [33,34]). PPO also acts as a metal oxidoreductase to regulate the redox level in the cytoplasm, delivers molecular oxygen to regulate photooxidation in the chloroplast, participates in electron transfer, and plays a role in energy conversion [35]. The mechanism of bentazone by which it kills weeds is the inhibition of photosystem II [36]. Research has shown that PPO is a plastid enzyme present in the photosynthetic organelles (chloroplast thylakoid) of normal cells and in non-photosynthetic plastids. PPO activity can be used to indicate the degree of inhibition of photosynthesis and oxidative damage in plants. PPO protein is related to photosystem II, and its activity is related to the high level of oxygen produced by chloroplasts, which indicates that PPO can prevent this inhibition by oxidizing the substrate in plants. The oxygen and NADH required for PPO to catalyze phenolic substrates are provided by the photosynthetic system, which plays a vital role in plant photosynthesis, biosynthesis, resistance to external stress, and other physiological processes [37]. In this study, the expression of PPO was significantly upregulated in TT compared to TS (Figure 7b), indicating that the presence of the PPO gene in resistant plants under the action of bentazone could weaken the effect of bentazone on photosynthesis, which is also illustrated in Figure 2.
RBCS-C (ribulose bisphosphate carboxylase small chain C, chloroplastic) is a key enzyme involved in photosynthesis, encoding ribulose carboxylase, which plays an important role in the process of CO2 fixation [38]. Thus, RBCS-C can improve the CO2 fixation capacity and photosynthetic efficiency of plants. Additionally, 42 RBCS genes were identified from the cDNA of Astragalus sinicus, which were shown to use C by fixing CO2 [39]. Frukh et al. [40] also reported that RBCS was involved in salt tolerance in rice. In this study, the photosynthetic activity of susceptible plants was strongly inhibited after the application of bentazone, whereas the tolerant plants were not significantly affected (Figure 1; Figure 2). RNA-Seq and q-PCR results showed that the RBCS-C gene was significantly upregulated in the resistant plants compared to that in the S variety after bentazone application (Figure 7b; Table S5). It was concluded that the RBCS-C gene is also one of the critical reasons for bentazone resistance in resistant plants.
Flavonoids are polyphenols that contribute to plant growth, development, and stress resistance; their biological functions have attracted much attention [41,42,43]. Flavonoids are secondary plant metabolites, which have antioxidant and antistress characteristics. They can improve cell function, activate the immune system, and protect against the toxicity caused by pesticides [44]. Jhonsa et al. demonstrated that flavonoids could reduce intracellular reactive oxygen species, regulate antioxidant defense systems, and reduce paraquat toxicity [45]. AOMT3 (flavonoid 3′,5′-methyltransferase-like) and CHS2 (chalcone synthase) are enzymes involved in flavonoid biosynthesis [46]. Among them, CHS2 is the first enzyme in the flavonoid synthesis pathway as well as a key enzyme in the secondary metabolism pathway of plants. The CHS2 gene also plays an important role in Kochia scoparia resistance to the herbicide dicamba; increased CHS expression in the meristem produces flavonols that compete with dicamba for intercellular transport by ABCB transporters, resulting in reduced dicamba translocation [47]. In this study, AOMT3 and CHS2 were upregulated in T plants, which promoted the biosynthesis of flavonoids, thus enhancing oxidative stress and subsequently increasing the tolerance to bentazone.
In conclusion, PPO, RBCS-C, AOMT3, and CHS2 play an important role in bentazone resistance in plants. Our findings provide a preliminary framework for further physiological and molecular study of bentazone in potato, which can be systematically and comprehensively studied using a genomic approach in the future.

Supplementary Materials

The following are available online at https://www.mdpi.com/article/10.3390/agronomy11050897/s1, Table S1: Primers of q-PCR; Table S2: q-PCR gene dissolution curve; Table S3: Sequencing data statistics; Table S4: NT vs. TT KEGG pathway analysis; Table S5: Differentially expressed genes of four treatments (DEGs); Figure S1: NT vs. TT kegg_heatmap.

Author Contributions

Methodology, B.T.; software, J.G.; validation, X.S., S.S. and B.S.; formal analysis, J.G.; investigation, B.T. and L.Z.; resources, B.T.; data curation, J.G.; writing—original draft preparation, J.G.; writing—review and editing, X.S. and J.G.; funding acquisition, B.T. and X.S. All authors have read and agreed to the published version of the manuscript.

Funding

This research was funded by the National Key Research and Development Plan in China, the key technology and product development of chemical pesticide synergy, grant number 2016YFD0200503; Youth fund, regional joint fund of Guangdong basic and applied basic research fund, grant number 2019A1515110888.

Institutional Review Board Statement

“Not applicable” for studies not involving humans or animals.

Informed Consent Statement

“Not applicable” for studies not involving humans.

Data Availability Statement

The data used to support the findings of this study are available from the corresponding author upon request.

Acknowledgments

The authors wish to thank all the colleagues who assisted in this research and provided technical advice and Xiuli Song for technical assistance.

Conflicts of Interest

The authors declare no conflict of interest. The funders had no role in the design of the study; in the collection, analyses, or interpretation of data; in the writing of the manuscript, or in the decision to publish the results.

References

  1. Zhang, R.; Marshall, D.; Bryan, G.J.; Hornyik, C. Identification and characterization of miRNA transcriptome in potato by high-throughput sequencing. PLoS ONE 2013, 8, e57233. [Google Scholar] [CrossRef] [PubMed]
  2. Crookshanks, M.; Emmersen, J.; Welinder, K.G.; Nielsen, K.L. The potato tuber transcriptome: Analysis of 6077 expressed sequence tags. FEBS Lett. 2001, 506, 123–126. [Google Scholar] [CrossRef] [Green Version]
  3. Xu, X.; Pan, S.; Cheng, S.; Zhang, B.; Mu, D.; Ni, P.; Zhang, G.; Yang, S.; Li, R.; Wang, J.; et al. Genome sequence and analysis of tuber crop potato. Nature 2011, 475, 189–195. [Google Scholar] [PubMed] [Green Version]
  4. Salmensuu, O. Macroeconomic trends and factors of production affecting potato producer prices in developing countries. J. Dev. Areas 2021, 55. [Google Scholar] [CrossRef]
  5. Tao, B.; Sun, S.; Zhang, L.; Guo, J.; Shao, B. Production and assessment of potato material resistant to the broadleaf herbicide bentazone. Potato Res. 2020. [Google Scholar] [CrossRef]
  6. Americanos, P.G. Post-Emergence Herbicides against Galium in Potatoes in Technical Bulletin; Press and Information Office: Nicosica, Cyprus, 1995; Volume 172. [Google Scholar]
  7. Huber, R.; Otto, S. Environmental behavior of bentazon herbicide. Rev. Environ. Contam. Toxicol. 1994, 137, 111–134. [Google Scholar] [CrossRef]
  8. Ponnam, V.; Katari, N.K.; Mandapati, R.N.; Nannapaneni, S.; Tondepu, S.; Jonnalagadda, S.B. Efficacy of biochar in removal of organic pesticide, bentazone from watershed systems. J. Environ. Sci. Health B 2020, 55, 396–405. [Google Scholar] [CrossRef]
  9. Lundegårdh, B. Differences in photosynthesis between a diuron-resistant, an atrazine-resistant, a bentazon-resistant and a susceptible biotype of the green alga Monoraphidium pusillum (Printz). In Progress in Photosynthesis Research; Springer: Dordrecht, The Netherlands, 1987; pp. 823–826. [Google Scholar] [CrossRef]
  10. Zhang, L.; Lu, Q.; Chen, H.; Pan, G.; Xiao, S.; Dai, Y.; Li, Q.; Zhang, J.; Wu, X.; Wu, J.; et al. Identification of a cytochrome P450 hydroxylase, CYP81A6, as the candidate for the bentazon and sulfonylurea herbicide resistance gene, Bel, in rice. Mol. Breed. 2006, 19, 59–68. [Google Scholar] [CrossRef]
  11. Liu, C.; Liu, S.; Wang, F.; Wang, Y.; Liu, K. Expression of a riceCYP81A6gene confers tolerance to bentazon and sulfonylurea herbicides in both Arabidopsis and tobacco. Plant Cell Tiss. Organ Cult. 2012, 109, 419–428. [Google Scholar] [CrossRef]
  12. Nicot, N.; Hausman, J.-F.; Hoffmann, L.; Evers, D. Housekeeping gene selection for real-time RT-PCR nor malization in potato during biotic and abiotic stress. J. Exp. Bot. 2005, 56, 2907–2914. [Google Scholar] [CrossRef]
  13. Salas-Perez, R.A.; Saski, C.A.; Noorai, R.E.; Srivastava, S.K.; Lawton-Rauh, A.L.; Nichols, R.L.; Roma-Burgos, N. RNA-Seq transcriptome analysis of Amaranthus palmeri with differential tolerance to glufosinate herbicide. PLoS ONE 2018, 13, e0195488. [Google Scholar] [CrossRef]
  14. Zeng, B.; Zhang, Y.; Zhang, A.; Qiao, D.; Ren, J.; Li, M.; Cai, K.; Zhang, J.; Huang, L. Transcriptome profiling of two Dactylis glomerata L. cultivars with different tolerance in response to submergence stress. Phytochemistry 2020, 175, 112378. [Google Scholar] [CrossRef] [PubMed]
  15. Etebari, K.; Lindsay, K.R.; Ward, A.L.; Furlong, M.J. Australian sugarcane soldier fly’s salivary gland transcriptome in response to starvation and feeding on sugarcane crops. Insect Sci. 2020, 27, 708–720. [Google Scholar] [CrossRef] [PubMed] [Green Version]
  16. Wang, Y.S.; Sun, M.N.; Lu, X.Z.; Gao, T.K.C.; Yang, J.B. HPLC determination of bentazon and its metabolites. Agrochemicals 2006, 45, 113–115. [Google Scholar]
  17. Bolger, A.M.; Lohse, M.; Usadel, B. Trimmomatic: A flexible trimmer for Illumina sequence data. Bioinformatics 2014, 30, 2114–2120. [Google Scholar] [CrossRef] [PubMed] [Green Version]
  18. Kim, D.; Langmead, B.; Salzberg, S.L. HISAT: A fast spliced aligner with low memory requirements. Nat. Methods 2015, 12, 357–360. [Google Scholar] [CrossRef] [Green Version]
  19. DeLuca, D.S.; Levin, J.Z.; Sivachenko, A.; Fennell, T.; Nazaire, M.-D.; Williams, C.; Reich, M.; Winckler, W.; Getz, G. RNA-SeQC: RNA-seq metrics for quality control and process optimization. Bioinformatics 2012, 28, 1530–1532. [Google Scholar] [CrossRef]
  20. Trapnell, C.; Roberts, A.; Goff, L.; Pertea, G.; Kim, D.; Kelley, D.R.; Pimentel, H.; Salzberg, S.L.; Rinn, J.L.; Pachter, L. Differential gene and transcript expression analysis of RNA-seq experiments with TopHat and Cufflinks. Nat. Protoc. 2012, 7, 562–578. [Google Scholar] [CrossRef] [PubMed] [Green Version]
  21. Gaines, T.A.; Lorentz, L.; Figge, A.; Herrmann, J.; Maiwald, F.; Ott, M.C.; Han, H.; Busi, R.; Yu, Q.; Powles, S.B.; et al. RNA-Seq transcriptome analysis to identify genes involved in metabolism-based diclofop resistance in Lolium rigidum. Plant J. 2014, 78, 865–876. [Google Scholar] [CrossRef] [PubMed]
  22. Sun, W.; Ma, Z.; Chen, H.; Liu, M. MYB gene family in potato (Solanum tuberosum L.): Genome-wide identification of hormone-responsive reveals their potential functions in growth and development. Int. J. Mol. Sci. 2019, 20, 4847. [Google Scholar] [CrossRef] [PubMed] [Green Version]
  23. Iqbal, Z.; Seleem, M.N.; Hussain, H.I.; Huang, L.; Hao, H.; Yuan, Z. Comparative virulence studies and transcriptome analysis of Staphylococcus aureus strains isolated from animals. Sci. Rep. 2016, 6, 35442. [Google Scholar] [CrossRef] [PubMed]
  24. Škavić, P.; Duraković, Z.; Nestić, M. Lethal bentazone intoxication-A report of two cases. J. Forensic Sci. 2018, 63, 321–325. [Google Scholar] [CrossRef] [PubMed]
  25. Zhu, J.; Patzoldt, W.L.; Radwan, O.; Tranel, P.J.; Clough, S.J. Effects of photosystem-II-interfering herbicides atrazine and bentazon on the soybean transcriptome. Plant Genome 2009, 2, 191–205. [Google Scholar] [CrossRef] [Green Version]
  26. Bradshaw, L.D.; Barrett, M.; Poneleit, C.G. Physiological basis for differential bentazon susceptibility among corn (Zea mays) inbreds. Weed Sci. 1992, 40, 522–527. [Google Scholar] [CrossRef]
  27. Sterling, T.M.; Balke, N.E. Bentazon uptake and metabolism by cultured plant cells in the presence of monooxygenase inhibitors and cinnamic acid. Pestic. Biochem. Physiol. 1990, 38, 66–75. [Google Scholar] [CrossRef]
  28. Zuluaga, A.P.; Solé, M.; Lu, H.; Góngora-Castillo, E.; Vaillancourt, B.; Coll, N.S.; Buell, C.R.; Valls, M. Transcriptome responses to Ralstonia solanacearum infection in the roots of the wild potato Solanum commersonii. BMC Genomics. 2015, 16, 1–16. [Google Scholar] [CrossRef] [PubMed] [Green Version]
  29. Zhu, J.-K. Cell signaling under salt, water and cold stresses. Curr. Opin. Plant Biol. 2001, 4, 401–406. [Google Scholar] [CrossRef]
  30. Délye, C. Unravelling the genetic bases of non-target-site-based resistance (NTSR) to herbicides: A major challenge for weed science in the forthcoming decade. Pest Manag. Sci. 2013, 69, 176–187. [Google Scholar] [CrossRef]
  31. Mayer, A.M. Polyphenol oxidases in plants and fungi: Going places? A review. Phytochemistry 2006, 67, 2318–2331. [Google Scholar] [CrossRef]
  32. Pialis, P.; Saville, B.A. Production of L-dopa from tyrosinase immobilized on nylon 6,6: Enzyme stability and scale-up. Enzyme Microb. Technol. 1998, 22, 261–268. [Google Scholar] [CrossRef]
  33. Trebst, A.; Department, K. B Polyphenol oxidase and photosynthesis research. Photosynth. Res. 1995, 46, 414–432. [Google Scholar] [CrossRef] [PubMed]
  34. Vaughn, K.C.; Lax, A.R.; Duke, S.O. Polyphenol oxidase: The chloroplast oxidase with no established function. Physiol. Plant. 1988, 72, 659–665. [Google Scholar] [CrossRef]
  35. Qi, J.; Li, G.-Q.; Dong, Z.; Zhou, W. Transformation of tobacco plants by Yali PPO-GFP fusion gene and observation of subcellular localization. Am. J. Transl. Res. 2016, 8, 698–704. [Google Scholar] [PubMed]
  36. Ali, L.; Jo, H.; Song, J.T.; Lee, J.-D. The prospect of bentazone-tolerant soybean for conventional cultivation. Agronomy 2020, 10, 1650. [Google Scholar] [CrossRef]
  37. Wang, X.Y.; Yang, L.Z.; Wang, T.; Wang, R.R.; Liu, J.; Shan, Y.; Zhang, Q.; Ding, S.H. Recent progress toward understanding the physiological function, purification, and enzymatic browning control of plant polyphenol oxidases. Food Sci. 2020, 41, 222–237. [Google Scholar]
  38. Cai, Z.; Liu, G.; Zhang, J.; Li, Y. Development of an activity-directed selection system enabled significant improvement of the carboxylation efficiency of RuBisCO. Protein Cell 2014, 5, 552–562. [Google Scholar] [CrossRef] [Green Version]
  39. Zhang, X.; Wang, J.; Cao, K.; Xu, C.; Cao, W. An expressed sequence tags analysis for leaves of Chinese milk vetch (Astragalus sinicus). Legu. Rese. Inter. Jour. 2015, 38, 1–8. [Google Scholar] [CrossRef]
  40. Frukh, A.; Siddiqi, T.O.; Khan, M.I.R.; Ahmad, A. Modulation in growth, biochemical attributes and proteome profile of rice cultivars under salt stress. Plant Physiol. Biochem. 2020, 146, 55–70. [Google Scholar] [CrossRef]
  41. Henry-Kirk, R.A.; Plunkett, B.; Hall, M.; Mcghie, T.; Allan, A.C.; Wargent, J.J.; Espley, R.V. Solar UV light regulates flavonoid metabolism in apple(Malusxdomestica). Plant Cell Environ. 2018, 41, 675–688. [Google Scholar] [CrossRef] [PubMed]
  42. Kang, X.; Li, W.; Zhang, X.; Tang, Y.; Zhao, Z.; Gu, Y.; Qi, G.; Guo, S. Transcriptome sequencing and de novo assembly in red raspberry fruit development to elucidates the secondary metabolite pathways. J. Berry Res. 2020, 10, 497–511. [Google Scholar] [CrossRef]
  43. Silva-Navas, J.; Moreno-Risueno, M.A.; Manzano, C.; Téllez-Robledo, B.; Navarro-Neila, S.; Carrasco, V.; Pollmann, S.; Gallego, F.J.; Del Pozo, J.C. Flavonols mediate root phototropism and growth through regulation of proliferation-to-differentiation transition. Plant Cell 2016, 28, 1372–1387. [Google Scholar] [CrossRef] [PubMed] [Green Version]
  44. Zeng, X.Q.; Du, Z.J.; Ding, X.M.; Jiang, W.B. Protective effects of dietary flavonoids against pesticide-induced toxicity: A review. Trends Food Sci. Tech. 2021, 109, 271–279. [Google Scholar] [CrossRef]
  45. Jhonsa, D.J.; Badgujar, L.B.; Sutariya, B.K.; Saraf, M.N. Neuroprotective effect of flavonoids against paraquat induced oxidative stress and neurotoxicity in Drosophila melanogaster. Curr. Top. Nutraceut. R. 2019, 14, 283–293. [Google Scholar]
  46. Yang, M.; Wang, L.; Belwal, T.; Zhang, X.; Lu, H.; Chen, C.; Li, L. Exogenous melatonin and abscisic acid expedite the flavonoids biosynthesis in grape berry of Vitis vinifera cv. Kyoho Mol. 2019, 25, 12. [Google Scholar] [CrossRef] [PubMed] [Green Version]
  47. Pettinga, D.J.; Ou, J.; Patterson, E.L.; Jugulam, M.; Westra, P.; Gaines, T.A. Increased chalcone synthase (CHS) expression is associated with dicamba resistance in Kochia scoparia. Pest Manag. Sci. 2018, 74, 2306–2315. [Google Scholar] [CrossRef]
Figure 1. Representative images of the leaf condition of sensitive (4–0) and tolerant (4–19) potato seedlings treated with bentazone at a concentration of (a) 1296 g a.i./ha, (b) 648 g a.i./ha, and (c) 324 g a.i./ha.
Agronomy 11 00897 g001
Figure 2. Effect of 1296 g a.i./ha bentazone on the photosynthetic rate of sensitive (S) and tolerant (T) potato seedlings over 15 d. T-CK, nontreated T potato seedlings; T, treated T potato seedlings; S-CK, nontreated S potato seedlings; S, treated S potato seedlings. A significant difference was obtained by Duncan’s test.
Agronomy 11 00897 g002
Figure 3. Bentazone residues in the leaves of sensitive (S) and tolerant (T) potato seedlings treated with 1296 g a.i./ha bentazone. A significant difference was obtained by Duncan’s test.
Agronomy 11 00897 g003
Figure 4. Principal component analysis plot of samples from experimental and control groups. TS, treated susceptible plants; NS, nontreated susceptible plants; TT, treated tolerant plants; NT, nontreated tolerant plants.
Agronomy 11 00897 g004
Figure 5. Differential gene expression M-A maps. The abscissa is the A value log2 (FPKM), which is the logarithm of the expression level, representing the level of gene expression; the ordinate is the M value log2 (FC), which is the logarithm of the ratio of the expression of the sample or group, used to measure the expression difference. The green dots represent the downregulated differentially expressed genes (DEGs), the red dots represent upregulated DEGs, and the blue dots represent genes that are not differentially expressed. NT, nontreated tolerant plants; NS, nontreated susceptible plants; TS, treated susceptible plants; TT, treated tolerant plants.
Agronomy 11 00897 g005
Figure 6. Venn diagram: the number of differentially expressed genes common or specific to treated and nontreated tolerant and susceptible plants. NT, nontreated tolerant plants; NS, nontreated susceptible plants; TS, treated susceptible plants; TT, treated tolerant plants.
Agronomy 11 00897 g006
Figure 7. Expression analysis of the chosen transporters in tolerant and susceptible potato plants before and after bentazone treatment. (a) Sensitive varieties treated with 1296 g a.i./ha of bentazone were compared with those that were untreated (TS vs. NS). The tolerant varieties treated with 1296 g a.i./ha of bentazone were compared with those that were untreated (TT vs. NT). (b) Tolerant and sensitive varieties before bentazone treatment (NT vs. NS); tolerant and sensitive varieties treated with bentazone (TT vs. TS). mRNA abundance was normalized using the housekeeping gene EF1α-actin, and the relative expression levels were calculated using the 2−ΔΔCt method. Three biological replicates were performed. A significant difference was obtained by Duncan’s test.
Agronomy 11 00897 g007aAgronomy 11 00897 g007b
Table 1. Survival rate of bentazone at different concentrations.
Treatment Concentration (g a.i./ha)VarietiesSurvival Rate (%)
12964–012
4–1990
6484–062
4–1996
3244–098
4–19100
Table 2. Leaf condition of sensitive and resistant potato seedlings treated with bentazone.
Different VarietiesTreatment Concentration (g a.i./ha)
1296648324
4–0XXXXX
4–19X
Note: −, no damage to the leaves; X, focal burned spots on the leaves are <2 cm2; XX, focal burned spots on the leaves are between 2 and 4 cm2; XXX, entire leaves are burned.
Table 3. Differentially expressed genes putatively involved in differential tolerance to bentazone in potato.
Level of Gene ExpressionNumber of Differentially Expressed Genes
NT vs. NSTS vs. NSTT vs. NTTT vs. TS
UpDownUpDownUpDownUpDown
>1–212517572700265191664825942590
>2–33151761184136412913614901184
>3–483476006953540844620
>4–517153313211212455309
>53535917619258386
±inf277155125421125169
Total1696100753295332109786657665258
270310,661196311,024
NT vs. NS: nontreated tolerant relative to nontreated susceptible plants; TS vs. NS: treated susceptible relative to nontreated susceptible plants; TT vs. NT: treated tolerant relative to nontreated tolerant plants; TT vs. TS: treated tolerant relative to treated susceptible plants.
Publisher’s Note: MDPI stays neutral with regard to jurisdictional claims in published maps and institutional affiliations.

