Abstract
Winter annual legume cover crops often fail to reach full maturity by spring vegetable planting dates in northern climates, which prevents maximum nitrogen (N) contributions. To determine if delayed termination improved cover crop biomass and N content, we evaluated winter rye + hairy vetch (Secale cereale L. + Vicia villosa Roth) and oat + field pea (Avena sativa L. + Pisum sativum L.) cover crop mixtures in 2015 and 2016, and medium red clover (Trifolium pratense L.) in 2016, in zone-tilled organic yellow crookneck squash (Cucurbita pepo var. torticollis Harz). In-row regions where cover crops were terminated in early spring during crop row preparation were compared to between-row regions where termination was delayed until legume maturation in late spring. Soil quality (soil inorganic N, permanganate oxidizable C (POXC), and potentially mineralizable N (PMN)) was also determined for in-row and between-row regions at four time points throughout the growing season. In 2015, winter rye + hairy vetch biomass N more than doubled between early and late termination times, with 120 and 258 kg N ha−1, respectively. Permanganate oxidizable C was not responsive to cover crop systems or tillage, and only slightly decreased over time in 2016. Soil inorganic N and PMN after cover crop termination in 2016 provided evidence of localized soil N cycling responses to cover crop termination in in-row and between-row regions. The extended growing period for cover crops between crop rows in the first several weeks of crop growth had no negative effect on crop yield, and appeared to enhance soil fertility.
1. Introduction
Cover crops play a major role in crop fertility management by preventing nutrient leaching and runoff [1,2,3], providing carbon-rich additions to soil organic matter [4,5], and biologically fixing nitrogen in the case of legumes (N; [6,7,8,9,10,11]). Zone tillage has recently risen in popularity as an approach for reducing tillage by tilling only areas directly where crops will be sown, and leaving between-row regions untilled. This practice has gained traction due to its capacity to improve soil quality by incorporating cover crop residue where crops will be planted, while maintaining living ground cover between rows to prevent N mineralization where runoff and leaching potential is highest [2,12,13,14]. This approach has great potential in northern climates where short spring seasons often prevent winter annual legumes from reaching maturity by the time spring and long-season vegetable crops are planted, making it difficult to reach maximum biomass N, which generally occurs at legume flowering [5,15,16,17,18]. By restricting early spring termination of winter annual cover crops only to regions where subsequent crops will be planted, between-row cover crops can persist until flowering and thus maximize soil N contribution and ground cover maintenance.
Zone-tilled cover crop systems may be especially well-suited for organic production, where the major mechanism for providing crop nutrition occurs via microbial transformation of organic amendments to plant-available, inorganic nutrients [19]. In the US, the US Department of Agriculture’s (USDA) National Organic Program encourages the use of cover crops, diversified crop rotations, and reduced tillage practices, which in part aim to enhance soil quality. Soil quality indicators with potential to identify the impact of extended cover crop spring growth between rows include both organic and inorganic pools of soil N and permanganate oxidizable C (POXC). Labile organic N, including plant residues, is commonly measured as potentially mineralizable N (PMN). This soil N pool requires microbially-mediated decomposition to become plant-available [14,20,21]. Conversely, soil inorganic N is plant-available, prone to loss via leaching, and is best managed in synchrony with crop N needs [18,22,23]. To measure the fraction of soil organic carbon that is easily accessible to microbes for co-metabolizing with organic N, Weil et al. [24] developed a method using potassium permanganate, a strong oxidizing agent, to simulate microbial C oxidation. These assays provide useful insights into nutrient cycling dynamics.
While zone tillage has been widely evaluated in agronomic systems [25,26,27,28], small- to medium-scale horticultural producers typically use zone tillage informally as a means of maintaining wide grass or clover alleyways to assist crop maintenance and harvest. Studies that examine living mulches, or systems where annual cover crops co-exist alongside crops, often aim to reduce weeds and crop pests [12,29,30]. Fewer studies have investigated the effect of maintaining living mulches between planted beds via zone tillage to purposefully enhance soil quality and nutrient cycling in vegetable systems [31,32,33].
The goal of our study was to investigate how zone till management affects different cover crop systems with regards to in-row (IR) and between-row (BR) cover crop N contributions and soil quality, and subsequent certified organic yellow crookneck squash (Cucurbita pepo var. torticollis Harz) yield. Specifically, our objectives were to (1) assess the effect of BR extended cover crop growth on biomass quality and quantity relative to IR regions; (2) compare the effect of zone till management on soils in IR regions, where immature cover crop residue was incorporated via tillage and crops planted, to BR regions where cover crops persisted, and soil and roots were undisturbed; and (3) determine the effect of various zone-tilled cover crop systems on squash yields. To meet these objectives, we compared cover crop biomass C/N and N content of cover crop systems (winter rye + hairy vetch and oat + field pea in 2015 and 2016, and red clover in 2016) terminated in early spring during crop row preparation, and late spring following maturation of cover crop legumes persisting in BR regions. We compared IR and BR soil quality parameters at four time points throughout the growing season.
2. Materials and Methods
2.1. Experimental Design
This experiment was conducted in St. Paul, Minnesota (44°59′ N, 93°10′ W) on a well-drained Waukegan silt loam (fine-silty over sandy, mixed mesic Typic Hapludoll) under certified organic production. In 2015, a randomized complete block design with four replications was used with two cover crop systems, winter rye + hairy vetch (Secale cereale L. + Vicia villosa Roth) and oat + field pea (Avena sativa L. + Pisum sativum L.). In 2016, a red clover system was added (Trifolium pratense L.) to the experiment due to farmer interest and its potential for serving as a biennial living mulch. Resulting 2016 cover crop systems thus included (1) spring-planted oat + field pea (OP); (2) fall-planted winter rye + hairy vetch (RV); and (3) fall-planted red clover (RC) in a randomized complete block design. In this year, RV and RC were zone-tilled (BR regions were flail-mowed but not incorporated), and OP was tilled full-width (BR region was mowed and incorporated) to emulate standard horticultural practice. All systems included a tilled region (IR) where cover crops were terminated in spring for planting. Plots were sown in different fields in 2015 and 2016 to meet organic production standards, with the plots following tomato in 2015 and following white clover in 2016.
2.2. Cover Crop Management
In 2014, OP and RV mixes were drilled on 18-cm spacings in September (Table 1), but cold temperatures combined with unusually low snow cover in the 2014–2015 winter season killed fall-planted plots. The following spring, plots were flail mowed and rototilled, and cover crops re-seeded with the same treatments approximately one week later, immediately following a second rototill pass for seedbed preparation. For 2016, RV and RC were fall-planted and OP was spring-planted, both with a 6-row seeder (Model JP-6, Jang Automation Co, Chungcheongbuk-Do, South Korea). In both years, winter rye was seeded at 56 kg ha−1 with hairy vetch at 22.4 kg ha−1, oat and field pea were each seeded at 56 kg ha−1, and in 2016 medium red clover was seeded at 13.5 kg ha−1. Seeding rates were chosen per local cover crop seed representative recommendations.

Table 1.
Schedule of field operations.
To investigate whether extended growing time would impact soil organic matter and nitrogen cycling, cover crops were terminated at early and late time points (Table 1 and Table 2). All IR regions were terminated at the early time point in order to prepare crop beds. Late termination was timed to match early pod set of cover crop legumes to maximize cover crop N content and minimize viable seeds at termination. A flail mower was used at both termination time points, and a rototiller was used to incorporate residues at the early time point to prepare seedbeds. In 2016, the hairy vetch pod set matched the early termination time, so BR and IR areas were terminated at the same time point. Since OP was a full-width tillage treatment in 2016, both IR and BR regions were also terminated early. Residues from BR termination in RV and RC were not incorporated but kept on the surface to serve as a BR mulch for weed control. In both years, weed seed heads were clipped by hand and removed in order to reduce weed pressures in experimental plots in following years. In 2015, grasses that set seed before the early termination also had their seed heads clipped and removed to prevent reseeding.
Table 2.
Mean cover crop system aboveground biomass N and C/N by year, soil region, and sampling time in 2015 and 2016. Numbers in parentheses represent one standard error. Different capital letters in a row within a region denotes a significant main effect of sampling time (p < 0.05). Different lowercase letters in a column denotes a significant main effect of cover crop system (p < 0.05).
2.3. Crop Production
Before crop planting, beds were prepared using a tractor-mounted bed shaper and plastic layer (1721-D bed shaper + 1723 plastic mulch layer, Buckeye Tractor Co, Columbus Grove, OH, USA) immediately prior to crop planting. No fertilizer was applied in either year, so as not to confound soil quality effects resulting from treatments; nor was weed control necessary in either year due to plastic mulch use and cover crop mulch between rows. Drip irrigation was installed in both years and used to ensure the crop received a total of approximately 2.5 cm of water per week. Organic yellow crookneck squash was directly seeded by hand into the plastic mulch in both years. Individual squash rows were covered with 1.5-m wide floating row cover and secured with ground staples until row cover restricted crop growth, to deter herbivores and insect pests. When row covers were removed, plants were counted and used to adjust yield calculations. In 2015, rows were 6-m long with squash seeded on 0.5-m spacings. Each plot contained three rows on 2.4-m centers, with data collected from the middle row only. In 2016, rows were 6-m long with squash seeded on 0.3-m spacings. Each plot had five rows and only the three center rows were used for data collection. Rows in RV and RC plots were on 2.5-m centers, while OP plot rows were on 1.3-m centers to reflect the practical space utilization commonly used in full-width tillage systems.
2.4. Data Collection
Cover crops were sampled immediately before early and late time points, using two combined cuttings per plot from 0.1-m2 quadrats. Samples were dried at 60 °C to constant weight, for at least 48 h, then ground to 1 mm and analyzed for C and N content on a combustion analyzer (Elementar VarioMAX CN analyzer, Elementar Americas, Langenselbold, Germany).
Soils were sampled from both IR and BR areas four times per year: (1) before IR cover crop termination and bed preparation (pre-kill), (2) approximately 1.5–2 weeks after IR termination (post-kill), (3) approximately one month later (mid-season), and (4) after final squash harvest (post-harvest). Eight composite samples up to a 15-cm depth were collected, homogenized, and divided into two subsamples. One sub-sample was dried at 35 °C for at least 48 h before grinding and sieving to 2 mm, and then set aside for inorganic N extractions, POXC analysis, and C and N analysis (Elementar VarioMAX CN analyzer, Elementar Americas, Langenselbold, DE). The other subsample was sieved to 2 mm and kept field-moist at 4 °C for PMN determination.
Squash was harvested three times per week for the entire length of fruiting time (Table 1). Entire plots were harvested, and only squash from data rows were counted and weighed according to USDA summer squash grading standards. Culls were few and generally the result of animal feeding.
2.5. Soil Analysis
Permanganate oxidizable C was measured according to Weil et al. [24]. In brief, 2.5 g of dry soil were reacted with 0.2 M of KMnO4, a strong oxidizing agent. Diluted supernatants were transferred to 96-well plates and measured on a spectrophotometer at 540 nm. Absorbance was fitted to a standard curve, and calculated to determine C oxidation by KMnO4 reaction.
Inorganic N (nitrate and ammonium) was extracted using 1 M of KCl and filtered through #42 Whatman papers in both years [34]. Extractions were frozen at −20 °C in scintillation vials until N analysis on a Shimadzu TOC and TN analyzer (Kyoto, Japan).
In 2016, post-kill soils were analyzed for PMN using a 7-d anaerobic incubation [20] in order to assess cover crop contributions to N cycling. In brief, soils were submerged in 10 mL of water within a test tube, purged with N2 gas, and sealed. Tubes were kept in a 37 °C incubator for exactly seven days, then extracted with 1.3 M of KCl. Extracts were analyzed on a Shimadzu TOC and TN analyzer (Kyoto, Japan). Final values were calculated by subtracting soil inorganic N values from incubation values.
2.6. Statistical Analysis
Data were analyzed using RStudio [35], with years analyzed separately due to spatial and temporal differences. Cover crop system was considered a between-subjects factor, whereas soil region and time were considered within-subjects factors. Where necessary to meet assumptions of normality and equal variance, data were transformed and analyzed using the ‘stats’ and ‘rstatix’ packages [36]. When transformation was unsuccessful, nonparametric alternatives from the ‘WRS2’, ‘nparLD’, and ‘nparcomp’ packages were used [37,38,39]. In analyses of variance, Greenhouse–Geisser-corrected p-values were used for within-subject factors that did not meet the assumption of sphericity. All post-hoc pairwise comparisons used Bonferroni-adjusted p-values. All data are available in Tables S1–S4.
3. Results
3.1. Cover Crops
In 2015, early cover crop biomass N ranged considerably with an average of 268 and 120 kg N ha−1 for OP and RV systems, respectively (Table 2). Despite OP having more than double the biomass N of RV, this difference was not significant (p = 0.219; Table 2), likely due to biomass variability within RV plots. By the late sampling time, the gap in biomass N between systems decreased substantially (Table 2). Delaying RV cover crop termination by one month at least doubled RV biomass N content, while OP biomass N decreased by 32 kg N ha−1, though neither difference between sampling times was significant (Table 2). Cover crop carbon-to-nitrogen ratio (C/N) increased by the late sampling time, with OP increasing by 6.7 and RV increasing by 5.2 (Table 2). While the effect of sampling time was significant (p = 0.001), both cover crop systems and sampling times featured relatively low C/N values (Table 2).
In 2016, these trends were reversed. The fall-planted cover crops had greater biomass N in rows than did OP, which was spring-planted (p < 0.001; Table 2). There was a wider range in cover crop biomass quality in 2016 than 2015, from C/N ratios of 7.7 in OP to 29.6 in RV in crop rows, and from 8.0 in OP to 48.8 in RV between crop rows (p = 0.047; Table 2). Medium red clover C/N decreased between the early and late sampling time by nearly half (p = 0.007), as did biomass N, though not significantly (p = 0.208; Table 2).
3.2. Soil Quality
Neither cover crop system nor soil region affected POXC in 2015 (Figure 1). Despite there being no statistical interaction between cover crop and sampling region (p = 0.187), POXC appeared similar for RV across soil regions, whereas POXC in the OP system increased only in BR regions after tillage (Figure 1). In 2016, POXC in post-harvest soils was lower than at other times points across cover crop systems and soil regions (p < 0.001; Figure 2).
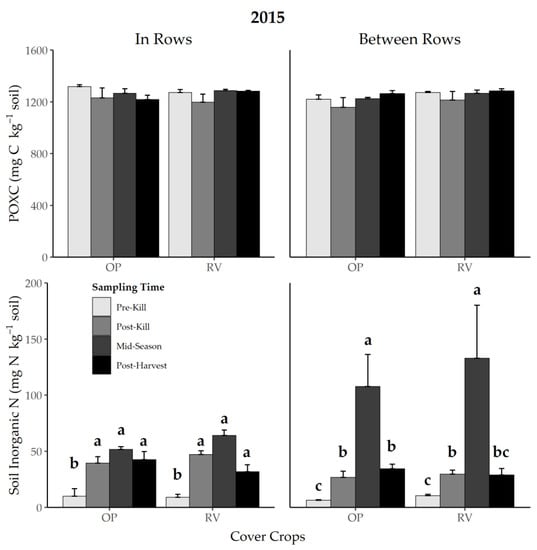
Figure 1.
Effect of soil region and cover crop system on permanganate oxidizable C (POXC) and soil inorganic N in 2015 at four sampling times. Error bars represent one standard error. Different lowercase letters over bars within a cover crop system and soil region represent a difference between sampling times at p < 0.05. OP = oat + field pea, RV = winter rye + hairy vetch.
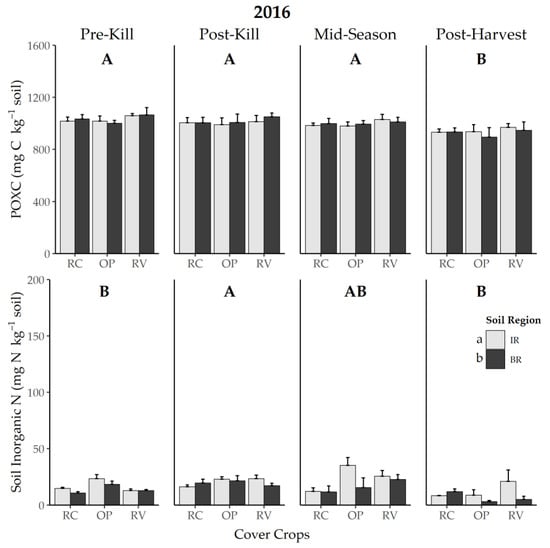
Figure 2.
Effect of soil region and cover crop system on permanganate oxidizable C (POXC) and soil inorganic N in 2016 at four sampling times. Error bars represent one standard error. Different capital letters between panels represent a difference between sampling times at p < 0.05, and different lowercase letters between soil regions represent a difference at p < 0.05 for soil inorganic N. OP = oat + field pea, RV = winter rye + hairy vetch, RC = medium red clover. IR = in rows, BR = between rows.
Sampling time and soil region had an interactive effect on soil inorganic N in 2015 (p = 0.013, Figure 1). In crop rows, soil inorganic N at all three times after cover crop termination were greater than at the pre-kill sampling time for both OP and RV (Figure 1). Between rows, where cover crop termination was delayed, soil inorganic N was greatest at the mid-season sampling time for both cover crop systems, 10 d after cover crop termination (Figure 1). While we expected BR soil inorganic N to increase mid-season relative to post-kill, it increased at both sampling times such that mid-season > post-kill > pre-kill in both cover crop systems (Figure 1). At post-harvest, BR soil inorganic N in the OP system remained greater than at pre-kill (Figure 1).
Both soil region and sampling time affected soil inorganic N in 2016 (p = 0.01 and 0.004, respectively), while cover crop system did not (p = 0.123, Figure 2). Soil inorganic N was generally greater in rows, where cover crops were incorporated upon termination, than between rows (p = 0.012; Figure 2), as well as at the post-kill sampling time relative to pre-kill and post-harvest (p = 0.037 and < 0.001, respectively; Figure 2).
Potentially mineralizable N was measured only in 2016 at the post-kill time point, to further examine N mineralization dynamics. While there was no soil region effect, the cover crop system did impact PMN such that RV and RC systems had approximately double the amount of mineralizable N than the OP system (p = 0.048 and 0.004, respectively; Figure 3).
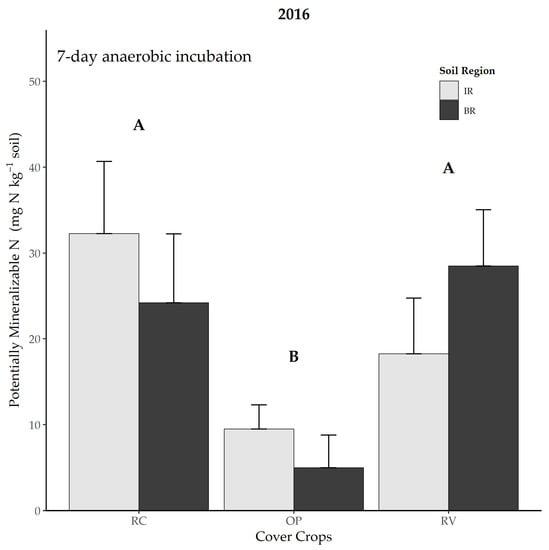
Figure 3.
Effect of cover crop system on potentially mineralizable N at the post-kill sampling time in 2016. Error bars represent one standard error. Different capital letters over bars represent a difference between cover crop systems at p < 0.05. OP = oat + field pea, RV = winter rye + hairy vetch, RC = medium red clover. IR = in rows, BR = between rows.
3.3. Squash Yield
Squash yield did not vary by cover crop system in either 2015 or 2016 (Table 3). Yields were generally greater in 2016 than in 2015; while yields ranged from 17,665 and 25,316 kg squash ha−1 in 2015, 2016 yields ranged from 19,969 to 50,701 kg squash ha−1 (Table 3). Despite the wide range in 2016 yields in particular, highly variable squash production precluded any significant difference in kg squash ha−1 between systems, where RV yielded only approximately 40% of the OP and RC systems (p = 0.273; Table 3).
Table 3.
Mean marketable organic yellow crookneck squash yield by cover crop system in 2015 and 2016. Numbers in parentheses represent one standard error.
4. Discussion
This study assessed the viability of delaying cover crop termination between crop rows via zone tillage to facilitate timely vegetable plantings in northern climates when leguminous cover crop species are not fully mature. We found that when this was the case, using zone tillage to incorporate cover crops within rows and maintaining between-row regions enhanced biomass N content while synchronously providing high-quality cover crop residue for soil N mineralization.
4.1. Additional Growing Time Increases Cover Crop Biomass N Content
Spring-planted OP and RV delivered 268 and 120 kg N ha−1 in crop rows by two months after planting, respectively. The large biomass inputs from the OP system are on par with a study on green manure N production in Manitoba, Canada [40]. Alternatively, because RV is typically fall-planted in the Upper Midwest, early RV biomass production in our study was lower than recent findings of approximately 200 kg N ha−1 [8]. To this end, we found that the additional month of growing time for RV between rows more than doubled biomass N by the late sampling time. The slight decrease in OP biomass N by the late termination, though not significant, was possibly due to routine clipping of the grass seed heads as they matured. This was done to prevent intensifying the weed seedbank in the experimental plot location. Early versus late termination time impacted cover crop biomass C/N in 2015, with C/N increasing between the two termination times.
This was likely driven by the grass species’ maturation in each biculture [18]. However, C/N values for both systems’ termination times were well under the threshold for mineralization, commonly considered ≤ 25.
In 2016, differences between systems at the early sampling time can likely be attributed to planting time, as RV and RC were planted in fall, while OP was planted in spring (Table 1). This allowed RV and RC systems to establish and accrue some biomass in fall, and to continue growing early in spring when OP was only being planted. Due to variable cover crop stands, IR and BR regions were collected separately at the early sampling, but system rankings were similar between the regions. The OP system was seeded about one month before termination at the early time point and was relatively immature; thus, biomass N and C/N were far less than fall-planted RV and RC systems. In-row N content of OP was approximately 20% and 30% that of RV and RC, respectively. Between rows, RV had greater C/N than RC at the early sampling, most likely due to the presence of cereal rye in the mixture. It is worth noting the high RV C/N of 48.8, suggesting an environment conducive to soil N immobilization, as has also been found by Leavitt et al. [41]. Due to maturity of the RV system by this early time point, both IR and BR regions were terminated, but IR residue was incorporated via rototilling while BR residue was left on the soil surface. At the same time, OP was terminated and incorporated full-width. The RC system was also mowed full-width at this time, but BR areas, which were not incorporated, continued to be productive as medium red clover can tolerate occasional defoliation. When between-row RC biomass was sampled about six weeks later, its C/N had decreased by nearly half, from 24.8 to 13.3. Mowing the BR area at the early sampling time reduced weed pressure and contribution to the C/N value such that weeds made up only 5% of total biomass at the later sampling date (data not shown). This, or the sampling of younger new regrowth, likely drove the reduction in the RC system’s C/N between times.
4.2. Soil Region and Sampling Time Are the Main Determinants of Soil Quality Changes
Labile C was unaffected by cover crop system, soil region, and sampling time in 2015. This was surprising, as this readily available C pool is typically utilized for co-metabolizing in N mineralization [42], and the OP system in particular contributed a large volume of high-quality cover crop residue immediately after the pre-kill soil sampling time in crop rows. Therefore, we expected to observe a decrease in IR POXC after cover crop termination as cover crop residue mineralized, but this was not observed. While the sensitivity of POXC to cover cropping practices has mixed results in the literature [42,43,44], some have concluded that it better reflects practices and systems that build soil organic matter rather than nutrient turnover [45,46].
Soil inorganic N responded to cover crop termination in both soil regions and cover crop systems in 2015. In crop rows, soil inorganic N increased by the post-kill sampling time, 9 d after cover crop termination and incorporation, and remained greater than pre-kill soil inorganic N thereafter for both OP and RV. The same was true in the BR region, except that mid-season soil inorganic N was greater even than at post-kill, and by post-harvest, RV soil inorganic N had decreased to pre-kill levels. This mid-season increase appears to capture peak mineralization from BR cover crop termination, which occurred 10 d prior to sampling. This is interesting given that BR cover crop residue was left between rows on the soil surface, and not incorporated into the soil. However, others have found legume roots to mineralize under roller-crimping termination, albeit more slowly than when disked [7]. Therefore, we suggest root decomposition and mineralization were primary drivers of increased soil inorganic N in this instance.
Fairly consistent POXC measures across systems in both years suggests that no practices examined in this study decreased soil organic matter accumulation and storage in the short-term. Despite the greater biomass N and lower residue quality in RV and RC systems relative to OP in 2016, POXC responded only to sampling time with a slight decrease by the post-harvest sampling time relative to all other time points. This slow decrease over time may be attributed to general microbial activity and decomposition of preexisting labile C pools over the growing season, as has sometimes been observed previously [42,43].
Soil N results suggest that IR tillage was the primary driver of N mineralization in 2016, regardless of the quantity and quality of incorporated inputs. Soil inorganic N was greater after cover crop termination relative to before termination and after crop harvest across all cover crop systems, and IR regions also had greater soil inorganic N compared to BR regions. The lack of difference between systems is interesting given the substantial difference between quantity and quality of biomass inputs. For instance, research by Hill et al. [47] found that the incorporation of a medium red clover cover crop increased soil inorganic N and dry bean yield relative to radish and cereal rye cover crops as well as bare ground. Potentially mineralizable N, measured at the post-kill time point, was greater in the fall-planted RV and RC systems, which also had far greater biomass when incorporated. These data are nearly inverse of soil inorganic N data for this time point, and show the extent to which cover crop residue were decomposed and mineralized at the time of post-kill sampling. Greater organic N in BR regions of the RV system, while not significant, further suggests that immobilization of high C/N residue in microbial biomass was likely at play [48].
4.3. Yellow Crookneck Squash Production Is Unaffected by Delayed Between-Row Cover Crop Termination
Yellow crookneck squash yields were not affected by cover crop system in either year, despite large differences in numbers and weight of fruit. Though they varied widely both within and between treatments, the two highest-yielding treatments (RV and RC in 2016) produced approximately 1.6 times the average California summer squash yield in 2019 [49]. Yields in this study also exceeded research in the same location on roller-crimped RV in a zucchini production system, which yielded between 6 and 36 Mg ha−1 [41]. Yields in OP and RC systems were much greater in 2016 than 2015 yields overall, though yields between years were not directly compared. Some of this difference may be accounted for by the more densely planted squash within rows in 2016. However, 2016 RV yields were markedly lower than in the first year, as well as OP and RC. Reasons for this are unclear, as the RV system contributed the most cover crop biomass, and soil N data suggest that IR mineralization occurred synchronously. It may be that large amounts of IR cover crop residue resulted in lower seedbed quality. In 2015, OP also had large IR biomass inputs at the time of termination and bed creation, and underperformed RV in terms of yield. Still, none of these differences were significant due to large standard errors in yield data.
5. Conclusions
The purpose of this study was to evaluate the effect of zone till-managed cover crops on the quality and quantity of cover crop contributions, soil quality, and N cycling, and organic yellow crookneck squash yield. Delaying between-row cover crop termination in 2015 improved RV cover crop biomass N content, and a clear soil inorganic N increase for both systems was evident after BR cover crop termination. Results from 2016 are more complex given the addition of the RC treatment in only this year, but show potential for medium red clover as a BR living mulch due to its continuous cover and effective N cycling, and squash yield relative to the full-width tilled (OP) production system. Farmers looking to incorporate winter annual cover crops into their vegetable rotations may receive additional N benefits from zone till management, but must have equipment to effectively handle large amounts of cover crop residues to ensure good seedbed preparation. Further work in this area should be geared toward evaluating the effect of delayed BR cover crop mowing on root contributions to N cycling for both annual and biennial/perennial species, and horizontal N transfer dynamics from mowed BR regions to crops.
Supplementary Materials
The following are available online at https://www.mdpi.com/article/10.3390/agronomy11050983/s1, Table S1: soils data, Table S2: cover crop data, Table S3: yield data, Table S4: ReadMe file.
Author Contributions
Conceptualization, P.G. and J.M.G.; methodology, P.G. and J.M.G.; software, P.G.; validation, P.G. and J.M.G.; formal analysis, P.G.; investigation, P.G. and J.M.G.; resources, J.M.G.; data curation, P.G.; writing—original draft preparation, P.G. and J.M.G.; writing—review and editing, P.G. and J.M.G.; visualization, P.G. and J.M.G.; supervision, P.G. and J.M.G.; project administration, P.G. and J.M.G.; funding acquisition, P.G. and J.M.G. All authors have read and agreed to the published version of the manuscript.
Funding
This project was funded in full by Ceres Trust and the North Central Region’s Sustainable Agriculture Research and Education graduate student grant, GNC14-187.
Institutional Review Board Statement
Not applicable.
Informed Consent Statement
Not applicable.
Data Availability Statement
Data are available within Supplementary Materials files.
Acknowledgments
We gratefully acknowledge Courtney Tchida, Thomas Warnke, Steve Ziertman, Vince Egging, David Kremer, Roger Meissner, Raskin, Elizabeth Perkus, Alexander Liebman, Michelle Dobbratz, Anne Pfeiffer, Sharon Perrone, and Vivian Wauters for their guidance and assistance. We are grateful for additional help from Maggie Reiter, Annie Doberstein, Caitlin Barnhart, Victoria Hoeppner, Elayna Shapiro, Yordanose Solomone, Lindsey Countryman, Kalei Holt, Bruna de Bacco Lopez, Victoria Hoffman, and Siwook Hwang.
Conflicts of Interest
The authors declare no conflict of interest.
References
- Wyland, L.J.; Jackson, L.E.; Chaney, W.E.; Klonsky, K.; Koike, S.T.; Kimple, B. Winter cover crops in a vegetable cropping system: Impacts on yield, nitrate leaching, pests and management costs. Agric. Ecosyst. Environ. 1996, 59, 1–17. [Google Scholar] [CrossRef]
- White, C.M.; DuPont, S.T.; Hautau, M.; Hartman, D.; Finney, D.M.; Bradley, B.; LaChance, J.C.; Kaye, J.P. Managing the trade off between nitrogen supply and retention with cover crop mixtures. Agric. Ecosyst. Environ. 2017, 237, 121–133. [Google Scholar] [CrossRef]
- Drinkwater, L.E.; Wagoner, P.; Sarrantonio, M. Legume-based cropping systems have reduced carbon and nitrogen losses. Nature 1998, 396, 262–265. [Google Scholar] [CrossRef]
- Sapkota, T.B.; Mazzoncini, M.; Bàrberi, P.; Antichi, D.; Silvestri, N. Fifteen years of no till increase soil organic matter, microbial biomass and arthropod diversity in cover crop-based arable cropping systems. Agron. Sustain. Dev. 2012, 32, 853–863. [Google Scholar] [CrossRef]
- Adetunji, A.T.; Ncube, B.; Mulidzi, R.; Lewu, F.B. Management impact and benefit of cover crops on soil quality: A review. Soil Tillage Res. 2020, 204, 104717. [Google Scholar] [CrossRef]
- Parr, M.; Grossman, J.M.; Reberg-Horton, S.C.; Brinton, C.; Crozier, C. Nitrogen Delivery from Legume Cover Crops in No-Till Organic Corn Production. Agron. J. 2011, 103, 1578–1590. [Google Scholar] [CrossRef]
- Jani, A.D.; Grossman, J.; Smyth, T.J.; Hu, S. Winter legume cover-crop root decomposition and N release dynamics under disking and roller-crimping termination approaches. Renew. Agric. Food Syst. 2016, 31, 214–229. [Google Scholar] [CrossRef]
- Perrone, S.; Grossman, J.; Liebman, A.; Sooksa-Nguan, T.; Gutknecht, J. Nitrogen fixation and productivity of winter annual legume cover crops in Upper Midwest organic cropping systems. Nutr. Cycl. Agroecosyst. 2020, 117, 61–76. [Google Scholar] [CrossRef]
- Liebman, A.M.; Grossman, J.; Brown, M.; Wells, M.S.; Reberg-Horton, S.C.; Shi, W. Legume Cover Crops and Tillage Impact Nitrogen Dynamics in Organic Corn Production. Agron. J. 2018, 110, 1046–1057. [Google Scholar] [CrossRef]
- Holmes, A.A.; Thompson, A.A.; Lovell, S.T.; Villamil, M.B.; Yannarell, A.C.; Dawson, J.O.; Wortman, S.E. Nitrogen provisioned and recycled by cover crops in monoculture and mixture across two organic farms. Nutr. Cycl. Agroecosyst. 2019, 115, 441–453. [Google Scholar] [CrossRef]
- De Notaris, C.; Olesen, J.E.; Sørensen, P.; Rasmussen, J. Input and mineralization of carbon and nitrogen in soil from legume-based cover crops. Nutr. Cycl. Agroecosyst. 2020, 116, 1–18. [Google Scholar] [CrossRef]
- Brainard, D.C.; Peachey, R.E.; Haramoto, E.R.; Luna, J.M.; Rangarajan, A. Weed Ecology and Nonchemical Management under Strip-Tillage: Implications for Northern U.S. Vegetable Cropping Systems. Weed Technol. 2013, 27, 218–230. [Google Scholar] [CrossRef]
- Williams, A.; Davis, A.S.; Ewing, P.M.; Grandy, A.S.; Kane, D.A.; Koide, R.T.; Mortensen, D.A.; Smith, R.G.; Snapp, S.S.; Spokas, K.A.; et al. Precision control of soil nitrogen cycling via soil functional zone management. Agric. Ecosyst. Environ. 2016, 231, 291–295. [Google Scholar] [CrossRef]
- Ginakes, P.; Grossman, J.; Baker, J.; Sooksa-Nguan, T. Tillage intensity influences nitrogen cycling in organic kura clover living mulch. Nutr. Cycl. Agroecosyst. 2020, 116, 71–82. [Google Scholar] [CrossRef]
- Clark, A. (Ed.) Managing Cover Crops Profitably, 3rd ed.; Sustainable Agriculture Research and Education (SARE): College Park, MD, USA, 2013; Volume 53, ISBN 9788578110796. [Google Scholar]
- Zhang, H.; Wu, H.; Yu, Q.; Wang, Z.; Wei, C.; Long, M.; Kattge, J.; Smith, M.; Han, X. Sampling Date, Leaf Age and Root Size: Implications for the Study of Plant C:N:P Stoichiometry. PLoS ONE 2013, 8, e60360. [Google Scholar] [CrossRef]
- Keene, C.L.; Curran, W.S.; Wallace, J.M.; Ryan, M.R.; Mirsky, S.B.; Vangessel, M.J.; Barbercheck, M.E. Cover Crop Termination Timing is Critical in Organic Rotational No-Till Systems. Agron. J. 2017, 109, 272–282. [Google Scholar] [CrossRef]
- Otte, B.; Mirsky, S.; Schomberg, H.; Davis, B.; Tully, K. Effect of Cover Crop Termination Timing on Pools and Fluxes of Inorganic Nitrogen in No-Till Corn. Agron. J. 2019, 111, 2832–2842. [Google Scholar] [CrossRef]
- Carr, P.M.; Cavigelli, M.A.; Darby, H.; Delate, K.; Eberly, J.O.; Gramig, G.G.; Heckman, J.R.; Mallory, E.B.; Reeve, J.R.; Silva, E.M.; et al. Nutrient Cycling in Organic Field Crops in Canada and the United States. Agron. J. 2019, 111, 2769–2785. [Google Scholar] [CrossRef]
- Drinkwater, L.E.; Cambardella, C.A.; Reeder, J.D.; Rice, C.W. Potentially Mineralizable Nitrogen as an Indicator of Biologically Active Soil Nitrogen. In Methods for Assessing Soil Quality; Doran, J.W., Jones, A.J., Eds.; Soil Science Society of America: Madison, WI, USA, 2015; pp. 217–229. [Google Scholar]
- Ros, G.H. Predicting soil N mineralization using organic matter fractions and soil properties: A re-analysis of literature data. Soil Biol. Biochem. 2012, 45, 132–135. [Google Scholar] [CrossRef]
- Bowles, T.M.; Raab, P.A.; Jackson, L.E. Root expression of nitrogen metabolism genes reflects soil nitrogen cycling in an organic agroecosystem. Plant Soil 2015, 392, 175–189. [Google Scholar] [CrossRef]
- Nevins, C.J.; Lacey, C.; Armstrong, S. The synchrony of cover crop decomposition, enzyme activity, and nitrogen availability in a corn agroecosystem in the Midwest United States. Soil Tillage Res. 2020, 197, 104518. [Google Scholar] [CrossRef]
- Islam, K.R.; Stine, M.A.; Gruver, J.B.; Samson-Liebig, S.E.; Weil, R.R. Estimating active carbon for soil quality assessment: A simplified method for laboratory and field use. Am. J. Altern. Agric. 2003, 18, 3–17. [Google Scholar] [CrossRef]
- Sawyer, J.E.; Pedersen, P.; Barker, D.W.; Diaz, D.A.R.; Albrecht, K. Intercropping Corn and Kura Clover: Response to Nitrogen Fertilization. Agron. J. 2010, 102, 568–574. [Google Scholar] [CrossRef]
- Celik, A.; Altikat, S.; Way, T.R. Strip tillage width effects on sunflower seed emergence and yield. Soil Tillage Res. 2013, 131, 20–27. [Google Scholar] [CrossRef]
- Grabber, J.H.; Jokela, W.E.; Lauer, J.G. Soil Nitrogen and Forage Yields of Corn Grown with Clover or Grass Companion Crops and Manure. Agron. J. 2014, 106, 952–961. [Google Scholar] [CrossRef]
- Dobbratz, M.; Baker, J.M.; Grossman, J.; Wells, M.S.; Ginakes, P. Rotary zone tillage improves corn establishment in a kura clover living mulch. Soil Tillage Res. 2019, 189, 229–235. [Google Scholar] [CrossRef]
- Skidmore, A.; Wilson, N.; Williams, M.; Bessin, R. Integrating Rowcovers and Strip Tillage for Pest Management in Summer Squash and Muskmelon Production. HortTechnology 2019, 29, 923–932. [Google Scholar] [CrossRef]
- Lowry, C.J.; Brainard, D.C. Strip Intercropping of Rye–Vetch Mixtures: Effects on Weed Growth and Competition in Strip-tilled Sweet Corn. Weed Sci. 2019, 67, 114–125. [Google Scholar] [CrossRef]
- Overstreet, L.F.; Hoyt, G.D.; Gentry, L. Effects of Strip Tillage and Production Inputs on Soil Biology across a Spatial Gradient. Soil Sci. Soc. Am. J. 2008, 72, 1454–1463. [Google Scholar] [CrossRef]
- Jokela, D.L. Organic No-Till and Strip-Till Systems for Broccoli and Pepper Production; Iowa State University: Ames, IA, USA, 2016. [Google Scholar]
- Delate, K.; Cambardella, C.; McKern, A. Effects of Organic Fertilization and Cover Crops on an Organic Pepper System. HortTechnology 2008, 18, 215–226. [Google Scholar] [CrossRef]
- Robertson, G.P.; Sollins, P.; Ellis, B.G.; Lajtha, K. Exchangeable Ions, pH, and Cation Exchange Capacity. In Standard Soil Methods for Long-Term Ecological Research; Robertson, G.P., Coleman, D.C., Bledsoe, C.S., Sollins, P., Eds.; Oxford University Press: Oxford, UK, 1999; pp. 106–114. [Google Scholar]
- R Core Team. R: A Language and Environment for Statistical Computing; R Core Team: Vienna, Austria, 2020; Available online: https://www.R-project.org/ (accessed on 2 May 2021).
- Kassambara, A. Rstatix: Pipe-Friendly Framework for Basic Statistical Tests. R Package Version 0.6.0. 2020. Available online: https://CRAN.R-project.org/package=rstatix (accessed on 2 May 2021).
- Mair, P.; Wilcox, R. Robust statistical methods in R using the WRS2 package. Behav. Res. Methods 2019, 52, 464–488. [Google Scholar] [CrossRef]
- Noguchi, K.; Gel, Y.R.; Brunner, E.; Konietschke, F. nparLD: AnRSoftware Package for the Nonparametric Analysis of Longitudinal Data in Factorial Experiments. J. Stat. Softw. 2012, 50, 1–23. [Google Scholar] [CrossRef]
- Konietschke, F.; Placzek, M.; Schaarschmidt, F.; Hothorn, L.A. nparcomp: An R Software Package for Nonparametric Multiple Comparisons and Simultaneous Confidence Intervals. J. Stat. Softw. 2015, 64. [Google Scholar] [CrossRef]
- Cicek, H.; Martens, J.R.T.; Bamford, K.C.; Entz, M.H. Effects of grazing two green manure crop types in organic farming systems: N supply and productivity of following grain crops. Agric. Ecosyst. Environ. 2014, 190, 27–36. [Google Scholar] [CrossRef]
- Leavitt, M.J.; Sheaffer, C.C.; Wyse, D.L.; Allan, D.L. Rolled Winter Rye and Hairy Vetch Cover Crops Lower Weed Density but Reduce Vegetable Yields in No-tillage Organic Production. HortScience 2011, 46, 387–395. [Google Scholar] [CrossRef]
- Ginakes, P.; Grossman, J.M.; Baker, J.M.; Sooksa-Nguan, T. Living Mulch Management Spatially Localizes Nutrient Cycling in Organic Corn Production. Agriculture 2020, 10, 243. [Google Scholar] [CrossRef]
- Ginakes, P.; Grossman, J.M.; Baker, J.M.; Dobbratz, M.; Sooksa-Nguan, T. Soil carbon and nitrogen dynamics under zone tillage of varying intensities in a kura clover living mulch system. Soil Tillage Res. 2018, 184, 310–316. [Google Scholar] [CrossRef]
- Lewis, D.B.; Kaye, J.P.; Jabbour, R.; Barbercheck, M.E. Labile carbon and other soil quality indicators in two tillage systems during transition to organic agriculture. Renew. Agric. Food Syst. 2011, 26, 342–353. [Google Scholar] [CrossRef]
- Hurisso, T.T.; Culman, S.W.; Horwath, W.R.; Wade, J.; Cass, D.; Beniston, J.W.; Bowles, T.M.; Grandy, A.S.; Franzluebbers, A.J.; Schipanski, M.E.; et al. Comparison of Permanganate-Oxidizable Carbon and Mineralizable Carbon for Assessment of Organic Matter Stabilization and Mineralization. Soil Sci. Soc. Am. J. 2016, 80, 1352–1364. [Google Scholar] [CrossRef]
- Diederich, K.M.; Ruark, M.D.; Krishnan, K.; Arriaga, F.J.; Silva, E.M. Increasing Labile Soil Carbon and Nitrogen Fractions Require a Change in System, Rather Than Practice. Soil Sci. Soc. Am. J. 2019, 83, 1733–1745. [Google Scholar] [CrossRef]
- Hill, E.C.; Renner, K.A.; Sprague, C.L. Cover Crop Impact on Nitrogen Availability and Dry Bean in an Organic System. Agron. J. 2016, 108, 329–341. [Google Scholar] [CrossRef]
- McSwiney, C.P.; Snapp, S.S.; Gentry, L.E. Use of N immobilization to tighten the N cycle in conventional agroecosystems. Ecol. Appl. 2010, 20, 648–662. [Google Scholar] [CrossRef] [PubMed]
- California Department of Food and Agriculture. Annual California Agricultural Commissioners’ Report; California Department of Food and Agriculture: Sacramento, CA, USA, 2019.


Publisher’s Note: MDPI stays neutral with regard to jurisdictional claims in published maps and institutional affiliations. |
© 2021 by the authors. Licensee MDPI, Basel, Switzerland. This article is an open access article distributed under the terms and conditions of the Creative Commons Attribution (CC BY) license (https://creativecommons.org/licenses/by/4.0/).