1. Introduction
Water availability for the roots of irrigated agricultural crops (IACs) is a limiting factor in water management. Accordingly, the concepts used in water management play a crucial role in determining the efficiency of irrigation in the agriculture sector, which represents the largest consumer of freshwater resources in the word [
1].
When IACs are subject to a deficit of soil water stored in the root zone, they exhibit signals characteristic of specific water stress, which should be taken into account in water management. The assessment of crop water stress (CWS) is a very important factor, which directly affects the quality and yield of IACs. In this regard, efficient water use for irrigation should be based on objective information about CWS, which can improve actual irrigation practices and play a crucial role in agricultural crop management with regard to regional and local trends of climate change.
In reality, water storage in the soil root zone may lead to a high temporal and spatial variability of CWS. This spatial variability of CWS in IACs represents a limiting factor in irrigation water use efficiency (IWUE). In this regard, some technologies have been introduced for dealing with variable rate irrigation (VRI) [
2]. VRI is aimed at improving center pivot irrigation management by applying water doses in a nonuniform, spatially distributed manner according to delineated irrigated field zones [
3]. However, irrigation machines implementing VRI are not widespread and there is room for improvement in their efficiency in the near future, along with progress in irrigated field delineation linked to crop water requirements.
One of the most widely used techniques for uniform irrigation is based on soil water status control. However, new methods are needed that take into account the average CWS within an irrigated field. Even short-term CWS can affect crop growth processes by increasing crop surface temperature and by reducing plant transpiration and photosynthesis, thereby decreasing bioproductivity. Accordingly, management practices commonly involve leaving irrigation running to ensure that the plants in the driest zones receive enough water to prevent the development of water stress.
In an attempt to optimize uniform irrigation scheduling, deficit irrigation was proposed to decrease inefficient water loss and increase IWUE [
4]. This approach enables controlling stomatal conductance, thereby reducing plant water loss [
5]. To support this technology, there is much interest in using proximal and remote sensing to assess CWS, and in using the data to manage irrigation schedules. In this case, the crop is used as an indicator of water requirement.
In practice, uniform irrigation treatments are based on point-based measured soil water depletions and a next calculation of prescribed water depth from a simple water balance model [
6]. This method has provided positive results for studies on small experimental plots [
7]. However, in the case of operational management in the field, it becomes quite obscure and inefficient [
8]. Therefore, it is necessary to develop more advanced techniques to better estimate average crop water requirements on the basis of assessing CWS.
As an alternative to ground-based methods of determining soil water status, methods using plant-based responses to water deficit in the soil root zone have provided a new paradigm for more optimal irrigation water operational management in uniformly irrigated crops [
9].
A number of indirect approaches are widely used to assess CWS through the use of proximal and remote sensing methods based on crop temperature measurements [
10]. The corresponding data are obtained using the thermal channels of multispectral cameras installed on drones and/or satellites.
Combinations of ground-based and remote sensing technologies for agrohydrological modeling provide a good opportunity to establish regulated deficit irrigation and, thus, implement appropriate irrigation management strategies [
11,
12,
13,
14]. These technologies are based on the agrohydrological modeling of irrigated agricultural crop growth [
15]. Using this approach, it is possible to enable water storage in the root zone within a specific irrigated field in accordance with the chosen strategy of irrigation, which allows achieving the planned yield of agricultural crops regardless of the weather conditions. This has become possible due to the assimilation of digital data, such as (a) hydrometeorological monitoring and forecast, (b) remote sensing of parameters near the ground atmospheric layer and the underlying surface, and (c) the development of irrigation agrocenoses within computer systems created for modeling and managing growth, thereby enabling the subsequent application of digital data for automatic irrigation technology.
Studies of irrigated crop water requirements based on agrohydrological modeling have typically been grounded in the use of physical and mathematical models of the vertical water and heat exchange in underlying soil and plant cover with the atmosphere [
16,
17,
18,
19].
The assimilation of remote sensing data is essential for determining the surface occupied by irrigated agricultural crops. Application of these data enables detailed estimations of water and heat regimes, thus significantly increasing their accuracy [
20]. As a result, vegetation parameters of IAC growth and development can be approximated and water use and biomass productivity [
21]. Lastly, the assimilation of remote sensing data for irrigated agricultural crops significantly increases the quality, efficiency, and reliability of models for diagnostic and prognostic purposes. This can be confirmed through verification and adaptation of the modeling results for water requirement, evapotranspiration (ET), and soil water storage in the root zone using the developed method based on an estimation of the dynamics of the coefficient of crop water stress. The objectiveness of remotely sensed data is a decisive factor for the successful practical use of novel approaches to irrigation management [
16,
17,
20,
21].
Several studies have modeled the relationship between the evapotranspiration of irrigated agricultural crops and their total aboveground dry matter production [
22,
23,
24,
25,
26]. On the other hand, to assess whether a lack of soil water content in the root zone would lead to a decrease in crop evaporation and, accordingly, reduce yield, the use of crop water stress was proposed [
27]. This concept has been implemented in a number of studies related to inadequate irrigation applications or shortages in water supply [
28,
29,
30], and deficit irrigation [
31,
32,
33,
34].
The above studies were mainly carried out on relatively small experimental plots of crops located in the controlled conditions. It remains to be seen whether these results can be translated to irrigated crops at an industrial level, and those in different environments in terms of intercrop distance and local agrometeorological and agrohydrological characteristics.
The objective of this study was to compare the functional outcomes of computer-assisted hydrological modeling of crop water stress characteristics with experimental ground-based data of their yields. Within this objective, two research hypotheses were defined. The first states that regional and local patterns of water stress characteristics exist. The second states that there is a relationship between the water stress characteristics of crops and their yield. To validate these hypotheses, a field trial was carried out on 19 irrigated alfalfa crops at three study sites situated in the Saratovskoe Zavolzhie region of Russia, and an agrohydrological model was developed on the basis of the surface energy balance system (SEBS) [
35]. This system has been successfully applied for estimating the evapotranspiration of grass and alfalfa crop cover using satellite earth observation data in the visible, near-infrared, and thermal infrared frequency range, in combination with meteorological data [
36].
2. Materials and Methods
2.1. Study Area
The Saratovskoe Zavolzhie region (Saratov Oblast, Russia) is one of the largest agricultural producers in the southeastern zone of the Russian Federation. It is located between the left bank of the Volga River to the west and the border with Kazakhstan to the east. This territory is considered risky for agriculture due to quite frequent summer droughts. The climate in this region is continental arid with cold winters and hot summers. The duration of the frost-free period is approximately 150–160 days per year. The sum of active temperatures is 2600–2800 °C, which allows the cultivation of a wide range of agricultural crops. The average annual precipitation in this area is approximately 350–450 mm, the majority of which occurs during winter and spring [
37].
The geological structure of the Saratovskoe Zavolzhie territory is represented by diluvia loamy sediments. The flood plain of the Volga River is composed of sediments of diluvia alluvial formations, including fine-grained and medium-grained rocks with octal shingles and sands. The typical soil cover mostly consists of dark-chestnut soils. Groundwater mostly lies at a depth below 10 m, although, in some irrigated areas, it occurs at depths of 2–3 m. At a number of sites, a rise in groundwater due to leakage from irrigation canals and irrigated fields can be observed, leading to salinization and bogging. Therefore, the irrigation of agricultural crops in these sites was considered ineffective due to low yield, resulting in these fields being withdrawn from agricultural use [
38].
Agricultural practices in Saratovskoe Zavolzhie are carried out under arid conditions, and this factor determines the volume and stability of agricultural crop production. According to the research institutions of the Volga region, from 1894 to 2018 (i.e., 123 years), only 20 years (18%) were considered ideal, whereas 51 years (41%) were considered moderate, and 52 years (42%) were considered arid and extremely arid. Consequently, agricultural practices are carried out under conditions where almost every third year is arid, along with every fifth year producing a low yield. To address the soil water deficit, various large irrigation systems were built in the Saratovskoe Zavolzhie region in the 1970s. Recently, irrigated agriculture has been performed in the preserved and restored areas featuring these irrigation systems. In the last quarter of the 20th century, irrigation systems with a total area of approximately 5 × 10
6 ha were built and put into operation with the use of pivot irrigation engines. In the period from 1990 to 2010, due to economic and organizational problems, the area of irrigated land gradually decreased and eventually reached the level of about 1 × 10
6 ha. Subsequently, with the adoption of measures for state-supported irrigation, this area has increased to approximately 2 × 10
6 ha [
39].
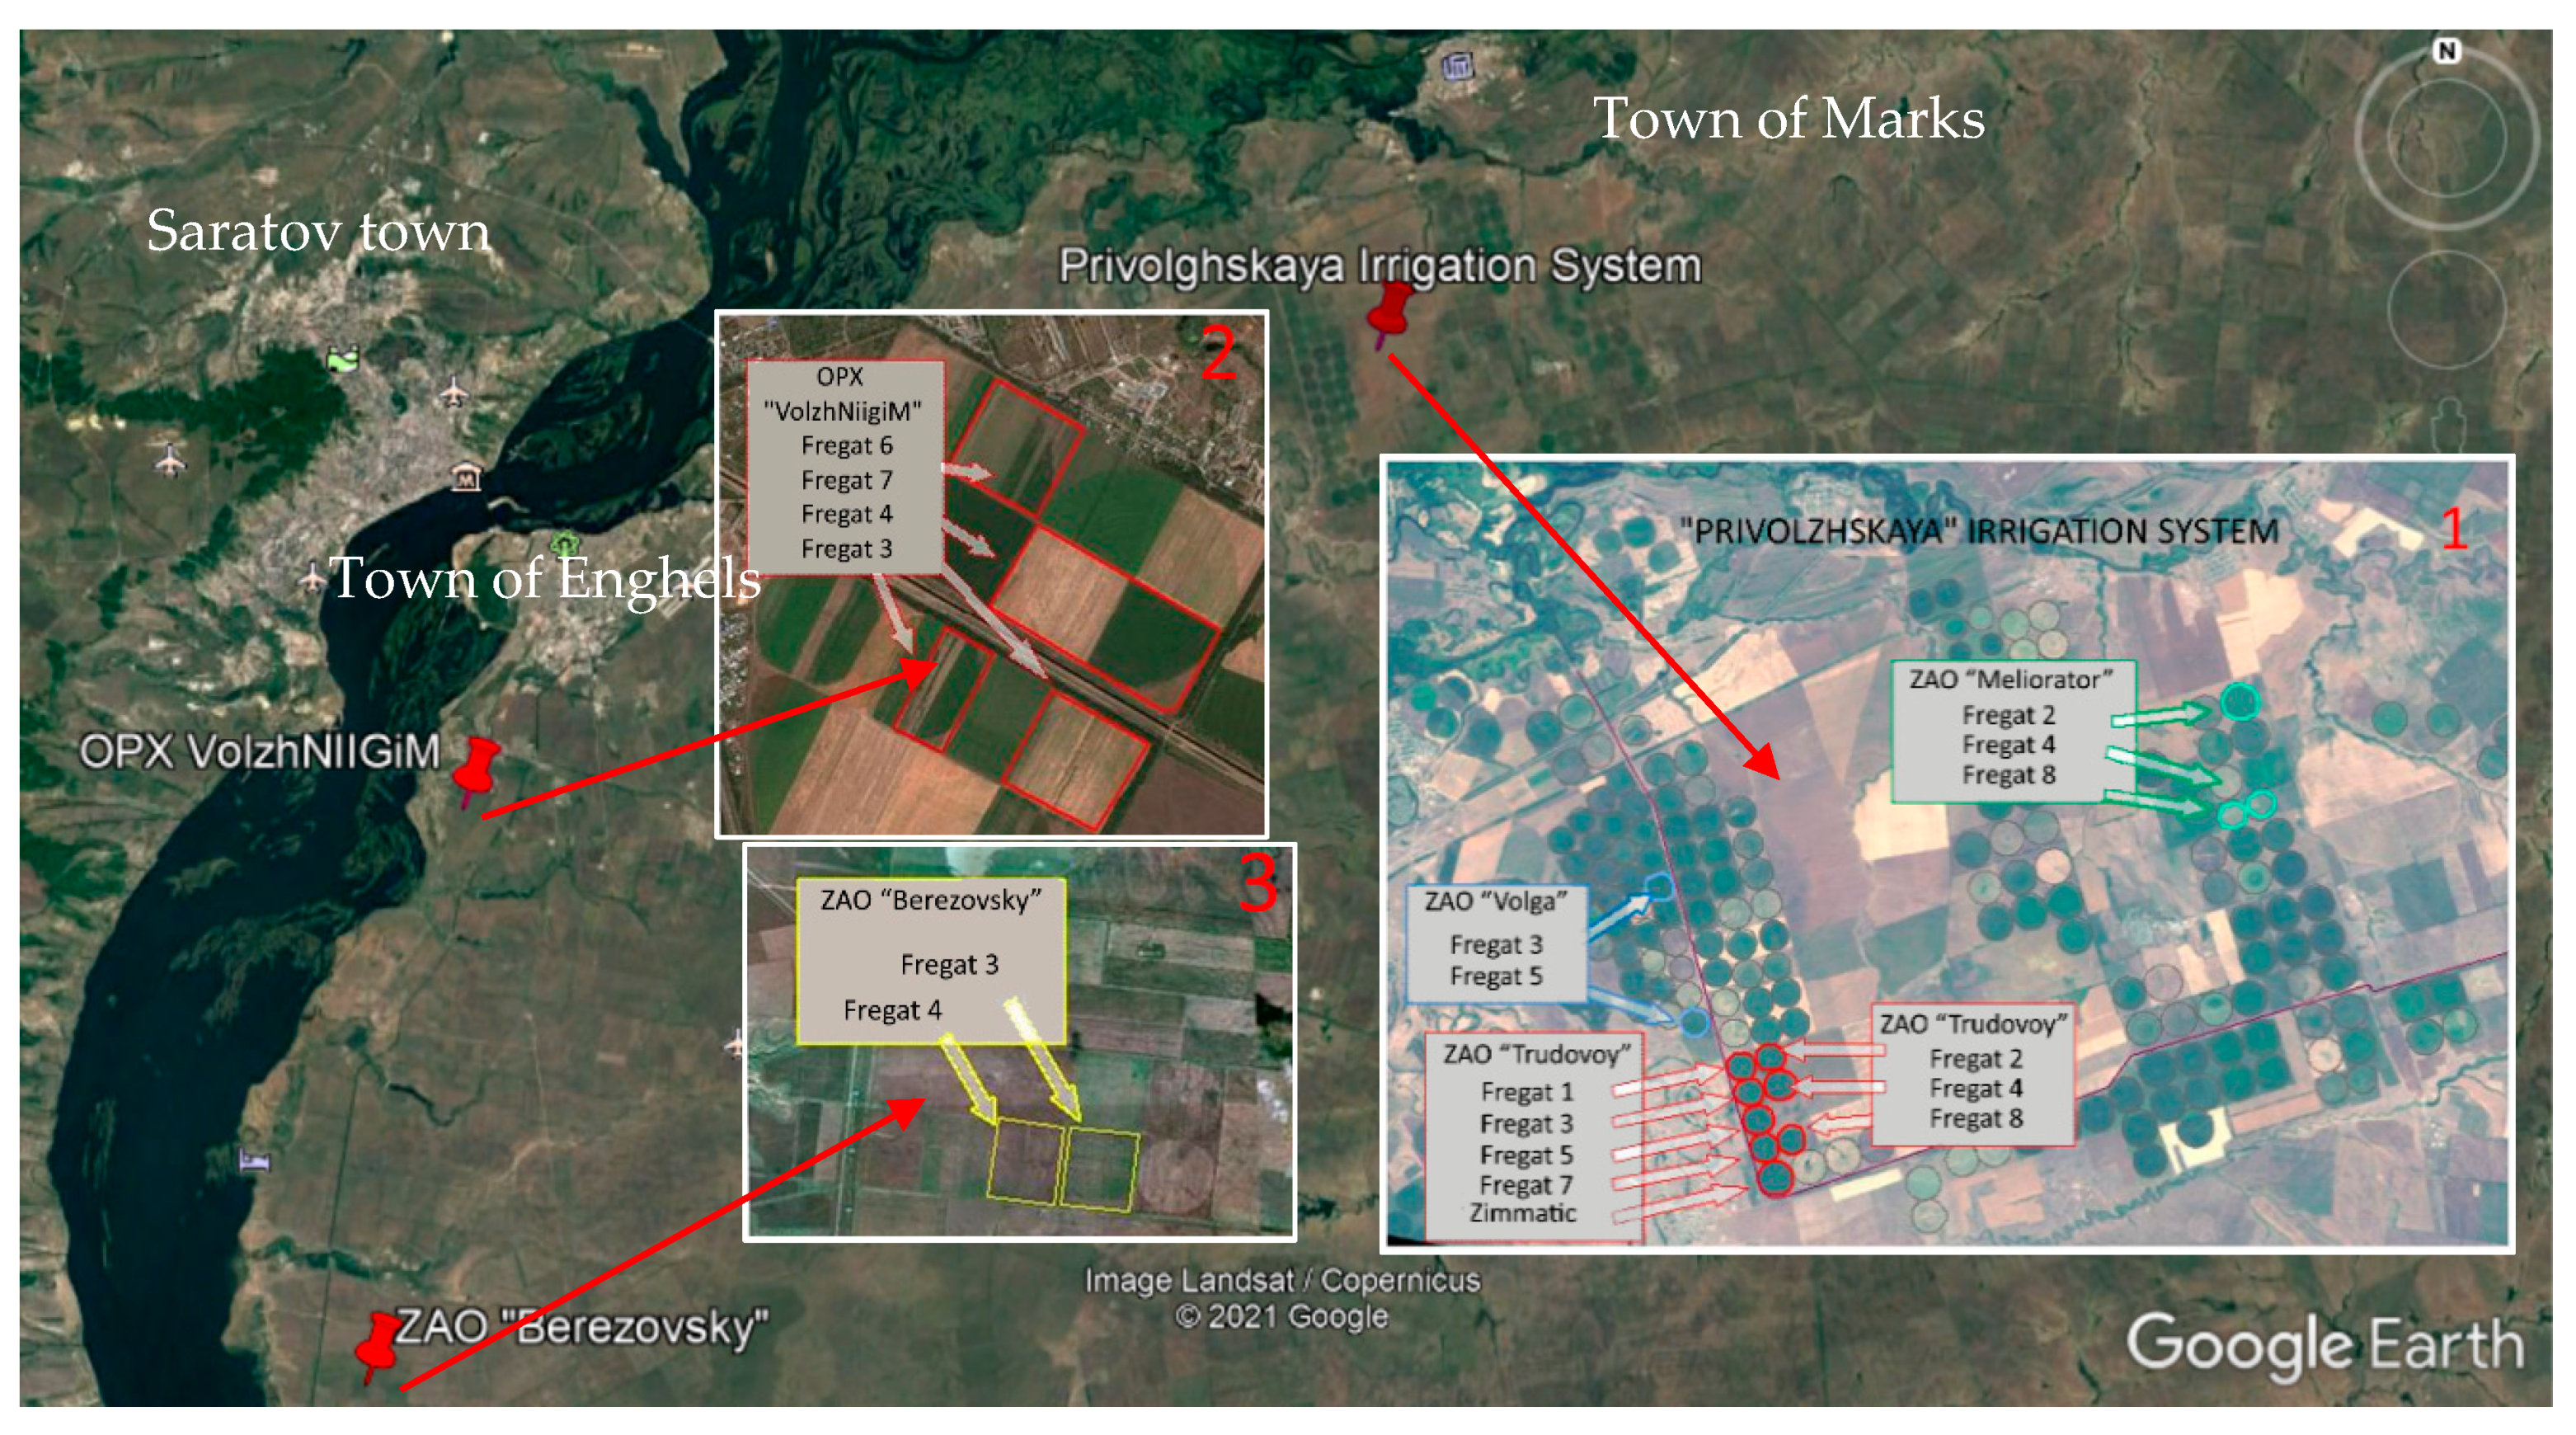
The present study in the Saratovskoe Zavolzhie region was conducted during the 2012 growing season at three study sites with commercial irrigated crops (
Figure 1) with different practices of irrigation management. The first site (51.593396° N, 46.781312° E, 35 m above sea level (a.s.l.)) was located in the territory of the Privolgskaya Irrigation System (PIS) with monitored crops belonging to the agrofirms: ZAO “Volga”; ZAO “Trudovoy”; ZAO “Meliorator”. The second (51.380984° N, 46.056592° E, 46 m a.s.l.) was located approximately 50 km southwest of the first site with monitored crops belonging to the All Russia Research Institute on Hydraulic Engineering and Land Reclamation (VolzhNIIGiM). The third (51.139359° N, 45.994144° E, 51 m a.s.l.) was located approximately 30 m south of the second site with monitored crops belonging to the agrofirm ZAO “Berezovsky”. The selection of these study sites was associated with their locations in the north, center, and south of the Saratovskoe Zavolzhie territory.
In the framework of this study, 19 alfalfa crops in their second year of growth were selected at the three indicated study sites, where irrigation was carried out using Fregat and Zimmatic pivots, with water transported from the Volga River. At all three locations, crop management was identical in terms of irrigation and harvesting.
At the first study site in the territory of the PIS, the selected alfalfa crops belonged to three agricultural firms: (1) agrofirm ZAO “Volga” (two irrigated alfalfa crops covering an area of approximately 120 ha); (2) agrofirm ZAO “Trudovoy” (eight irrigated alfalfa crops covering an area of approximately 330 ha); (3) agrofirm ZAO “Meliorator” (three irrigated alfalfa crops covering an area of approximately 110 ha). Water for the corresponding pivots was pumped from the main canal of the first stage of the PIS. At the second study site (VolzhNIIGiM), four irrigated alfalfa crops were selected, covering an area of approximately 90 ha. Water for the corresponding pivots was pumped from the main canal of the Saratovskaya Irrigation System. At the third study site (ZAO “Berezovsky”), the two irrigated alfalfa crops were selected, covering an area of approximately 140 ha. Water for the corresponding pivots was pumped directly from the Volga River.
The reported studies were carried out from late May to late August of 2012. In the territory of Saratovskoe Zavolzhie, this time interval typically corresponds to the period of irrigation for agricultural crops. In 2012, 3–4 applications of irrigation water were conducted for all 19 studied alfalfa crops, with an amount ranging from 40 to 50 mm for each application.
The assessment of biological productivity of the irrigated alfalfa crops was based on the average values of yield of organic carbon obtained for each of the three harvests. For this purpose, the values of collected biomass were determined for each of the 19 studied alfalfa crops. The average values of organic carbon yield for all three harvests were obtained for all 19 studied alfalfa crops as a result of laboratory research and processing of the collected field samples.
2.2. Methodological Background
A method was developed to assess the impact of applied scheduling of uniform irrigation on cumulative crop water stress in alfalfa. In this case, daily water stress was estimated as a function of its coefficient K
w [
40], expressed as
where ET
a is the actual daily evapotranspiration and ET
c is the potential daily evapotranspiration under conditions of optimal water content in the root zone.
Under conditions of optimal water use, the value of ET
c depends on the weather conditions, growing development phase, and a number of other factors that can lead to a decrease in the total ET [
40]. In the absence of these factors (e.g., salinity stress), thus diminishing the total ET, the following equation is used [
15]:
where K
c is the empirical coefficient of the crop water requirement that takes into account the type of crop, and the vegetative stage of its development, and ET
0 is the reference daily ET from the surface of the grass cover, which has optimal soil moisture in its root zone.
Equation (2) describes the relationship between ET
c and ET
0 in a simple and convenient way for practical use [
40]. It has allowed the assessment of water stress in agricultural crops, and the assessment of their current [
41] and future [
42] water requirements.
The convenience of the equations (Equations (1) and (2)) for analyses lies in the possibility of their use for the same crop, grown under different weather conditions, with different irrigation tactics, and with different dates of crop growth development.
2.3. Method Description
In the first step, the output daily series of etalon evapotranspiration {ET
0}
t was calculated using the Penman–Monteith standardized reference evapotranspiration equation for grass [
43]. For this purpose, standard hydrometeorological measurement data (temperature and moisture of air, atmospheric pressure, and wind speed) for the time period of May–August 2012 were used for all three study sites. The data from a weather monitoring station near the town of Marks was used to calculate the daily {ET
0}
t time series for all alfalfa crops located at the first study site (PIS). Data from another weather monitoring station near the town of Enghels were used to calculate the same time series for all alfalfa crops located at the second and third study sites. A comparison of the daily {ET
0}
t time series calculated from the data of both meteorological stations showed the presence of slight discrepancies in air temperature, wind speed, and air humidity on a number of days. Both time series were combined as input data for the daily {ET
0}
t time series for all 19 alfalfa crops [
1,
2]. In the second step, daily {ET
c}
t time series, based on the FAO-56 method [
40], were calculated according to Equation (2). For this purpose, information from the conducted field phenological growth stage observations were used in the form of empirical coefficients describing the water requirement for the vegetative growth phases of the alfalfa crops [
40]. These results were also combined as the input time series of the daily {ET
c}
t values. Additional time series of air temperature {T
air}
t, wind speed, air humidity, and rainfall {Pl}
t were created using the meteorological datasets from the two abovementioned weather stations. Time series of irrigation water depth application {Ir}
t were created using data from irrigation water control.
The SEBS model [
35,
36] was used in the third step to generate a daily time series of {ET
a}
t. This was done using a previously developed technique [
44] based on a combination of meteorological and remotely sensed parameters. For this purpose, time series of crop cover temperature {T
c}
t and leaf area index {LAI}
t were developed for the areas of each irrigated alfalfa crop. For this purpose, MODIS spectroradiometer data were used. In the final stage, a daily time series of {K
w}
t was calculated by applying Equation (1) to each of the 19 alfalfa crops.
3. Results
3.1. Overall Results
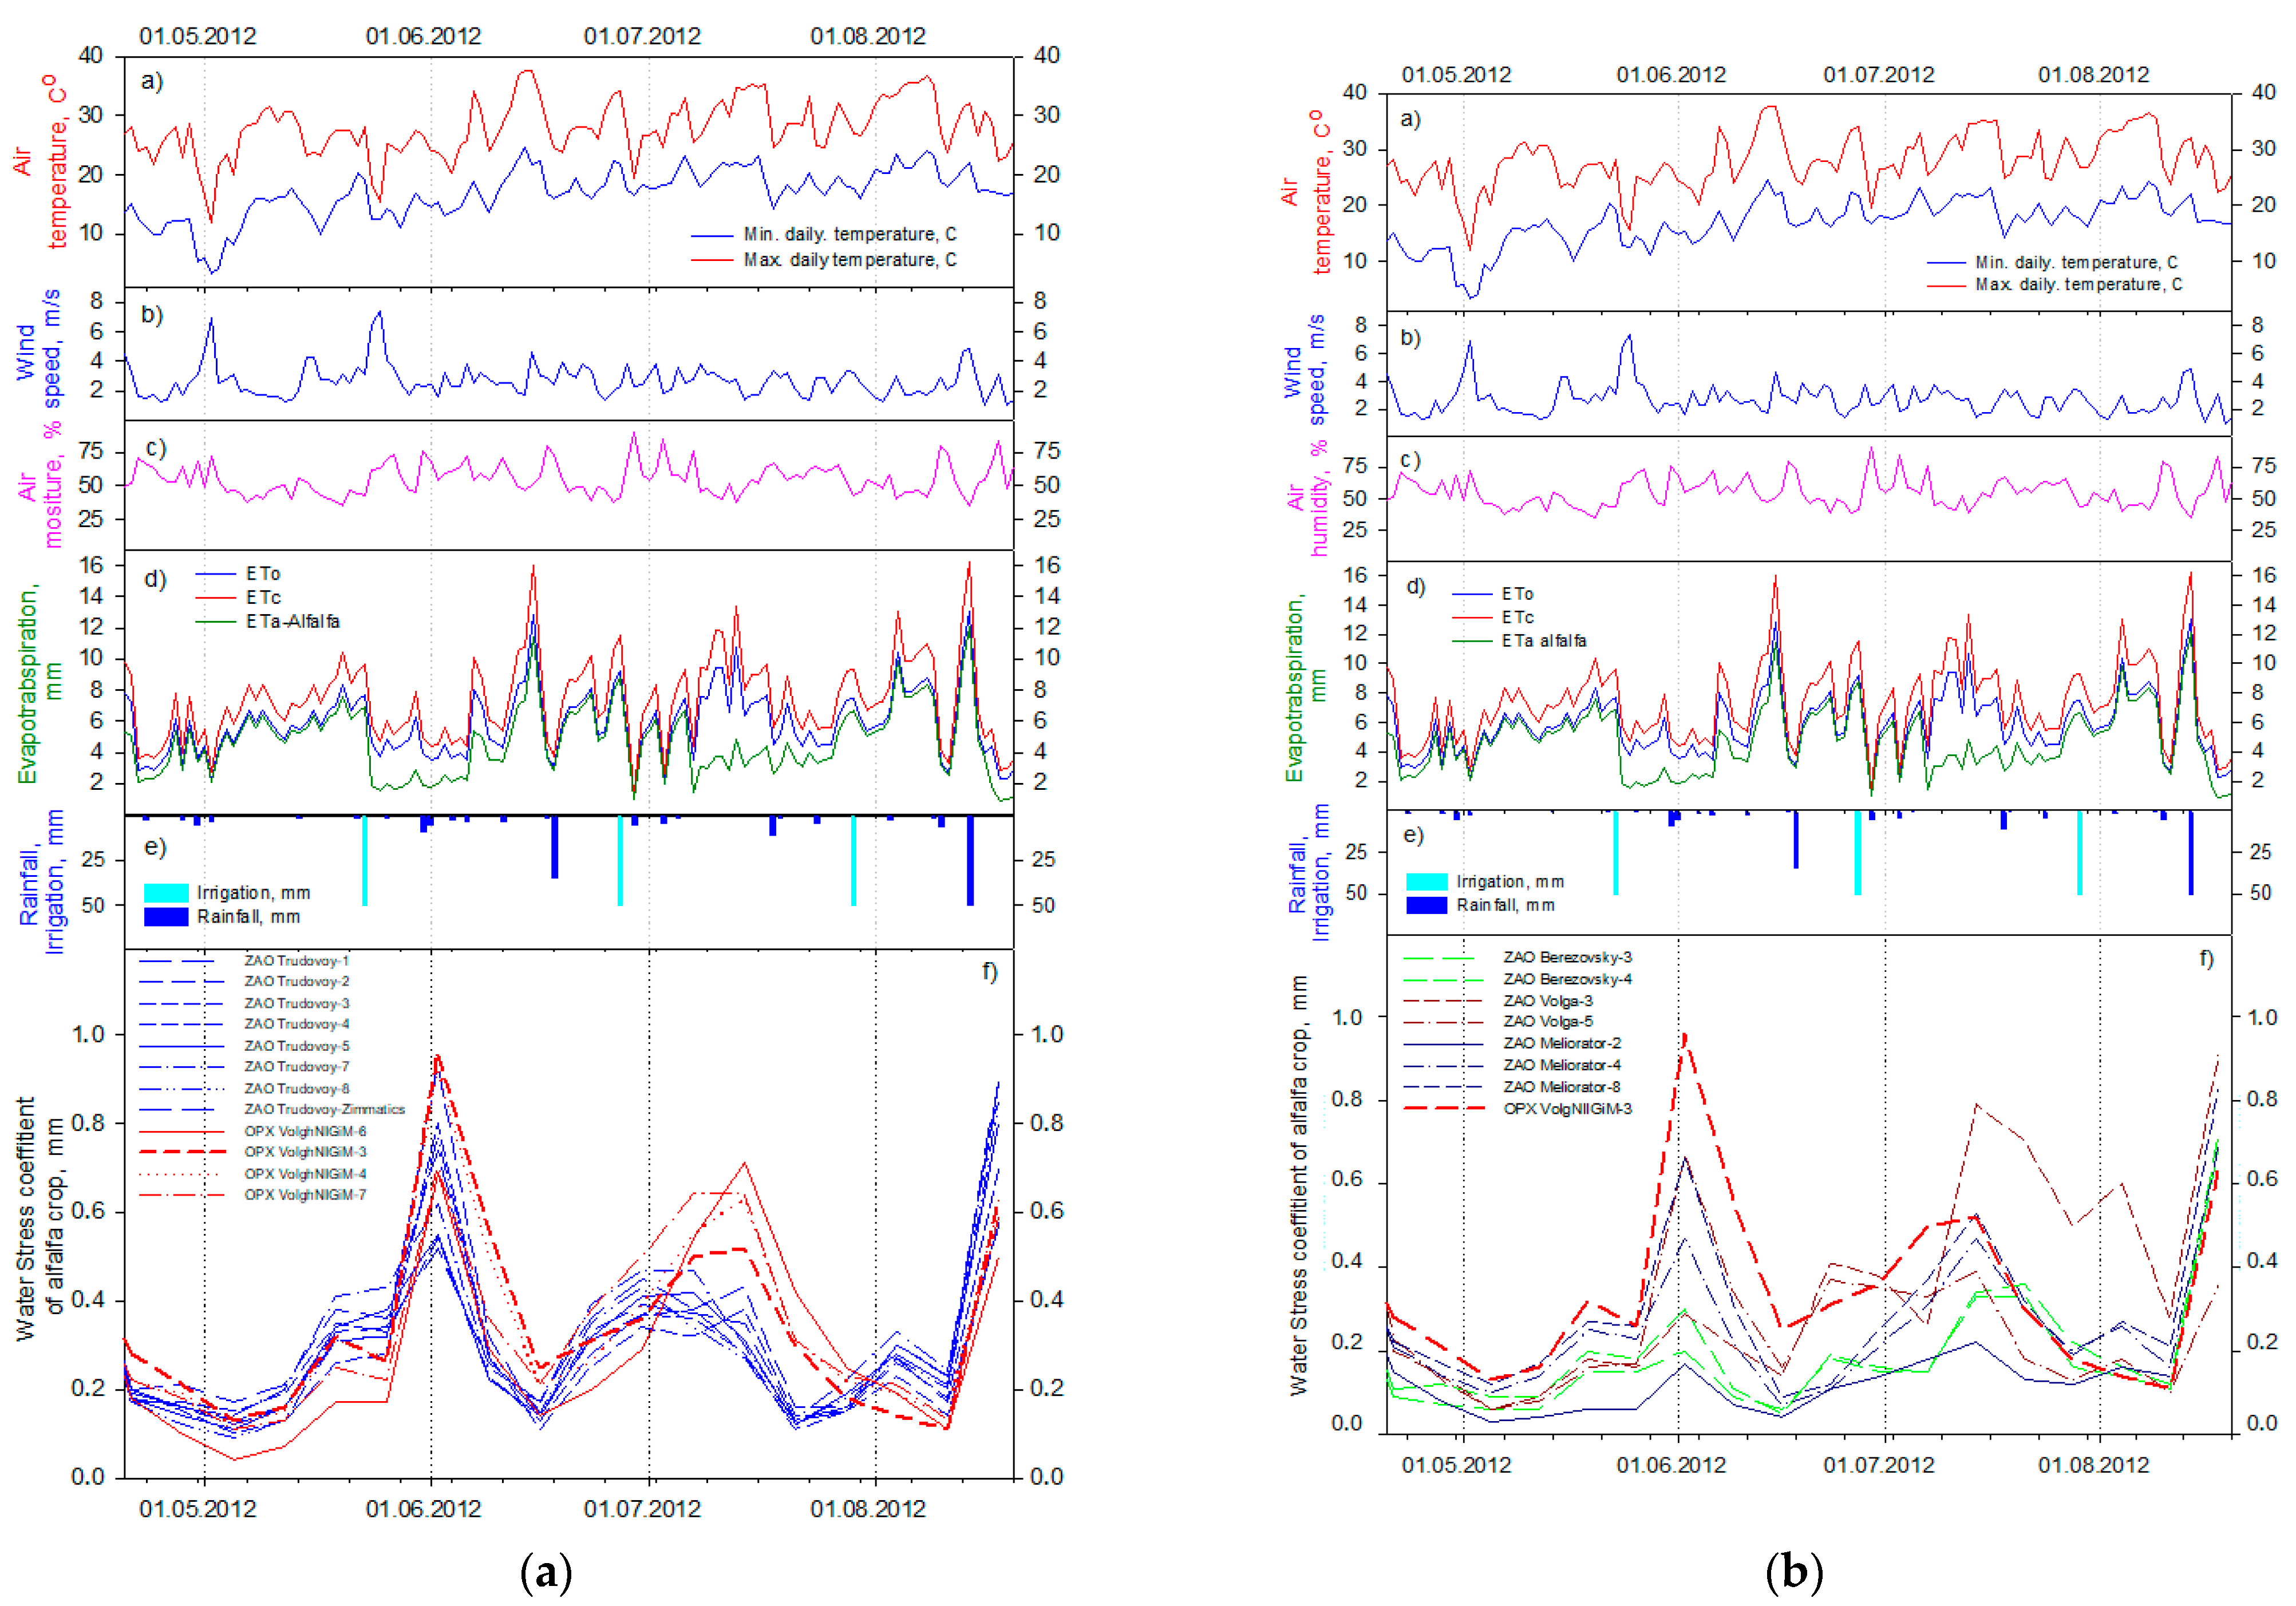
Figure 2 presents a graphical synchronized mosaic view of the time series of air temperature, wind speed, rainfall, air humidity, rainfall, and applied water depth, and the calculated time series of {ET
a}
t, {ET
c}
t, {ET
0}
t, and {K
w}
t during the period from 20 April to 20 August 2012
. In view of the large number of studied alfalfa crops, the graphical presentation of the modeling results was divided into two parts. The first describes the results obtained for irrigated alfalfa crops at the first (PSI) and second (VolzhNIIGiM) study sites. The second describes the results obtained for irrigated alfalfa crops at the third (ZAO “Berezovsky”) and second (VolzhNIIGiM) study sites. Including data from the second study site (shown as red lines) in both parts enabled a visual comparison of all data obtained for the 19 studied crops.
Volga”, ZAO “Meliorator”, ZAO “Berezovsky”, and OPX VolzhNiigiM. All time series presented in
Figure 2 show the synchronized dynamics of measured and calculated parameters during the study time period. In general, a fairly stable pattern of weather conditions was found at the three study sites. This is particularly represented by the almost synchronous manifestation of growth phases for all studied alfalfa crops, and their three consecutive harvests with subsequent irrigation events. The first harvest was conducted during the first 10 days of June, the second was conducted during the first 10 days of July, and the third was conducted in mid-August.
An overall analysis of the time series presented in
Figure 2 revealed that, in general, the water stress dynamics in alfalfa crops during the irrigation period of 2012 were quite similar. However, a deeper analysis revealed quite significant differences in the dynamics of {K
w}
t, not only between study sites, but also within the same study site.
3.2. Testing the First Hypothesis
First, it was of interest to compare the dynamics of {Kw}t at the first study site (PIS). The main differences in the corresponding time series mainly occurred in the periods before and after the first irrigation event. This may have been due to the reaction of crops to varying levels of water stress, resulting from differences in the soil moisture content of the root zone after snowmelt. It is also interesting to note that these differences remained until the second harvest.
In many respects, a similar pattern of behavior could be identified for the crops of ZAO “Trudovoy”, which were located almost side by side. These crops belonged to the same agrofirm and were thus subjected to similar management. Accordingly, the identified differences largely occurred as a function of distance from the nearby water transport canal, the filtration from which impacts the corresponding depth of groundwater and the root zone of affected crops.
A comparison of {Kw}t for crops at the first and second study sites showed high similarity in the periods before and after the first irrigation event, and significant differences in the period before and after the second irrigation event. This was undoubtedly due to the reduced water depth supplied during the second irrigation event for crops of ZAO “Trudovoy”, which was carried out after a previous rain event.
This may have been due to an incorrect decision according to the level of rainfall (48 mm) recorded by the weather station in the town of Marks. However, according to local residents, during summer, the precipitation recorded by this weather station often falls in the zone bordering the left bank of the Volga River and does not affect the territories located outside of it.
The analysis of {Kw}t dynamics was particularly interesting for crops belonging to ZAO “Volga” located to the north along the canal. The dynamics of these graphs and the calculated values of Kw were generally similar to those obtained for ZAO “Trudovoy”. Furthermore, it is also interesting to note the higher bursts recorded for ZAO “Volga” than for ZAO “Trudovoy” following the precipitation that occurred slightly before the second irrigation event. This may have been due to the varying level of rainfall at both sites as a function of their different distances from the left bank of the Volga River.
The last set of analyzed {K
w}
t results (
Figure 2b) corresponded to the farms ZAO “Meliorator” and ZAO “Berezovskoe”. The dynamics of K
w for alfalfa crops of ZAO “Meliorator” generally corresponded to those obtained for ZAO “Trudovoy” with the exclusion of ZAO Meliorator-2. Despite its similar dynamic, the K
w values were significantly lower and, thus, more similar to the results obtained for ZAO “Berezovskoe”.
The {Kw}t dynamics at the third study site as a whole corresponded to those of other sites; however, the values were significantly lower. This may have been associated with the noted problems of the irrigation water use efficiency. In the field observations carried out during an irrigation event, the formation of runoff and preferential flow of irrigation water were noted. This could have led to a significantly lower soil water content in the root zone, which would not have mitigated the high level of water stress.
3.3. Testing the Second Hypothesis
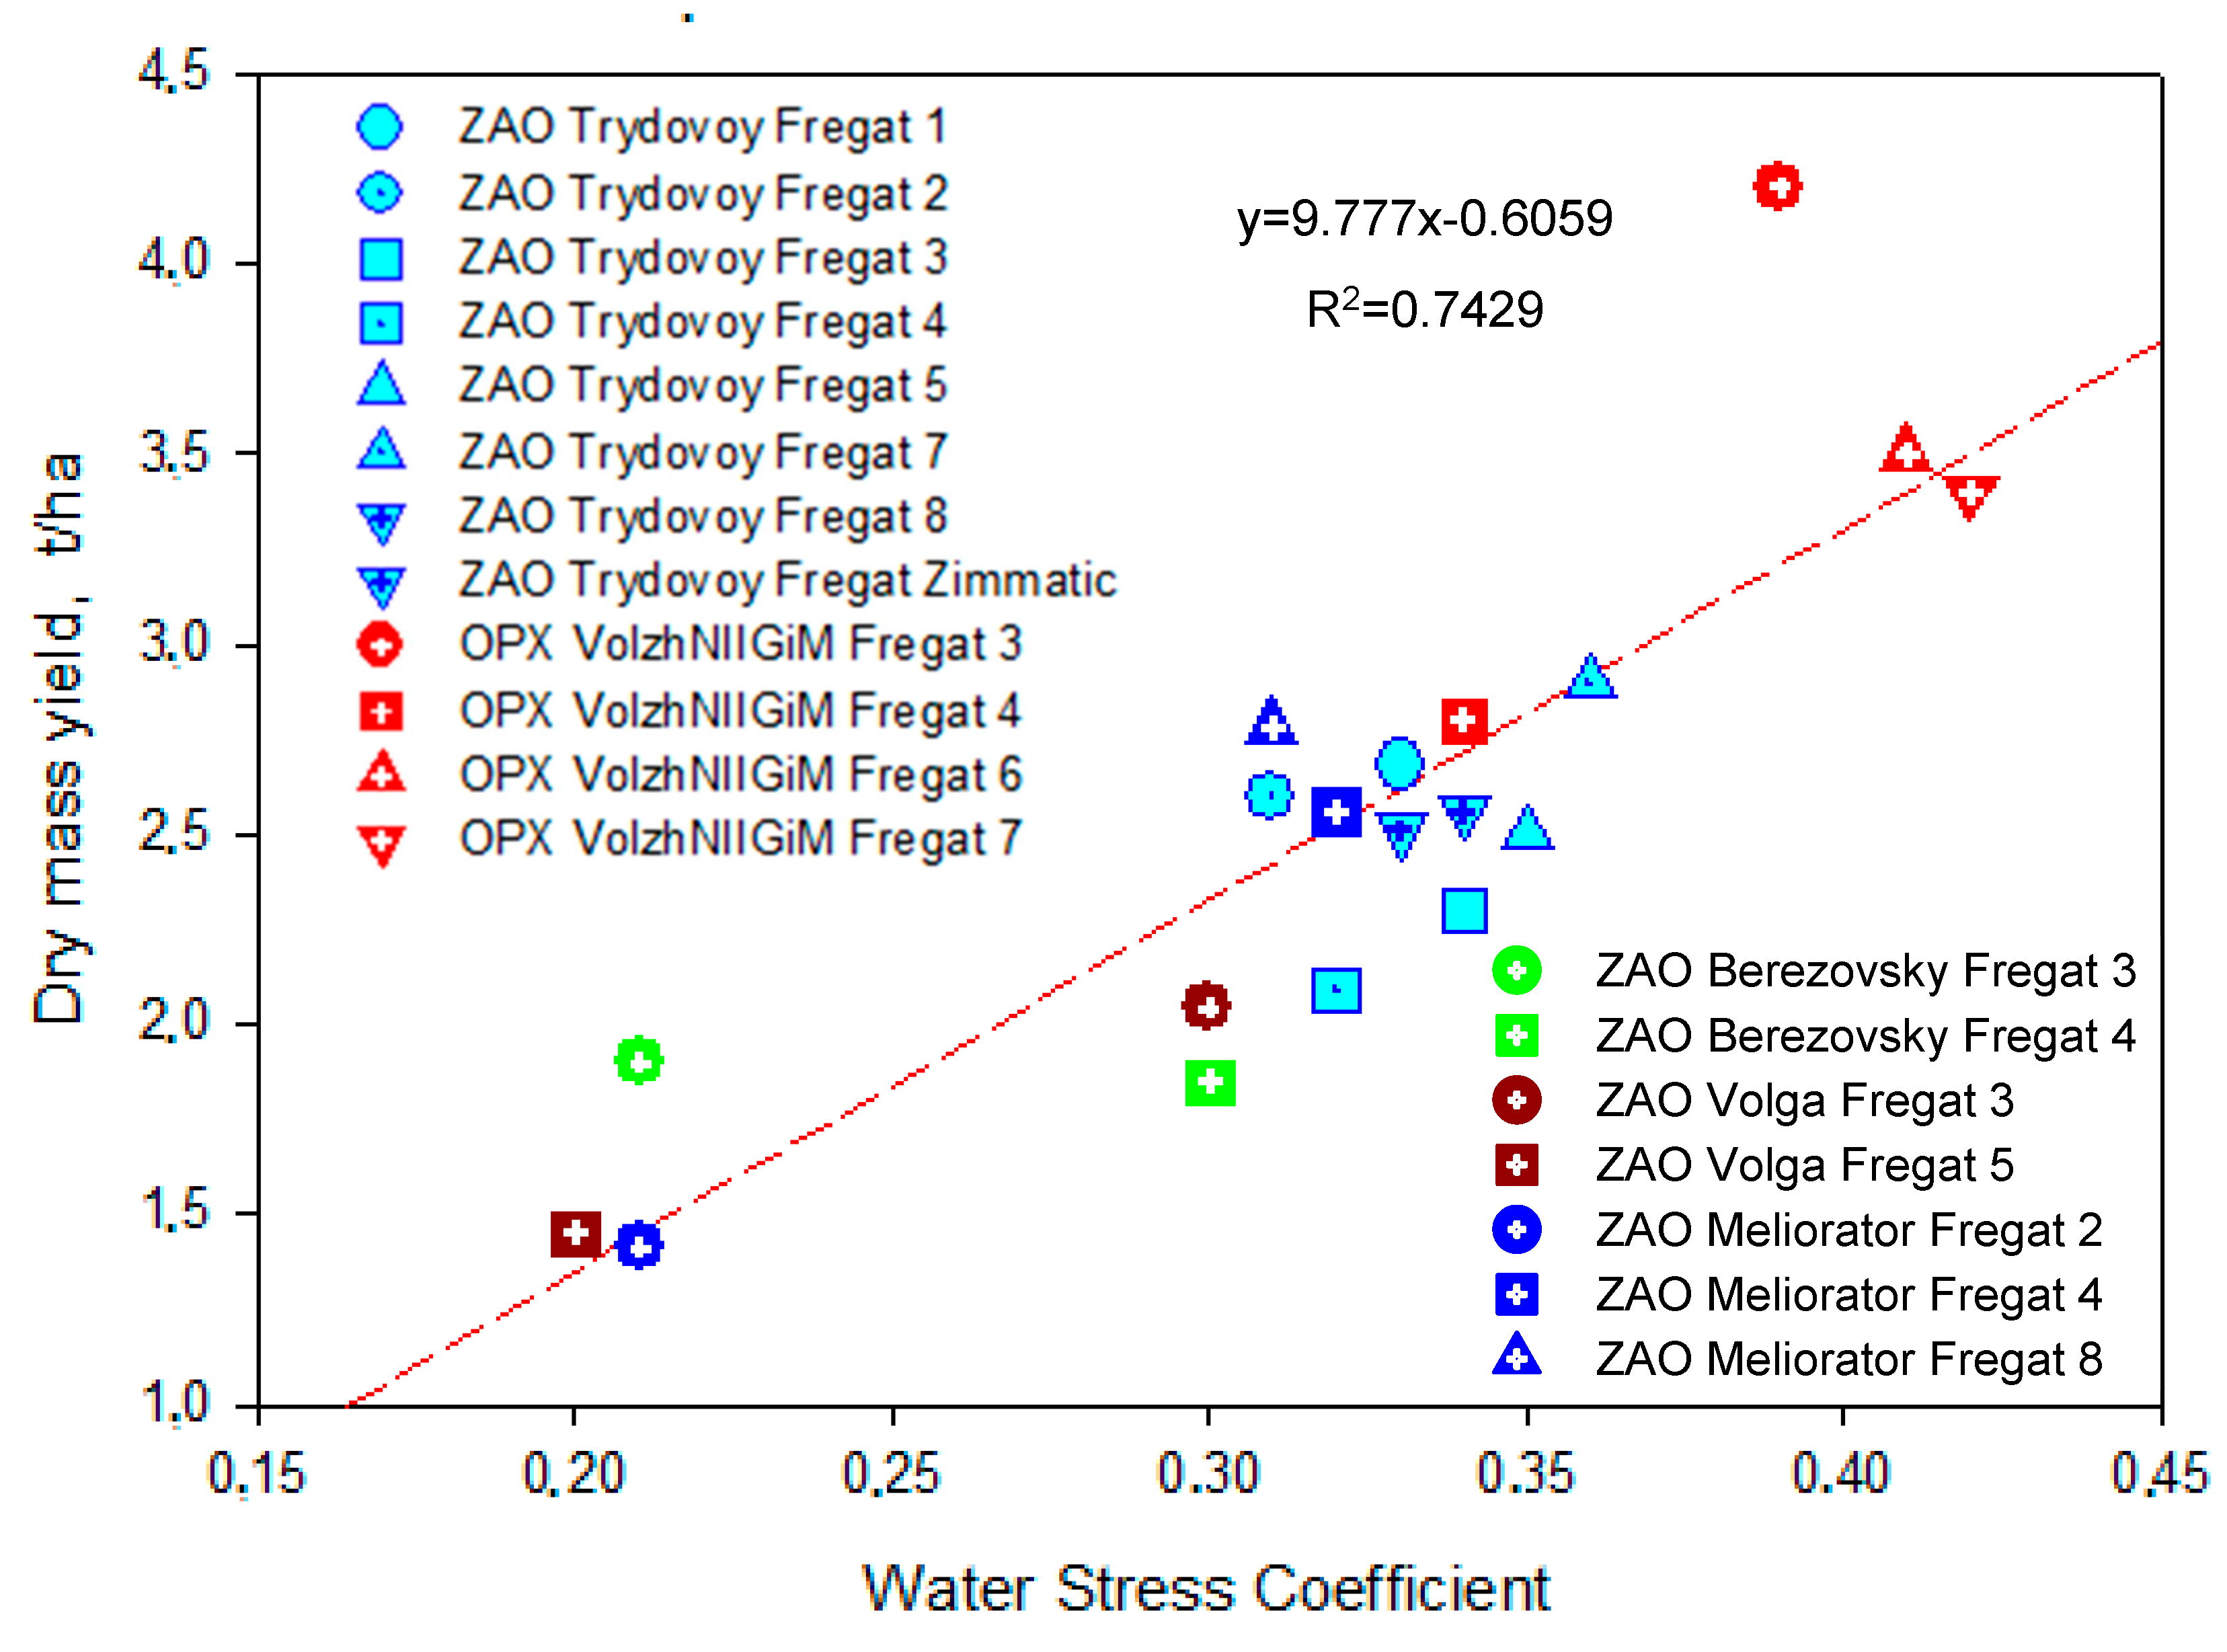
To test the second hypothesis concerning the presence of a relationship between {Kw}t and the yield of the irrigated alfalfa crops, an additional analysis of experimental and calculated data was carried out. For this purpose, for each of the 19 alfalfa crops, the average values of {Kw}t for the considered growing season were calculated. Each obtained value of this parameter was matched to the dry mass yield for all three harvests. For this purpose, data collected on the biomass productivity expressed as dry mass yield were used.
The relationship is expressed as an empirical function in
Figure 3. This function was examined for the presence of a linear relationship between the parameters. A slope of
a = 9.777, intercept of
b = 0.606, and coefficient of determination of
R2 = 0.743 were obtained. Thus, the presence of a relationship could be confirmed between the averaged values of the water stress coefficient of irrigated alfalfa crops and their dry mass yield.
The linear correlation between irrigated agricultural crop productivity and the {Kwc} value of IA for the irrigation period revealed the close connection between biomass productivity and the water stress regime of irrigated alfalfa crops.
A detailed analysis of the data series presented for agricultural crops according to their economic affiliation showed that the uniform management of irrigation resulted in similar yield values. Accordingly, yield could be classified from high to low depending on the farm. The alfalfa crops at the second study site (VolzhNiigiM) represent a good example of irrigated agriculture management with a sufficiently high technological level.
This classification could subsequently be applied for a between-group analysis. Accordingly, two closely located alfalfa crops (Fregat 3 and Fregat 5), owned by ZAO “Volga”, exhibited near-identical time series of the water stress coefficient until the end of June (
Figure 2). However, one of the planned irrigation events was impossible for Fr 5 due to the system being out of action, thus prolonging the water stress period; as a result, its yield in the third harvest decreased in comparison to that of Fregat 3.
It is possible to further improve the developed method by weighting the influence of the water stress coefficient at different growth stages on the final crop yield. Moreover, the spatial heterogeneity of water stress can be taken into account across the sowing space in terms of its impact on the water stress coefficient and on the final yield value.
As a result, a spatial delineation of water stress can be established over the crop area, allowing an estimation of the optimal time and water depth for irrigation using unimodal irrigation technology. This could also be suitable when using VRI technology, whereby the optimal time for irrigation application at spatially distributed water depths can be determined on the basis of previously delineated contours.
In general, the results obtained herein indicate the potential of the joint use of ground-based observation data and spatial monitoring for the purposes of crop irrigation control and management.
5. Conclusions
This study revealed that the water stress level of irrigated alfalfa crops had an effect on their yield. Linear relationships were established between irrigated alfalfa crop yield and the averaged values of the water stress coefficient. These results were derived following the determination of field experimental values of yield for 19 alfalfa crops in the Saratovskoe Zavlolzhie region, used in tandem with a SEBS model integrating a combination of ground-based and remotely sensed datasets.
The results of this study showed the applicability of estimating the crop water stress coefficient for assessing the impact of irrigation on alfalfa crop yield. This approach is favorable for regions with a need to increase their irrigation water use efficiency; hence, it may become a key driver for irrigated agricultural sustainability.
The relationship between the water stress coefficient and alfalfa yield confirmed the potential of combining ground-based data and remote sensing for detecting the spatial variability of the water status. The developed method can be used to support decision making with respect to irrigation management in precision irrigated agriculture. Developing of maps of the water stress coefficient may allow management of the variable rate of irrigation, taking into account the spatial variability of crop water status.
Further investigations based on this method may be directed toward analyzing the effectiveness of irrigation practices and the operational management of agricultural crop irrigation. However, there is also room for improvement. Firstly, this method can be evaluated for its application to other types of irrigated crops. Secondly, the water stress coefficient can be weighted as a function of growing stage to focus on the yield. Lastly, differences in variable rate irrigation practices can be taken into account.

