
Changes in Nitrogen Pools in the Maize–Soil System after Urea or Straw Application to a Typical Intensive Agricultural Soil: A 15N Tracer Study

 ,
,
Abstract
:1. Introduction
2. Materials and Methods
2.1. Soil
2.2. Preparation of Labeled and Unlabeled Straw
2.3. Experimental Design
2.4. Sample Analysis
2.5. Calculations
2.6. Statistical Analysis
3. Results
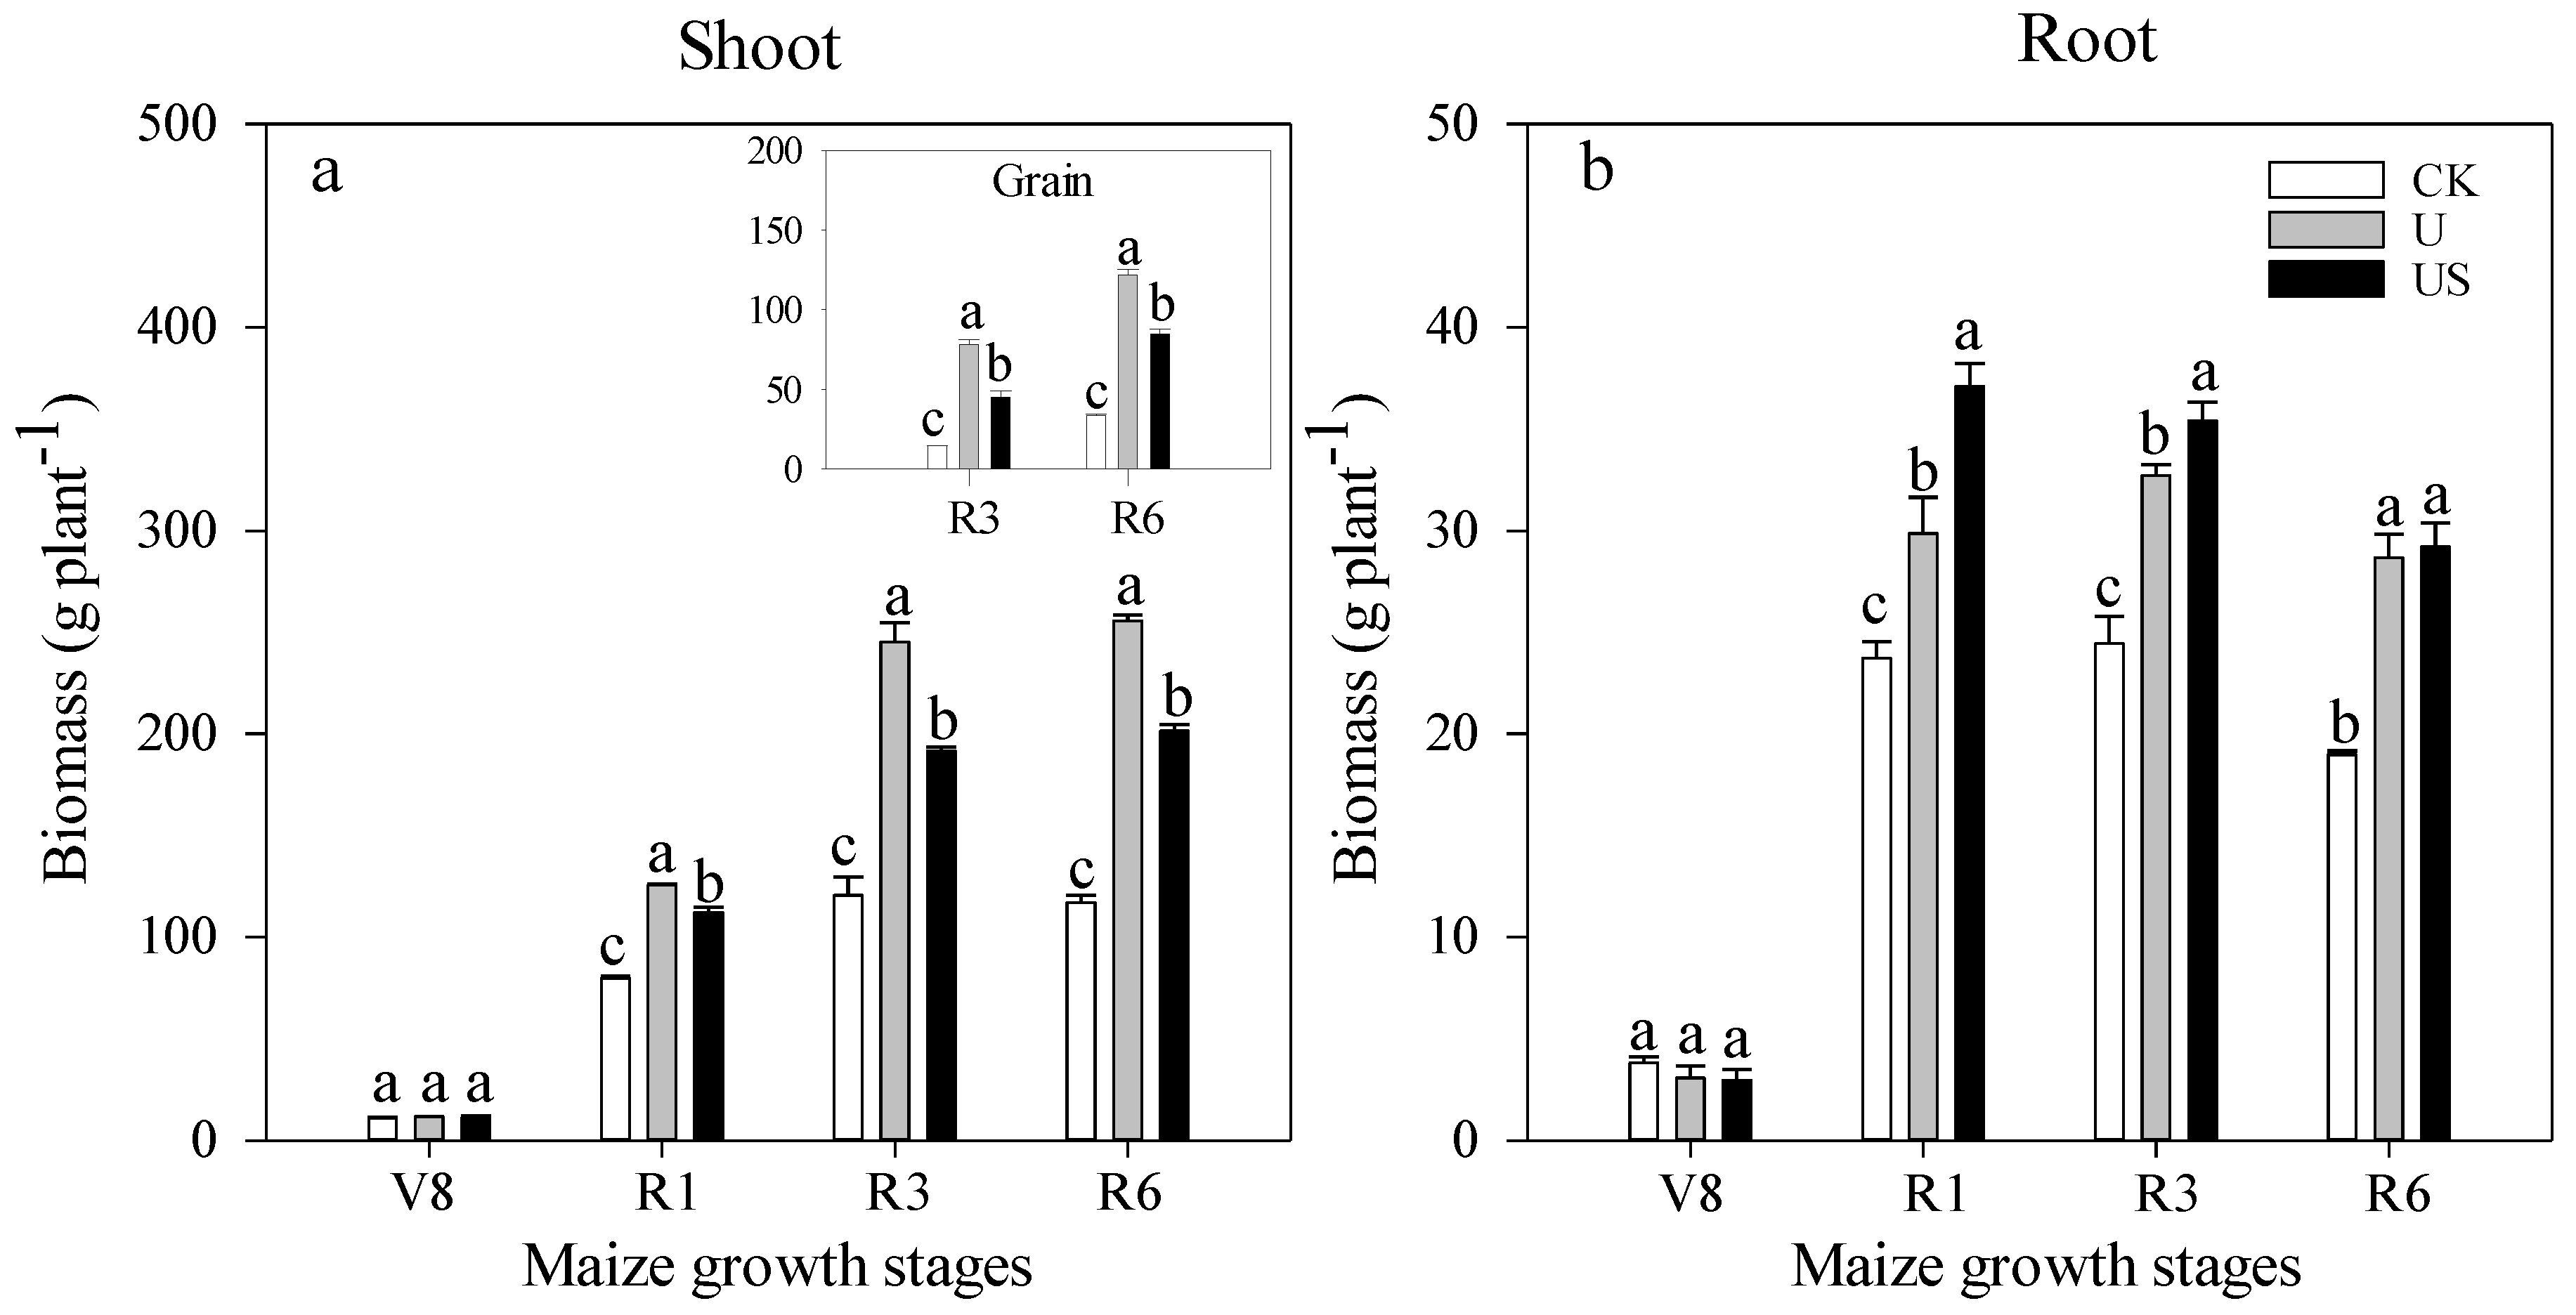
3.1. Crop Biomass
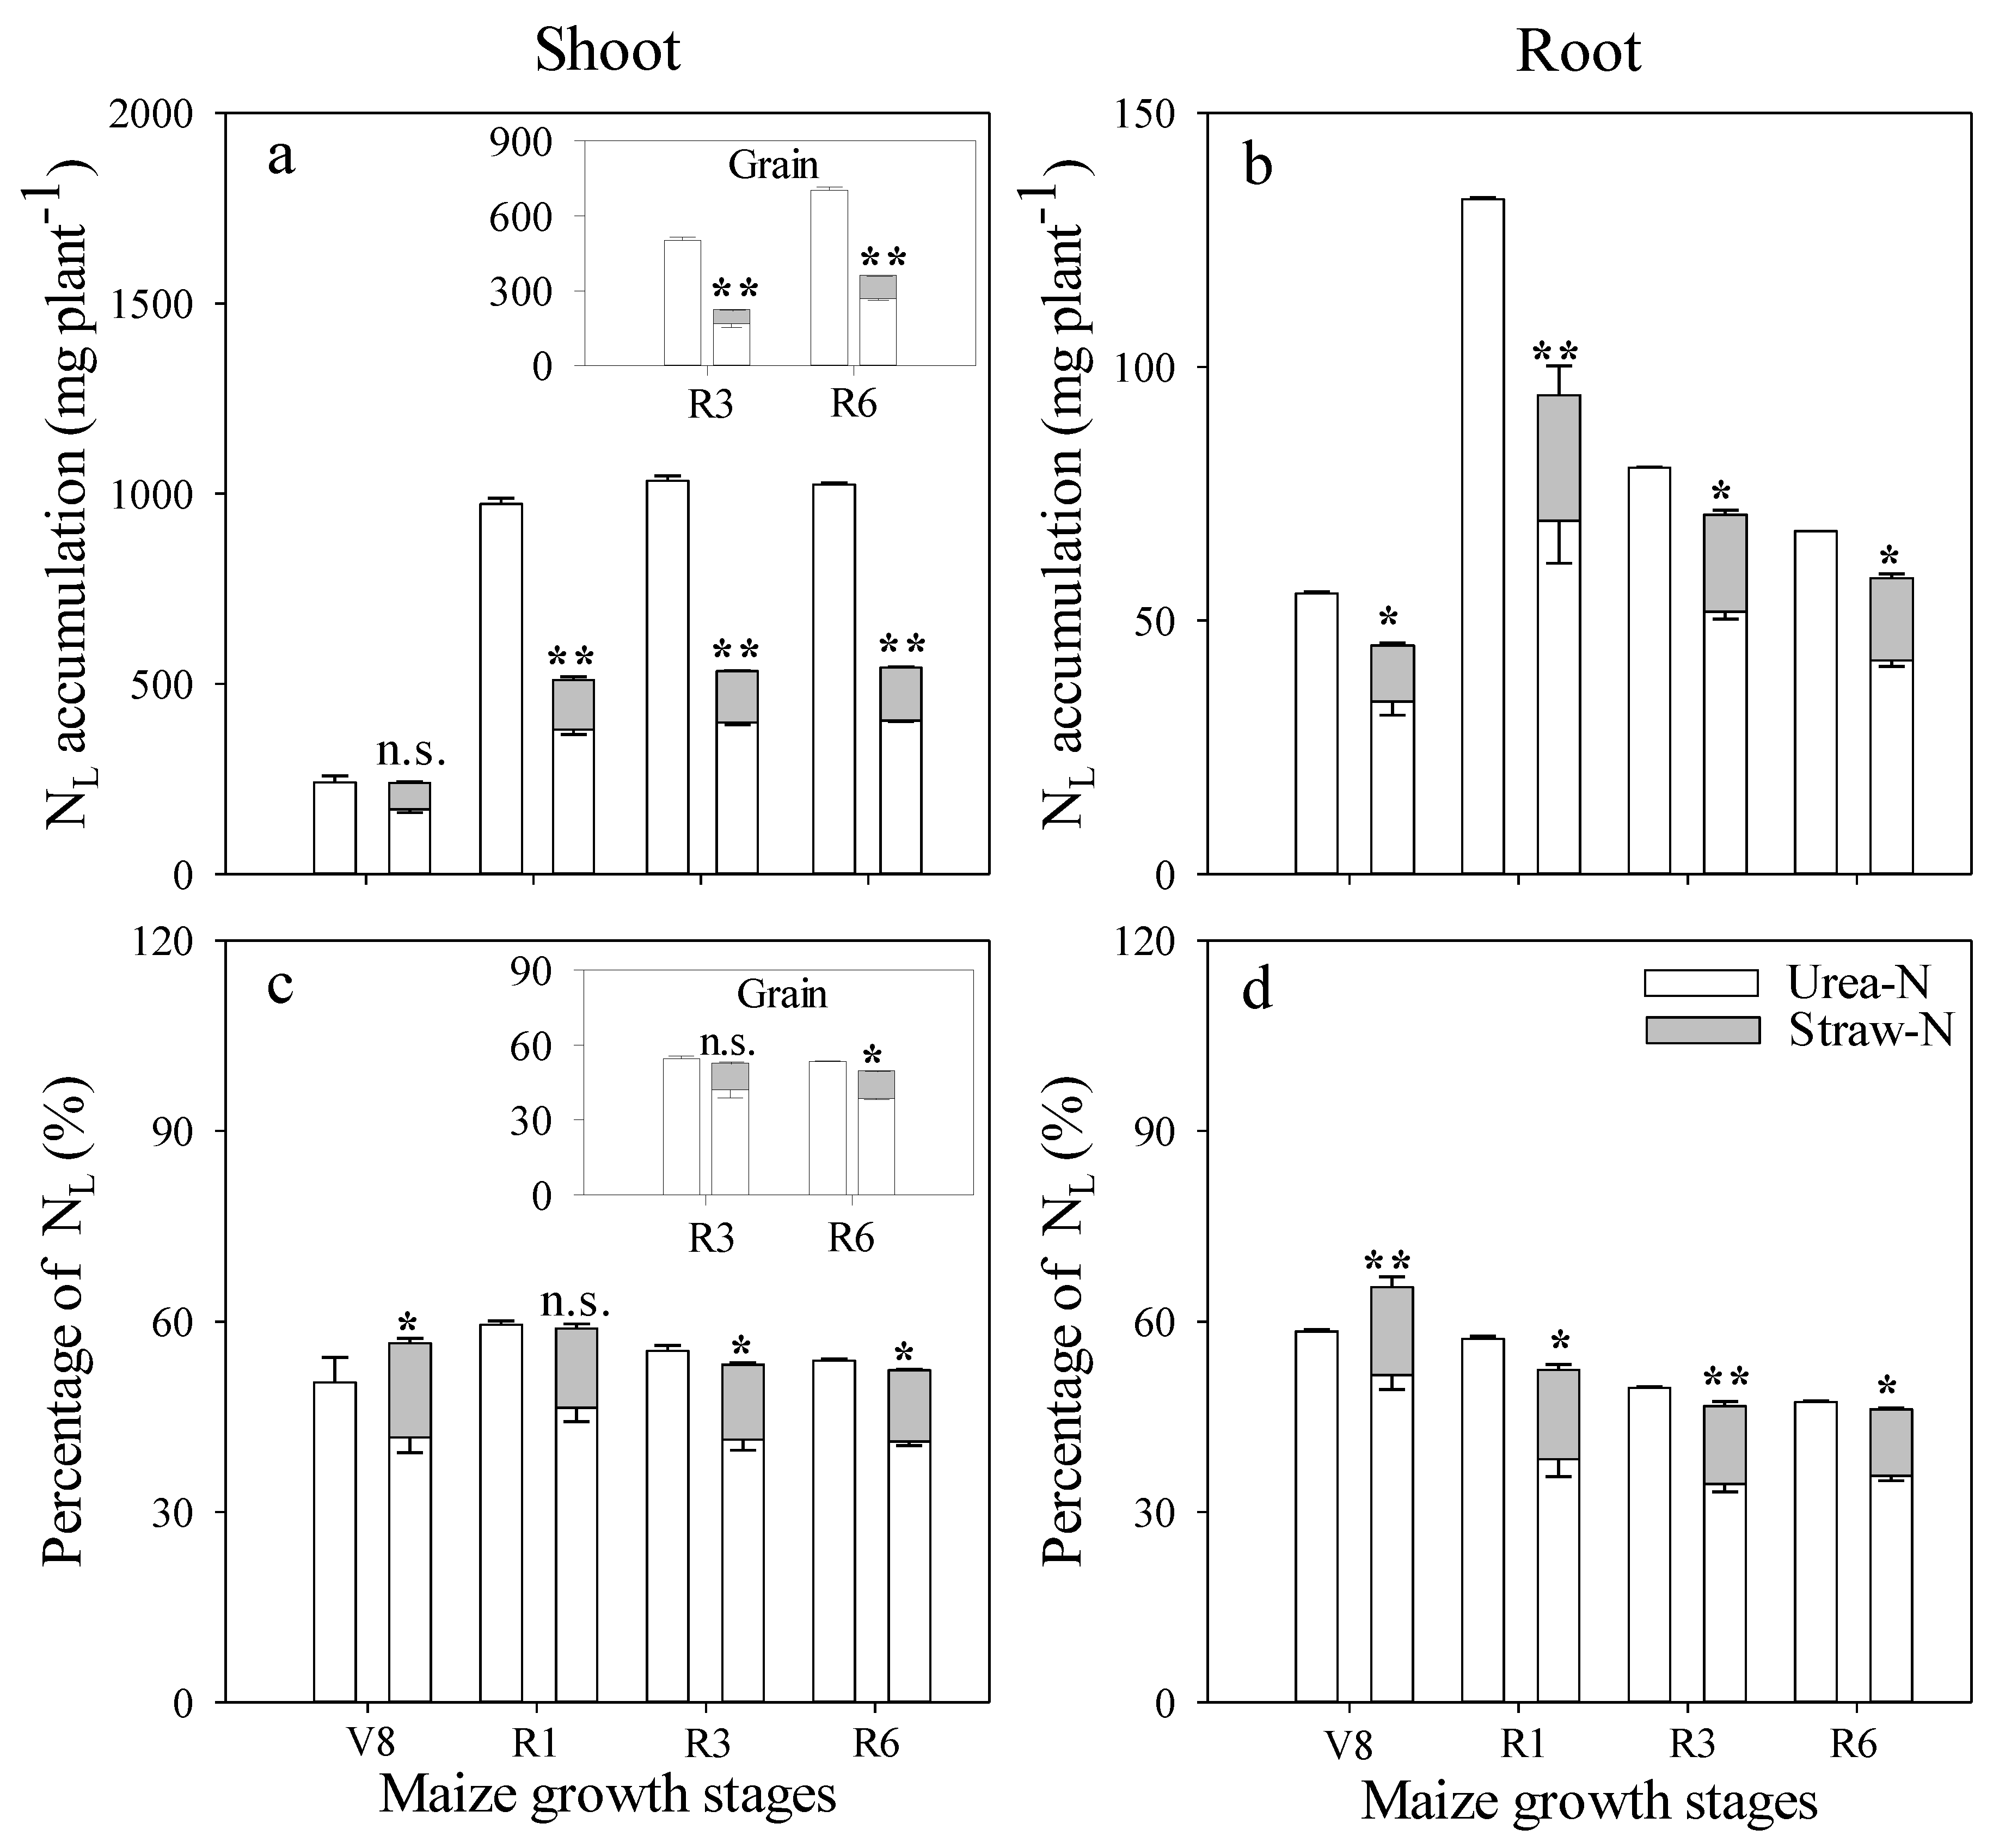
Plant N Uptake
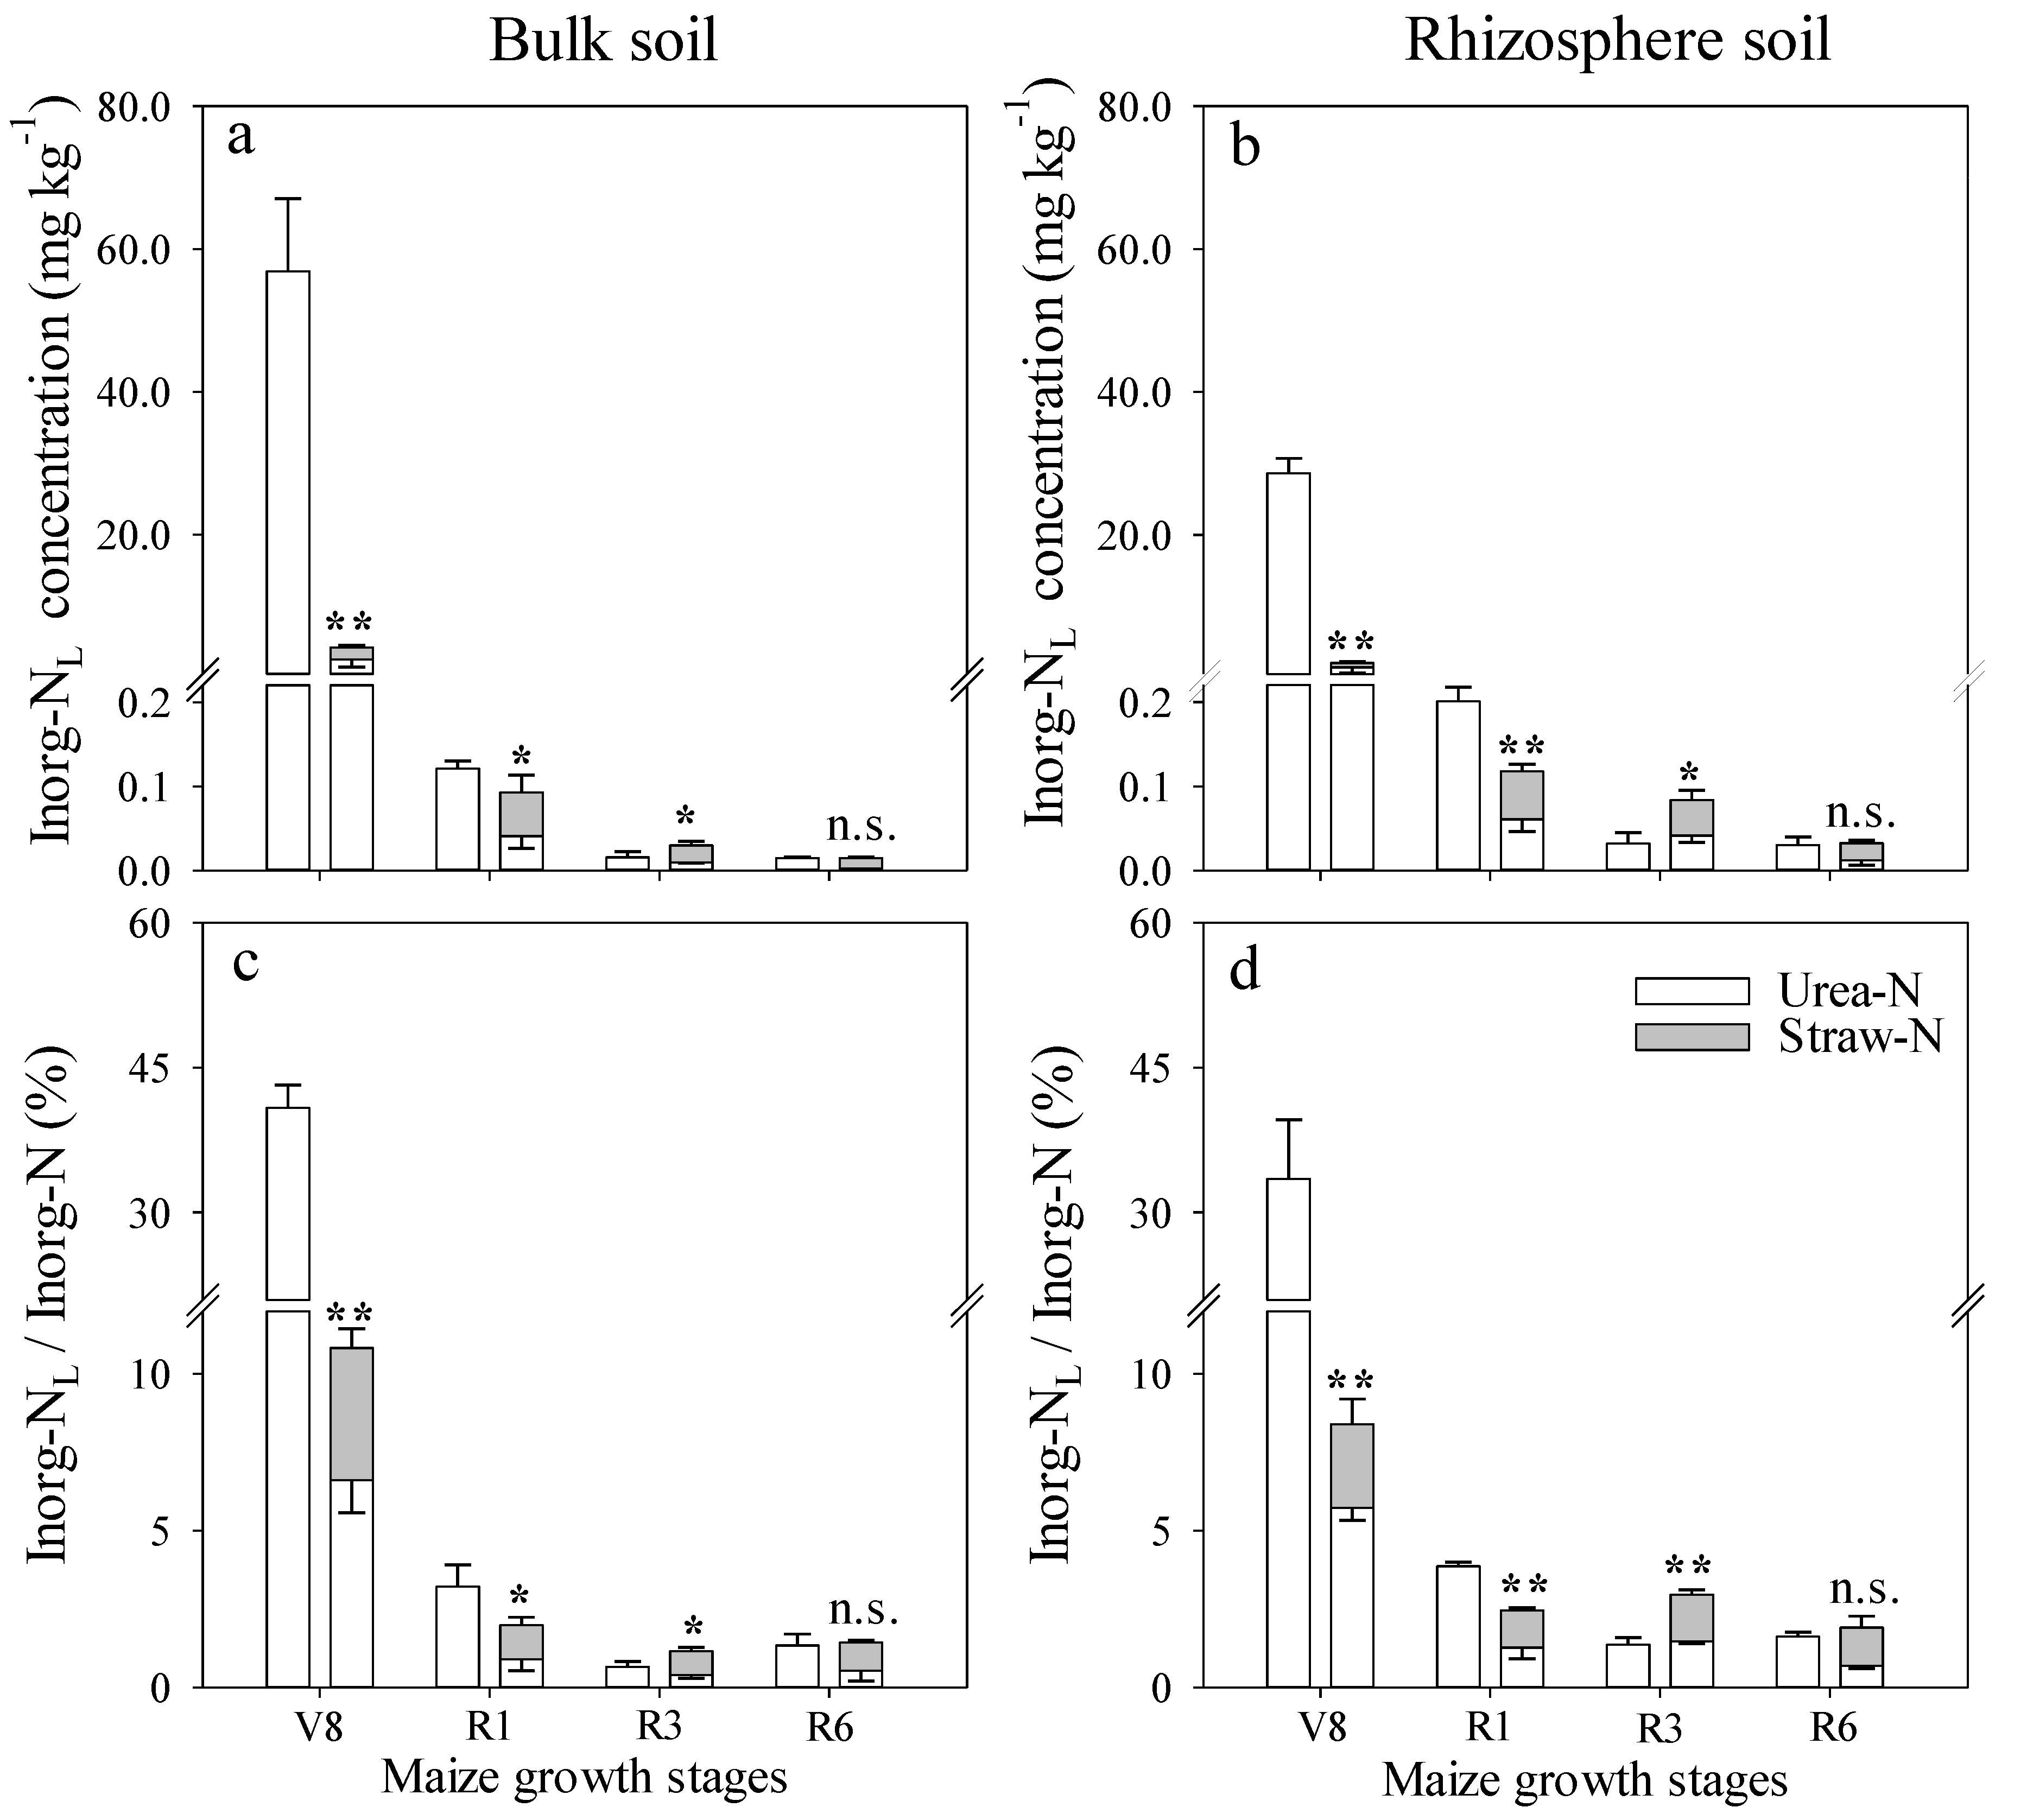
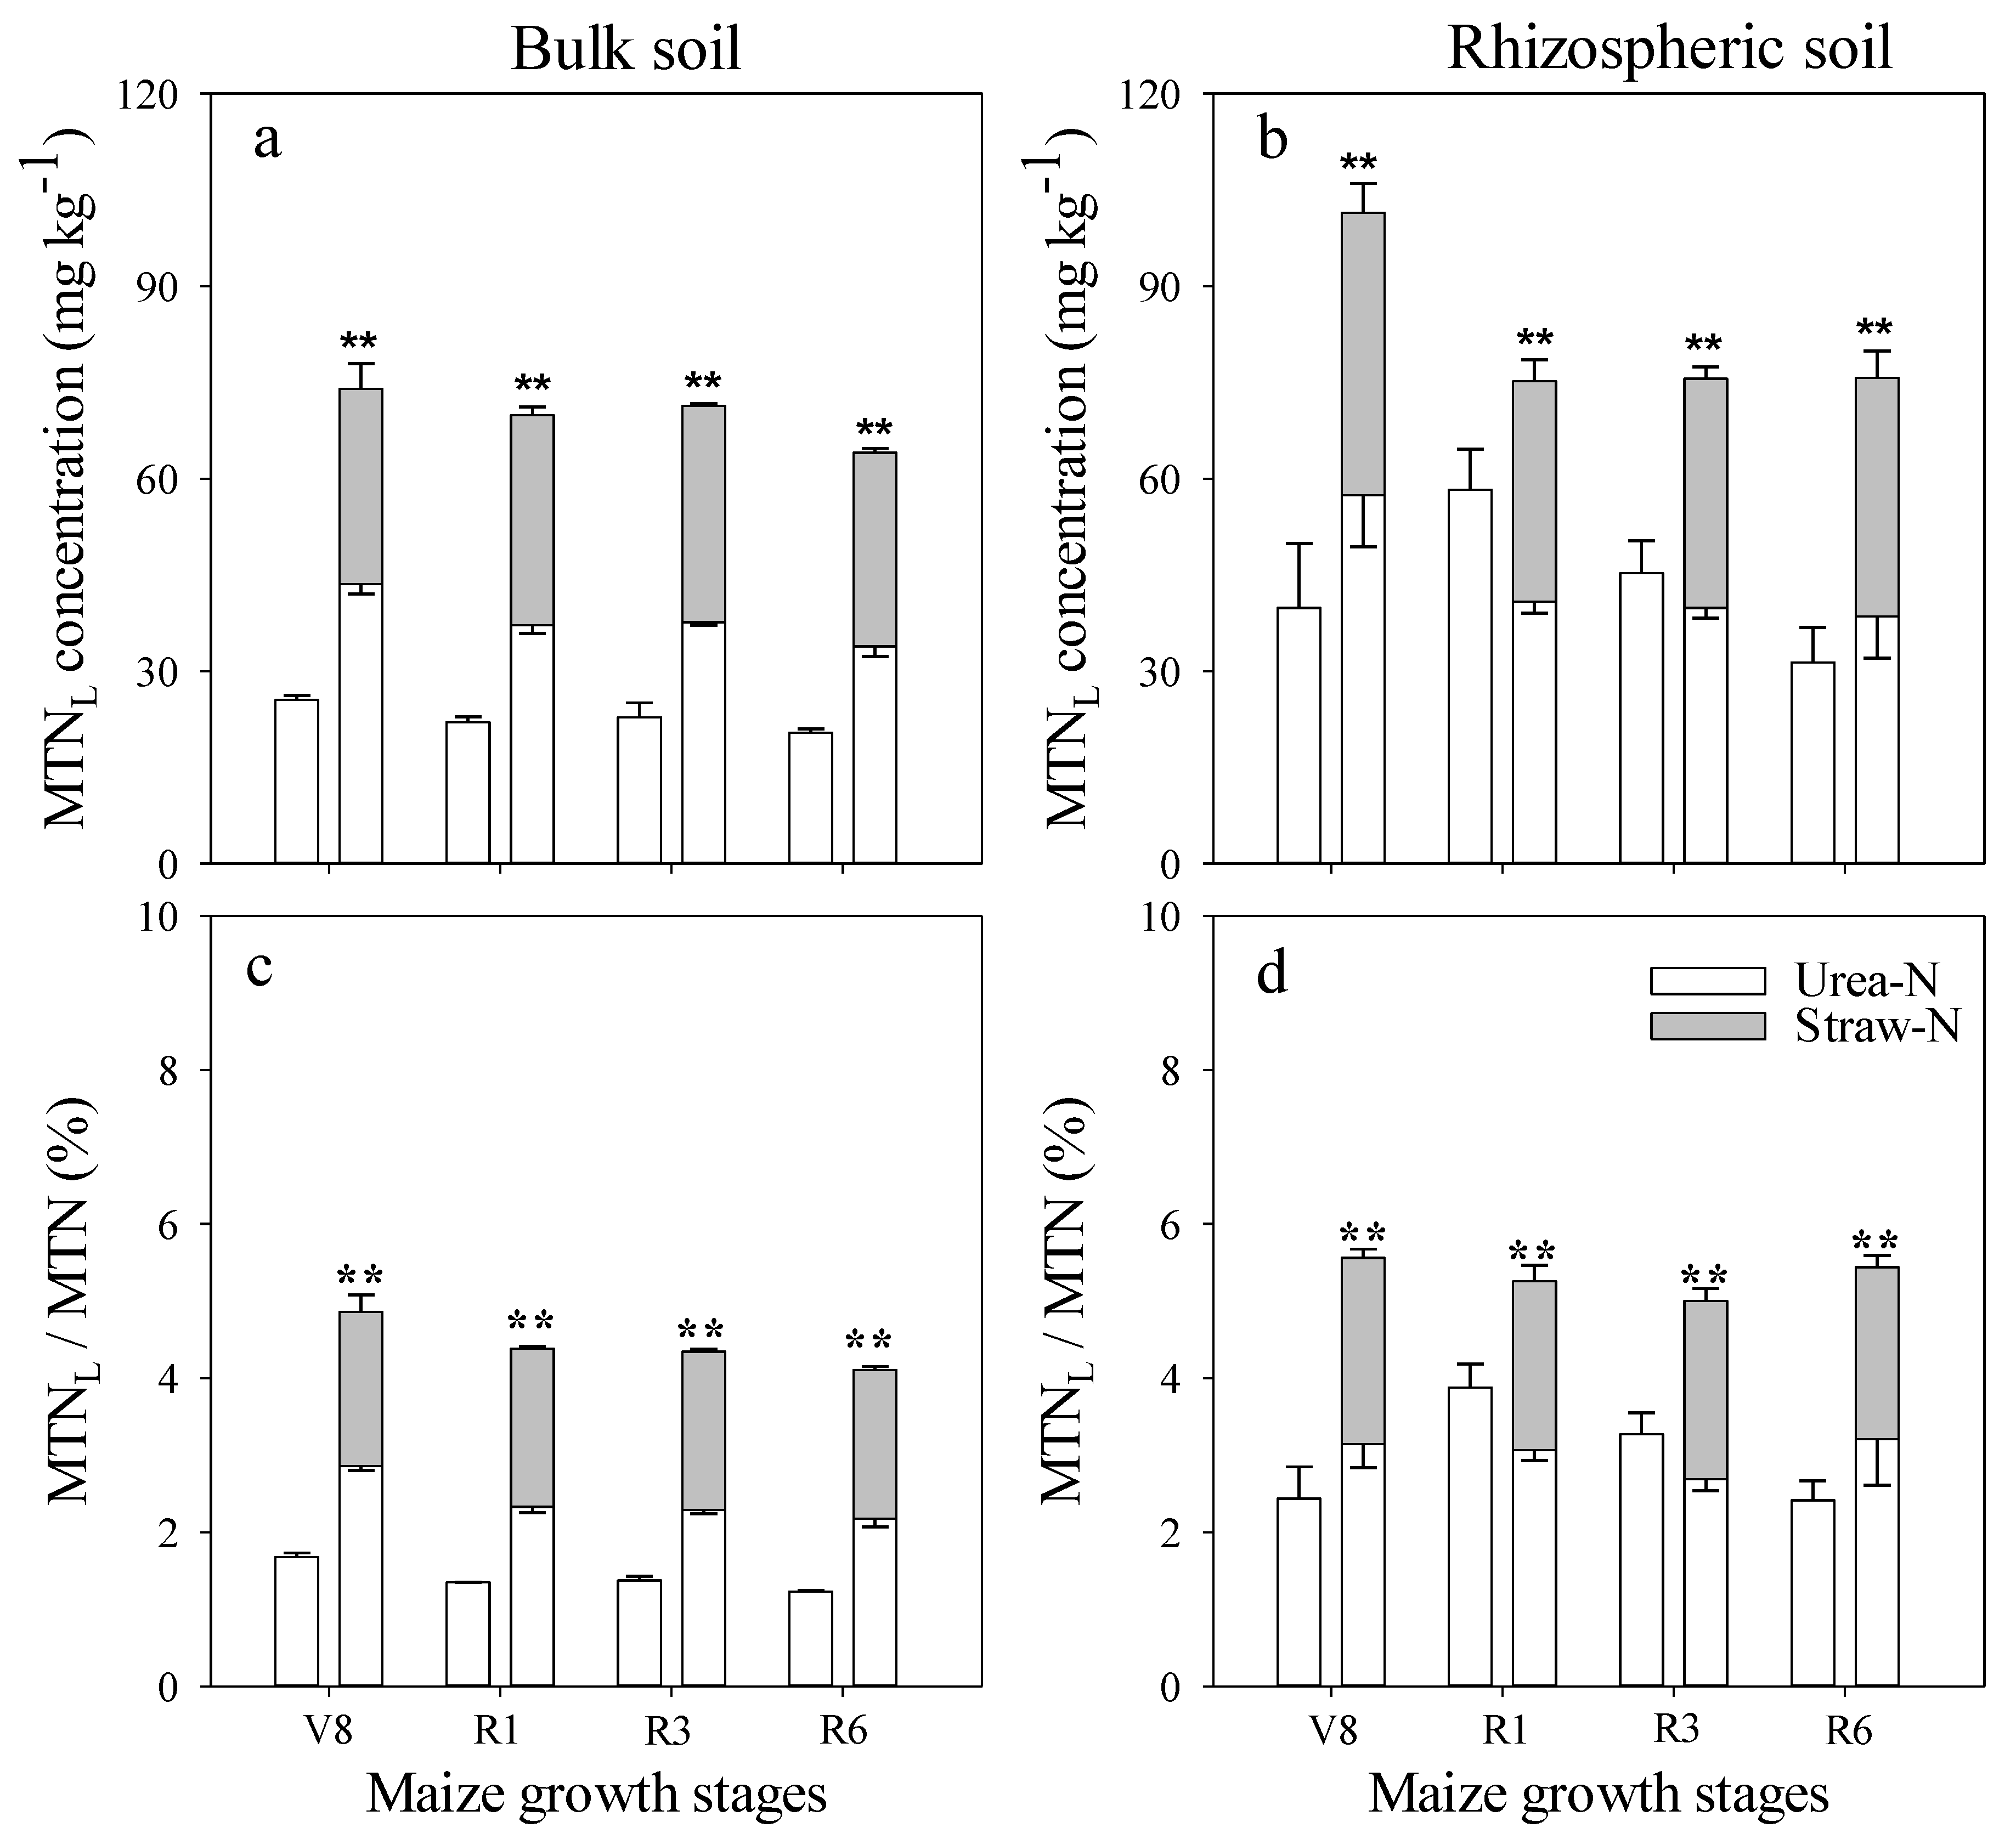
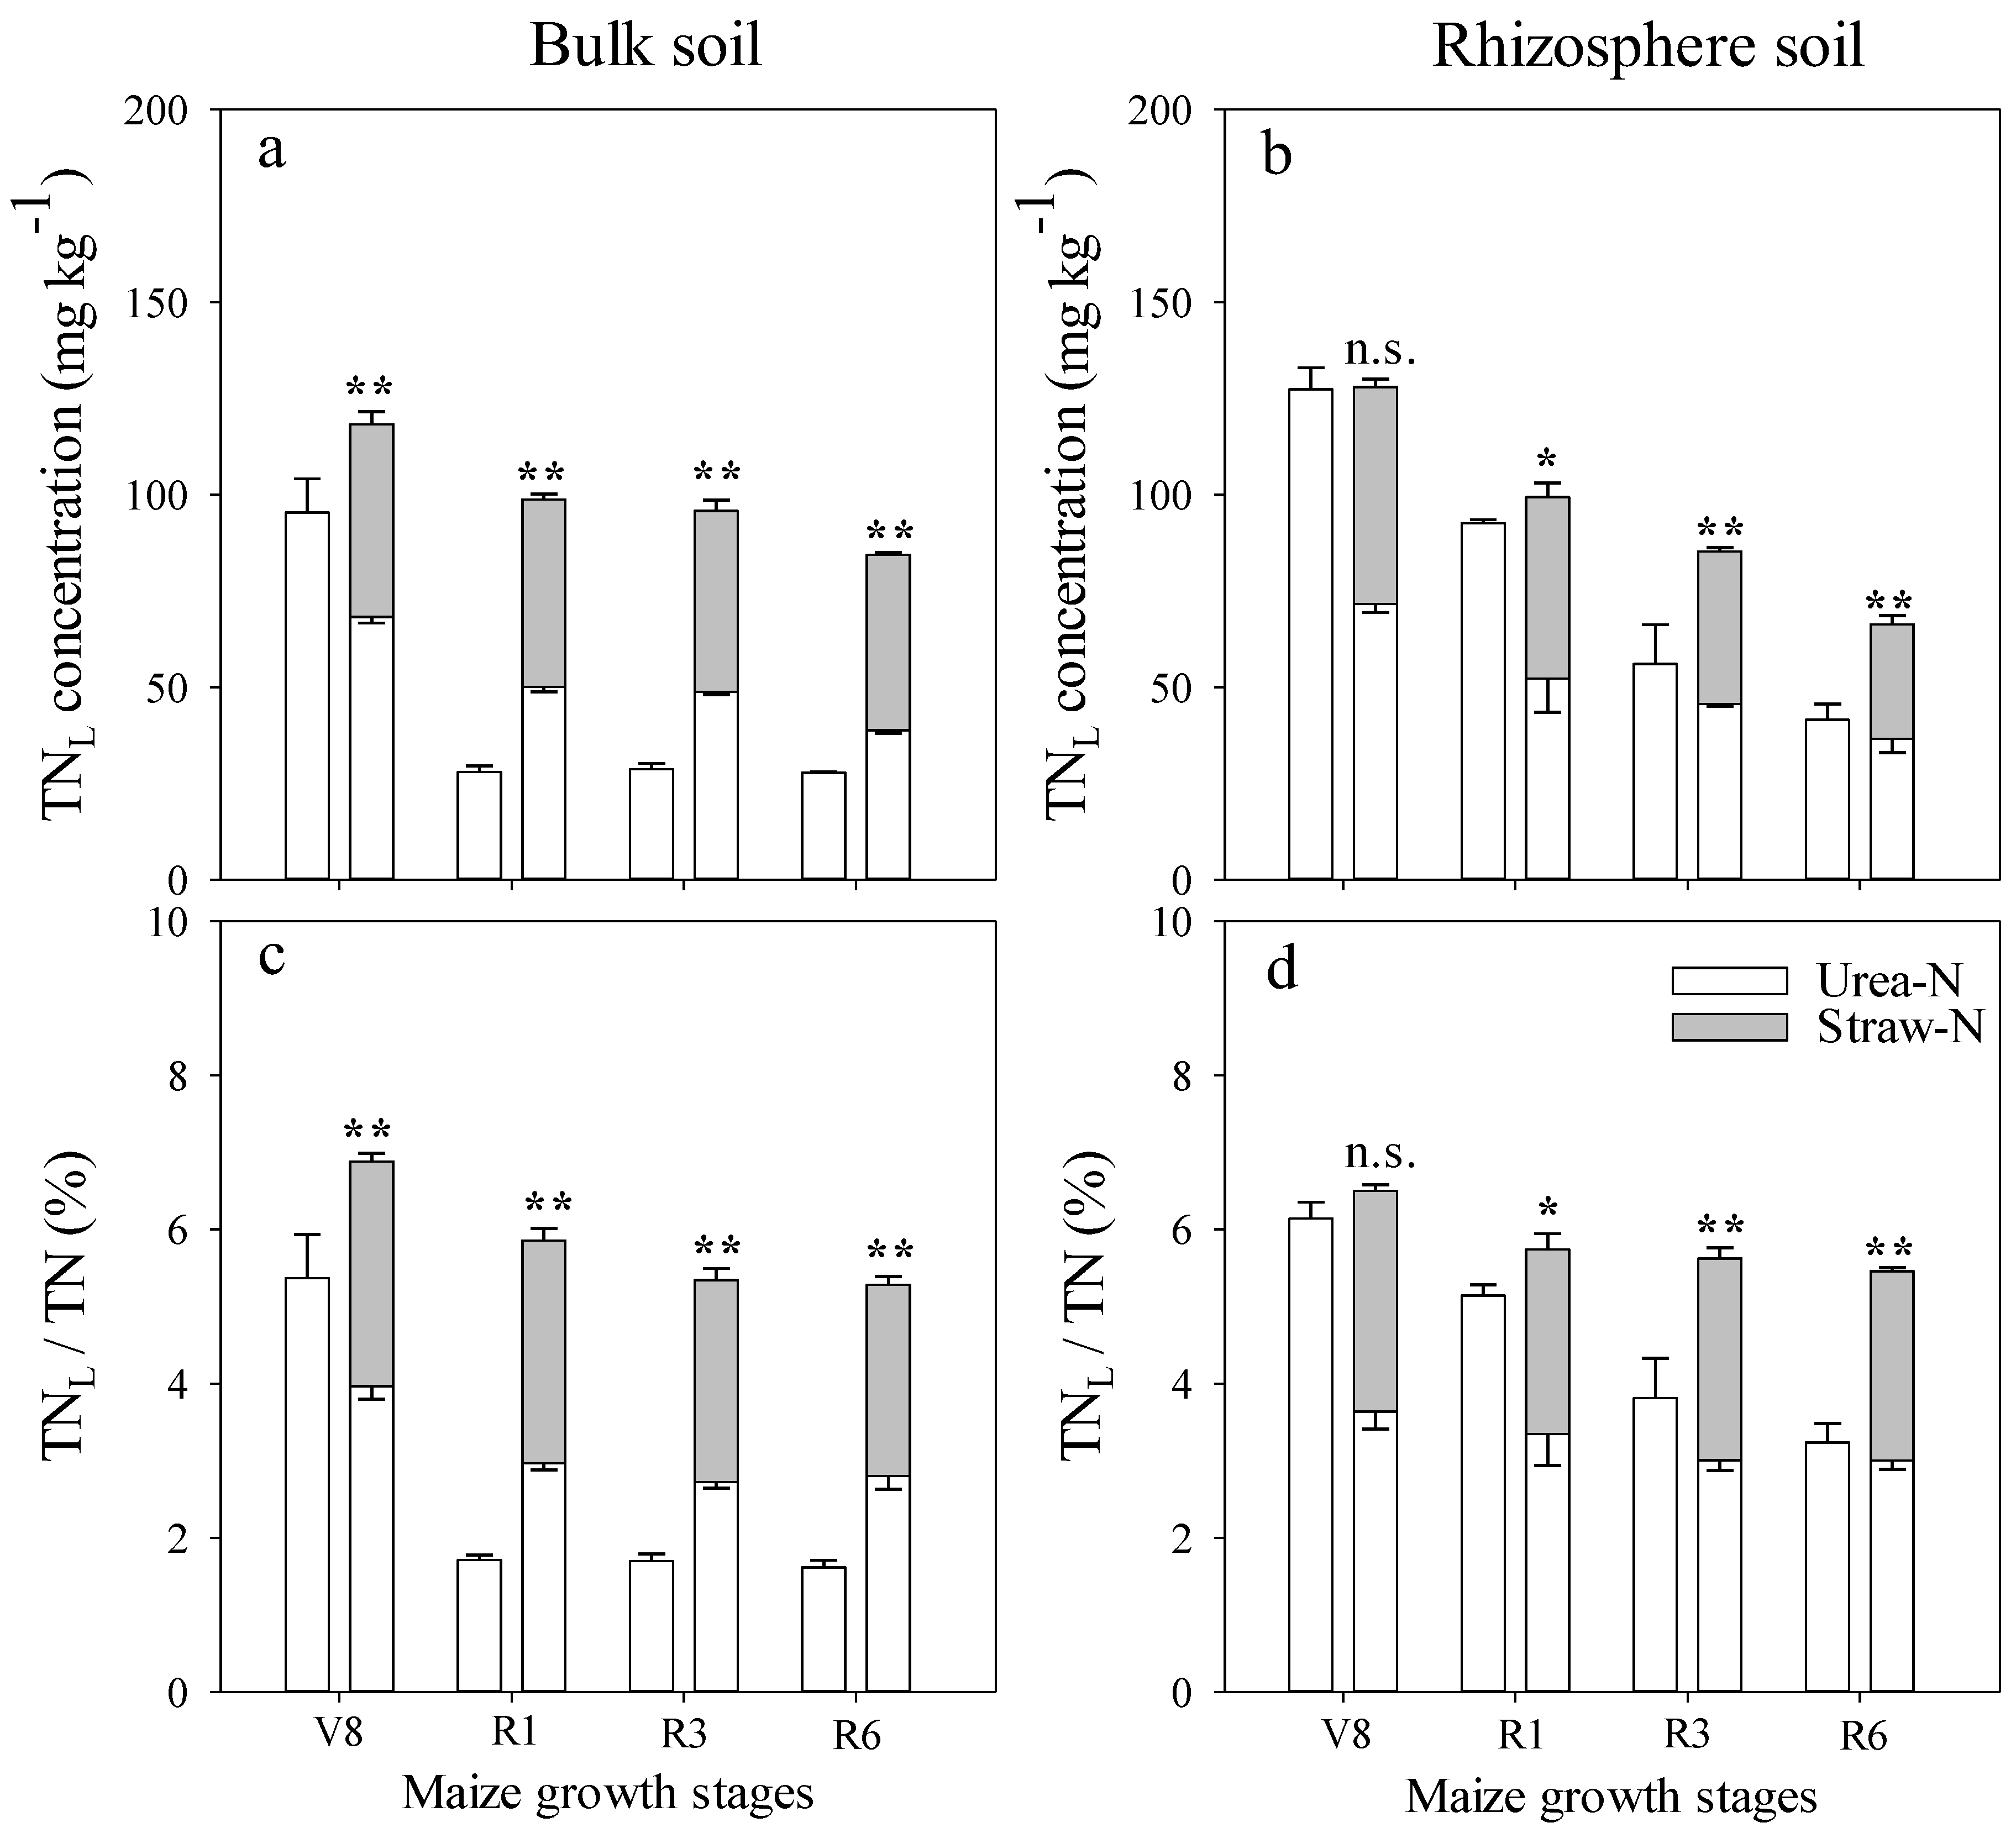
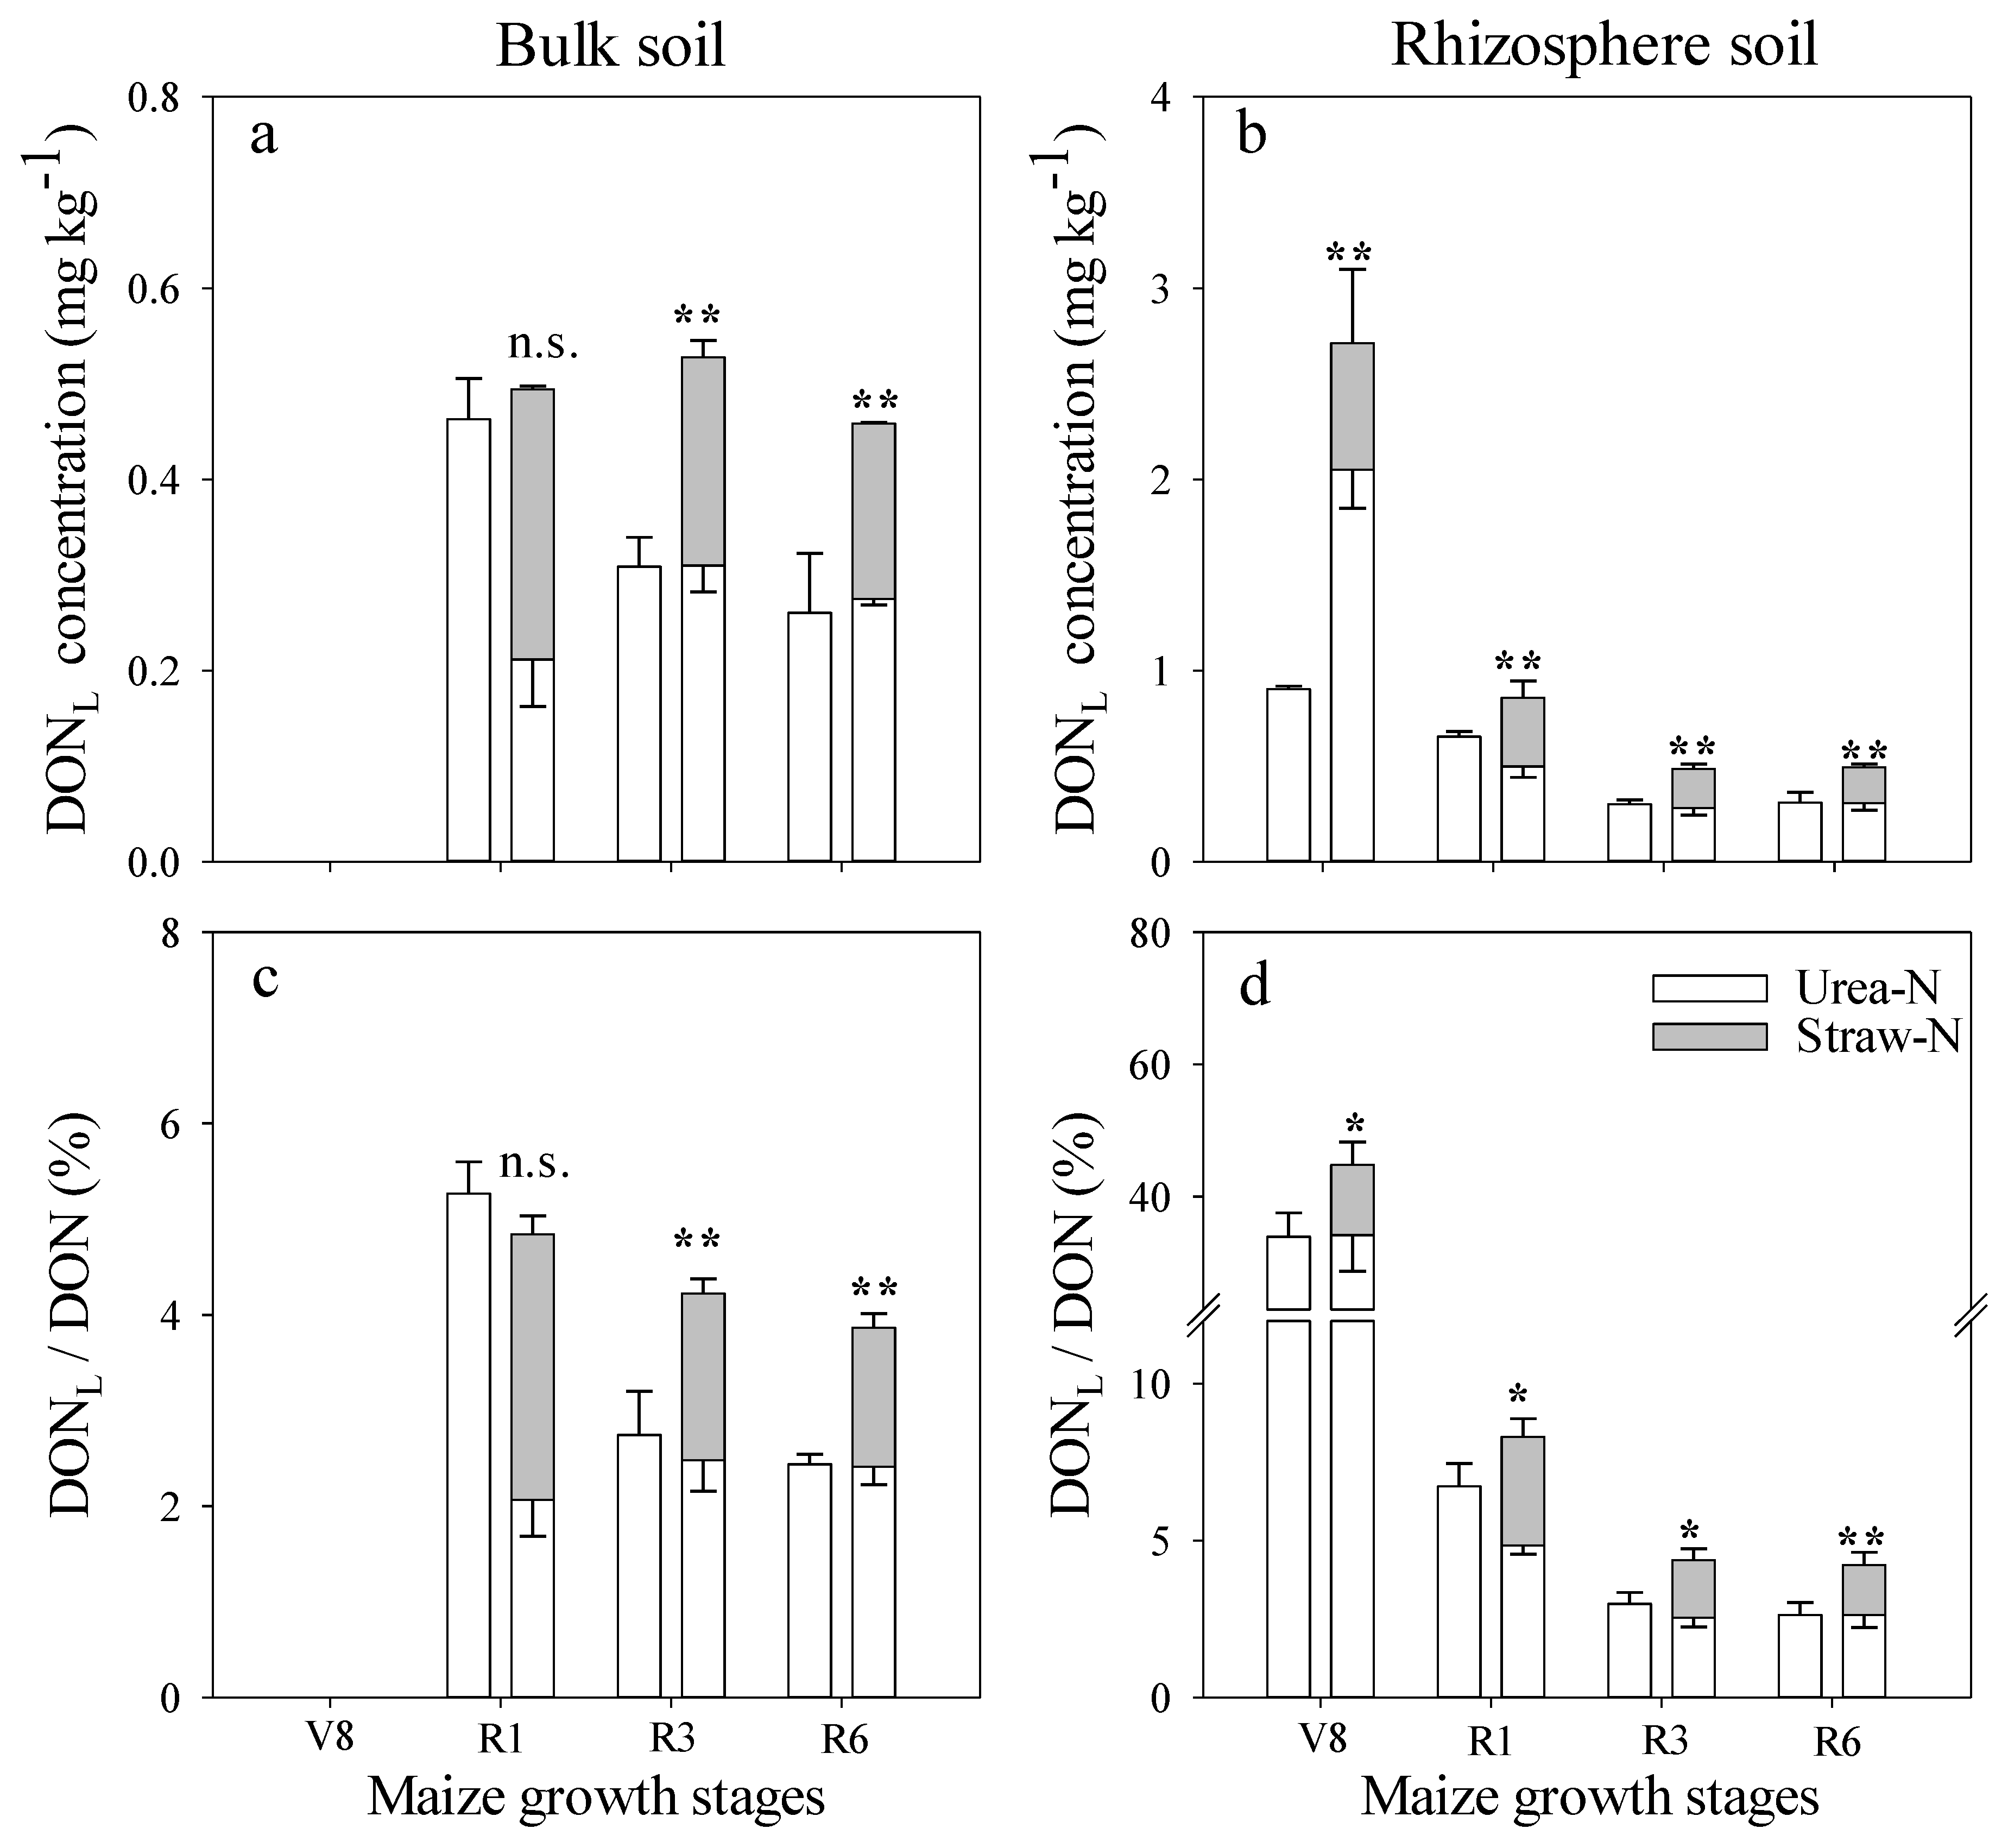
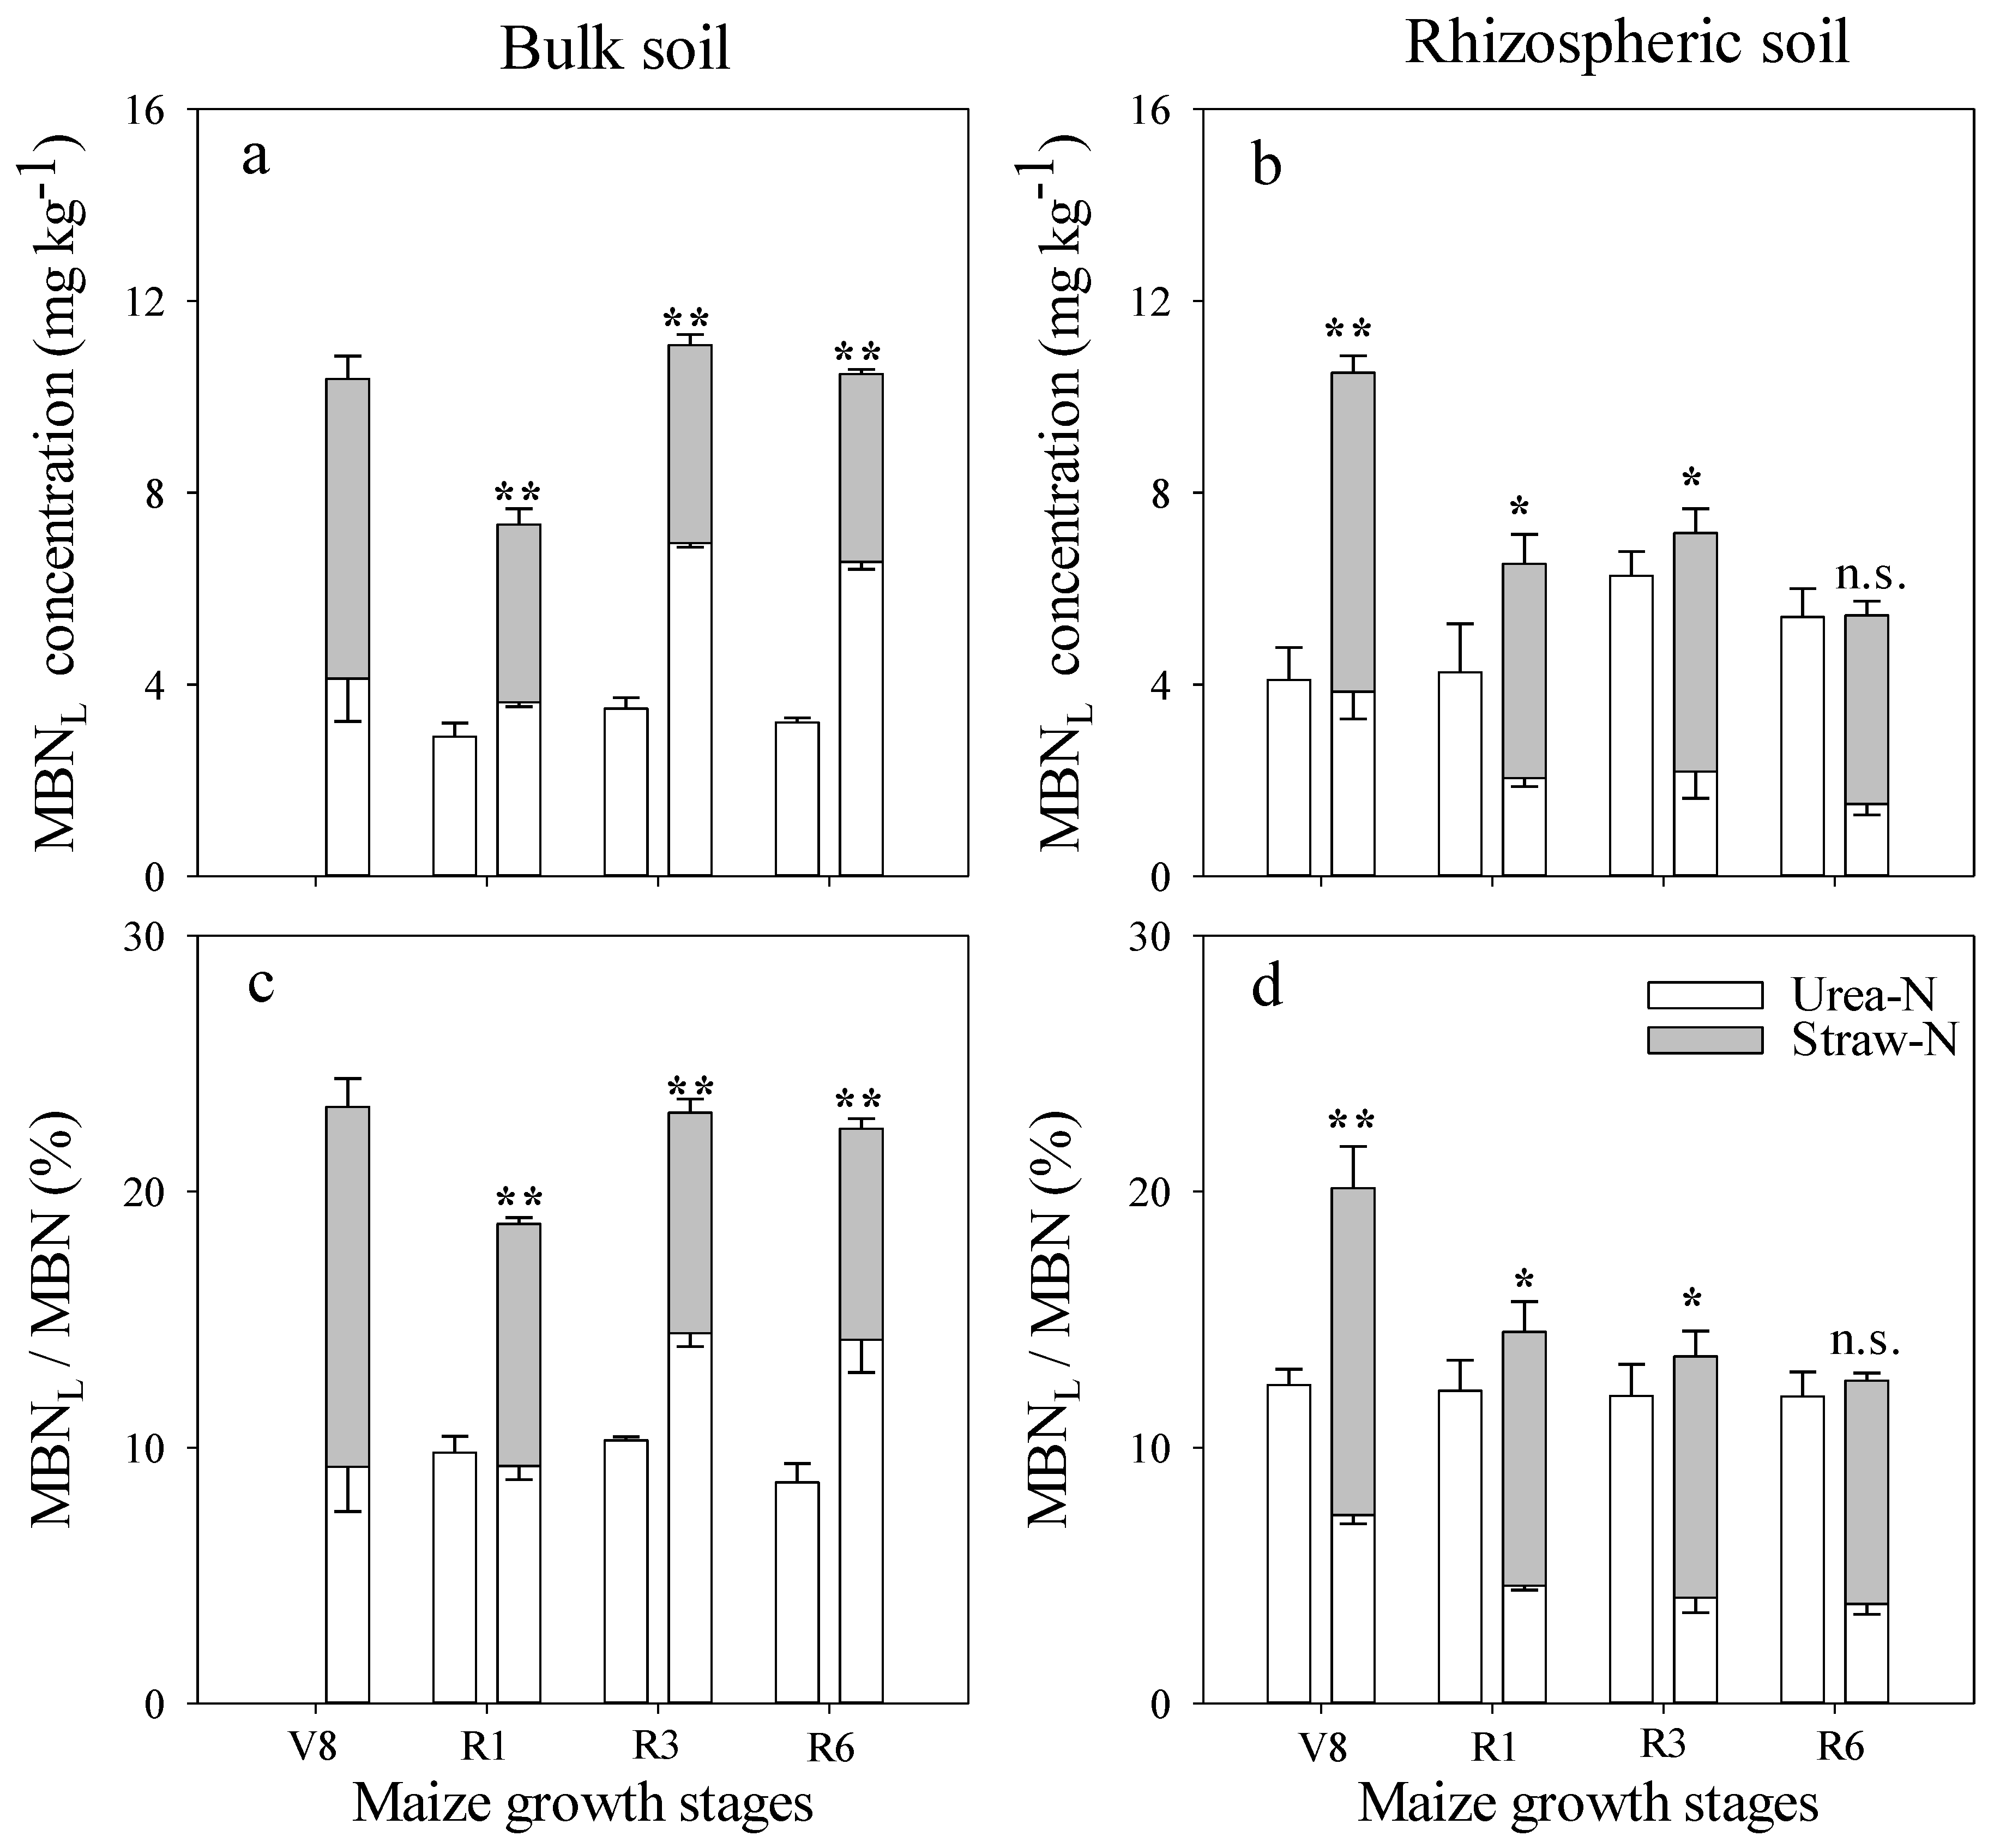
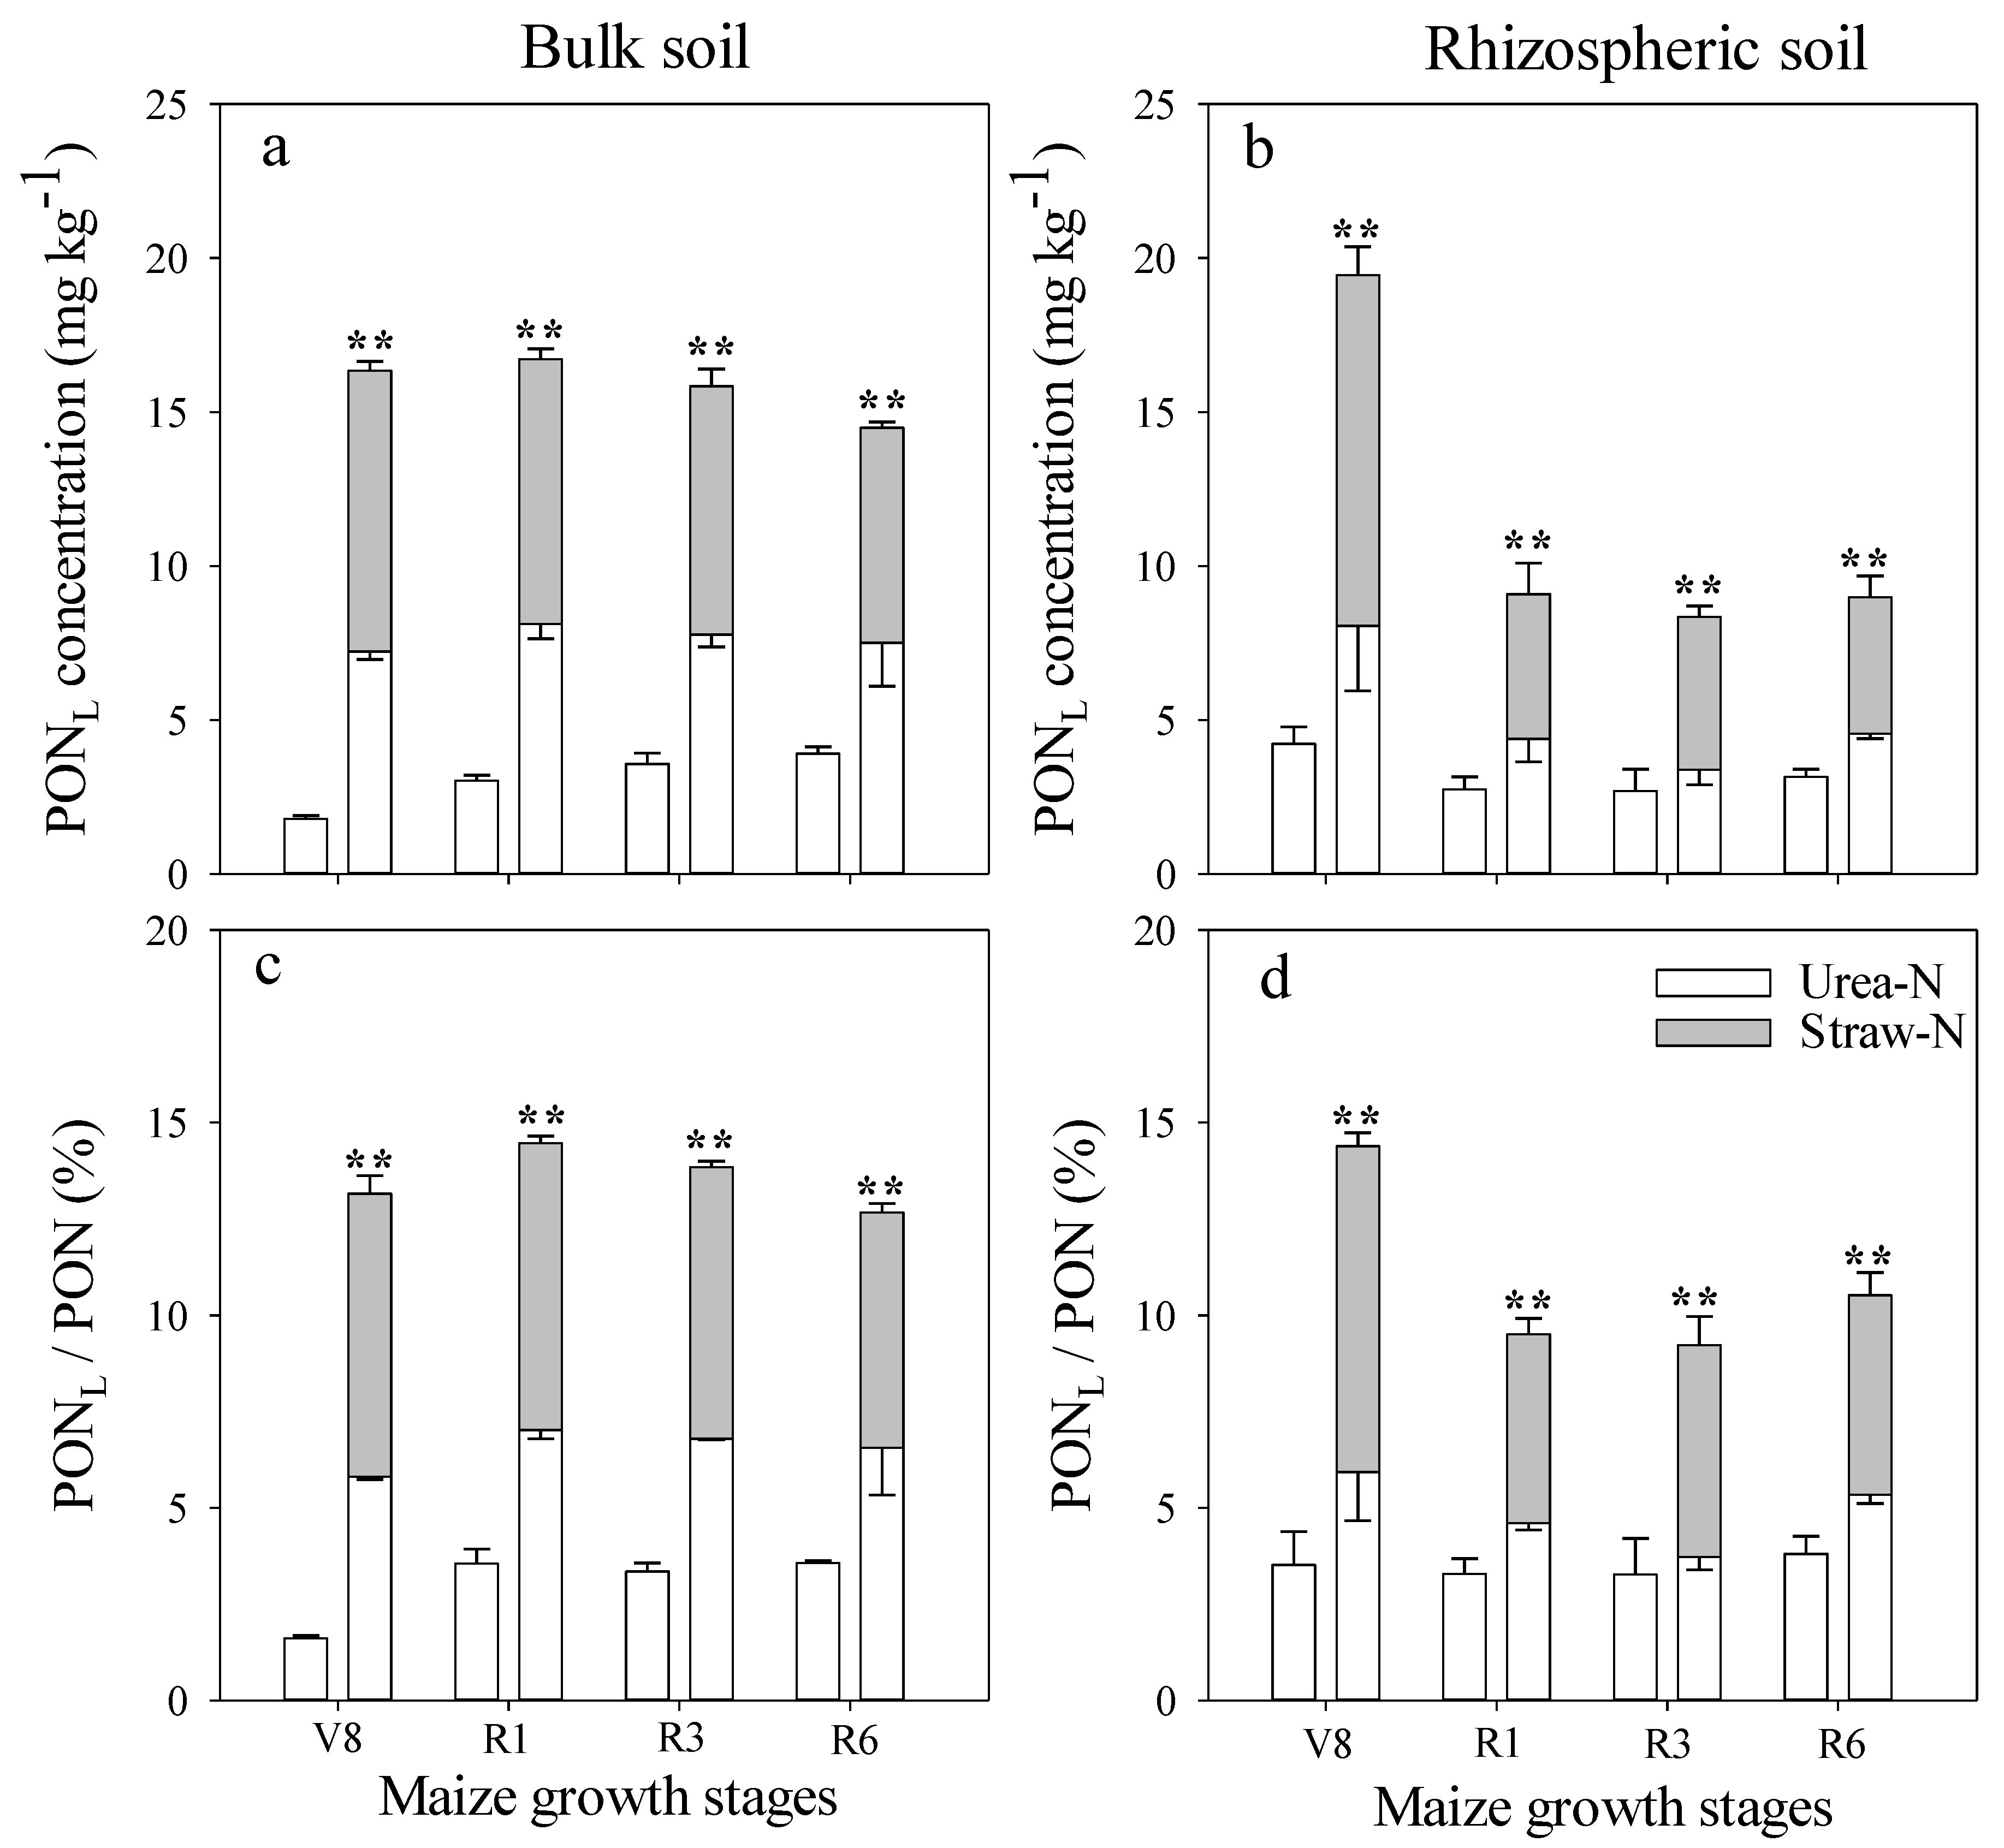
3.2. Effect of Fertilizer Management on Applied N Distribution in Soil
3.3. Comparison of N Distribution between Bulk and Rhizospheric Soils
3.4. Applied N Recovery in Plant and Soil N Pools
4. Discussion
4.1. Crop N Uptake
4.2. Soil N Pools
4.3. Comparison between Bulk and Rhizospheric Soils
5. Conclusions
Author Contributions
Funding
Institutional Review Board Statement
Informed Consent Statement
Data Availability Statement
Acknowledgments
Conflicts of Interest
References
- Erisman, J.W.; Sutton, M.A.; Galloway, J.; Klimont, Z.; Winiwarter, W. How a century of ammonia synthesis changed the world. Nat. Geosci. 2008, 1, 636–639. [Google Scholar] [CrossRef]
- Zhu, Z.; Chen, D. Nitrogen fertilizer use in China—Contributions to food production, impacts on the environment and best management strategies. Nutr. Cycl. Agroecosystems 2002, 63, 117–127. [Google Scholar] [CrossRef]
- Haygarth, P.M.; Bardgett, R.D.; Condron, L.M. Phosphorus and nitrogen cycles and their management. In Soil Conditions and Plant Growth; Gregory, P.J., Nortcliff, S., Eds.; Wiley-Blackwell: West Sussex, UK, 2013; pp. 132–159. [Google Scholar]
- Singh, B. Are Nitrogen Fertilizers Deleterious to Soil Health? Agronomy 2018, 8, 48. [Google Scholar] [CrossRef] [Green Version]
- Calabi-Floody, M.; Medina, J.; Rumpel, C.; Condron, L.M.; Hernandez, M.; Dumont, M.; de la Luz Mora, M. Smart Fertilizers as a Strategy for Sustainable Agriculture. Adv. Agron. 2018, 147, 119–157. [Google Scholar] [CrossRef]
- Zahid, A.; Ali, S.; Ahmed, M.; Iqbal, N. Improvement of Soil Health through Residue Management and Conservation Tillage in Rice-Wheat Cropping System of Punjab, Pakistan. Agronomy 2020, 10, 1844. [Google Scholar] [CrossRef]
- Jiang, D.; Zhuang, D.; Fu, J.; Huang, Y.; Wen, K. Bioenergy potential from crop residues in China: Availability and distribution. Renew. Sustain. Energy Rev. 2012, 16, 1377–1382. [Google Scholar] [CrossRef]
- Quan, Z.; Li, S.; Zhu, F.; Zhang, L.; He, J.; Wei, W.; Fang, Y. Fates of 15N-labeled fertilizer in a black soil-maize system and the response to straw incorporation in Northeast China. J. Soils Sediments 2017, 18, 1441–1452. [Google Scholar] [CrossRef]
- Qiu, S.-J.; Peng, P.-Q.; Li, L.; He, P.; Liu, Q.; Wu, J.-S.; Christie, P.; Ju, X.-T. Effects of applied urea and straw on various nitrogen fractions in two Chinese paddy soils with differing clay mineralogy. Biol. Fertil. Soils 2011, 48, 161–172. [Google Scholar] [CrossRef]
- Zhang, L.; Zheng, J.; Chen, L.; Shen, M.; Zhang, X.; Zhang, M.; Bian, X.; Zhang, J.; Zhang, W. Integrative effects of soil tillage and straw management on crop yields and greenhouse gas emissions in a rice–wheat cropping system. Eur. J. Agron. 2015, 63, 47–54. [Google Scholar] [CrossRef]
- Toukabri, W.; Ferchichi, N.; Hlel, D.; Jadlaoui, M.; Kheriji, O.; Zribi, F.; Taamalli, W.; Mhamdi, R.; Trabelsi, D. Improvements of Durum Wheat Main Crop in Weed Control, Productivity and Grain Quality through the Inclusion of FenuGreek and Clover as Companion Plants: Effect of N FertilizaTion Regime. Agronomy 2020, 11, 78. [Google Scholar] [CrossRef]
- Kuzyakov, Y.; Xu, X. Competition between roots and microorganisms for nitrogen: Mecha-nisms and ecological relevance. New Phytol. 2013, 198, 656–669. [Google Scholar] [CrossRef] [PubMed]
- Blagodatskaya, E.; Dannenmann, M.; Gasche, R.; Butterbach-Bahl, K. Microclimate and forest management alter fungal-to-bacterial ratio and N2O-emission during rewetting in the forest floor and mineral soil of mountainous beech forests. Biogeochemistry 2009, 97, 55–70. [Google Scholar] [CrossRef]
- Hodge, A.; Robinson, D.; Fitter, A. Are microorganisms more effective than plants at competing for nitrogen? Trends Plant Sci. 2000, 5, 304–308. [Google Scholar] [CrossRef]
- Zak, D.R.; Pregitzer, K.S.; King, J.S.; Holmes, W.E. Elevated atmospheric CO2, fine roots and the response of soil microorganisms: A review and hypothesis. New Phytol. 2000, 147, 201–222. [Google Scholar] [CrossRef] [Green Version]
- Jungk, A. Root hairs and the acquisition of plant nutrients from soil. J. Plant Nutr. Soil Sci. 2001, 164, 121–129. [Google Scholar] [CrossRef]
- Tinker, P.B.; Nye, P. Solute Movement in the Rhizosphere; Oxford University Press (OUP): Oxford, UK, 2000. [Google Scholar]
- Bais, H.P.; Weir, T.L.; Perry, L.G.; Gilroy, S.; Vivanco, J.M. The role of root exudates in rhizosphere interactions with plants and other organisms. Annu. Rev. Plant Biol. 2006, 57, 233–266. [Google Scholar] [CrossRef] [Green Version]
- Matimati, I.; Verboom, G.A.; Cramer, M.D. Nitrogen regulation of transpiration controls mass-flow acquisition of nutrients. J. Exp. Bot. 2014, 65, 159–168. [Google Scholar] [CrossRef] [Green Version]
- Qiu, S.; Gao, H.; Zhu, P.; Hou, Y.; Zhao, S.; Rong, X.; Zhang, Y.; He, P.; Christie, P.; Zhou, W. Changes in soil carbon and nitrogen pools in a Mollisol after long-term fallow or application of chemical fertilizers, straw or manures. Soil Tillage Res. 2016, 163, 255–265. [Google Scholar] [CrossRef]
- Luce, M.S.; Whalen, J.K.; Ziadi, N.; Zebarth, B.J.; Chantigny, M.H. Labile organic nitrogen transformations in clay and sandy-loam soils amended with 15N-labelled faba bean and wheat residues. Soil Biol. Biochem. 2014, 68, 208–218. [Google Scholar] [CrossRef]
- Jones, D.L.; Shannon, D.; Murphy, D.; Farrar, J. Role of dissolved organic nitrogen (DON) in soil N cycling in grassland soils. Soil Biol. Biochem. 2004, 36, 749–756. [Google Scholar] [CrossRef]
- Kalbitz, K.; Solinger, S.; Park, J.-H.; Michalzik, B.; Matzner, E. Controls on the dynamics of dissolved organic matter in soils: A review. Soil Sci. 2000, 165, 277–304. [Google Scholar] [CrossRef]
- Gregorich, E.; Beare, M.; McKim, U.F.; Skjemstad, J.O. Chemical and Biological Characteristics of Physically Uncomplexed Organic Matter. Soil Sci. Soc. Am. J. 2006, 70, 975–985. [Google Scholar] [CrossRef]
- He, Y.; Zhang, W.; Xu, M.; Tong, X.; Sun, F.; Wang, J.; Huang, S.; Zhu, P.; He, X. Long-term combined chemical and manure fertilizations increase soil organic carbon and total nitrogen in aggregate fractions at three typical cropland soils in China. Sci. Total Environ. 2015, 532, 635–644. [Google Scholar] [CrossRef] [PubMed]
- Lutzow, M.V.; Kögel-Knabner, I.; Ekschmitt, K.; Matzner, E.; Guggenberger, G.; Marschner, B.; Flessa, H. Stabilization of organic matter in temperate soils: Mechanisms and their relevance under different soil conditions—A review. Eur. J. Soil Sci. 2006, 57, 426–445. [Google Scholar] [CrossRef]
- Sokol, N.W.; Sanderman, J.; Bradford, M. Pathways of mineral-associated soil organic matter formation: Integrating the role of plant carbon source, chemistry, and point of entry. Glob. Chang. Biol. 2019, 25, 12–24. [Google Scholar] [CrossRef] [Green Version]
- He, H.; Zhang, W.; Zhang, X.; Xie, H.; Zhuang, J. Temporal responses of soil microorganisms to substrate addition as indicated by amino sugar differentiation. Soil Biol. Biochem. 2011, 43, 1155–1161. [Google Scholar] [CrossRef]
- Fontaine, S.; Henault, C.; Aamor, A.; Bdioui, N.; Bloor, J.M.; Maire, V.; Mary, B.; Revaillot, S.; Maron, P. Fungi mediate long term sequestration of carbon and nitrogen in soil through their priming effect. Soil Biol. Biochem. 2011, 43, 86–96. [Google Scholar] [CrossRef]
- Pan, F.-F.; Yu, W.-T.; Ma, Q.; Zhou, H.; Jiang, C.-M.; Xu, Y.-G.; Ren, J.-F. Influence of 15N-labeled ammonium sulfate and straw on nitrogen retention and supply in different fertility soils. Biol. Fertil. Soils 2017, 53, 303–313. [Google Scholar] [CrossRef]
- Said-Pullicino, D.; Cucu, M.A.; Sodano, M.; Birk, J.J.; Glaser, B.; Celi, L.R. Nitrogen immobilization in paddy soils as affected by redox conditions and rice straw incorporation. Geoderma 2014, 228–229, 44–53. [Google Scholar] [CrossRef] [Green Version]
- Bai, J.; Qiu, S.; Jin, L.; Wei, D.; Xu, X.; Zhao, S.; He, P.; Wang, L.; Christie, P.; Zhou, W. Quantifying soil N pools and N2O emissions after application of chemical fertilizer and straw to a typical chernozem soil. Biol. Fertil. Soils 2020, 56, 319–329. [Google Scholar] [CrossRef]
- Wang, L.; Zheng, X.; Tian, F.; Xin, J.; Nai, H. Soluble organic nitrogen cycling in soils after application of chemical/organic amendments and groundwater pollution implications. J. Contam. Hydrol. 2018, 217, 43–51. [Google Scholar] [CrossRef]
- Boerma, J.A.K.; Luo, G.; Huang, B. People’s Republic of China, reference soils of the Liaohe plain, Liaoning Province. In Soil Brief CN 10; The Institute of Soil Science, Academica Sinica: Nanjing, China; International Soil Reference and Information Centre: Wageningen, The Netherlands, 1995; p. 20. [Google Scholar]
- Zhu, Z.L.; Wen, Q.X.; Freney, J.R. Nitrogen in Soils of China; Kluwer Academic Publishers: Dordrecht, The Netherlands, 1997. [Google Scholar]
- Peng, Y.; Yu, P.; Zhang, Y.; Sun, G.; Ning, P.; Li, X.; Li, C. Temporal and spatial dynamics in root length density of field-grown maize and NPK in the soil profile. Field Crop. Res. 2012, 131, 9–16. [Google Scholar] [CrossRef]
- Kuo, S. Phosphorus. In Methods of Soil Analysis: Part 3. Chemical Methods; Bigham, J.M., Ed.; Soil Science Society of America: Madison, WI, USA; American Society of Agronomy: Madison, WI, USA, 1996; pp. 869–919. [Google Scholar]
- Hauck, R.D.; Hauck, R.D.; Meisinger, J.J.; Meisinger, J.J.; Mulvaney, R.; Mulvaney, R.; Bottomley, P.; Bottomley, P.; Angle, J.; Angle, J.; et al. Practical Considerations in the Use of Nitrogen Tracers in Agricultural and Environmental Research. Methods Soil Anal. Part 5 Mineral. Methods 2018, 907–950. [Google Scholar] [CrossRef]
- Brookes, P.; Landman, A.; Pruden, G.; Jenkinson, D. Chloroform fumigation and the release of soil nitrogen: A rapid direct extraction method to measure microbial biomass nitrogen in soil. Soil Biol. Biochem. 1985, 17, 837–842. [Google Scholar] [CrossRef]
- Jenkinson, D.S. Determination of microbial biomass carbon and nitrogen in soil. In Advances in Nitrogen Cycling in Agricultural Ecosystems; Wilson, J.R., Ed.; CAB International: Wallingford, UK, 1988; pp. 368–386. [Google Scholar]
- Cookson, W.; Osman, M.; Marschner, P.; Abaye, D.; Clark, I.; Murphy, D.; Stockdale, E.; Watson, C. Controls on soil nitrogen cycling and microbial community composition across land use and incubation temperature. Soil Biol. Biochem. 2007, 39, 744–756. [Google Scholar] [CrossRef]
- Bronson, K.F.; Zobeck, T.M.; Chua, T.T.; Acosta-Martinez, V.; Van Pelt, R.S.; Booker, J.D. Carbon and Nitrogen Pools of Southern High Plains Cropland and Grassland Soils. Soil Sci. Soc. Am. J. 2004, 68, 1695–1704. [Google Scholar] [CrossRef] [Green Version]
- Parija, B.; Kumar, M. Dry matter partitioning and grain yield potential of maize (Zea mays L.) under different levels of farmyard manure and nitrogen. J. Plant Sci. Res. 2013, 29, 177–180. [Google Scholar]
- Mueller, S.M.; Vyn, T.J. Maize Plant Resilience to N Stress and Post-silking N Capacity Changes over Time: A Review. Front. Plant Sci. 2016, 7, 53. [Google Scholar] [CrossRef] [PubMed] [Green Version]
- Głąb, T.; Gondek, K.; Mierzwa-Hersztek, M.; Szewczyk, W. Effects of Straw and Biochar Amendments on Grassland Productivity and Root Morphology. Agronomy 2020, 10, 1794. [Google Scholar] [CrossRef]
- Li, Z.; Li, D.; Ma, L.; Yu, Y.; Zhao, B.; Zhang, J. Effects of straw management and nitrogen application rate on soil organic matter fractions and microbial properties in North China Plain. J. Soils Sediments 2019, 19, 618–628. [Google Scholar] [CrossRef]
- Wang, Z.; Wang, Z.; Luo, Y.; Zhan, Y.-N.; Meng, Y.-L.; Zhou, Z.-G. Biochar increases 15N fertilizer retention and indigenous soil N uptake in a cotton-barley rotation system. Geoderma 2020, 357, 113944. [Google Scholar] [CrossRef]
- Hebbar, K.B.; Rane, J.; Ramana, S.; Panwar, N.R.; Ajay, S.; Rao, A.S.; Prasad, P.V.V. Natural variation in the regulation of leaf senescence and relation to N and root traits in wheat. Plant Soil 2014, 378, 99–112. [Google Scholar] [CrossRef]
- Lehmann, J.; Zech, W. Fine root turnover of irrigated hedgerow intercropping in Northern Kenya. Plant Soil 1998, 198, 19–31. [Google Scholar] [CrossRef]
- Ciampitti, I.A.; Vyn, T.J. Grain Nitrogen Source Changes over Time in Maize: A Review. Crop. Sci. 2013, 53, 366–377. [Google Scholar] [CrossRef] [Green Version]
- Li, Z.; Zhao, B.; Olk, D.C.; Jia, Z.; Mao, J.; Cai, Y.; Zhang, J. Contributions of residue-C and -N to plant growth and soil organic matter pools under planted and unplanted conditions. Soil Biol. Biochem. 2018, 120, 91–104. [Google Scholar] [CrossRef]
- Duong, T.; Baumann, K.; Marschner, P. Frequent addition of wheat straw residues to soil enhances carbon mineralization rate. Soil Biol. Biochem. 2009, 41, 1475–1482. [Google Scholar] [CrossRef]
- Luxhøi, J.; Elsgaard, L.; Thomsen, I.K.; Jensen, L.S. Effects of long-term annual inputs of straw and organic manure on plant N uptake and soil N fluxes. Soil Use Manag. 2007, 23, 368–373. [Google Scholar] [CrossRef]
- Burger, M.; Jackson, L.E. Microbial immobilization of ammonium and nitrate in relation to ammonification and nitrification rates in organic and conventional cropping systems. Soil Biol. Biochem. 2003, 35, 29–36. [Google Scholar] [CrossRef]
- Zhao, W.; Liang, B.; Yang, X.; Zhou, J. Fate of residual 15 N-labeled fertilizer in dryland farming systems on soils of contrasting fertility. Soil Sci. Plant Nutr. 2015, 61, 1–10. [Google Scholar] [CrossRef] [Green Version]
- Henry, F.; Nguyen, C.; Paterson, E.; Sim, A.; Robin, C. How does nitrogen availability alter rhizodeposition in Lolium multiflorum Lam. during vegetative growth? Plant Soil 2005, 269, 181–191. [Google Scholar] [CrossRef]
- Nicolardot, B.; Recous, S.; Mary, B. Simulation of C and N mineralisation during crop residue decomposition: A simple dynamic model based on the C:N ratio of the residues. Plant Soil 2001, 228, 83–103. [Google Scholar] [CrossRef]
- Singh, B.; Rengel, Z.; Bowden, J.W. A quantitative size-density separation method to recover and characterise decomposing crop residues added to soil. Biol. Fertil. Soils 2009, 45, 423–434. [Google Scholar] [CrossRef]
- Diochon, A.; Gillespie, A.W.; Ellert, B.H.; Janzen, H.H.; Gregorich, E. Recovery and dynamics of decomposing plant residue in soil: An evaluation of three fractionation methods. Eur. J. Soil Sci. 2016, 67, 196–205. [Google Scholar] [CrossRef]
- Chantigny, M.H.; Angers, D.A.; Beauchamp, C.J. Aggregation and Organic Matter Decomposition in Soils Amended with De-Inking Paper Sludge. Soil Sci. Soc. Am. J. 1999, 63, 1214–1221. [Google Scholar] [CrossRef]
- Qiu, S.; Xie, J.; Zhao, S.; Xu, X.; Hou, Y.; Wang, X.; Zhou, W.; He, P.; Johnston, A.M.; Christie, P.; et al. Long-term effects of potassium fertilization on yield, efficiency, and soil fertility status in a rain-fed maize system in northeast China. Field Crop. Res. 2014, 163, 1–9. [Google Scholar] [CrossRef]


| Organic C | Total N | Olsen P | NH4OAc-Extractable K | pH (units) | Soil Texture (%) | ||
|---|---|---|---|---|---|---|---|
| (g kg−1) | (g kg−1) | (mg kg−1) | (mg kg−1) | Sand | Silt | Clay | |
| 19.4 | 1.8 | 9.6 | 155.9 | 6.9 | 27.4 | 48 | 24.6 |
| Treatment | N Source | Stage | Concentration | Percentage | ||||||||||
|---|---|---|---|---|---|---|---|---|---|---|---|---|---|---|
| TN | Inorg-N | DON | MBN | PON | MTN | TN | Inorg-N | DON | MBN | PON | MTN | |||
| U | Urea N | V8 | **, + | **, − | nd | nd | **, + | **, + | *, + | **, − | nd | nd | *, + | *, + |
| R1 | **, + | **, + | **, + | **, + | *, − | **, + | **, + | *, + | *, + | **, + | *, − | **, + | ||
| R3 | *, + | **, + | ns, − | **, + | **, − | **, + | **, + | **, + | ns, + | **, + | *, − | **, + | ||
| R6 | **, + | **, + | ns, + | **, + | *, − | *, + | **, + | **, + | ns, + | **, + | *, − | **, + | ||
| US | Urea N + Straw N | V8 | ns, + | **, − | nd | *, − | *, + | **, + | ns, − | *, − | nd | *, − | **, + | **, + |
| R1 | ns, + | **, + | **, + | *, − | **, − | **, + | ns, − | *, + | **, + | **, − | **, − | **, + | ||
| R3 | **, − | **, + | ns, − | **, − | **, − | *, + | ns, + | **, + | ns, + | **, − | **, − | *, + | ||
| R6 | **, − | **, + | ns, + | **, − | **, − | *, + | ns, + | *, + | ns, + | **, − | **, − | **, + | ||
| Urea N | V8 | ns, + | **, − | nd | *, − | *, + | *, + | ns, − | *, − | nd | *, − | *, + | *, + | |
| R1 | ns, + | *, + | **, + | **, − | **, − | **, + | ns, + | *, + | **, + | **, − | **, − | **, + | ||
| R3 | **, − | **, + | ns, − | **, − | **, − | *, + | ns, + | **, + | ns, + | **, − | **, − | *, + | ||
| R6 | **, − | **+ | ns, + | **, − | **, − | *, + | ns, + | *, + | ns, + | **, − | *, − | **+ | ||
| Straw N | V8 | ns, + | *, − | nd | ns, + | *, + | **, + | ns, − | *, − | n.d. | ns, − | **, + | *, + | |
| R1 | *, − | *, + | ns, + | ns, + | *, − | *, + | ns, − | *, + | ns, + | ns, + | **, − | *, + | ||
| R3 | *, − | *, + | ns, − | ns, + | **, − | *, + | ns, + | *, + | ns, + | ns, + | *, − | **, + | ||
| R6 | **, − | *, + | ns, − | ns, + | *, − | *, + | ns, + | **, + | ns, + | ns, + | *, − | **, + | ||
| Treatment | N Source | Plant Parts | Whole Plant | Soil Pools | Soil Total N | N Loss | ||||||
|---|---|---|---|---|---|---|---|---|---|---|---|---|
| Roots | Shoots | Grains | Inorg-N (×10−2) | DON (×10−2) | MBN | PON | MTN | |||||
| U | Urea | 4.5 ± 0.1 a | 67.0 ± 1.1 a | 46.9 ± 0.8 a | 71.5 ± 2.3 a | 1.2 ± 0.07 ab | 20.0 ± 0.4 b | 2.1 ± 0.05 c | 2.6 ± 0.2 c | 13.6 ± 0.4 c | 18.5 ± 0.8 c | 10.0 ± 1.1 a |
| US | Urea | 5.3 ± 0.2 a | 49.6 ± 2.1 b | 32.7 ± 1.7 b | 54.9 ± 1.7 b | 0.8 ± 0.06 b | 33.5 ± 2.8 a | 7.5 ± 0.8 a | 8.3 ± 1.6 b | 37.7 ± 1.8 b | 40.5 ± 1.1 b | 4.6 ± 0.5 b |
| Straw | 2.7 ± 0.1 b | 23.3 ± 1.6 c | 15.7 ± 1.3 c | 26.0 ± 1.1 c | 1.9 ± 0.04 a | 32.3 ± 3.0 a | 6.5 ± 0.2 b | 11.7 ± 0.3 a | 50.2 ± 1.2 a | 74.9 ± 2.3 a | 0 | |
Publisher’s Note: MDPI stays neutral with regard to jurisdictional claims in published maps and institutional affiliations. |
© 2021 by the authors. Licensee MDPI, Basel, Switzerland. This article is an open access article distributed under the terms and conditions of the Creative Commons Attribution (CC BY) license (https://creativecommons.org/licenses/by/4.0/).
Share and Cite
Zhang, J.; He, P.; Wei, D.; Jin, L.; Zhang, L.; Li, L.; Zhao, S.; Xu, X.; Zhou, W.; Qiu, S. Changes in Nitrogen Pools in the Maize–Soil System after Urea or Straw Application to a Typical Intensive Agricultural Soil: A 15N Tracer Study. Agronomy 2021, 11, 1134. https://doi.org/10.3390/agronomy11061134
Zhang J, He P, Wei D, Jin L, Zhang L, Li L, Zhao S, Xu X, Zhou W, Qiu S. Changes in Nitrogen Pools in the Maize–Soil System after Urea or Straw Application to a Typical Intensive Agricultural Soil: A 15N Tracer Study. Agronomy. 2021; 11(6):1134. https://doi.org/10.3390/agronomy11061134
Chicago/Turabian StyleZhang, Jie, Ping He, Dan Wei, Liang Jin, Lijuan Zhang, Ling Li, Shicheng Zhao, Xinpeng Xu, Wei Zhou, and Shaojun Qiu. 2021. "Changes in Nitrogen Pools in the Maize–Soil System after Urea or Straw Application to a Typical Intensive Agricultural Soil: A 15N Tracer Study" Agronomy 11, no. 6: 1134. https://doi.org/10.3390/agronomy11061134