Article

Water Table Fluctuation and Methane Emission in Pineapples (Ananas comosus (L.) Merr.) Cultivated on a Tropical Peatland

by
Wendy Luta
1,
Osumanu Haruna Ahmed
1,2,3,
Latifah Omar
1,2,*,
Roland Kueh Jui Heng
2,3,4,
Liza Nuriati Lim Kim Choo
5,
Mohamadu Boyie Jalloh
6,
Adiza Alhassan Musah
7 and
Arifin Abdu
8
1
Department of Crop Science, Faculty of Agricultural and Forestry Science, Universiti Putra Malaysia Bintulu Sarawak Campus, Bintulu 97008, Sarawak, Malaysia
2
Institut Ekosains Borneo, Universiti Putra Malaysia Bintulu Sarawak Campus, Bintulu 97008, Sarawak, Malaysia
3
Institute of Tropical Agriculture and Food Security (ITAFoS), Universiti Putra Malaysia, Serdang 43400, Selangor Darul Ehsan, Malaysia
4
Department of Forestry Science, Faculty of Agricultural and Forestry Science, Universiti Putra Malaysia Bintulu Sarawak Campus, Bintulu 97008, Sarawak, Malaysia
5
Soil Science, Water and Fertilizer Research Centre, Malaysian Agricultural Research and Development Institute (MARDI), Roban, Saratok 95300, Sarawak, Malaysia
6
Faculty of Sustainable Agriculture, Universiti Malaysia Sabah, Sandakan Branch, Locked Bag No. 3, Sandakan 90509, Sabah, Malaysia
7
Faculty of Business Management and Professional Studies, Management and Science University, University Drive, Off Persiaran Olahraga Section 13, Shah Alam 40100, Selangor, Malaysia
8
Department of Forest Management, Faculty of Forestry and Environment, Universiti Putra Malaysia, Selangor 43400, Malaysia
*
Author to whom correspondence should be addressed.
Agronomy 2021, 11(8), 1448; https://doi.org/10.3390/agronomy11081448
Submission received: 22 April 2021 / Revised: 8 June 2021 / Accepted: 10 June 2021 / Published: 21 July 2021

Abstract

:
Inappropriate drainage and agricultural development on tropical peatland may lead to an increase in methane (CH4) emission, thus expediting the rate of global warming and climate change. It was hypothesized that water table fluctuation affects CH4 emission in pineapple cultivation on tropical peat soils. The objectives of this study were to: (i) quantify CH4 emission from a tropical peat soil cultivated with pineapple and (ii) determine the effects of water table depth on CH4 emission from a peat soil under simulated water table fluctuation. Soil CH4 emissions from an open field pineapple cultivation system and field lysimeters were determined using the closed chamber method. High-density polyethylene field lysimeters were set up to simulate the natural condition of cultivated drained peat soils under different water table fluctuations. The soil CH4 flux was measured at five time intervals to obtain a 24 h CH4 emission in the dry and wet seasons during low- and high-water tables. Soil CH4 emissions from open field pineapple cultivation were significantly lower compared with field lysimeters under simulated water table fluctuation. Soil CH4 emissions throughout the dry and wet seasons irrespective of water table fluctuation were not affected by soil temperature but emissions were influenced by the balance between methanogenic and methanotrophic microorganisms controlling CH4 production and consumption, CH4 transportation through molecular diffusion via peat pore spaces, and non-microbial CH4 production in peat soils. Findings from the study suggest that water table fluctuation at the soil–water interface relatively controls the soil CH4 emission from lysimeters under simulated low- and high-water table fluctuation. The findings of this study provide an understanding of the effects of water table fluctuation on CH4 emission in a tropical peatland cultivated with pineapple.

1. Introduction

Drained peatlands worldwide emit approximately 2 Gt of carbon dioxide (CO2) through microbial peat oxidation or peat fires representing 5% of all anthropogenic greenhouse gas (GHG) emissions [1]. Carbon dioxide emitted from peatlands has been implicated in the ongoing global warming debate [2]. Unlike CO2, which is cycled and released into the atmosphere, methane (CH4) is emitted mostly from agricultural activities [3]. Methane contributes to significant anthropogenic GHG and the concentration of CH4 is on the increase [4,5]. The pathways of CH4 emissions are through aerobic and anaerobic microbial respiration, root respiration, peat oxidation, nitrification, and denitrification although the determinant factors which affect CH4 emissions are land-use type [6], peat type [7], photosynthetic activities [8], and water table fluctuation [9]. Carbon (C) is transformed and stored in different pools within the C cycle through, for example, burning of fossil fuels or decomposition of soil organic matter in the form of C gases into the atmosphere, whereas photosynthesis locks atmospheric C in plant tissues and deposition of organic-rich sediments on the ocean floor locks C in geologic rocks and sediments.
The increasing interest in reducing CH4 emissions to meet global temperature targets is because of the short atmospheric life span of CH4 which is approximately 10 years, but CH4 has relatively high global warming potential [10]. Current and future regional and global CH4 budgets and mitigation strategies require better quantitative and process-based understanding of CH4 sources, pathways, and removals under climate and land-use change [11]. According to Leifeld [12], peatland rewetting is a cost-effective measure to curb GHG emissions, however, increasing water table depth increases CH4 emissions [13]. Lowering peatland water tables increases peat decomposition rates because of enhanced microbial degradation of organic matter [14]. It must be stressed that the understanding of soil C flux based on studies conducted in boreal and temperate peats is not fully applicable to tropical peatland because of differences in environmental factors, peat soil properties, peat temperature, peatland-use practices, vegetation composition and structure, and microbial diversity and population.
Tropical peatlands are commonly developed for agriculture. Huang et al. [15] reported that agricultural productivity in low latitudes (tropical and semi-tropical) are likely to decline due to climate change which affects world food security and farm incomes because most developing countries, including Malaysia, are located in lower latitude regions. Falling farm incomes will increase poverty and reduce households’ ability to invest for a better future [16]. According to Melling et al. [17], peat soil reclamation for agriculture involves drainage which is characterized by lowering water table and soil compaction to aerate crop root zones. Drainage of tropical peatland may cause loss of soil C reserve. Drainage via lowering of water table could change peatlands from being a C sink to a C source because drainage reverses the C flux into net CO2 emissions [18]. The decomposition of organic materials and microbial activities releases CO2, CH4, organic acids, and organic particulates. The rate of C loss is related to the increased intensity of dry and wet periods. The resultant extreme water table fluctuation could affect the amount and nature of aerobic and anaerobic peat material, which subsequently affect the decomposition of peat material, microbial activity, and the crop growth. A study had revealed that the CH4 emissions from drained tropical peatland for pineapple (Ananas comosus (L.) Merr.) cultivation was lower than those emitted from bare peatland and bare peatland fumigated with chloroform [19]. In this study, our approach is to estimate CH4 emissions from tropical peatland cultivated with pineapple under fluctuating water table. Pineapple could absorb CO2 for photosynthesis to produce carbohydrates in plant tissues. The emissions of CH4 could be reduced through maintaining ground water level because the ground water level below the surface alters the CH4 dynamic by weakening the potential for CH4 production and increasing the potential for CH4 oxidation in the upper peat layers [17,20]. Considering the potential importance of tropical peatlands in the global CH4 budgets [21], it is essential to understand the effects of water table fluctuation on CH4 emissions from tropical peatlands cultivated with, for example, pineapples.
There is lack of standard procedures to measure CH4 emissions in tropical peatlands as reported by Ahmed and Liza [19]. Couwenberg [18] and Burrows et al. [22] suggested that GHG emissions should be measured on the soil surface using a closed chamber method [23,24]. Greenhouse gas monitoring which is conducted using the closed chamber method is limited in space (few cm2) and time (few minutes). To date, there is limited information on CH4 emissions from peatlands which are cultivated with pineapples that are relatively tolerant to peatlands’ acidity. According to a study conducted by Raziah and Alam [25], the contribution of pineapples cultivated on tropical peatlands to CH4 emissions is important because 90% of pineapples are grown on peatlands of Malaysia. In this study, it was hypothesized that peatland water table fluctuation will affect the emission of CH4 in pineapple cultivation on tropical peatlands. This assumption is premised on the fact that peatland water table fluctuation could minimize the CH4 emissions through suppression of the anaerobic decomposition of organic matter (reduction of CO2 by H2) after which it is affected by the balance of CH4 production and oxidation. Also, regulating water table level could control the peatland water temperature because increasing soil temperature leads to an increase in CH4 emission.
The research questions that were addressed in this study were: (i) does water table depth affect CH4 emission from tropical peatlands cultivated with pineapples? and (ii) what is the amount of CH4 emitted from tropical peatland which are cultivated with pineapple in relation to simulated water table fluctuation? The quantification of CH4 emission was carried out in the dry season (July and August 2015) and wet season (September and December 2015) to take into account the effects of temperature. Warm peatlands transformed soil organic C from a C sink to a C source [26] with well-drained soils releasing CO2 to the atmosphere [27]. However, the decomposition of organic matter and peatland temperature in relation to water table fluctuation and CH4 emission from a tropical peatland cultivated with pineapples have scarcely been explored. Thus, this study was carried out to: (i) determine the effects of water table depth and CH4 loss from a tropical peatland cultivated with pineapples; (ii) quantify CH4 loss in a tropical peatland under simulated water table fluctuation; and (iii) determine the effects of water table fluctuation on soil temperature during CH4 emission.
The implication of regulating water table level as an approach to minimizing CH4 emission from a tropical peat soil cultivated with pineapples is an attempt to hinder CH4 emission or consumption. It is well known that the pathways of CH4 emission are diffusion, ebullition, and plant-mediated transport. This study focuses on the loss of CH4 from a tropical peatland cultivated with pineapples because different vegetation growing on the same peatland results in differences in CH4 emission or consumption. According to Hu et al. [28], under forest vegetation, soil served as a net sink of CH4, whereas maize field (Zea mays L.) was essentially CH4 neutral, and a paddy field was a net source of CH4 diffused to the atmosphere. The findings suggested that the water table fluctuation has significant effects on CH4 emission apart from the different crop-mediated transport. Most of the crop mediated transport are focused on the aerenchyma and not on the crassulacean acid metabolism plants such as pineapple. Aerenchyma is a type of plant that has porous root tissue, particularly well developed in wetland plants, which enables diffusive flux of gases from above-ground tissues to root tips [29]. Owing to this, most of the CH4 emission studies on drained peatlands are limited to rice, soybean, and sago [23,30] with little exploration focus on the pineapple [19]. Our approach was not only limited to determining the effects of water table fluctuation on CH4 emitted from a tropical peatland cultivated with pineapples, but it was also focused on the measurements of soil CH4 emission. This study also provides information on the mechanism of CH4 emission from different water table depth and the amount of CH4 emission from dry and wet seasons. This study partly shows that appropriately reclaimed land use on tropical peatlands favours low CH4 emission, and benefits pineapple planters, economy, society, and the environment.

2. Materials and Methods

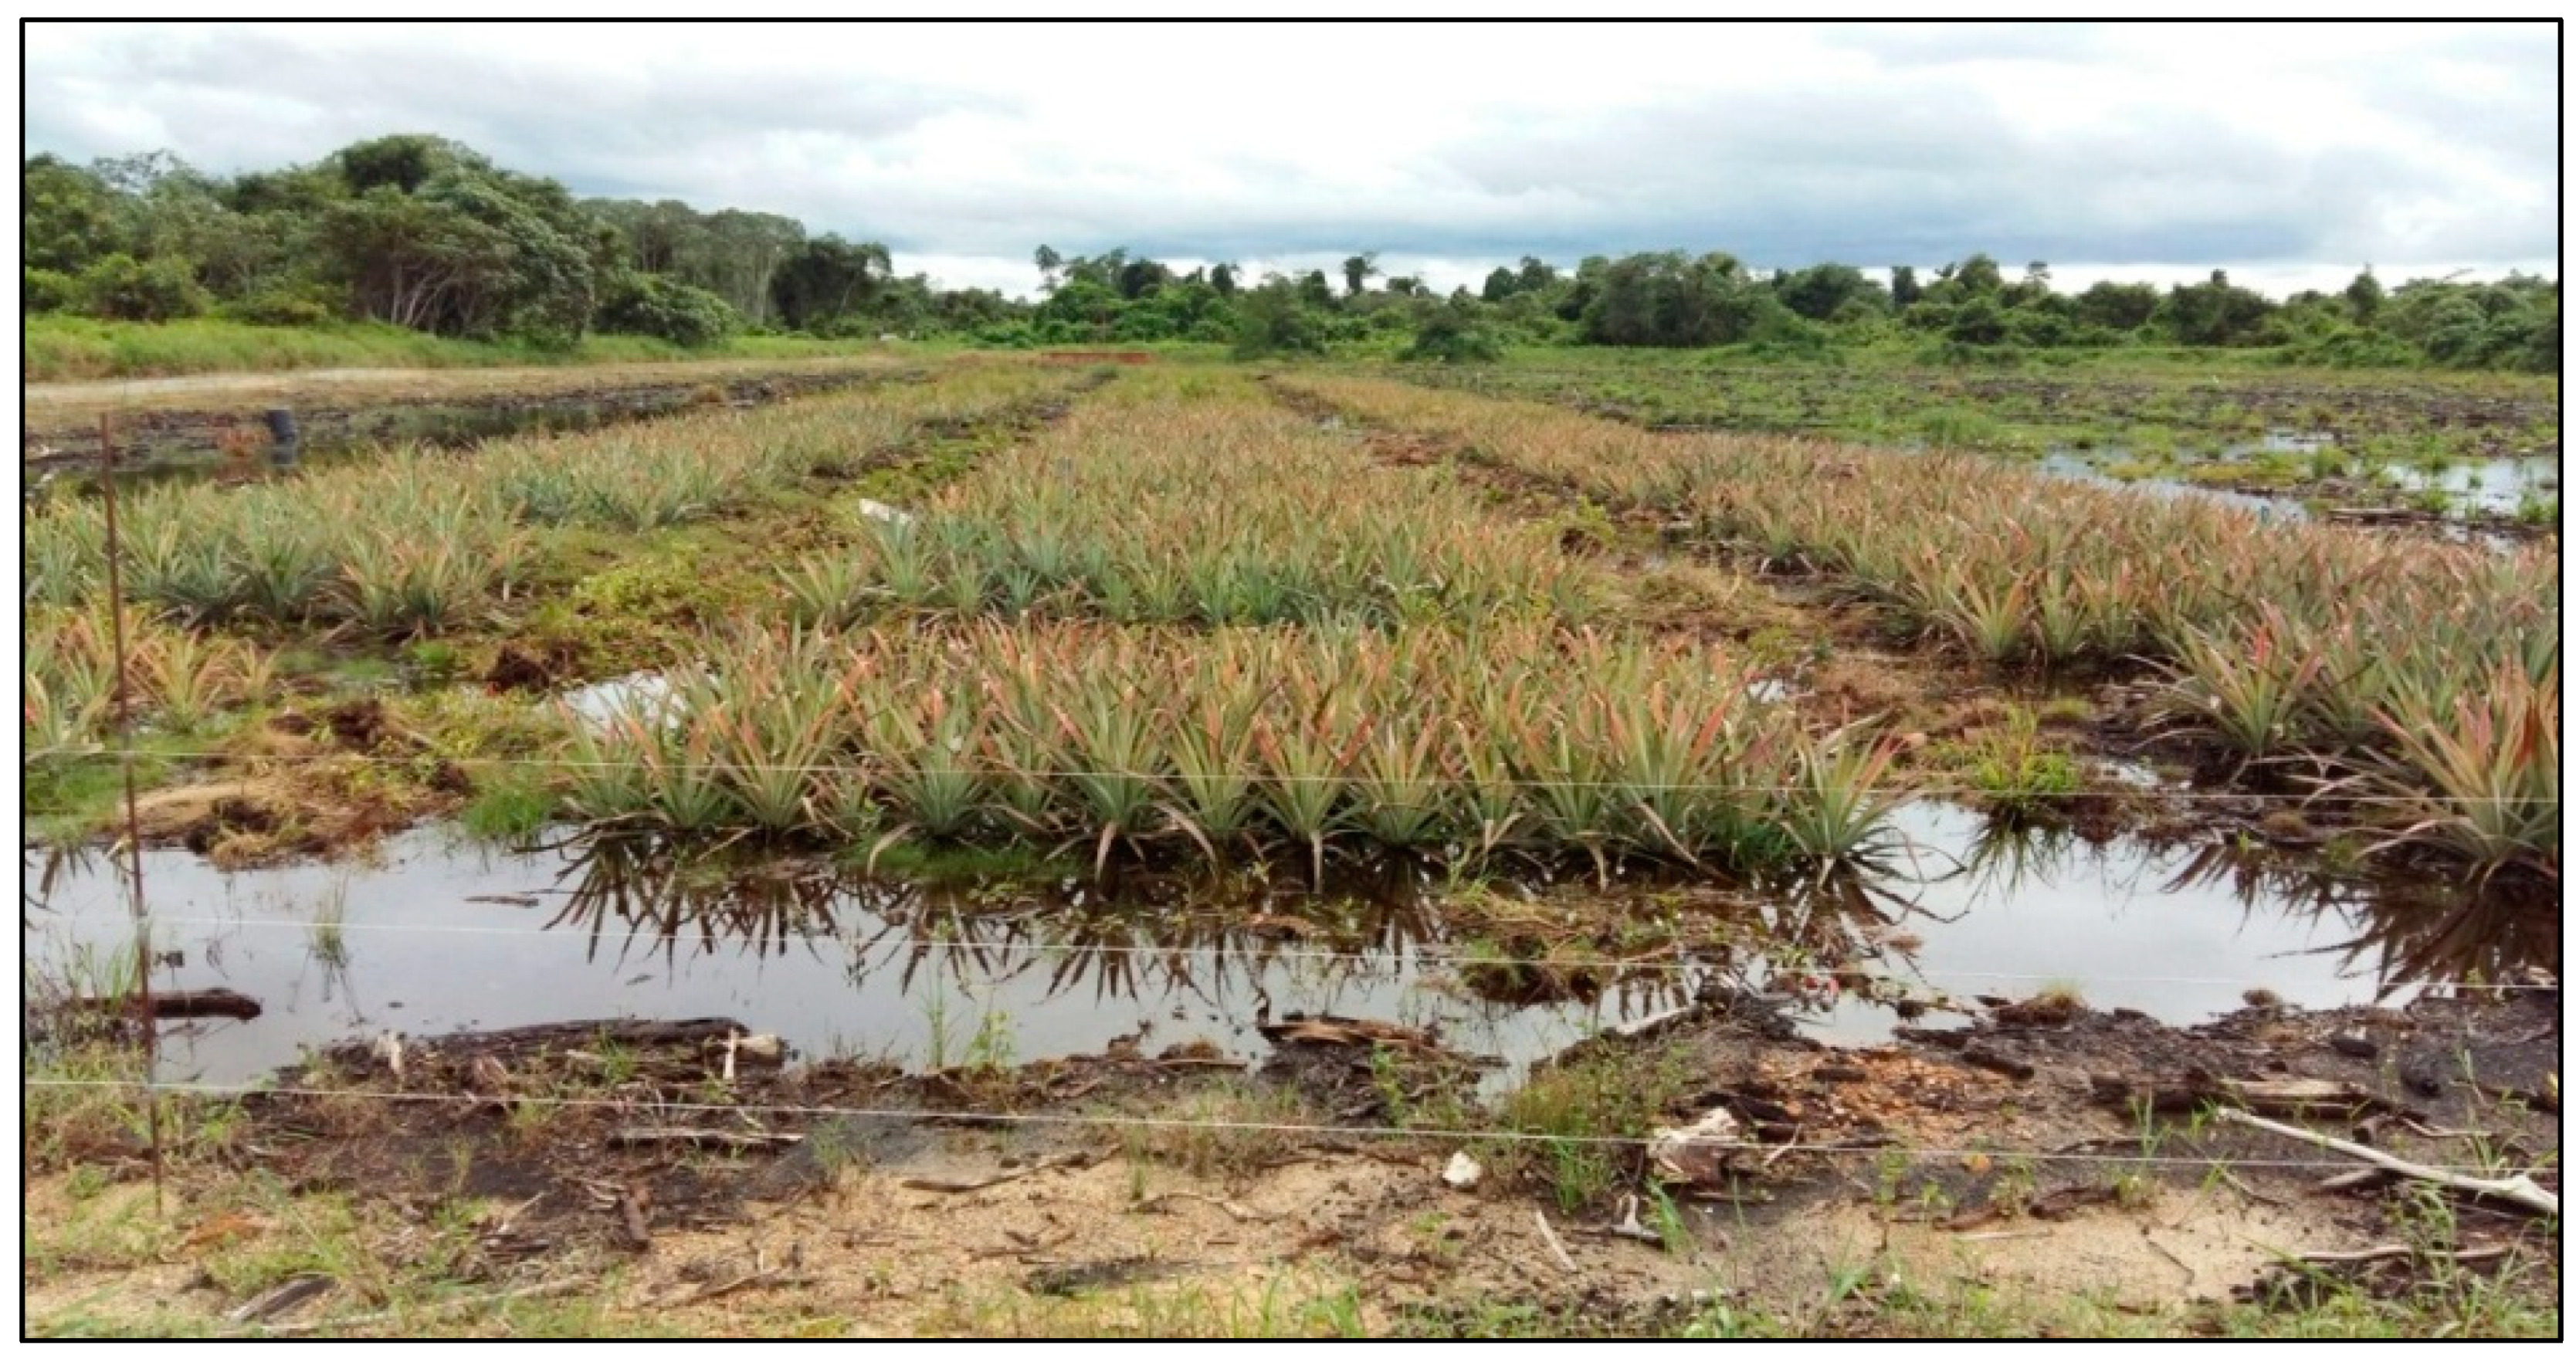
2.1. Site Description for Soil Methane Emission from Field Cultivated with Pineapples

The study was carried out to quantify C losses in the form of CO2 (data on CO2 emissions have been published in 2017) and CH4 in a tropical peatland subjected to water table fluctuation. The study was carried out under field conditions and simulated lysimeter at the Malaysian Agricultural Research and Development Institute (MARDI), Sesang, Saratok, Sarawak, Malaysia (Figure 1). The study area of 387 hectares (ha) was located on the logged-over forest with a flat topography of 5 to 6 m above the mean sea level. Based on the Von Post scale of H7 to H9 [31], the peatland is classified as well decomposed dark brown to dark coloured sapric peat with a strong smell and the thickness of 0.5 to 3.0 m. The average temperature of the area ranges from 22.1 to 31.7 °C while the relative humidity of the area ranges from 61% to 98% humidity with annual mean rainfall of 3749 mm. From November to January (wet season), the monthly rainfall is greater than 400 mm, whereas the mean rainfall during the dry season particularly in July is 189 mm [19]. The area of the peatland cultivated with Moris pineapple was 0.21 hectares (Figure 2). The Moris pineapple were planted in two rows with a planting distance of 30 cm × 60 cm × 90 cm, and the pineapples were managed according to the standard agronomic practices for pineapple management on tropical peat soils. Soil CH4 flux measurements were carried out using the closed chamber method [32] on a 10 m × 10 m plot with five replications. The study was carried in the dry (July and August 2015) and wet (September and December 2015) seasons.

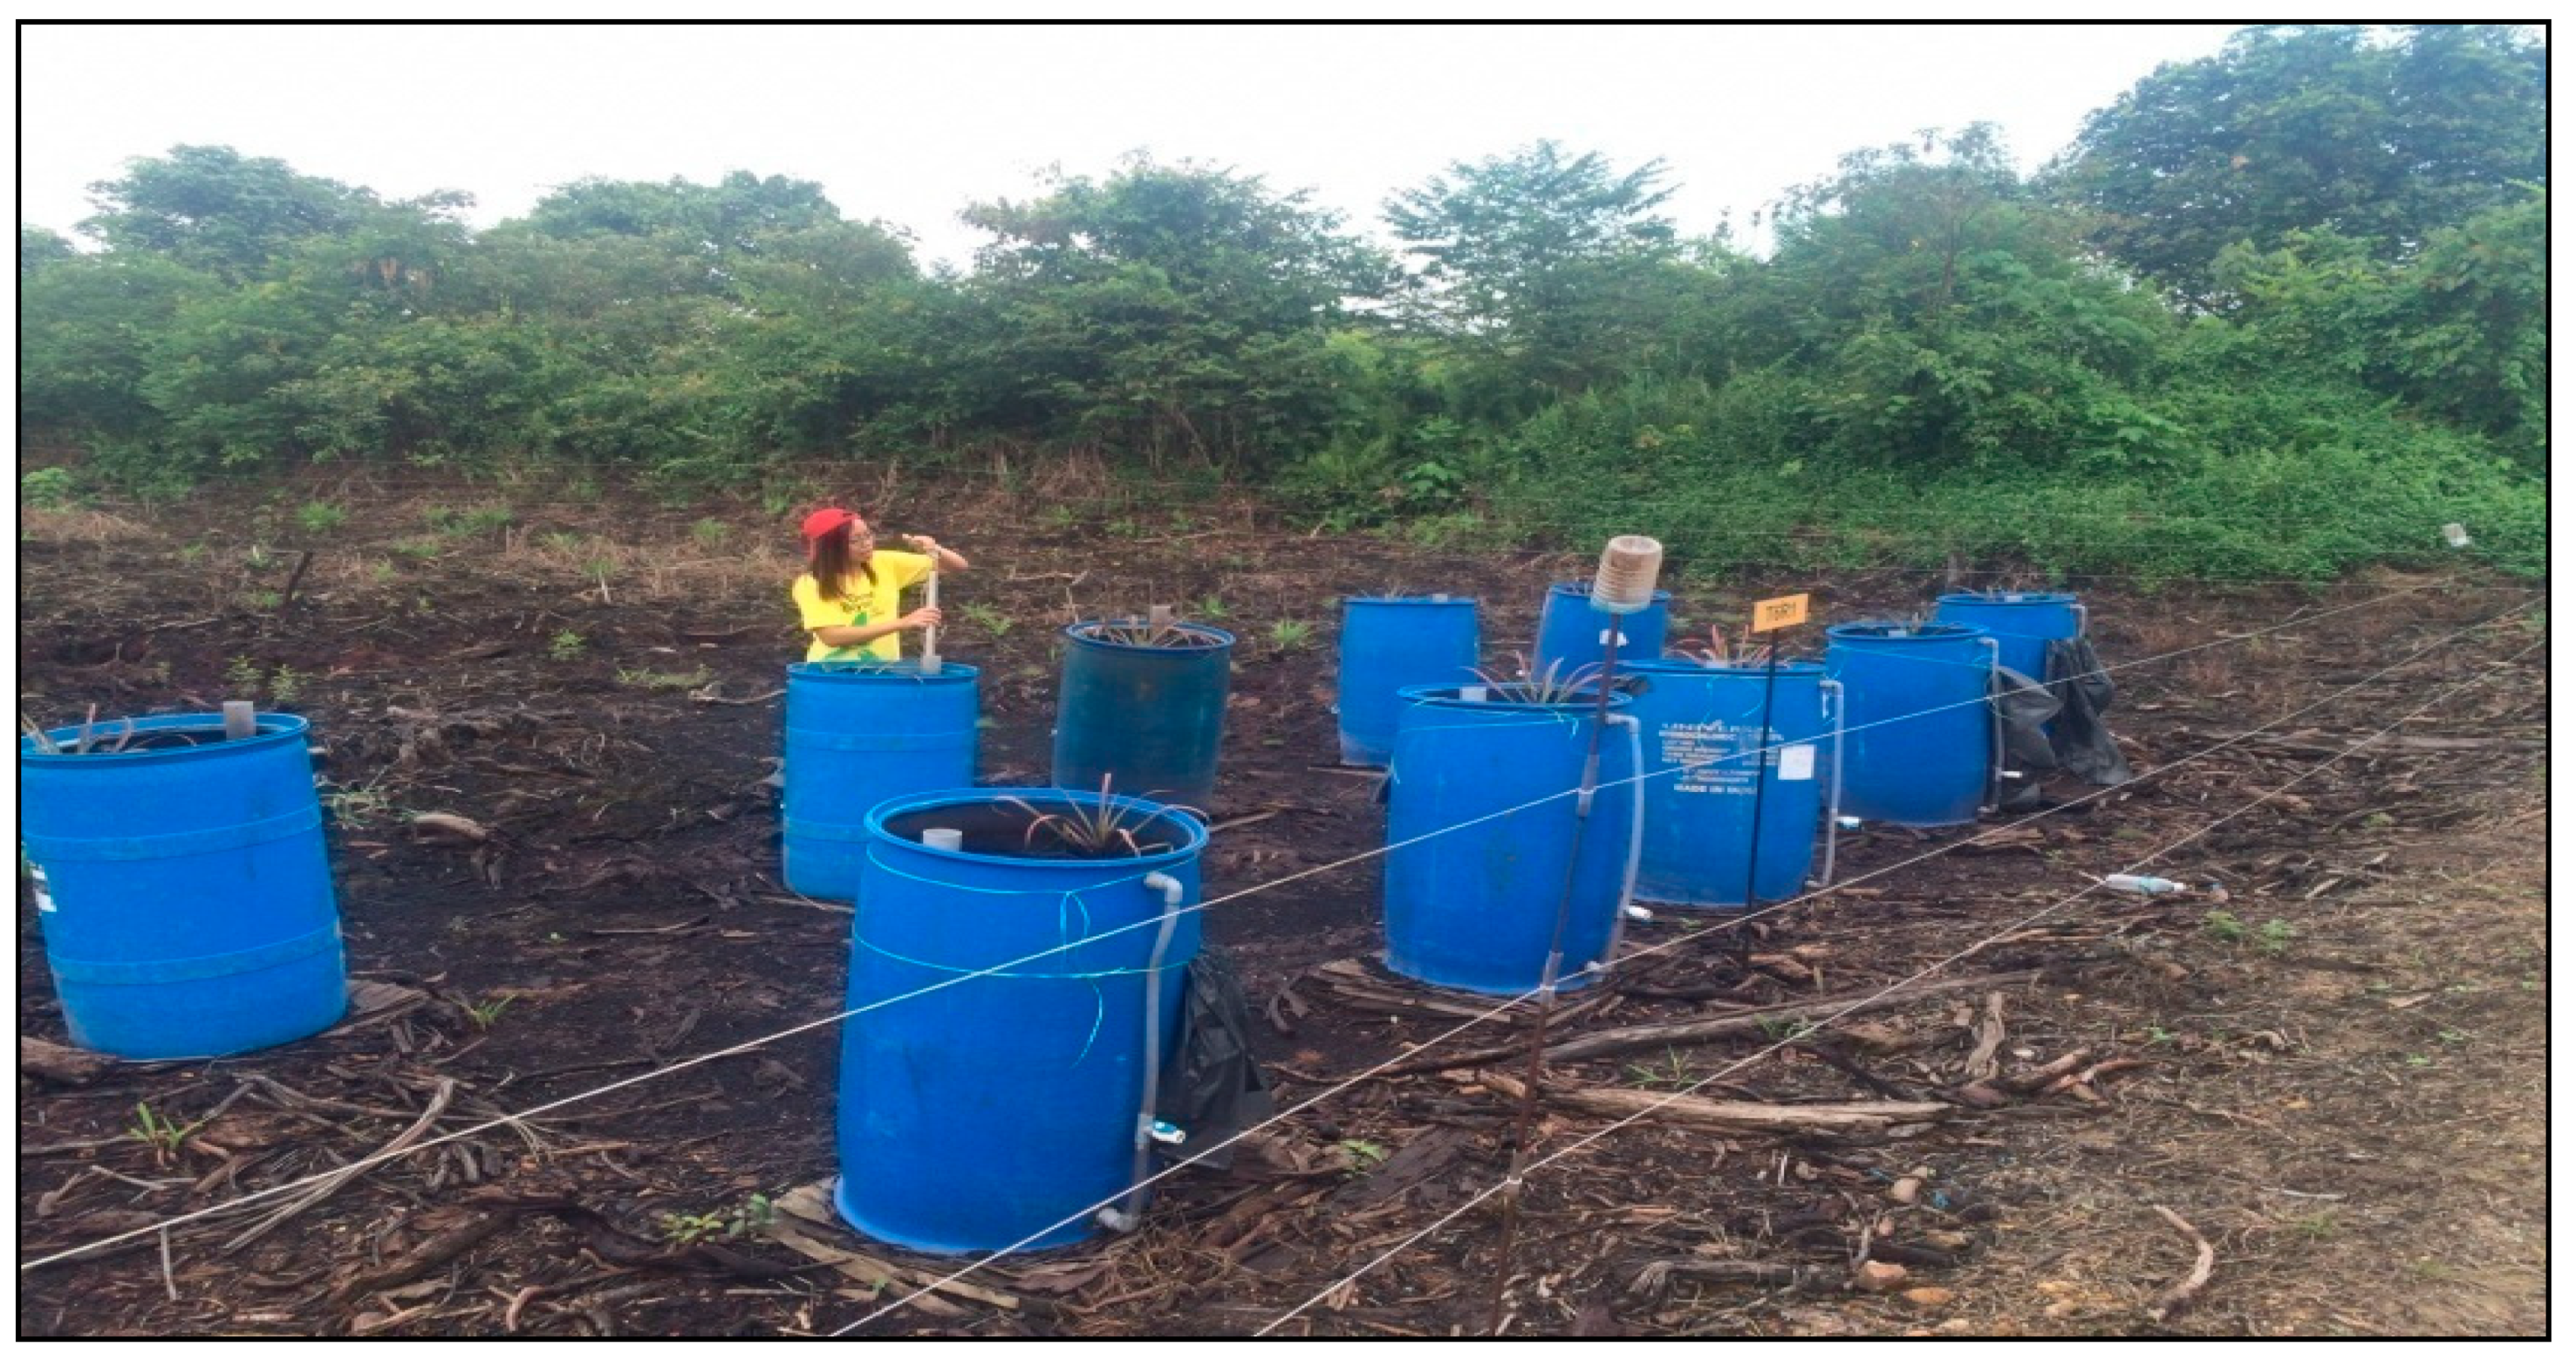
2.2. Establishment of Lysimeters for Methane Estimation under Simulated Water Table Fluctuation

Ten cylindrical field lysimeters made from high-density polyethylene (HDPE), 0.56 m in diameter and 0.97 m in height, were set up to simulate the natural condition of drained tropical peats (Figure 3). The size of the lysimeters used in this study was designed to ensure satisfactory growth and development of the pineapple. The lysimeters were equipped with a water spillage opening which was attached to clear tubes mounted on the outside of the vessel to regulate and monitor water level. Each lysimeter was filled with peat soil up to 0.90 m depth (Figure 3). Water loss from the soil was replenished by showering each lysimeter with rainwater. The amounts of the rainwater added were based on the volume of the fabricated lysimeter and the mean annual rainfall at Saratok, Sarawak, Malaysia. The lysimeters with the peat soil were left in the open field for five months (January to June 2015) to equilibrate. During the modification of the lysimeter, clear tubing and water spillage openings were attached to one side of the lysimeter to regulate and monitor the water level. Before the lysimeter was filled with peat soil, a polyvinyl chloride (PVC) pipe was installed vertically onto the soil to enable the bailer to reach the bottom of the lysimeter (Figure 3). The water table in the lysimeter was controlled by draining excess water through the water spillage opening or watering the peat soil with rainwater to the desired water table depth to simulate the effects of drainage and rainfall. During rainy days, the lysimeter was covered with a plastic cover to maintain a consistent water level. The depth of the water table in the lysimeter was controlled at 0 m and 0.9 m from the soil surface to represent the driest (low water table) and wettest (high water table) months, respectively.

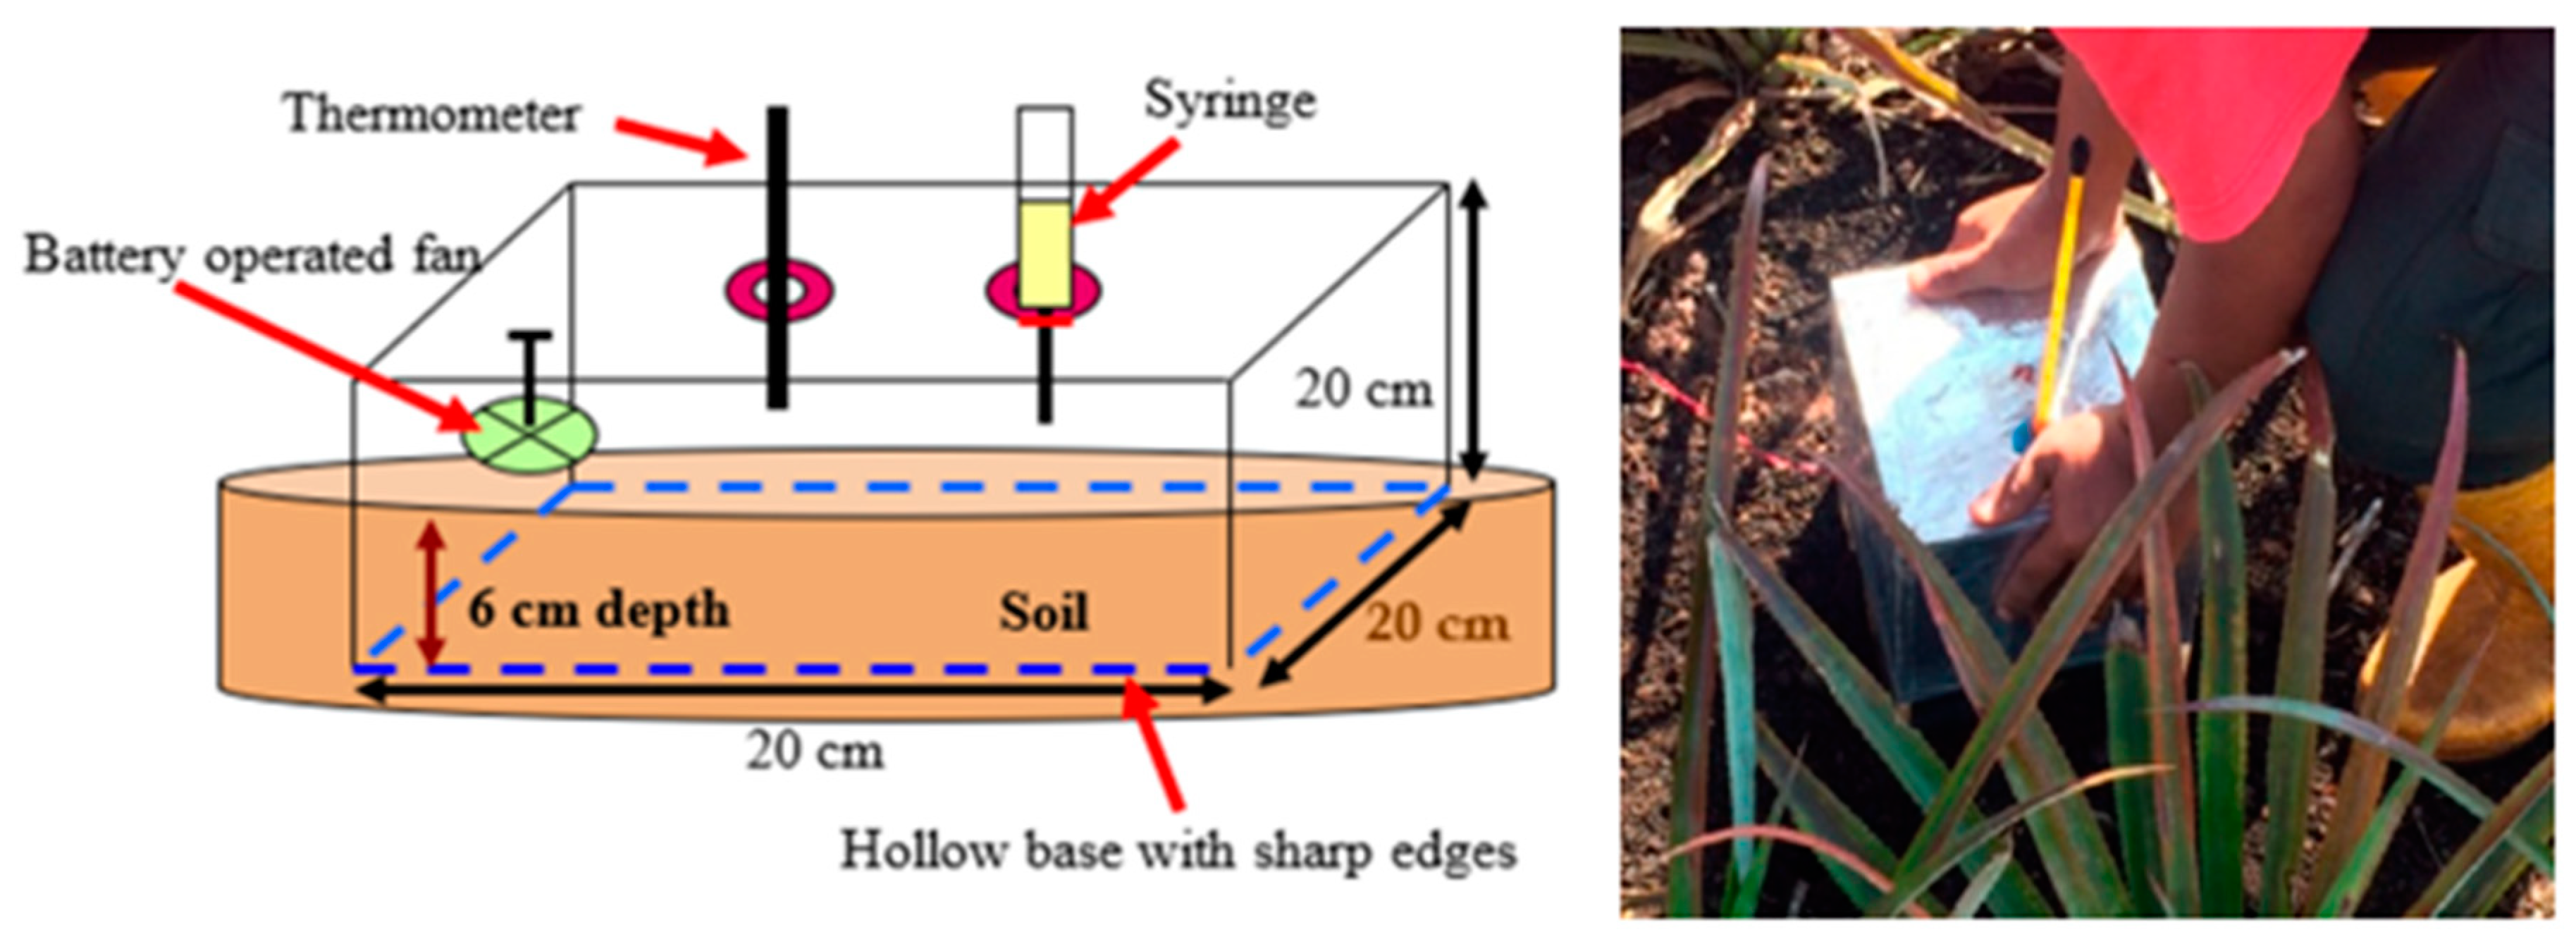
2.3. Estimation of Soil Methane Emission during Water Table Fluctuation

Soil CH4 emissions from the field and lysimeters were measured using the closed chamber method [32]. The CH4 emissions from peatland were quantified using gas chromatography (Agilent 7890A) equipped with a thermal conductivity detector (TCD). The chambers were placed vertically on the soil surface between pineapple plants. The CH4 emissions measurements were carried out on the daily basis of dry and wet months, before total draining of the plot, at 2–4 h intervals over 2–3 days duration to reflect the total of CH4 losses through the soil surface. The size of the closed chamber was 20 cm × 20 cm × 20 cm and made up of acrylic (Figure 4). The top of the chamber was fitted with two sampling ports plugged with a rubber septum for gas sampling and thermometer installation, respectively (Figure 4). A battery-operated fan was also attached to the chamber to allow equilibrium gas pressure in and outside the closed chamber (Figure 4). The chamber was covered with a reflective aluminium foil to minimize the effect of temperature differences within and outside the chamber. The headspace samples of 20 mL were extracted from the chamber at 1, 2, 3, 4, 5 and 6 min using a polypropylene syringe equipped with a three-way stopcock. The extracted CH4 gas was transferred to a 10 mL vacuum vial bottle by a double-ended hypodermic needle to be quantified using gas chromatography (Agilent 7890A, Agilent Technologies Inc., Wilmington, DE, USA) equipped with a flame ionization detector (FID). The values obtained were averaged and converted into units of t ha−1yr−1.
The CH4 flux was calculated from the increase in the chamber concentration over time using the chamber volume and soil area covered, using the following equation:
Flux = [d(CH4)/dt] × PV/ART
where d(CH4)/(dt) is the evolution rate of CH4 within the chamber headspace at a given time after putting the chamber into the soil, P is the atmospheric pressure, V is the volume headspace gas within the chamber, A is the area of the soil closed by the chamber, R is the gas constant, and T is the air temperature [24,32].
The CH4 flux was measured in the early morning I (06:00 to 06:35), afternoon (12:00 to 12:35), evening (18:00 to 18:35), midnight (00:00 to 00:35) and early morning II (06:00 a.m. to 06:35 a.m.) to obtain a 24 h of CH4 emissions. The 24 h measurement was carried out to meet the gas flux measurement requirement based on the procedure described by Ahmed and Liza [19]. The flux measurements were carried out in July and August 2015 for the dry season and in September and December 2015 to represent the concentrations of CH4 emitted in the wet season. Soil temperature at 6 cm depth were measured at the same time of the CH4 flux measurement using a digital thermometer. Rainfall distribution data was collected from a portable weather station (WatchDog 2900ET, Spectrum Technologies Inc., Plainfield, IL, USA) installed at the experimental site. Although CH4 fluxes were only monitored for two cycles for each weather season and results obtained might not be conclusive enough to confirm the findings on the effect of water table fluctuation on CH4 emission, it must be emphasized that time allocated for soil CH4 emission determination per sample was the limitation of this present study. This is because increasing the number of gas flux monitoring cycles are costly and time consuming. For example, a minimum retention time of 6 min is required for a gas sample analysed using gas chromatography, and the total samples for each CH4 flux monitoring cycle were 450 per month.

2.4. Statistical Analysis

Fluctuation of water table in relation to CH4 emission was tested using analysis of variance (ANOVA) and means of the water table fluctuations in triplicates were compared using Duncan’s new multiple range test (DNMRT) at p ≤ 0.05. The relationships between CH4 flux and soil temperature were analyzed using Pearson correlation analysis. The statistical software used for this analysis was the Statistical Analysis System (SAS) Version 9.3.

3. Results

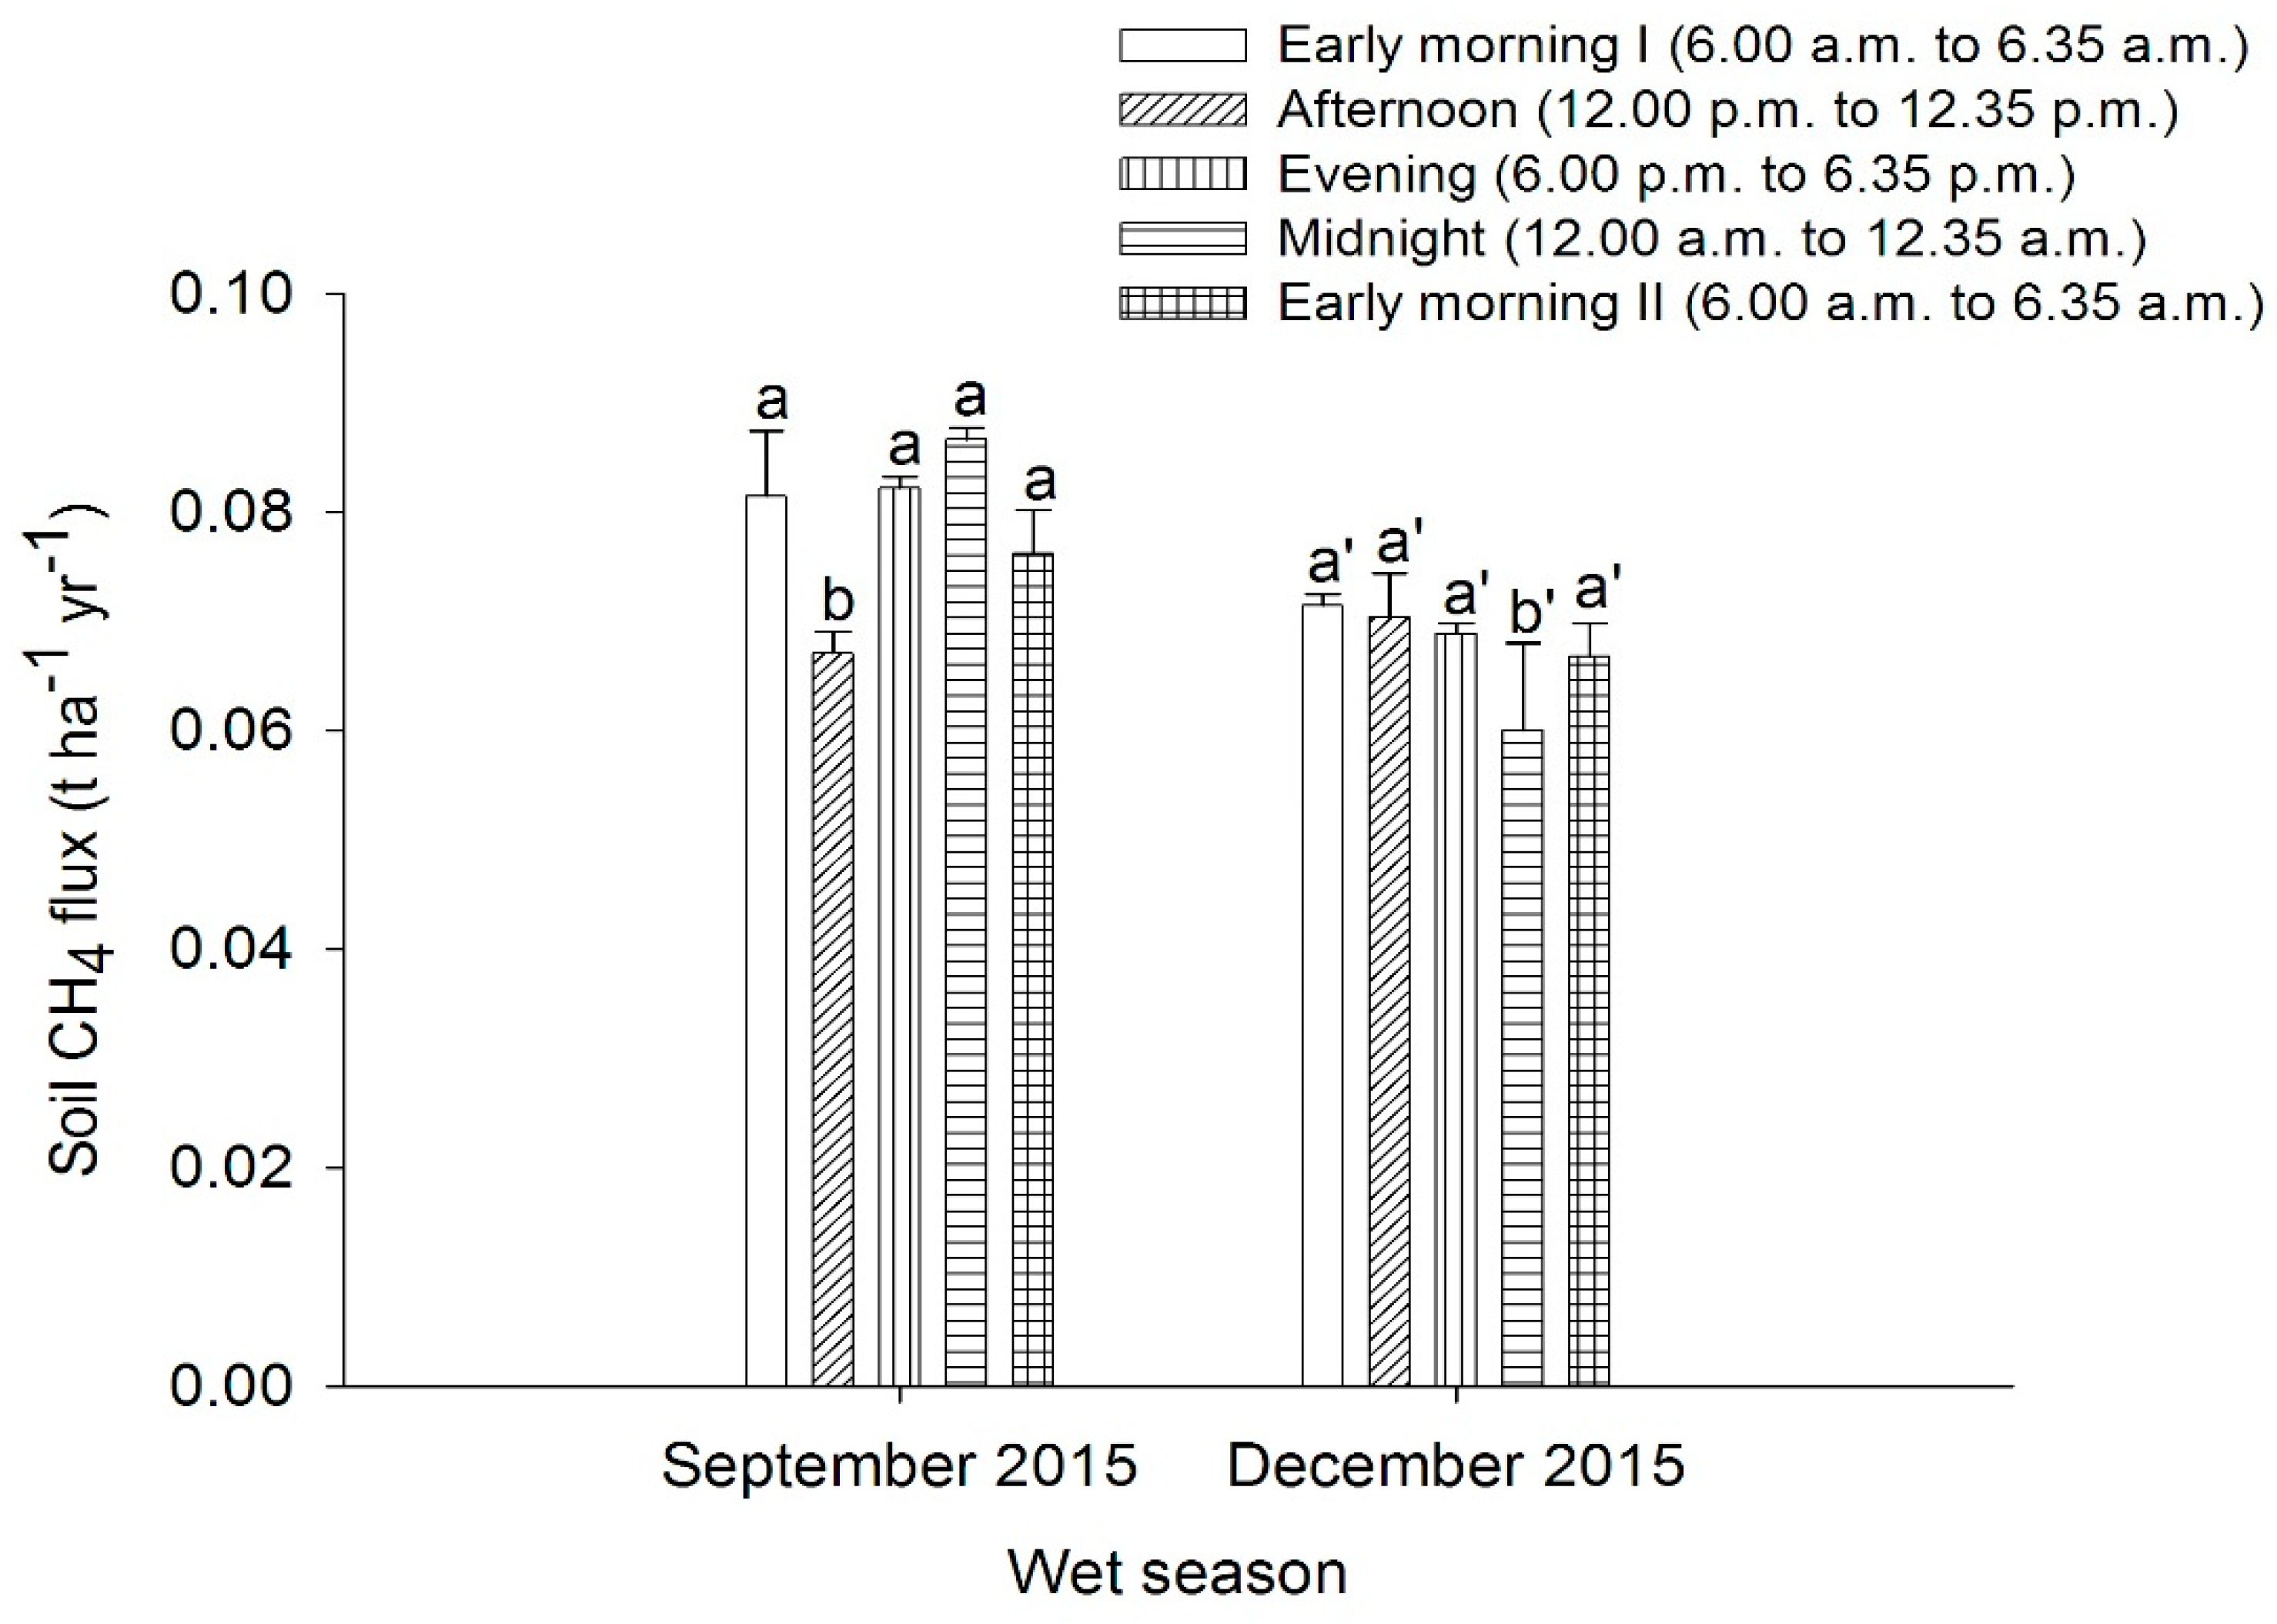
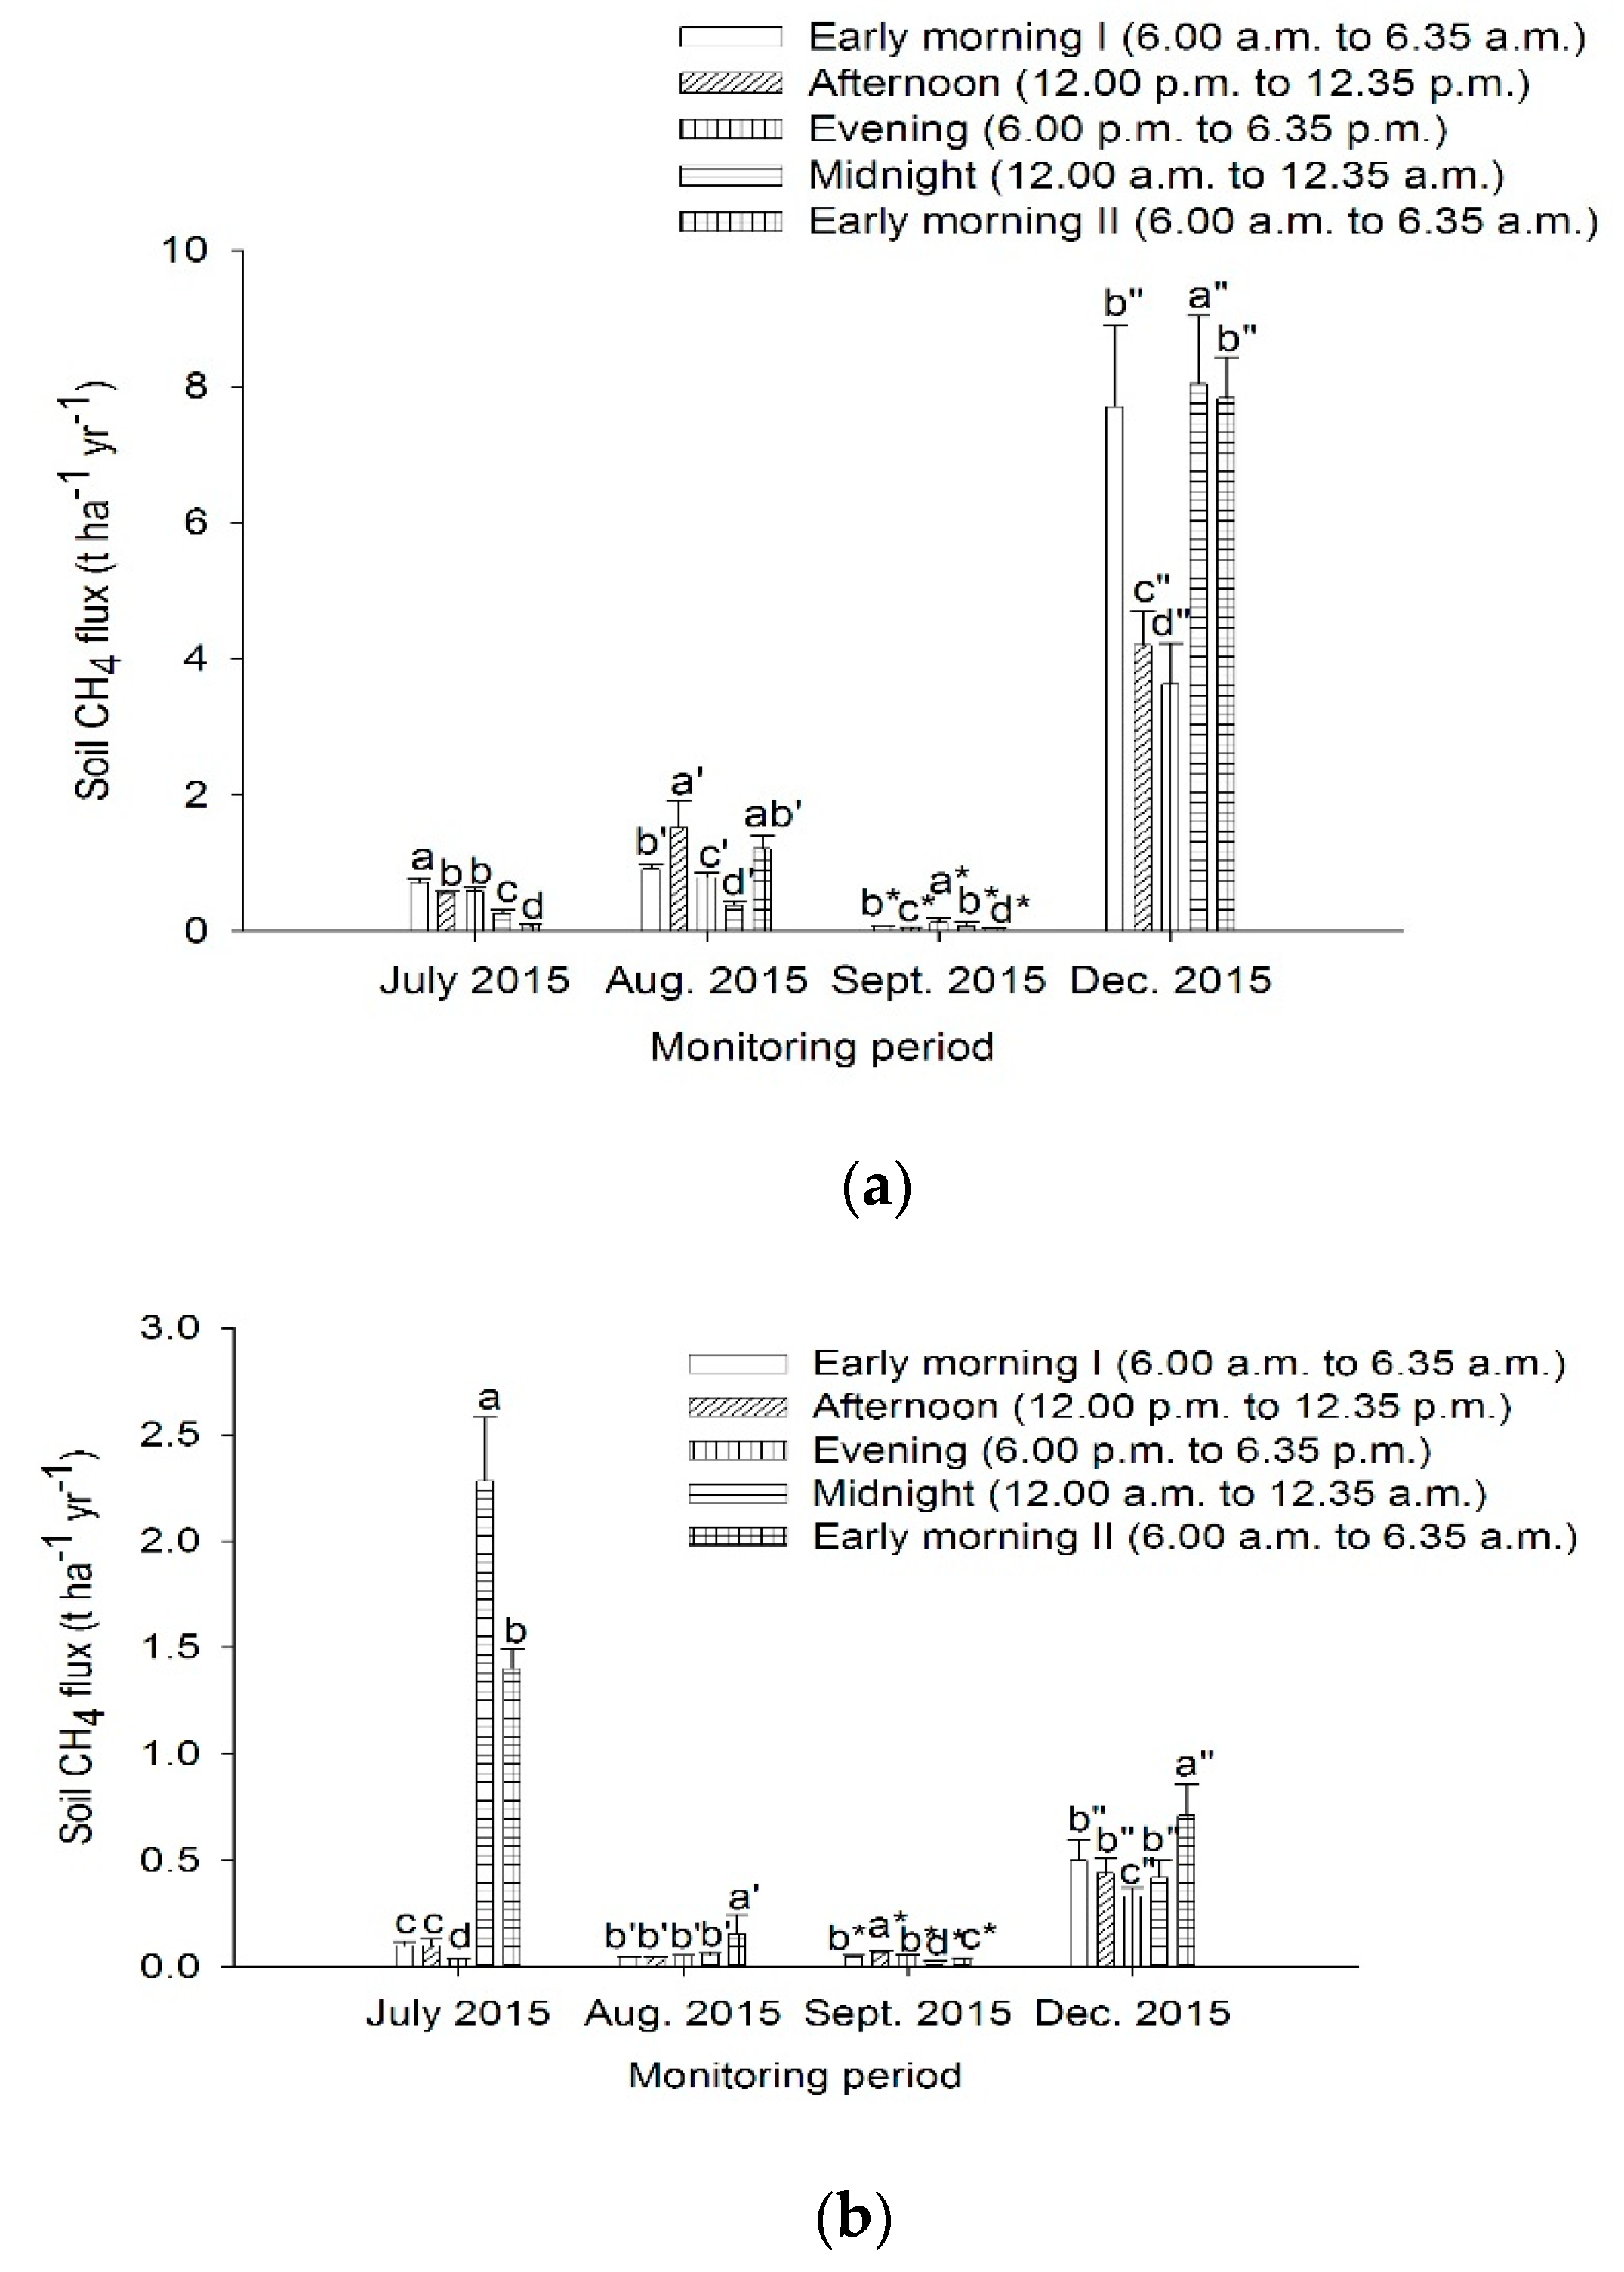
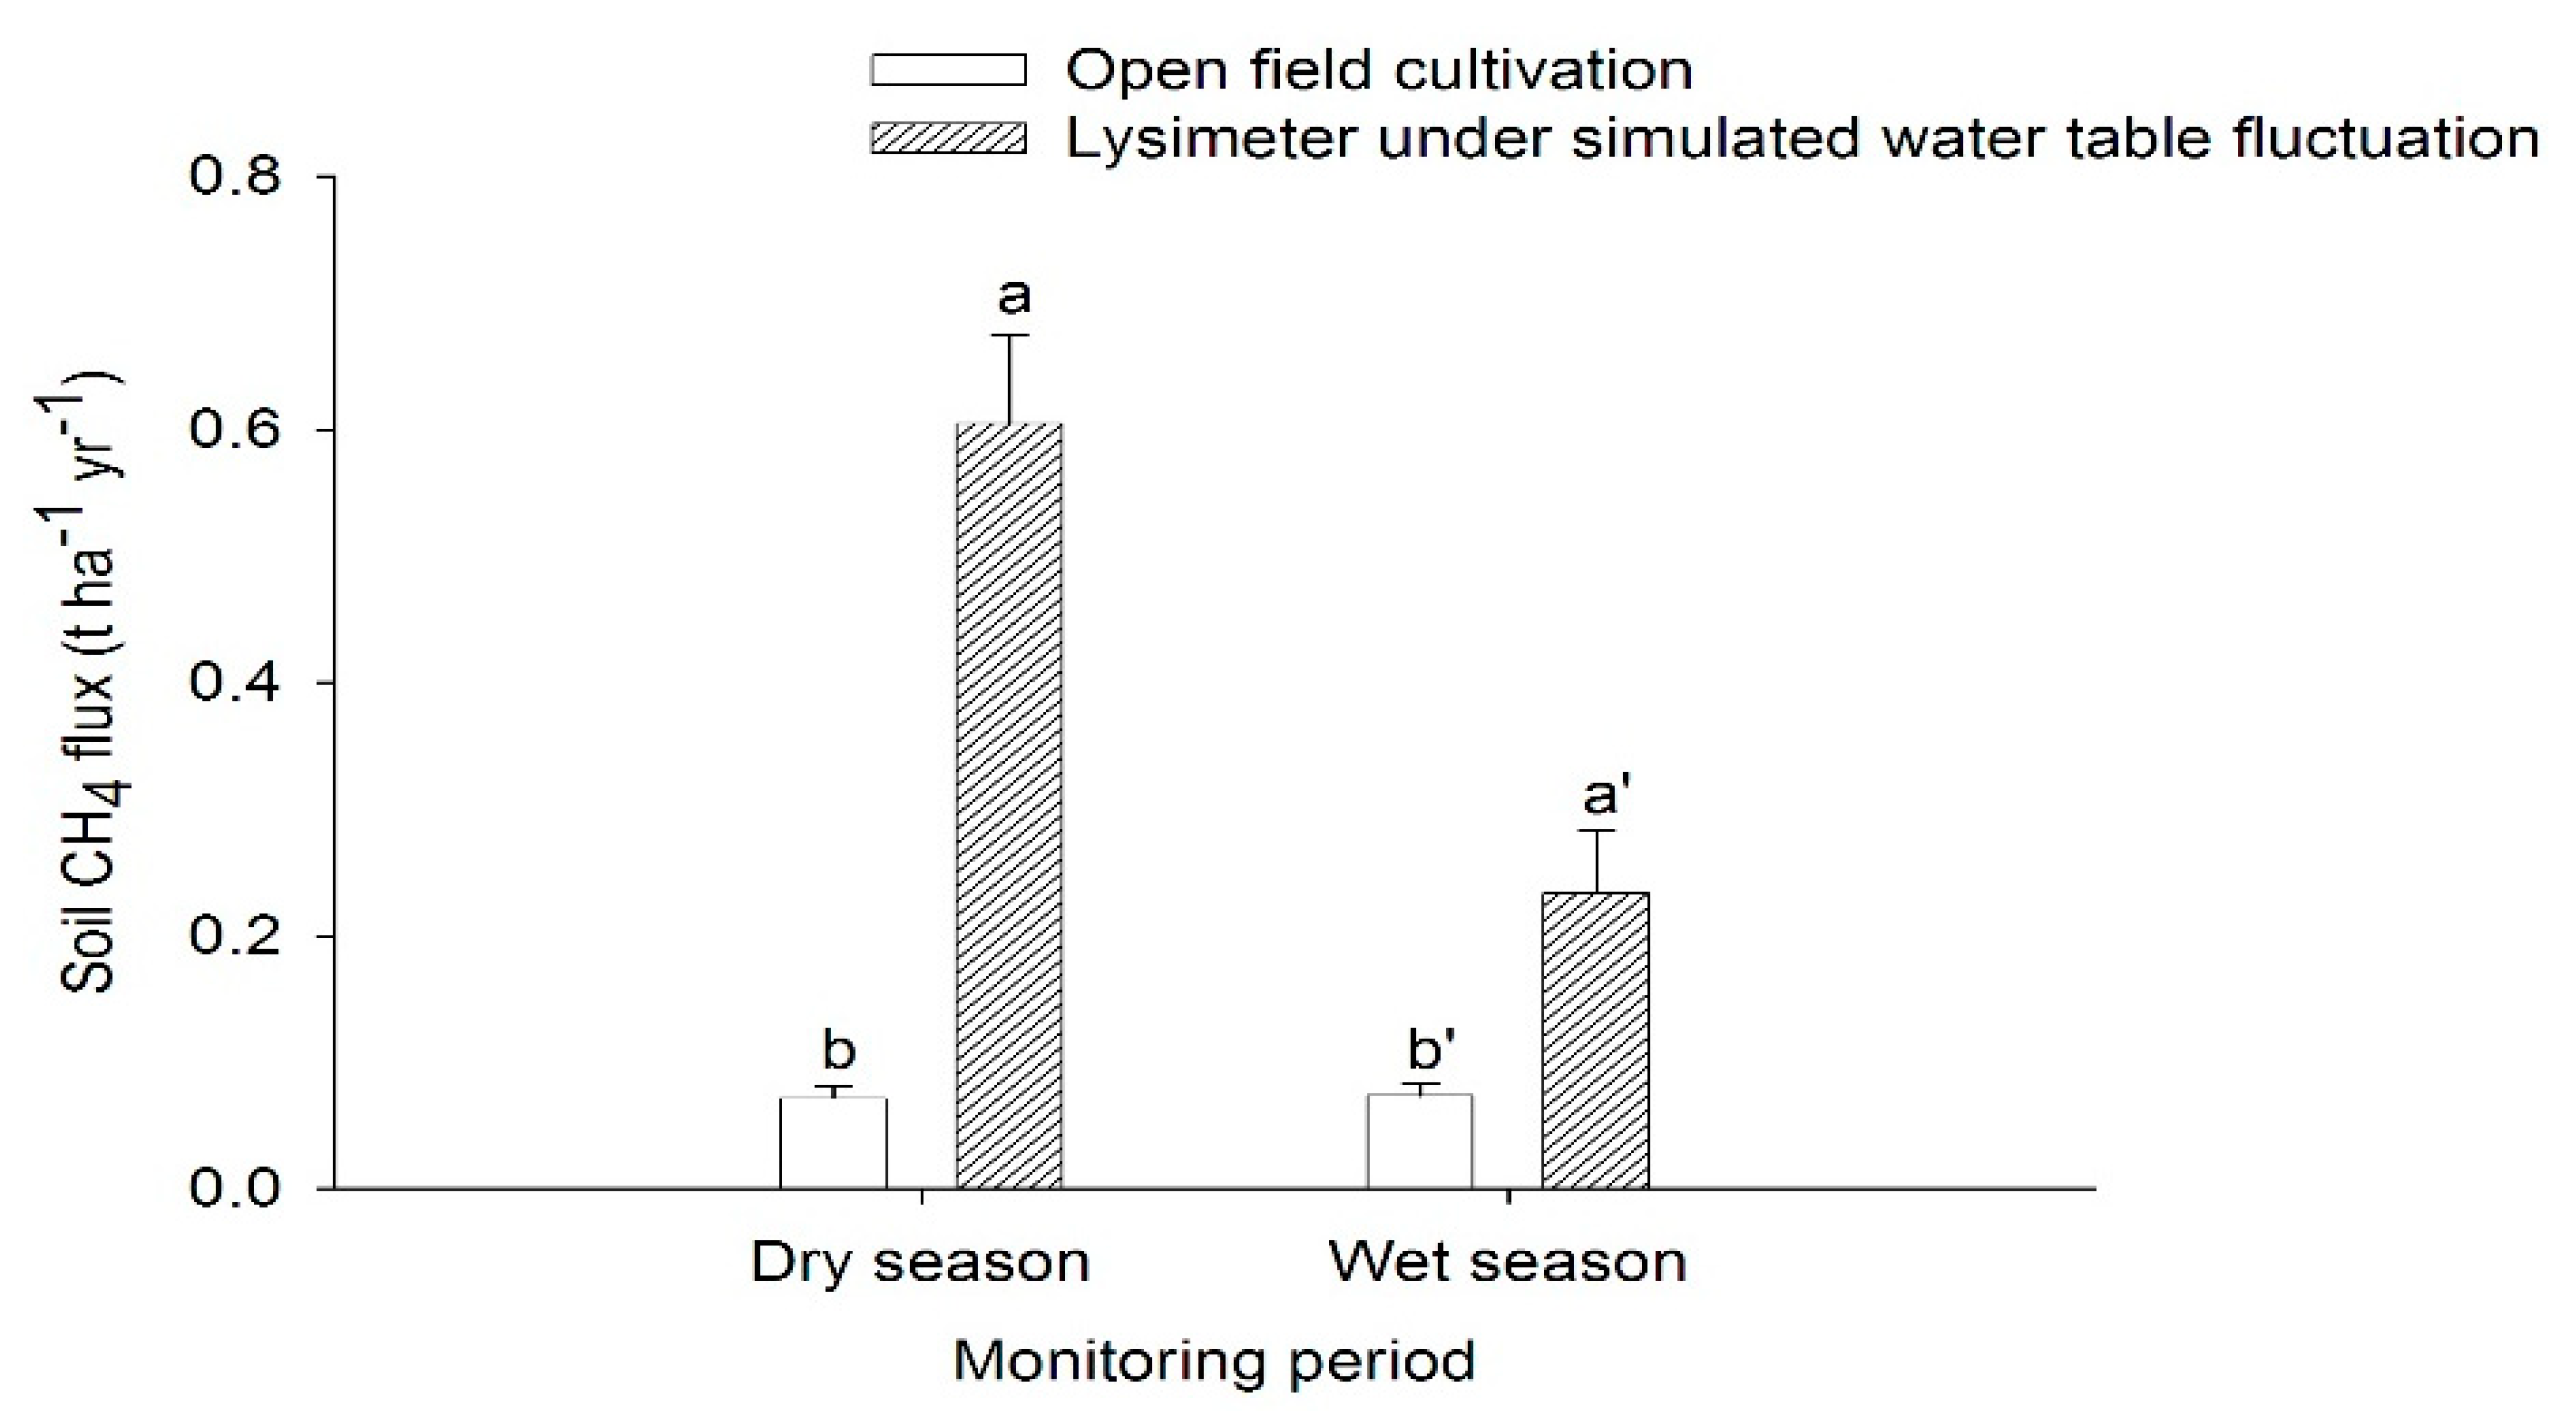
3.1. Soil Methane Emissions from Peat Soils Grown with Pineapple under Open Field Cultivation System in the Dry and Wet Seasons

Soil CH4 emissions from tropical peat soils cultivated with pineapples in the dry and wet seasons are presented in Figure 5 and Figure 6, respectively. During the dry season (July and August 2015), the soil CH4 emission showed no specific trend with the time of sampling but CH4 emissions were higher at midnight (Figure 5). In July 2015, the CH4 emissions was generally similar, whereas soil CH4 emissions were lower in the early morning I, afternoon, evening, and early morning II than at midnight in August 2015. Compared with the wet season, soil CH4 emissions were lower in the afternoon and at midnight during the gas flux monitoring in September and December 2015, respectively (Figure 6).
Averaged soil CH4 emissions over 24 h from a drained peat soil cultivated with pineapples throughout the dry (July and August 2015) and wet (September and December 2015) seasons are presented in Figure 7. Soil CH4 emissions were higher in September 2015 but emissions were lower in July, August and December 2015. However, soil CH4 emissions in July, August and December 2015 were similar.
Throughout the CH4 flux monitoring, soil temperature was statistically similar during the dry and wet seasons irrespective of sampling time (Table 1). Also, there was no significant correlation between CH4 emission and soil temperature (Table 1).

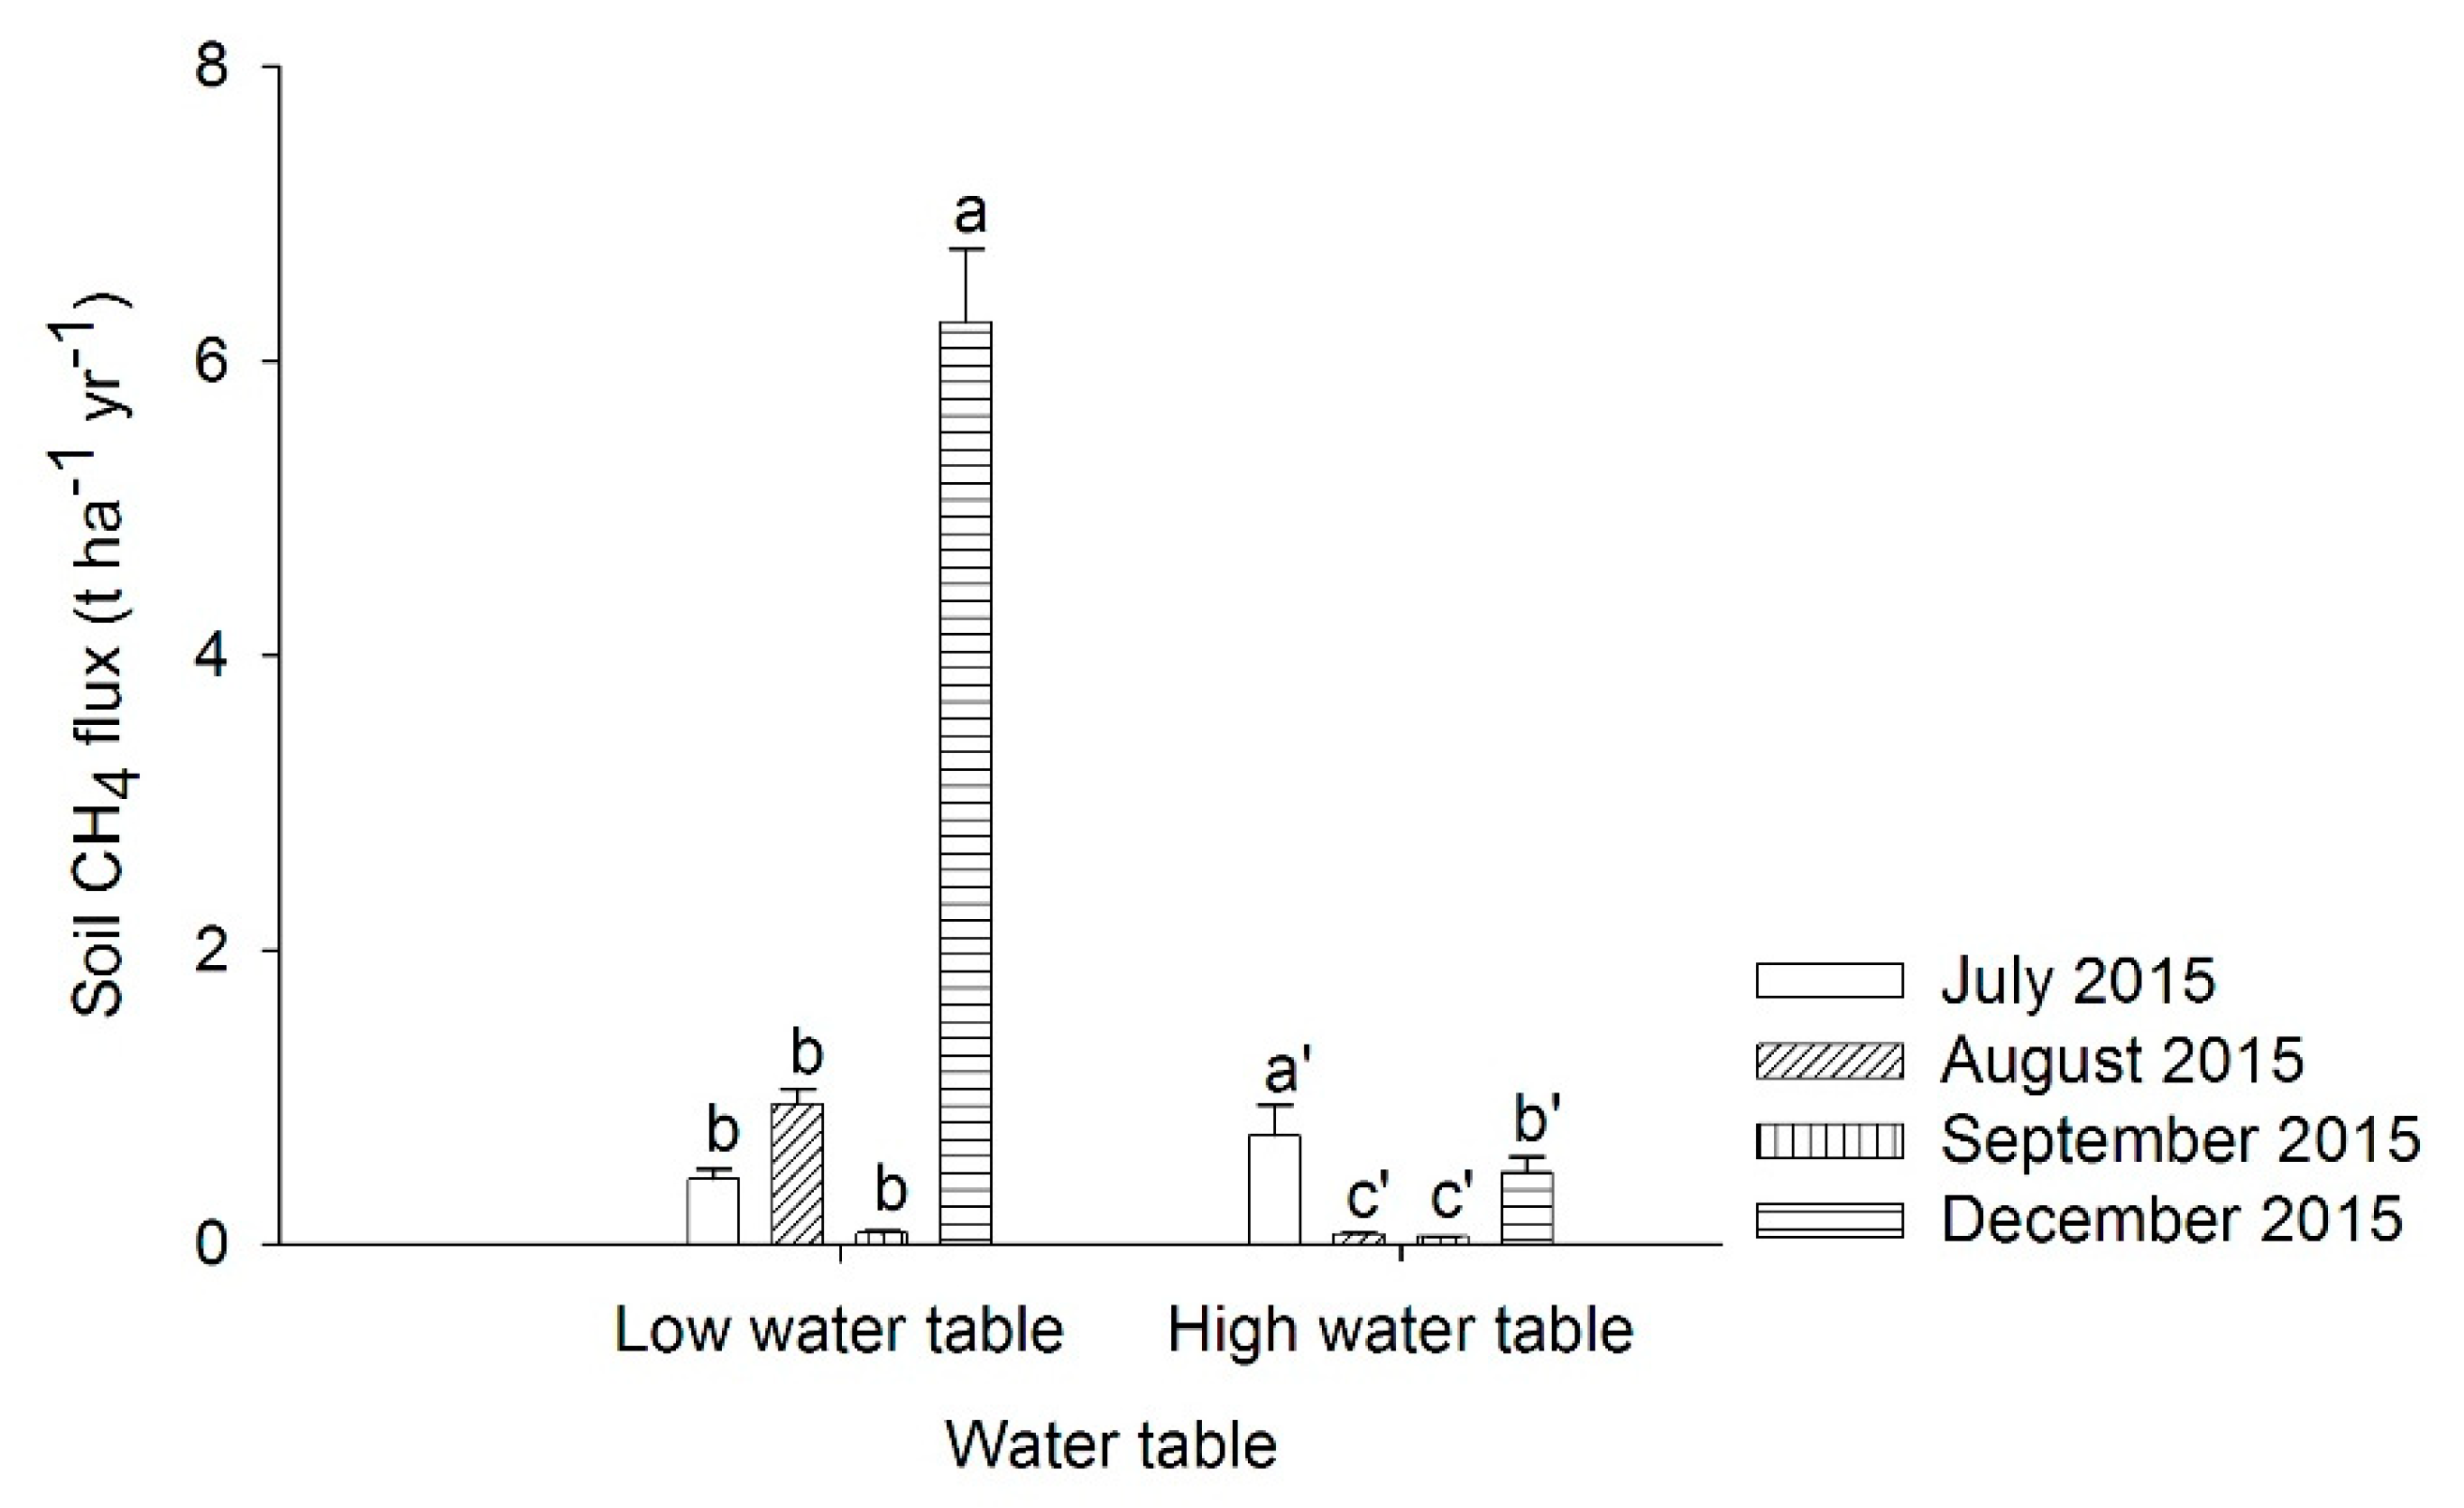
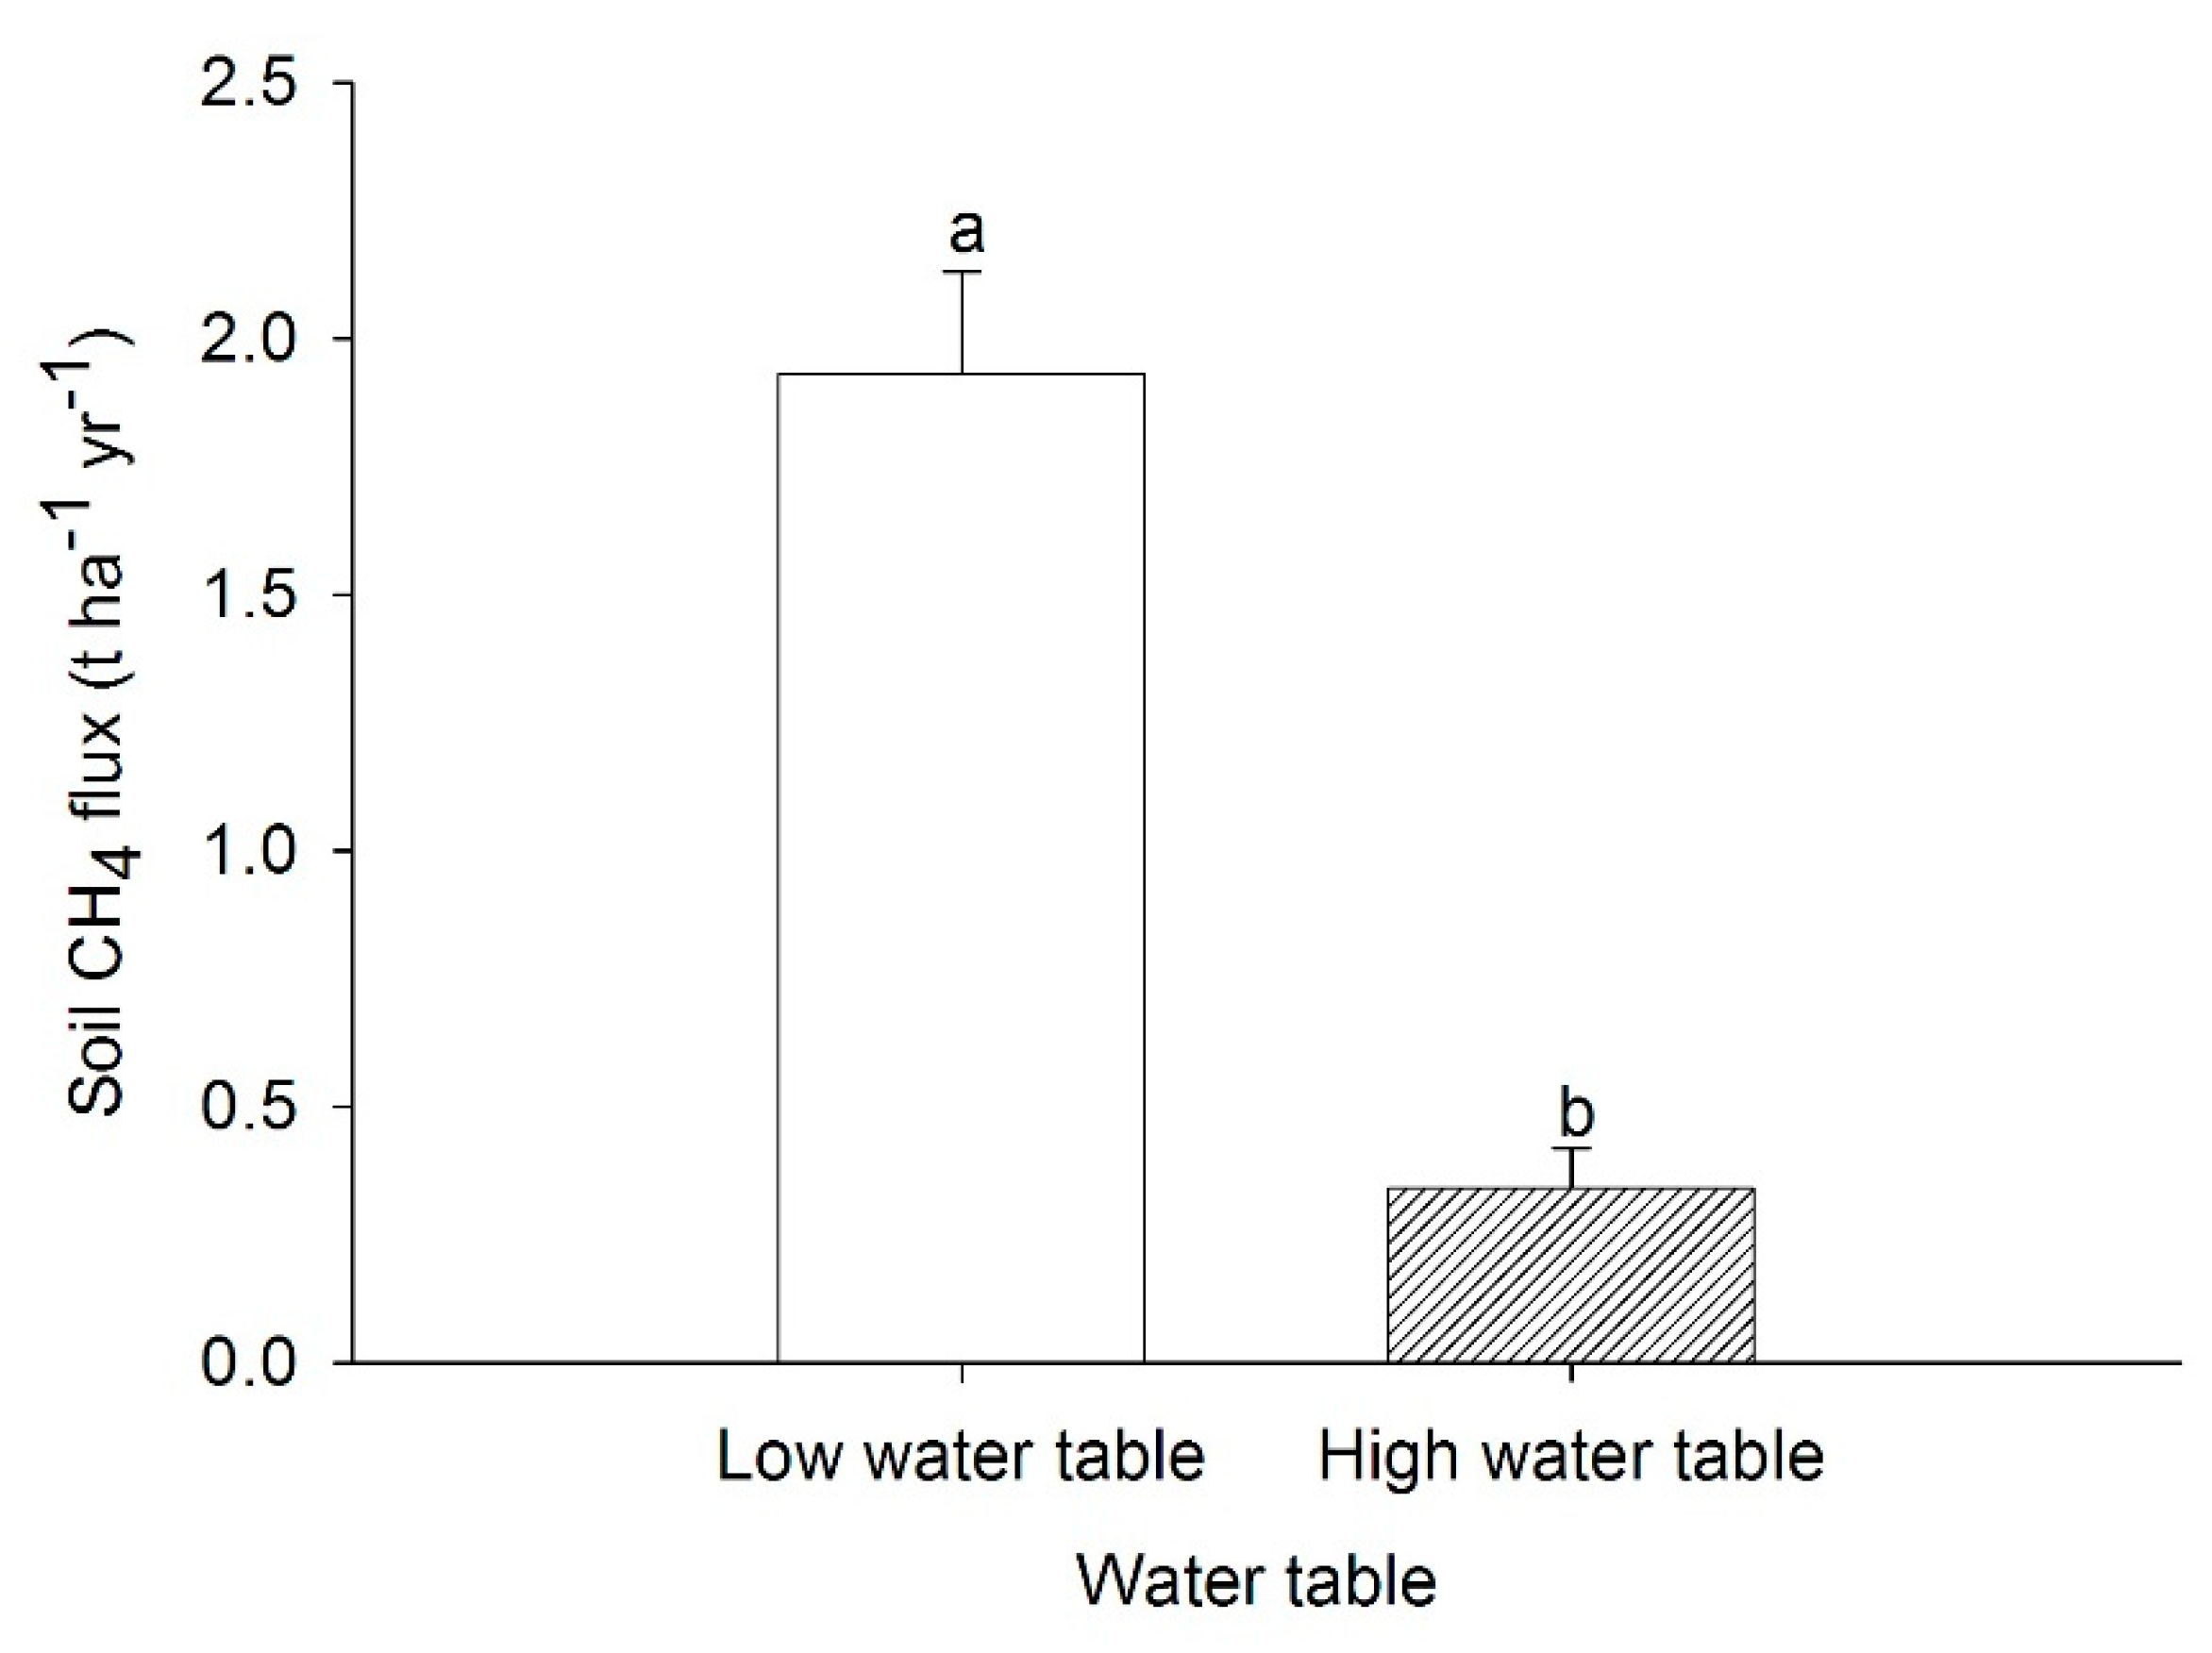
3.2. Soil Methane Emissions from Peat Soils Cultivated with Pineapples in Lysimeters under Simulated Water Table Fluctuation in the Dry and Wet Seasons

Soil CH4 emission varied with time of sampling throughout the wet and dry seasons under low and high water table fluctuations (Figure 8a,b). At low water table during the dry season (Figure 8a), soil CH4 emissions decreased from early morning I to early morning II in July 2015, whereas CH4 emissions were higher in the afternoon but lower at midnight in August 2015. However, at low water table during the wet season (Figure 8a), soil CH4 emissions were higher in the evening but lower in the early morning II in September 2015, whereas in December 2015, CH4 emission decreased from early morning I to evening, followed by an increase at midnight, after which the CH4 emission decreased until early morning II. Compared with lysimeters subjected to a high water table (Figure 8b), soil CH4 emissions in the dry season were higher at midnight and early morning II in July and August, respectively. However, at high water table during the wet season (Figure 8b), soil CH4 emission was higher at noon in September 2015, whereas CH4 emissions decreased from early morning I to evening, after which the CH4 emission increased until early morning II.
Averaged soil CH4 emissions over 24 h under different water table depth varied in the dry and wet seasons (Figure 9). At low water table (0.9 m from the soil surface), averaged soil CH4 emissions were higher in the wet season (December 2015) but lower throughout the monitoring period in July, August and September 2015. Conversely, at high water table (0 m from the soil surface), averaged soil CH4 emissions were higher in the dry season (July 2015) but emissions were lower in August and September 2015. However, throughout the dry and wet seasons, averaged soil CH4 emissions were significantly higher under the low water table compared with that of the high water table (Figure 10).
Throughout the dry and wet seasons, soil temperature was statistically similar irrespective of water table and sampling time (Table 2). Moreover, there was no significant correlation between soil temperature and CH4 emission (Table 2). This observation is consistent with the results obtained from the soil CH4 measurement from open field pineapple cultivation (Table 1).
Compared with the peat soils grown with pineapple under open field cultivation system, averaged soil CH4 emissions from pineapples in lysimeters subjected to water table fluctuation were significantly higher throughout the dry and wet seasons in 2015 (Figure 11).

4. Discussion

4.1. Soil Methane Emissions from Peat Soils Grown with Pineapple under Open Field Cultivation System in the Dry and Wet Seasons

Differences in soil CH4 emission across time (early morning, afternoon, evening and midnight) from pineapple cultivated peat soils could be attributed to the microbial structure in the peat soil that controls the balance between CH4 production and CO2 conversion and vice versa by methanogenic bacteria and methanotrophs under anaerobic and aerobic conditions [33], respectively, throughout the dry and wet seasons. Peat soils become net source of CH4 when CH4 production by methanogenic bacteria surpasses consumption by methanotrophic bacteria [34]. Moreover, soil CH4 fluxes are regulated by oxygen supply and availability of labile carbon, where methanogenesis is predominant under anaerobic conditions. Also, soil CH4 emissions might have been affected by the transportation of CH4 by molecular diffusion through the aerobic layer of the peat soils, and through ebullition in the form of bubbles at the peat water table interface [35,36,37].
Although the averaged soil CH4 emissions were not affected by the flux monitoring period throughout the dry (July and August 2015) and wet (December 2015) seasons, the higher CH4 emission particularly in September 2015 during the wet season was because of the higher rainfall received at the experimental site amounting to 72 mm compared with the lower rainfall received in July (29 mm), August (52 mm) and September (69 mm) 2015 [38]. This result suggests that higher CH4 is emitted under anaerobic and waterlogged conditions. The waterlogged condition of the peat soil in September 2015 might have favoured the thriving of methanogenesis bacteria under anoxic conditions, thus causing higher soil CH4 emission. This result also corroborates previous work by Furukawa et al. [20] and Inubushi et al. [30], who reported that the increase in soil CH4 emission is due to high rainfall.
Although soil CH4 emission was affected by the time of sampling, the insignificant correlation between soil CH4 emission and soil temperature regardless of seasons (dry and wet period) suggest that CH4 emission was not affected by soil temperature due to the moderate soil temperature fluctuation during CH4 flux measurement. The peat soil temperature ranged between 25 to 31 °C during the CH4 sampling (Table 1).

4.2. Soil Methane Emissions from Peat Soils Cultivated with Pineapples in Lysimeters under Simulated Water Table Fluctuation in the Dry and Wet Seasons

Similar to the pineapple cultivated under an open field system, differences in soil CH4 emission across time from field lysimeters subjected to water table fluctuation (low and high water table) relates to the microbial structure in the peat soils, particularly the methanogenic and methanotrophic microorganisms because these organisms control CH4 production and consumption. Also, soil CH4 release might have been influenced by the collapse of peat pores (during the soil excavation and setting up of the lysimeters) that affected CH4 transportation through molecular diffusion, and subsequent soil subsidence in the lysimeters due to water table fluctuation.
In this present study, there was a discrepancy on the averaged soil CH4 emissions from lysimeters under low and high water tables in the dry and wet seasons (Figure 9). The findings reported higher soil CH4 emissions both under low and high water table in the wet (December 2015) and dry (July 2015) seasons, respectively. Moreover, averaged soil CH4 emission under a low water table were higher compared with that of high water table. These observations were not in agreement with the general belief that soil CH4 emission increases with a higher water table. There are no specific reasons that explain the anomaly from the findings obtained. However, the inconsistency of soil CH4 emissions from peat the soils suggest that the factor controlling CH4 emission from the lysimeters could be attributed to the fluctuation of the water table at the soil–water interface. The water table level and its fluctuation at the soil–water interface may have altered the intensity and duration of CH4 production and oxidation processes throughout the dry and wet seasons.
The results on the insignificant correlation between soil temperature and CH4 emission from lysimeters under simulated water table fluctuation irrespective of seasons was consistent with that reported for CH4 measurement under an open field pineapple cultivation system. These observations are further supported by the fact that CH4 emission was not affected by soil temperature because of the moderate soil temperature fluctuation (24.7 to 32.7 °C) during CH4 flux measurement. This finding was in agreement with the study by [39,40] who reported that temperature changes had minimal effects on CH4 emission from cultivated peatlands.
It is also possible that soil CH4 from lysimeters and under open field pineapple cultivation was released from non-microbial production of CH4 sources particularly humic acids and lignin [41]. The emission of non-microbial CH4 may have occurred under moderate temperature fluctuations of the tropics because of the high amount of organic matter, humic acids, fulvic acids, lignin, humin and carbohydrate in peat soils [42,43,44]. In this study, the lower soil CH4 emission from peat soils grown with pineapple under an open field cultivation system compared with that of CH4 emission from the lysimeters throughout the dry and wet seasons (Figure 11) could be attributed to pineapple fertilization. Compound NPK fertilizers containing ammonium were applied to pineapple at 3, 6 and 9 months after planting in June, September and December 2015, respectively. The compound fertilizers might have increased nitrate content in the peat soils because nitrification increases with peat oxidation. The lower CH4 emission due to pineapple fertilization relates to the availability of electron acceptors namely nitrate which inhibits CH4 production [45]. Nitrate is water soluble and leaches to the water table interface leading to decreased CH4 production in anaerobic condition. Also, water table fluctuation (50 to 70 cm from the soil surface) and lateral water movement in the peat soil (open field cultivation system) might have affected the balance between CH4 production and consumption by methanogenic bacteria and methanotrophs. Water table depth affects the soil CH4 emissions because it determines the depth of the oxic or anoxic boundary and redox level within the soil. By contrast, water table fluctuation at the soil–water interface, transportation of CH4 through molecular diffusion through the aerobic peat layer and ebullition at the peat water table interface relatively explains the higher CH4 emission from lysimeters under simulated water table fluctuation.

5. Conclusions

Soil CH4 emission throughout the dry and wet seasons under open field pineapple cultivation and from lysimeters subjected to water table fluctuation were not affected by soil temperature but emissions were influenced by the balance between methanogenic and methanotrophic microorganisms controlling CH4 production and consumption, CH4 transportation via molecular diffusion through peat pore spaces, and non-microbial CH4 production sources in peat soils namely humic acids and lignin. Although it is generally believed that a high water table increases soil CH4 emission, findings from the study suggest that water table fluctuation at the soil-water interface relatively controls the soil CH4 emission from lysimeters under simulated low and high water table fluctuations. The outcome of this present study demonstrated that soil CH4 emission throughout the dry and wet seasons under an open field cultivation system was affected by the availability of nitrate electron acceptors from pineapple fertilization, which restrict CH4 production, thus leading to lower soil CH4 emission compared with that of CH4 emissions from lysimeters. However, the limited number of CH4 flux monitoring throughout the dry and wet seasons (July, August, September and December 2015) may not be conclusive enough to confirm the findings from the study. Thus, a long-term CH4 flux monitoring period is required to confirm the findings obtained because rainfall distribution, microbial population, chamber humidity and headspace temperature may influence CH4 emission and the outcome of the study. The findings of this study provide an understanding on the effects of water table fluctuation on CH4 emissions in a tropical peatland under pineapple cultivation.

Author Contributions

W.L. was responsible for investigation, writing, and original draft preparation. L.N.L.K.C., R.K.J.H. and M.B.J. were responsible for data analysis and visualization. O.H.A. was responsible for supervising, funding acquisition, project administration, experimental methodology, editing, and reviewing. L.O. was responsible for data arrangement, conceptualization, reviewing, and editing the second draft. A.A., A.A.M. were also involved in funding acquisition and project administration. All authors have read and agreed to the published version of the manuscript.

Funding

This research was funded by Long-term Research Grant Scheme (LRGS) and Translational Research Grant Scheme (TRGS) vote number 6300914 from the Ministry of Higher Education Malaysia.

Institutional Review Board Statement

Not applicable.

Informed Consent Statement

Not applicable.

Data Availability Statement

Not applicable.

Acknowledgments

The authors gratefully acknowledge the financial support provided through Putra Grant UPM. Appreciation also goes to Malaysia Agricultural Research and Development Institute (MARDI) Saratok, Sarawak, Malaysia, for the collaborative research.

Conflicts of Interest

The authors declare no conflict of interest.

References

  1. Joosten, H.; Sirin, A.; Couwenberg, J.; Laine, J.; Smith, P. The role of peatlands in climate regulation. In Peatland Restoration and Ecosystem Services: Science, Policy and Practice; Cambridge University Press: Cambridge, UK, 2016; pp. 63–76. [Google Scholar]
  2. Chen, X.; Tung, K.K. Varying planetary heat sink led to global-warming slowdown and acceleration. Science 2014, 6199, 897–903. [Google Scholar] [CrossRef]
  3. Snyder, C.S.; Tom, B.; Jensen, T.L.; Paul, E.F. Review of greenhouse gas emissions from crop production systems and fertilizer management effects. Agric. Ecosys. Environ. 2009, 133, 247–266. [Google Scholar] [CrossRef]
  4. Nisbet, E.; Manning, M.R.; Dlugockenky, E.J.; Fisher, R.E.; Lowry, D.; Michel, S.E. Very strong atmospheric methane growth in the 4 years 2014–2017: Implications for the Paris Agreement. Glob. Biogeochem. Cycles 2019, 33, 318–342. [Google Scholar] [CrossRef]
  5. Dlugokencky, E.J.; Lang, P.M.; Crotwell, A.M.; Mund, J.W.; Crotwell, M.J.; Thoning, K.W. Atmospheric Methane Dry Air Mole Fractions from the NOAA ESRL Carbon Cycle Cooperative Global Air Sampling Network, 1983–2016. In Division N-EGM, Editor. Version: 2017-07-28. 2017. Available online: Ftp://aftp.cmdl.noaa.gov/data/trace_gases/ch4/flask/surface/ (accessed on 29 May 2021).
  6. Ismail, A.B.; Zulkefli, M.; Salma, I.; Jamaludin, J.; Mohamad, H.M.J. Selection of land clearing technique and crop type as preliminary steps in restoring carbon reserve in tropical peatland under agriculture. In Proceedings of the 12th International Peat Congress, Tullamore, Ireland, 8–13 June 2008. Int Peat Society. [Google Scholar]
  7. Kechavarzi, C.; Dawson, Q.; Bartlett, M.; Leeds-Harrison, B.P. The role of soil moisture, temperature, and nutrient amendment on CO2 efflux from agricultural peat soil microcosms. Geoderma 2010, 154, 203–210. [Google Scholar] [CrossRef]
  8. Mäkiranta, P.; Minkkinen, K.; Hytönen, J.; Laine, J. Factors causing temporal and spatial variation in heterotrophic and rhizospheric components of soil respiration in afforested organic soil croplands in Finland. Soil Biol. Biochem. 2008, 40, 1592–1600. [Google Scholar] [CrossRef]
  9. Fenner, N.; Ostle, J.N.; McNamara, N.; Sparks, T.; Harmens, H.; Reynolds, B.; Freeman, C. Elevated CO2 effects on peatland plant community carbon dynamics and DOC production. Ecosystems 2007, 10, 635–647. [Google Scholar] [CrossRef]
  10. Collins, W.J.; Fry, M.M.; Yu, H.; Fuglestvedt, J.S.; Shindell, D.T.; West, J.J. Global and regional temperature-change potentials for near-term climate forcers. Atmos. Chem. Phys. 2013, 13, 2471–2485. [Google Scholar] [CrossRef] [Green Version]
  11. Saunois, M.; Jackson, R.B.; Bousquet, P.; Poulter, B.; Canadell, J.G. The growing role of methane in anthropogenic climate change. Environ. Res. Lett. 2017, 11, 120207. [Google Scholar] [CrossRef] [Green Version]
  12. Leifeld, J. Prologue paper: Soil carbon losses from land-use change and the global agricultural greenhouse gas budget. Sci. Total Environ. 2013, 465, 3–6. [Google Scholar] [CrossRef]
  13. Berglund, Ö.; Berglund, K. Influence of water table level and soil properties on emissions of greenhouse gases from cultivated peat soil. Soil Biol. Biochem. 2011, 43, 923–931. [Google Scholar] [CrossRef] [Green Version]
  14. Van Huissteden, J.; Petrescu, A.M.R.; Hendriks, D.M.D.; Rebel, K.T. Modelling the effect of water-table management on CO2 and CH4 fluxes from peat soils. Netherland J. Geosci. 2006, 85, 3–18. [Google Scholar] [CrossRef] [Green Version]
  15. Huang, H.; von Lampe, M.; van Tongeren, F. Climate change and trade in agriculture. Food Policy 2010, 36, S9–S13. [Google Scholar] [CrossRef]
  16. Vaghefi, N.; Mad Nasir, S.; Alias, R.; Khalid, A.R. Impact of climate change on food security in Malaysia: Economic and policy adjustments for rice industry. J. Integr. Environ. Sci. 2016, 13, 19–35. [Google Scholar] [CrossRef]
  17. Melling, L.; Hatano, R.; Goh, K.J. Methane fluxes from three ecosystems in tropical peatland of Sarawak, Malaysia. Soil Biol. Biochem. 2005, 37, 1445–1453. [Google Scholar] [CrossRef]
  18. Couwenberg, J.; Dommain, R.; Joosten, H. Greenhouse gas fluxes from tropical peatlands in south-east Asia. Glob. Chang. Biol. 2010, 16, 1715–1732. [Google Scholar] [CrossRef]
  19. Ahmed, O.H.; Liza Nuriati, L.K.C. Greenhouse Gas Emission and Carbon Leaching in Pineapple Cultivation on Tropical Peat Soil; Universiti Putra Malaysia Press: Serdang, Malaysia, 2019; pp. 1–145. [Google Scholar]
  20. Furukawa, Y.; Inubushi, K.; Ali, M.; Itang, A.M.; Tsuruta, H. Effect of changing groundwater levels caused by land-use changes on greenhouse gas fluxes from tropical peat lands. Nutr. Cycl. Agroecosyst. 2005, 71, 81–91. [Google Scholar] [CrossRef]
  21. Deshmukh, C.; Serça, D.; Delon, C.; Tardif, R.; Demarty, M.; Jarnot, C.; Guérin, F. Physical controls on CH4 emissions from a newly flooded subtropical freshwater hydroelectric reservoir: Nam Theun 2. Biogeosciences 2014, 11, 4251–4269. [Google Scholar] [CrossRef] [Green Version]
  22. Burrows, H.E.; Bubier, L.J.; Mosedale, A.; Cobb, W.G.; Crill, M.P. Net ecosystem exchange of carbon dioxide in a temperate poor fen: A comparison of automated and manual chamber techniques. Biogeochemistry 2005, 76, 21–45. [Google Scholar] [CrossRef]
  23. Abdul, H.; Kazuyuki, I.; Yuichiro, F.; Erry, P.; Muhammad, R.; Haruo, T. Greenhouse gas emissions from tropical peatlands of Kalimantan, Indonesia. Nutr. Cyc. Agroecosyst. 2005, 71, 73–80. [Google Scholar]
  24. Zulkefli, M.; Nuriati, L.L.; Ismail, A.B. Soil CO2 flux from tropical peatland under different land clearing techniques. J. Trop. Agric. Food Sci. 2010, 38, 131–137. [Google Scholar]
  25. Raziah, M.L.; Alam, A.R. Status and impact of pineapple technology on mineral soil. Econ. Tech. Manag. Rev. 2010, 5, 11–19. [Google Scholar]
  26. Barba, J.; Bradford, M.A.; Brewer, P.E.; Bruhn, D.; Covey, K.; Haren, J.; Vargas, R. Methane emissions from tree stems: A new frontier in the global carbon cycle. New Phytol. 2018, 222, 18–28. [Google Scholar] [CrossRef]
  27. Sjögersten, S.; Aplin, P.; Gauci, V.; Peacock, M.; Siegenthaler, A.; Turner, B.L. Temperature response of ex-situ greenhouse gas emissions from tropical peatlands: Interactions between forest type and peat moisture conditions. Geoderma 2018, 324, 47–55. [Google Scholar] [CrossRef]
  28. Hu, Y.G.; Feng, Y.L.; Zhang, Z.S.; Huang, L.; Zhang, P.; Xu, B.X. Greenhouse gases fluxes of biological soil crusts and soil ecosystem in the artificial sand-fixing vegetation region in Shapotou area. Chin. J. Appl. Ecol. 2014, 25, 61–68. [Google Scholar]
  29. Ehrenfeld, J.G. Encyclopedia of Biodiversity, 2nd ed.; Levin, S., Ed.; Academic Press: Cambridge, MA, USA; Princeton University: Princeton, NJ, USA, 2013; pp. 109–128. [Google Scholar]
  30. Inubushi, K.; Otake, S.; Furukawa, Y.; Shibasaki, N.; Ali, M.; Itang, A.M.; Tsuruta, H. Factors influencing methane emission from peat soil: Comparison of tropical and temperate wetlands. Nutr. Cycl. Agroecosyst. 2005, 71, 93–99. [Google Scholar] [CrossRef]
  31. Kazemian, S.; Huat, B.B.K.; Prasad, A.; Barghchi, M. State of an art review of peat: General perspective. Int. J. Phys. Sci. 2011, 6, 1974–1981. [Google Scholar]
  32. International Atomic Energy Agency (IAEA). Manual on measurement of methane and nitrous oxide emissions from agriculture. In Sampling Techniques and Sample Handling; IAEA-TECDOC-674; IAEA: Vienna, Austria, 1992; pp. 45–67. [Google Scholar]
  33. Rachwal, M.; Fernando, G.; Zanatta, J.A.; Dieckow, J.; Denega, G.L.; Curcio, G.R.; Bayer, C. Methane fluxes from waterlogged and drained Histosols of highland areas. Rev. Bras. Cienc. Solo 2014, 38, 486–494. [Google Scholar] [CrossRef] [Green Version]
  34. Le Mer, J.; Roger, P. Production, oxidation, emission, and consumption of methane by soils: A review. Eur. J. Soil Biol. 2001, 37, 25–50. [Google Scholar] [CrossRef]
  35. Farmer, J.; Matthews, R.; Smith, J.U.; Smith, P.; Singh, B.K. Assessing existing peatland models for their applicability for modelling greenhouse gas emissions from tropical peat soils. Curr. Opin. Environ. Sustain. 2011, 3, 339–349. [Google Scholar] [CrossRef]
  36. Pangala, S.R.; Enrich-Prast, A.; Basso, L.S.; Peixoto, R.B.; Bastviken, D.; Hornibrook, E.R.C.; Gauci, V. Large emissions from floodplain trees close the Amazon methane budget. Nature 2017, 552, 230–234. [Google Scholar] [CrossRef]
  37. Jauhiainen, J.; Silvennoinen, H. Diffusion GHG fluxes at tropical peatland drainage canal water surfaces. Suo 2012, 63, 93–105. [Google Scholar]
  38. Luta, W.; Ahmed, O.H.; Heng, R.K.J.; Choo, L.N.K. Water table fluctuation and carbon dioxide emission from a tropical peat soil cultivated with pineapples (Ananas comosus (L.) Merr.). Int. J. Biosci. 2017, 10, 172–178. [Google Scholar]
  39. Kløve, B.; Sveistrup, T.E.; Hauge, A. Leaching of nutrients and emission of greenhouse gases from peatland cultivation at Bodin, Northern Norway. Geoderma 2010, 154, 219–232. [Google Scholar] [CrossRef]
  40. Kløve, B.; Berglund, K.; Berglund, Ö.; Weldon, S.; Maljanen, M. Future options for cultivated Nordic peat soils: Can land management and rewetting control greenhouse gas emissions? Environ. Sci. Pol. 2017, 69, 85–93. [Google Scholar] [CrossRef]
  41. Wang, B.; Hou, L.; Liu, W.; Wang, Z. Non-microbial methane emissions from soils. Atmos. Environ. 2013, 80, 290–298. [Google Scholar] [CrossRef]
  42. Allen, S.J.; McKay, G.; Porter, J.F. Adsorption isotherm models for basic dye adsorption by peat in single binary component systems. J. Colloid Interf. Sci. 2004, 280, 322–333. [Google Scholar] [CrossRef]
  43. Udin, A.B.M.H.; Sujari, A.M.A.; Nawi, M.A.M. Effectiveness of peat coagulant for the removal of textile dyes from aqueous solution and textile wastewater. Malay J. Chem. 2003, 5, 034–043. [Google Scholar]
  44. Zulfikar, M.A.; Novita, E.; Hertadi, R.; Djajanti, S.D. Removal of humic acid from peat water using untreated powdered eggshell as a low cost adsorbent. Int. J. Environ. Sci. Technol. 2013, 10, 1357–1366. [Google Scholar] [CrossRef] [Green Version]
  45. Jassal, R.S.; Black, T.A.; Roy, R.; Ethier, G. Effect of nitrogen fertilization on soil CH4 and N2O fluxes and soil and bole respiration. Geoderma 2011, 162, 182–186. [Google Scholar] [CrossRef]
Figure 1. Location of study site in Sesang, Saratok, Sarawak, Malaysia.
Agronomy 11 01448 g001
Figure 2. Study site of peatland cultivated with Ananas comosus.
Agronomy 11 01448 g002
Figure 3. Fabricated field lysimeter made from high density polyethylene.
Agronomy 11 01448 g003
Figure 4. A closed chamber system to estimate soil methane emission from tropical peatland.
Agronomy 11 01448 g004
Figure 5. Soil CH4 emissions (at different times of the day) from a tropical peatland cultivated with pineapples in the dry season (July and August 2015). Error bars represent standard error and soil mean fluxes with different letters and noted by prime are significantly different using Duncan’s new multiple range test (DNMRT) at p ≤ 0.05.
Agronomy 11 01448 g005
Figure 6. Soil CH4 emissions (at different times of the day) from a tropical peatland cultivated with pineapples in the wet season (September and December 2015). Error bars represent standard error and soil mean fluxes with different letters and noted by prime are significantly different using DNMRT at p ≤ 0.05.
Agronomy 11 01448 g006
Figure 7. Averaged soil CH4 emissions over 24 h from a tropical peat soils cultivated with pineapple throughout the dry (July and August 2015) and wet (September and December 2015) seasons. Error bars represent standard error and soil mean fluxes with different letters are significantly different using DNMRT at p ≤ 0.05.
Agronomy 11 01448 g007
Figure 8. Soil CH4 emissions (at different times of the day) from a peat soil grown with pineapples in lysimeters under simulated water table fluctuation (a) low water table and (b) high water table throughout the dry (July and August 2015) and wet (September and December 2015) seasons. Error bars represent standard error and soil mean fluxes with different letters and noted by prime, asterisk, and double prime are significantly different using DNMRT at p ≤ 0.05.
Agronomy 11 01448 g008
Figure 9. Averaged soil CH4 emissions over 24 h from a peat soil cultivated with pineapples in lysimeters under low and high water tables throughout the dry (July and August 2015) and wet (September and December 2015) seasons. Error bars represent standard error and soil mean fluxes with different letters and noted by prime are significantly different using DNMRT at p ≤ 0.05.
Agronomy 11 01448 g009
Figure 10. Averaged soil CH4 emissions over 24 h from a peat soil grown with pineapple in lysimeters under low and high water table. Error bars represent standard error and soil mean fluxes with different letters are significantly different using DNMRT at p ≤ 0.05.
Agronomy 11 01448 g010
Figure 11. Averaged soil CH4 emissions from peat soils grown with pineapples under open field cultivation system and lysimeters subjected to water table fluctuation in the dry and wet seasons. Error bars represent standard error and soil mean fluxes with different letters and noted by prime are significantly different using DNMRT at p ≤ 0.05.
Agronomy 11 01448 g011
Table 1. Relationship between soil CH4 emission and soil temperature from a peat soil cultivated with pineapples throughout the dry and wet seasons in 2015.
VariableSoil Temperature (°C)
Dry Season Wet Season
July 2015August 2015September 2015December 2015
Early morning I (6:00 a.m. to 6:35 a.m.)30.7 a28.3 a29.0 a31.0 a
Afternoon (12:00 p.m. to 12:35 p.m.)25.3 a27.0 a25.7 a25.0 a
Evening (6:00 p.m. to 6:35 p.m.)28.3 a29.3 a29.3 a29.3 a
Midnight (12:00 a.m. to 12:35 a.m.)25.3 a28.3 a28.3 a27.0 a
Early morning II (6:00 a.m. to 6:35 a.m.)26.7 a28.5 a28.5 a26.7 a
Soil CH4 emissionr = −0.1191
p = 0.6725
r = 0.2209
p = 0.4286
r = −0.1386
p = 0.6224
r = −0.0529
p = 0.8513
Mean values with same letters within the same column are not significantly difference between means using DNMRT at p ≤ 0.05. Top value indicates Pearson’s correlation coefficient (r), whereas the bottom values indicate probability level at 0.05 (n = 600).
Table 2. Relationship between soil CH4 emission and soil temperature from lysimeters cultivated with pineapples under simulated water table fluctuation throughout the dry and wet seasons in 2015.
VariableSoil Temperature (°C)
Dry SeasonWet Season
July 2015August 2015September 2015December 2015
Low Water TableHigh Water TableLow Water TableHigh Water TableLow Water TableHigh Water TableLow Water TableHigh Water Table
Early morning I (6:00 a.m. to 6:35 a.m.)32.7 a32.3 a,b27.5 a,b28.3 a28.3 a27.7 a29.2 a30.3 a
Afternoon (12:00 p.m. to 12:35 p.m.)24.3 a25.0 a27.2 b29.0 a29.0 a28.7 a27.8 a28.0 a
Evening (6:00 p.m. to 6:35 p.m.)32.7 a36.0 a29.3 a,b29.3 a28.3 a30.0 a26.3 a30.7 a
Midnight (12:00 a.m. to 12:35 a.m.)28.0 a24.7 b28.3 a,b28.2 a29.3 a28.7 a29.7 a28.7 a
Early morning II (6:00 a.m. to 6:35 a.m.)32.0 a28.3 a,b29.7 a27.7 a28.2 a28.0 a27.0 a30.0 a
Soil CH4 emissionr = 0.2904
p = 0.2938
r = −0.0609
p = 0.8292
r = 0.4051
p = 0.1342
r = −0.0299
p = 0.9156
r = −0.0183
p = 0.9484
r = −0.0014
p = 0.9959
r = −0.1583
p = 0.5731
r = −0.4843
p = 0.0674
Mean values with same letters within the same column are not significantly difference between means using DNMRT at p ≤ 0.05. Top value indicates Pearson’s correlation coefficient (r), whereas the bottom values indicate probability level at 0.05 (n = 1200).
Publisher’s Note: MDPI stays neutral with regard to jurisdictional claims in published maps and institutional affiliations.

