Abstract
In the last decade, many studies have been conducted on tractor and agricultural machinery electrification. In particular, the electrification of power take-off (PTO)-powered implements could support many benefits, such as improved comfort and safety during implement connection, less noisiness, accurate control of the implement rotational speed, and fuel consumption reduction. However, commercially available tractors do not generate sufficient electric power to run electrified implements. A solution to this issue is powering eventual electrified implements with an external electric generator powered by the PTO and mounted with the front three-point linkage. This study aimed to evaluate the potential benefits of using this combination with respect to PTO powered implements. The types of implements analyzed in detail in this study were a sprayer and a mulcher. Field tests were performed acquiring performance, operational, and environmental parameters. Results show that on the electrified implements, the absence of the cardan shaft and hydraulic remotes shortened the time required for the hitching phase and reduced the in-work noisiness. Field tests demonstrated that the electrified implements permitted an improvement of the fuel consumption per hectare, up to 33.3% and 29.8% lower than their PTO-powered homologue for the sprayer and the mulcher, respectively.
1. Introduction
The agricultural sector is responsible for about 21% of the world′s greenhouse gas emissions, mainly due to the use of fossil-based fertilizers, the combustion of biomass, and the polluting gas emissions of agricultural machinery [1]. Regarding the latter, the vast majority of self-propelled agricultural machinery is powered by endothermic engines run with fossil fuels, which represent 95% of the energy used for their propulsion [2]. European governments have demanded a reduction in fossil fuel consumption and manufacturers of agricultural machines are concentrating a lot of efforts on increasing the efficiencies of their machines [3,4]. Over the last two decades, agricultural machinery manufacturers have been focused on engines and drivelines [5], but recently they have been concentrating on other limiting components, such as accessories [6] and tractive performance [7]. The power take-off (PTO) is a component that can lead to operational inefficiencies since it must operate at 540 and 1000 rpm in function of the attached implement [8]. These speeds are reached at specific engine speeds in function of PTO operating mode: standard or economy. Generally, the standard and economy PTOs are located at the speeds where the engine delivers the peak power and torque, respectively. If this is reasonable when the engine operates at full load, in partial loads, the engine may not operate at the most efficient point since it operates to greater speeds than strictly necessary, which can lead to accessory overdrive [6]. The best option would be to design a PTO drive able to run the engine at the lowest speed, where it can deliver enough power for the operation. That is achievable with constant speed PTOs, which are able to maintain the PTO speed at the desired level regardless of the engine speed. Despite several patents that have been registered by agricultural tractor manufacturers [9,10,11], no commercial tractor equipped with a constant speed PTO has been released up to now, probably due to the limited benefits with respect to their complexity. For a few implements, manufacturers have proposed hydraulic-driven implements and despite the energy conversion, hydraulic drives lead to greater fuel efficiency than their mechanical counterparts in low-demand operations, with the additional benefit of increased controllability, which is advantageous for precision agriculture applications [12]. Thus, hydraulic drives are mostly used in a few fertilizer spreaders and planters.
Recently, there has been a growing interest in the electrification of agricultural machines [13,14]. Electrification is the replacement of any mechanical or hydraulic components with their electric counterparts. This may lead to more complicated powertrains, but simultaneously, it permits the machines to achieve greater control and, with proper designs, to decouple the engine from the external loads coming from the wheels, PTO, and hydraulic remotes. The agricultural machinery industry is putting all its efforts into the transition towards electrification; indeed, it has been developing the electric standard for non-road mobile machinery (NRMM), ISO 23316 [15], which would wind up to 700VDC/480VAC and 150 kW. In principle, this will permit the replacement of both PTO and hydraulic remotes with several benefits in terms of safety and efficiency. Manufacturers have developed several prototypes of electrified tractor–implement combinations [16]. The major areas of interests have been the introduction of electrically driven wheels in implements where the mechanical counterparts cannot be installed due to mechanical constraints. This permits an increase in the number of driven wheels, to reduce the mass of the tractor maintaining its achievable drawbar pull and to add additional features thanks to the great controllability of the electric system, such as independent control of driven wheels for lowering the turning radius, etc. Field tests on a slurry tanker and a forage harvester showed fuel savings of about 13% [17,18,19,20]. In fertilizer spreaders or planters, electric drives for metering units have been implemented to increase the accuracy of the application rate and the operating speed [21]; while in boom sprayers, electrically driven fans have been adopted so that the fan can be sped up and slowed down depending on the size of tree canopies or turned off when not needed, for example on headland turns [22]. All these prototypes were developed for large row crop tractors, but electrification would play a significant role in specialty tractors where small size, drivability, and visibility are characteristics of utmost importance. However, diesel exhaust after-treatment devices are detrimental to these characteristics as they are bulky. The shift towards full agricultural machinery electrification will go through a transitional period as tractors will need a complete redesign of many key components. In this paper, a transitional electric solution is proposed where a PTO-driven electric generator is installed on a tractor that generates the power for running two electrically driven implements: sprayer and mulcher. This paper aimed to report the operating and environmental benefits of using these implements with respect to the equivalent mechanically driven ones.
2. Materials and Methods
The tractor used for the tests was a New Holland T4.110V tractor (CNH Industrial N.V., Amsterdam, Netherlands), and its main specifications are reported in Table 1.

Table 1.
Main tractor specifications.
2.1. e-Source Specification
The front three-point linkage (TPL) of the tractor carried an electric generator, called e-Source in the following, developed by CNH Industrial (CNH Industrial N.V., Amsterdam, NL, USA) (Figure 1).
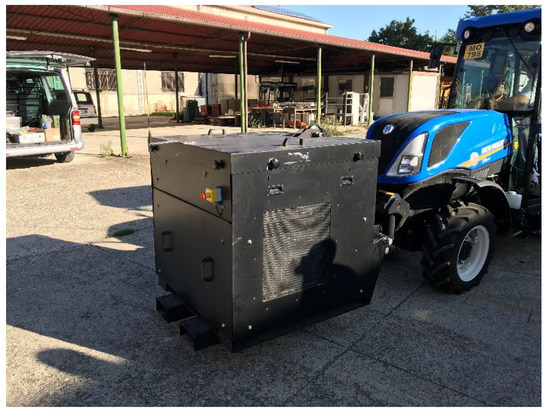
Figure 1.
e-Source mounted on the New Holland T4.110V front linkage.
The e-Source was run by the front PTO of the tractor, then the developed electric energy was modulated by a high voltage inverter controlled by the generator electronic control unit (GECU). The connection to the implements was granted by a standard AEF high-voltage power interface (AEF HVPI in the following) [15]. The operator could monitor and control the operation of the device through the virtual terminal of the tractor. The voltage output () was monitored by an embedded sensor, the output signal was acquired by a CAN-Bus datalogger described in the following. Further e-Source specifications are reported in Table 2.
Table 2.
Main e-Source specifications.
2.2. Implement Specifications
Mulchers and sprayers specifically designed to work in orchards and vineyards were used in this study. For each implement type, the PTO and electric-powered versions were tested, both were equal in terms of external dimensions and machine capacity. All the implements were developed and produced by Nobili S.p.a. (Molinella, Bologna, Italy).
2.2.1. Sprayers
The PTO-driven and electrically driven sprayers are, in the following, denoted mSprayer and eSprayer, respectively. These are shown in Figure 2 and their main specifications are reported in Table 3.
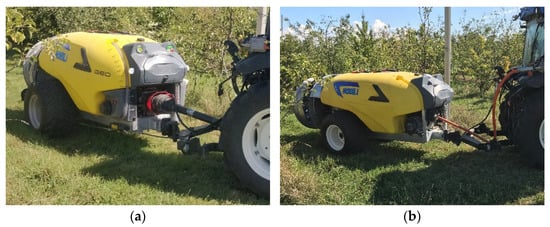
Figure 2.
mSprayer (a) and eSprayer (b) developed by Nobili S.p.a. (Molinella, Bologna, Italy) used for the tests.
Table 3.
mSprayer and eSprayer specifications.
One can note that the main differences between the two sprayers are the power drive and a slight difference of mass caused by the high-voltage electric components (e.g., the electric motor) installed on the eSprayer. Indeed, on the mSprayer the power required by the implement rotor is provided by the cardan shaft attached to the rear PTO of the tractor, while on the eSprayer the rotor is driven by an electric motor powered by the e-Source through the AEF HVPI.
The transmission ratio between the fan and the PTO speed on the mSprayer could be set on two different gears, these are selectable through a mechanical lever positioned on the implement. This does not permit the mSprayer to change the gear on the go. The e-Sprayer does not have any gearbox, the fan speed () is independent of the engine speed (Figure 3) and can be changed on the go with a remote control installed inside the tractor cab.
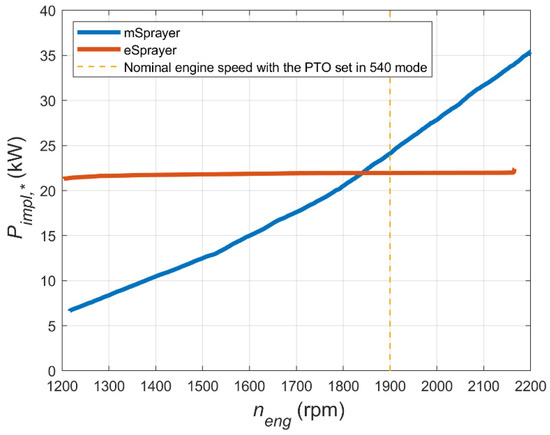
Figure 3.
Power required by both sprayers () with respect to the engine speed () during engine ramping. For both sprayers, the tests were carried out with the same fan nominal speed (i.e., 1800 rpm). data can be used as surrogate data for the fan speed. One can note that for the eSprayer, was nearly constant and consequently fan speed was independent of .
The two implements are equipped with the same hydraulic pump, however, on the eSprayer it is electrically driven, while on the mSprayer it is PTO driven. The design of a different fan drive required a complete redesign of the fan of the eSprayer in order to contain the fan drive, which is bulkier for the eSprayer than that of the mSprayer. However, this bulkiness is counterbalanced by the high efficiency granted by the installed electric motor, indeed the efficiency coefficient of this motor typology varies from 92% to 97% [23]. A standard double cardan shaft could reach even higher values of mechanical efficiency, though these values could heavily drop when there is a remarkable height difference between the tractor PTO and the implement splined shaft. Indeed, in the latter case, the joints of the cardan shaft would form huge angles with the input and output shafts, reducing the mechanical efficiency [24]. Moreover, if the angles that the cardan shaft form with the PTO of the tractor and the splined shaft of the implement are different, a perfectly constant transmission ratio is not reachable [25].
A remarkable difference between the two implement versions is the fan design, which is the same in diameter but with different fan blades. Especially, the eSprayer is equipped with serrated trailing edge blades, which are typically adopted for reducing the noise [26] (Figure 4).
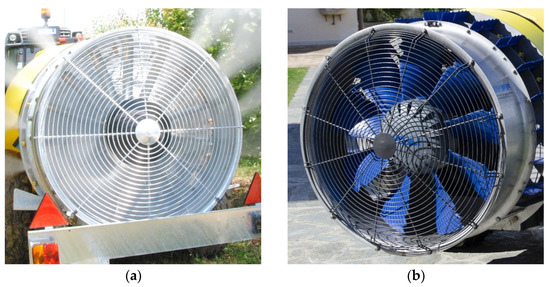
Figure 4.
Nobili 90 Super installed on the mSprayer (a) and Nobili HF95 installed on the eSprayer (b).
2.2.2. Mulchers
The PTO-driven and electrically driven mulchers are, in the following, denoted mMulcher and eMulcher, respectively. Both were used for the test activities shown in Figure 5, and their main specifications are reported in Table 4.
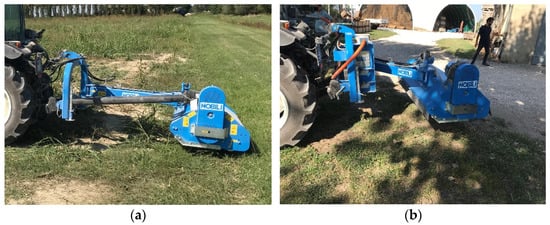
Figure 5.
mMulcher (a) and eMulcher (b) developed by Nobili S.p.a. (Molinella, Bologna, Italy) used for the tests.
Table 4.
mMulcher and eMulcher specifications.
The differences in terms of power drive and implement mass already observed for the sprayers are also present for the mulchers.
Consequently, on the mMulcher, the rotor speed is dependent on the PTO speed, controlled by a fixed ratio through a belt transmission, although on the eMulcher, the rotor speed is controlled by a remote control installed inside the tractor cab.
2.3. Sensors and Acquisition System
Tractor CAN-Bus data were recorded through a stand-alone CAN-Bus data-logger optimized by CNH Industrial according to the approach introduced by Molari et al. [27].
In particular, the CAN-Bus signals with the Suspect Parameter Numbers (SPNs) and parameter numbers group (PNGs) [28,29] reported in Table 5 were used for the analysis.
Table 5.
Signals identification.
The hourly fuel consumption () is derived by the pulsations of the solenoid valve injector controlled by the vehicle electronic control unit (ECU), so some discrepancy may be found between calculated fuel rate and the actual fuel rate. However, noticeable differences between the CANBUS message and the actual fuel rate values are observable only during engine transient phases (up to 6.22%), while during steady phases or averaged analysis the error is minimal [30,31].
The tractor actual speed () and its geospatial position were acquired with a Global Navigation Satellite System (GNSS) receiver embedded in the data-logger.
Moreover, auxiliary sensors were connected to the data-logger to record information that was not otherwise available in the tractor CAN-Bus network. In particular:
- e-Source electric current output (): measured with a current sensor (HAT 200-S, LEM GmbH, Europe) installed inside the e-Source case, on the electric current output cable (Figure 6a).
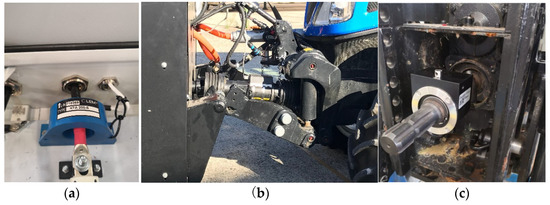 Figure 6. HAT 200-S current sensor installed inside the e-Source (a), custom-made sensored cardan shaft placed between the tractor front PTO and the power pack (b), Datum Electronics Series 420 torquemeter placed between the tractor rear PTO and the cardan shaft (c).
 - Tractor front PTO torque () and speed (): measured with a custom-made sensored cardan shaft (Bondioli and Pavesi S.p.A, Italy) placed between the tractor front PTO and the e-Source (Figure 6b).
- Tractor rear PTO torque () and speed (): measured with a Datum Electronics Series 420 torquemeter (Datum Electronics, UK) placed between the tractor rear PTO and the cardan shaft connected to the implements (Figure 6c).
The following performance parameters were obtained from the previously described signals:
- The engine power ( was calculated with the Equation (1):
- The e-Source input power ( coming from front PTO was calculated with the Equation (2):
- The power absorbed by the PTO driven implements was calculated with Equation (3):
- The power absorbed by the electrified implements was calculated with Equation (4):
2.4. Experimental Tests
In order to perform a comprehensive analysis of the performances of the e-Source and the electric powered implements, the experimental tests presented in the following sections were carried out.
2.4.1. Implement Hitching Time
The time needed by a professional farmer with several years of experience to mount and dismount each implement on the tractor linkages was measured to evaluate any operational benefit brought by the usage of an electrically powered implement. In fact, the usage of the AEF HVPI on the electric implements could allow a reduction of the hitching time since it replaces both the cardan shaft and the hydraulic remotes. The time necessary to mount and dismount each implement was measured with a stopwatch and each operation was repeated three times. Then, the mean value and the standard deviation of the three repetitions was calculated for each implement and operation.
2.4.2. Noise Tests
Noise tests were performed for each implement with the tractor maintained still and with the rear window open following the UNI EN ISO 11201 standard [32] using a Casella CEL-246 phonometer (IDEAL Corporate, Sycamore, IL, USA) (Figure 7).
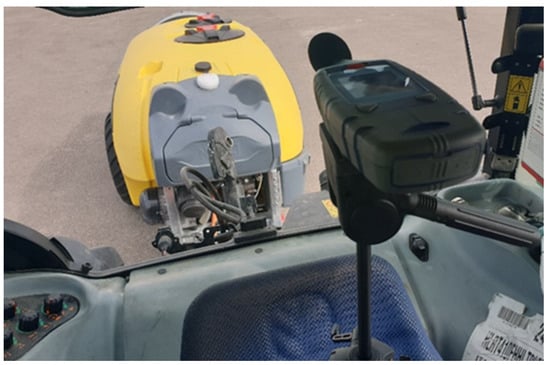
Figure 7.
Casella CEL-246 phonometer and eSprayer during the noise test.
The implements were tested with the same set up adopted for the field tests, so for the mMulcher and the mSprayer, both PTO modes were tested, while for the eMulcher and the eSprayer, was maintained at 1300 rpm. Moreover, for both sprayers, both (i.e., 1300 and 1800 rpm) values were tested. Each test was performed for 30 s, the presented results are the mean values of three repetitions performed in the same condition.
2.4.3. Field Tests
The sprayer field tests were performed in a 2 ha pear orchard with a row spacing of 4.1 m located in Cadriano (BO, Italy) at the Experimental Farm of the University of Bologna (UNIBO) (Figure 8).
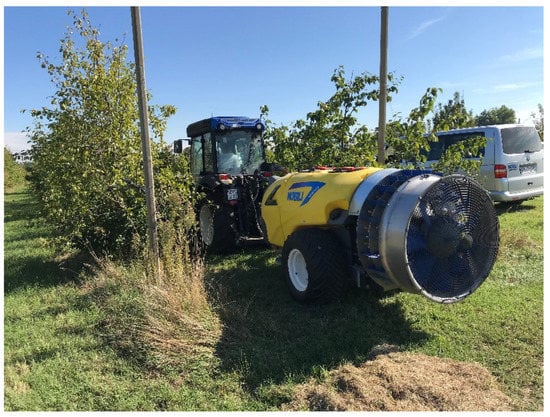
Figure 8.
Orchard of the UNIBO farm during the mSprayer test.
Both sprayers were used in the same operational settings; in particular, they were tested at the same nominal fan speed () (i.e., 1300 and 1800 rpm), pump pressure (i.e., 1.5 MPa), number of open nozzles (i.e., 6), and target (i.e., 5.5 km h−1). Regarding the mSprayer, tests were carried out with PTO operating at 540 rpm in both modes: standard (denoted as 540 in the following) and economy (denoted as 540E in the following). was nearly 1900 rpm and 1500 rpm for 540 and 540E PTO modes, respectively. Since the on the eSprayer is independent of the , the latter was set at the lowest value that simultaneously permits the engine to deliver consistently enough power to perform the operation. Preliminary tests performed by the e-Source manufacturer demonstrated that with set at 1300 rpm, the aforementioned conditions were satisfied for the majority of the agricultural operation on plain ground. This set-up, theoretically, allows farmers to obtain the lowest possible specific fuel consumption since it allows for a reduction in the power demands from accessories [6].
The mulcher tests were performed on a 3 ha agricultural field with old corn residuals and tall grass (SimVin in the following, Figure 9) located in San Pietro Capofiume (BO, Italy). That field was chosen because it could reproduce a comparable environment of vineyard interrow and because during the period of the tests, no orchards or vineyards with the desired conditions were available.
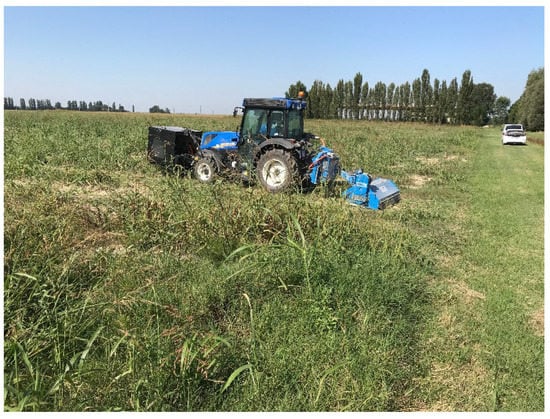
Figure 9.
Field with old corn residuals and tall grass to simulate a vineyard interrow (SimVin) during the eMulcher test.
during the tests was maintained at around 3.1 km h−1 and the mulcher rotor speed ( was set at 2220 rpm for both implements. For both mulchers, was set at the same values as those of the sprayers.
All the field tests were performed with the tractor air conditioning system turned on to reproduce the most realistic working environment.
2.5. Data Analysis
The data acquired from the field tests were elaborated with MATLAB software (The MathWorks, Inc, Natick, MA, USA). Firstly, the recorded signals were interpolated at 0.1 s through a spline interpolation algorithm. Then, the passes were separated from the headland turns, observing the rate of change of calculated with signal differentiation (Figure 10).
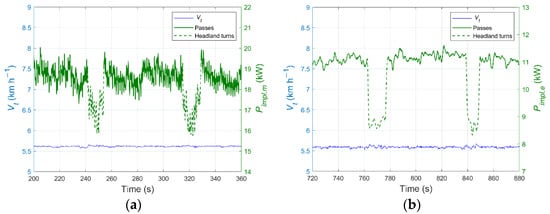
Figure 10.
Portion of tractor speed (), and power absorbed by the mSprayer ( during an acquisition (a). Portion of tractor speed (), and power absorbed by the eSprayer ( during an acquisition (b). One can note the effectiveness of the pass selection. The was mostly constant during headland turns for the large headlands that permitted the machinery to turn with no braking or changing of throttle position. A similar methodology was adopted for both mulchers.
After that, the mean values and the standard deviations of , , , ,, and acquired during the passes were calculated; the average values along passes were denoted with the overbar (i.e., represents the raw signal, while represents the average value during the passes). The e-Source efficiency was calculated with Equation (5):
The following operational and environmental indexes were calculated, considering the data acquired during the headland turns as well:
- The field capacity ( was calculated with Equation (6):where is the implement width for the mulchers or the distance between rows for the sprayers
- The fuel consumption per hectare ( was calculated with Equation (7):
- The CO2 emission per hectare () was calculated with Equation (8):where = 2.65 was based on the calorific value of diesel with a density of 0.835 kg dm−3 [33].
Moreover, the obtained indexes were applied to a UNIBO experimental farm case study, where there are 29 ha devoted to various types of orchards and vineyards. However, orchards and vineyards undergo more than one treatment during the year for spraying and mulching. Using the activity log of the UNIBO experimental farm for the year 2019, the total amount of worked hectares for spraying and mulching () was estimated. The average row spacing of orchards and vineyards of the UNIBO experimental farm was calculated equal to 4.1 m, and this value was used for calculating the number of passes 174 ha. The following indexes were calculated:
- The yearly time spent for the agricultural operation () was calculated with Equation (9):here was 375 ha and 174 ha for the sprayers and mulchers, respectively.
- The diesel liters used during one year for the agricultural operation ( was calculated with Equation (10):
- The yearly diesel cost for the agricultural operation ( was calculated with Equation (11):where = 0.9 € L−1 was the average agricultural diesel price in Italy (March 2021).
- The CO2 emitted per year ( was calculated with the Equation (12):
3. Results
This section is divided into subheadings. It provides a description of the experimental results and their interpretation.
3.1. Implement Hitching Time Results
The implement linkage processes consist of two phases:
- Implement linkage to the TPL of the tractor.
- Power transmission linkage.
The first phase is identical for electrified and mechanical implements, while the second one is remarkably different, as shown in Figure 11. Indeed, the power transmission linkage on the electrified implements is limited to the connection of the AEF HVPI, while on the mechanical ones it occurs through the connection of the cardan shaft, and, only for the mMulcher, also the connection to the hydraulic remotes.
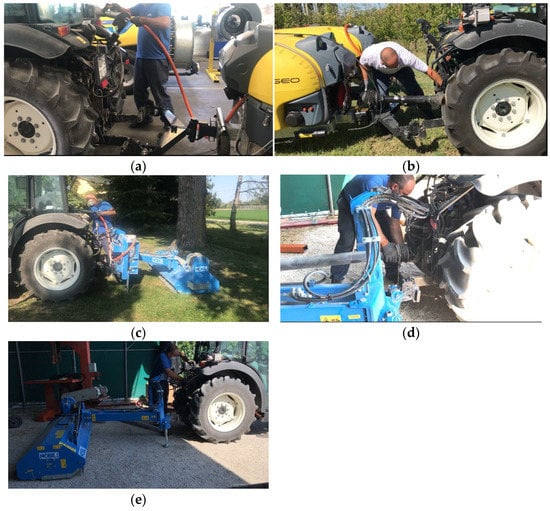
Figure 11.
Video frames of the linkage process of the eSprayer (a) and eMulcher (c) during the plugin of the AEF HVPI; linkage process of the mSprayer (b) and mMulcher during the mounting of the cardan shaft (d) and the hydraulic remotes (e).
The average times needed to perform the implement hitching operations are reported in Table 6. The average times for connecting the mulchers were longer than those of the sprayers due to the higher number of couplings: three hitches instead of two (the mulchers are mounted implements, while the sprayers are trailed implements) and the connection of the hydraulic remotes.
Table 6.
Hitching time of the implements. In the brackets, the standard deviation is reported for each parameter.
One can note that a slight time saving was obtained using the electrically powered implements, mainly for the power transmission linkage. This was mainly due to the faster joining of the AEF HVPI since the time spent to connect the implements to the TPL of the tractor was the same. The measurements were conducted on brand new machinery, so the time spent to mount the cardan shaft could worsen in the long term due to wear and dirt during real in-field activities. In addition to that, the time required for coupling of the hydraulic quick-coupler could also be higher in real-world conditions, since occasionally, high pressure may rise in the pipeline and it must be released to allow the connection of the hydraulic remotes [34]. This issue cannot occur with the AEF HVPI. Moreover, an important improvement could be reached in terms of comfort and safety for the user since the operation of joining the hydraulic remotes and the cardan shaft to the rear PTO is more uncomfortable and potentially more unsafe than joining the AEF HVPI. Indeed, joining mechanical couplings requires greater loads and in uncomfortable positions (i.e., with the back bent), this may be a potential source of musculoskeletal disorders.
3.2. Noise Tests Results
The noise test results obtained with the eSprayer and mSprayer with set at 1300 rpm and 1800 rpm are reported in Table 7 and in Table 8, respectively.
Table 7.
Noise tests results with fan speed () set at 1300 rpm.
Table 8.
Noise tests results with fan speed () set at 1800 rpm.
One can note from Table 7 and Table 8 that the eSprayer produced conspicuously lower sound pressure levels than the mSprayer, a maximum reduction of 11.3 dBA was measured with set at 1800 rpm. However, this remarkable result was caused by the engine downspeed permitted by the driveline electrification, the absence of the cardan shaft rotating at high speed, and the different design of the fan blades of the eSprayer. It is arduous to estimate the contribution of each factor on the noise reduction.
The mulcher results presented in Table 9 show that the eMulcher registered lower sound pressure levels than the mMulcher, reductions of 4.5 dBA and 5.0 dBA reduction were measured with the PTO in 540E and 540 modes, respectively.
Table 9.
Noise tests results with the mulchers.
This improvement was mainly due to the engine downspeed and mulcher drivelines; in particular, the absence of the cardan shaft rotating at high speed on the eMulcher ensures that the latter is less noisy since no mechanical vibrations are transmitted to the tractor and the implement.
3.3. Field Test Results
3.3.1. Field Performance
The performance parameters obtained with the eSprayer and mSprayer with set at 1300 rpm and 1800 rpm are reported in Table 10 and in Table 11, respectively.
Table 10.
Performance parameters obtained with fan speed () set at 1300 rpm. In the brackets, the standard deviation of each parameter is reported.
Table 11.
Performance parameters obtained with fan speed () set at 1800 rpm. In the brackets, the standard deviation of each parameter is reported.
One can note that the during all the tests ranged from 5.37 km h−1 to 5.62 km h−1, which is consistent with the chosen test procedure, where the chosen target was 5.5 km h−1. When was set at 1800 rpm, the differences in terms of at 540 and 540E modes were limited, as expected, since the sprayer fan rotates almost at the same speed. With set at 1300 rpm, differences of between the two PTO operating modes were more evident than those at set at 1800 rpm; however, those were still acceptable and caused by the fact that tests were performed in real working conditions and not in a controlled environment. Moreover, with set at 1300 rpm, was significantly lower than . In particular, −40% compared with that of the mSprayer in 540E mode and −33% in 540 mode. With set at 1800 rpm, the eSprayer still absorbed less power than the mSprayer, but in this case there were limited differences (around 10–12% lower). These differences were mainly due to the different transmission drive and to the different fan blade design. The analysis of the standard deviation shows that higher values were obtained on the mSprayer. This was due to the slight variability of the angles that the cardan shaft formed with the PTO of the tractor and the splined shaft on the implement during the operation, causing a non-constant transmission ratio, and this led to a certain variability in that was not observed in (Figure 10). The e-Source was demonstrated to have a high in both configurations, indeed values of 0.85 and 0.92 were measured in the two tests with set at 1300 rpm and 1800 rpm, respectively. One can note from the previous tables that a remarkable engine downspeed is reachable with the adoption of the eSprayer. Indeed, the measured on the eSprayer was markedly lower than those measured with the mSprayer, therefore even the showed a similar behavior. In particular, with the eSprayer with at 1300 rpm, was 33.3% lower than the one obtained with the mSprayer with the same actuated by the PTO in 540 mode. Furthermore, with the set at 1800 rpm, with the eSprayer was 21.4% lower than the one obtained with the mSprayer with the same actuated by the PTO in 540 mode. The analysis of the results obtained with the mulchers (Table 12) shows that the during all the tests ranged from 3.06 km h−1 to 3.12 km h−1, which is consistent with the chosen methodology where the target was chosen to 3.1 km h−1. The measured during the eMulcher test was 0.90, very similar to those obtained during the eSprayer tests. The measured during the mulcher tests were lower than those measured on the sprayers and all the values lay in the range between 3.0 kW and 4.7 kW. Theoretically, of the eMulcher and the mMulcher should be very similar, since the two implements have the same area capacity, rotor design, and they were used in the same working conditions. Therefore, the differences in showed in the results were mainly caused by the different transmission systems installed on the two mulchers, the slight differences in and the natural variability of the residuals on the fields. Even if a slight difference in terms of between the mMulcher and eMulcher can be observed, the latter registered a reduction of of 29.8% with respect to the mMulcher used with the PTO in 540 mode. This was due, once again, to the independence of from , allowing the machines to perform the field operation at lower and, consequently, lower and .
Table 12.
Performance parameters obtained with the mulchers on SimVin. In the brackets, the standard deviation of each parameter is reported.
3.3.2. Operational and Environmental Indexes
Operational and environmental indexes obtained with the eSprayer and mSprayer with set at 1300 rpm and 1800 rpm are reported in Table 13 and in Table 14, respectively.
Table 13.
Operational and environmental indexes with fan speed () set at 1300 rpm. These results were calculated supposing a field area to work equal to 375 ha.
Table 14.
Operational and environmental indexes with fan speed () set at 1800 rpm. These results were calculated supposing a field area to work equal to 375 ha.
The saving in terms of followed the same trend observed for the since the travelling speeds were very similar (and consequently the ) for each test. Regarding the UNIBO farm case study, the yearly money saving due to the saved fuel ranged from 337 € to 506 € for set at 1300 rpm and from 270 € to 405 € for set at 1800 rpm, depending on the considered PTO mode.
Even for the mulchers (Table 15), the savings in terms of followed the same trend observed for the for the same aforementioned reasons. Regarding the UNIBO farm case study on SimVin, the yearly money saving due to the saved fuel ranged from 360 € with the PTO in 540E mode to 673 € with the PTO in 540 mode. Both for the eSprayer and the eMulcher, besides the money-saving due to a fuel consumption reduction, a cost that could be lower compared to their rear PTO homologues is the maintenance cost. In fact, the greasing operation on the cardan shaft and on other moving parts is not necessary. Regarding , the usage of the tested electrified implements could permit a reduction of CO2 emission of up to 2019 kg year−1. This value may seem not very significant, but it gains fundamental importance if it is multiplied for the thousands of machines worldwide that could benefit from this technology in the future.
Table 15.
Operational and environmental indexes with the mulchers on SimVin. These results were calculated supposing a field area to work equal to 174 ha.
4. Discussion and Conclusions
The necessity to increase the efficiency of agricultural machinery is pushing manufacturers in searching for novel solutions to increase fuel efficiency. Electrification is probably the solution in which manufacturers are seriously investing currently. In this study, two electrified implements were compared with their equivalent mechanical counterparts. The electric implements were powered with an electric generator powered with the front PTO of the tractor. The electric power was delivered to implements through the AEF HPVI electric plug, which would replace hydraulic remotes and the PTOs. The field test reported a greater fuel efficiency of the electrified implements with respect to the mechanical counterparts and the fuel efficiency benefits were greater, in percentage, with low-demand operations due to the engine downspeed. Moreover, the fuel, money, and CO2 savings estimated in this study were calculated assuming that all orchards and vineyards have the same row spacing, and this may not always occur. So, the actual savings may be significantly different than those calculated in this study. However, these figures allowed us to evaluate how much farmers may benefit with this solution.
The engine downspeed would be beneficial also in terms of the increased durability of rotating the components of the transmission due to the fact that the number of damaging cycles will be reduced [35].
A more in-depth economic analysis that also includes the generator and implement purchase prices and the repair and maintenance costs is not possible at this stage of their development processes. Indeed, these devices are not currently on the market and a more extensive measurement campaign is needed to obtain additional data to fill these shortcomings.
Electrification of implements will also permit the introduction of additional functionalities, which is very important, especially for sprayers where novel solutions for avoiding overdosing or drift have been studied [36]. The advantages of the proposed solution with respect to the mechanical and the hydraulic counterparts are also enhanced with improvements in the safety of farming, which is still plagued by a high number of accidents worldwide. Indeed, injuries from mechanical PTOs are rather frequent and appear to be around 2000 injuries per year in the U.S [37]. Major causes are the lack of adequate shielding and the presence of any protrusion (i.e., locking pin, bolt, cotter pin, grease fitting) that can catch operator clothing. Even if these accidents are not as frequent as others (i.e., tractor rollovers [38]), the consequences are severe since they may lead to death, amputation, and fractures [39,40,41]. Hydraulic power is much safer than mechanical PTO, but it is not completely free from any danger since injection injuries may occur in certain conditions [37]. Injection injuries occur when a body part is in contact with a high pressure fluid and the impact of the injury is seriously dependent on the toxicity of the fluid [42]. The surplus weight on the tractor front axle due to the presence of the e-Source could increase the soil compaction. However, this issue is counterbalanced by the absence of the ballast, which is typically mounted on the front linkage instead of the e-Source. Finally, the solution of an external electric generator is a solution that permits farmers to obtain full advantage of electrified implements, even if they use old tractors.
Author Contributions
Conceptualization, M.V. and M.M.; methodology, M.V. and M.M.; formal analysis, G.M. and M.M.; resources, G.M.; writing—original draft preparation, M.V.; writing—review and editing, G.M. and M.M.; funding acquisition, M.M. All authors have read and agreed to the published version of the manuscript.
Funding
This research was funded by Ministry of University and Research, grant number 2017SW5MRC.
Data Availability Statement
Data sharing not applicable.
Acknowledgments
We would like to thank Stefano Fiorati, Nicola Lenzini, and Andrea Traversi from CNH Industrial and Marco Bertazzoli, Matteo Montanari, and Gianmaria Selvatici from Nobili S.p.a. for their technical support during this research. This project was founded by PRIN (Research Projects of Significant National Interest) notification 2017 “Green SEED: Design of more-electric tractors for a more sustainable agriculture”, grant number: 2017SW5MRC.
Conflicts of Interest
The authors declare no conflict of interest.
References
- Qiao, H.; Zheng, F.; Jiang, H.; Dong, K. The greenhouse effect of the agriculture-economic growth-renewable energy nexus: Evidence from G20 countries. Sci. Total. Environ. 2019, 671, 722–731. [Google Scholar] [CrossRef]
- IPCC. Climate Change 2014: Mitigation of Climate Change; Cambridge University Press: Cambridge, UK, 2015; ISBN 978-1-107-05821-7. [Google Scholar]
- Molari, G.; Mattetti, M.; Lenzini, N.; Fiorati, S. An updated methodology to analyse the idling of agricultural tractors. Biosyst. Eng. 2019, 187, 160–170. [Google Scholar] [CrossRef]
- Troncon, D.; Alberti, L.; Mattetti, M. A Feasibility Study for Agriculture Tractors Electrification: Duty Cycles Simulation and Consumption Comparison. In Proceedings of the 2019 IEEE Transportation Electrification Conference and Expo (ITEC), Novi, MI, USA, 19–21 June 2019; pp. 1–6. [Google Scholar]
- Rudder, K.D. Tier 4 High Efficiency SCR for Agricultural Applications. SAE Int. J. Commer. Veh. 2012, 5, 386–394. [Google Scholar] [CrossRef]
- Saetti, M.; Mattetti, M.; Varani, M.; Lenzini, N.; Molari, G. On the power demands of accessories on an agricultural tractor. Biosyst. Eng. 2021, 206, 109–122. [Google Scholar] [CrossRef]
- Mattetti, M.; Varani, M.; Maraldi, M.; Paolini, F.; Fiorati, S.; Molari, G. Tractive performance of Trelleborg PneuTrac tyres. J. Agric. Eng. 2020, 51, 100–106. [Google Scholar] [CrossRef]
- Stoss, K.J.; Sobotzik, J.; Shi, B.; Kreis, E.R. Tractor Power for Implement. Operation—Mechanical, Hydraulic, and Electrical: An. Overview; ASABE Distinguished Lecture Series: St. Joseph, MI, USA, 2013; pp. 1–30. [Google Scholar]
- Huber, C.; Morselli, R.; Posselius, J. PTO Transmission System in a Work Vehicle 2016. U.S. Patent US9446664B2, 20 September 2016. [Google Scholar]
- Rodeghiero, R.A.; Stettler, W.; Klabunde, B.; Niebergall, J.A. Transmission for power take-off 2007. U.S. Patent US7207916B2, 24 July 2007. [Google Scholar]
- Sedoni, E.; Balboni, C. CVT Hydromechanical Drive. U.S. Patent US7828683B2, 9 November 2010. [Google Scholar]
- Thomas, R.S.; Buckmaster, D.R. Development of a computer-controlled, hydraulic, power take-off (PTO) system. Trans. ASAE 2005, 48, 1669–1675. [Google Scholar] [CrossRef]
- Moreda, G.P.; Muñoz-García, M.A.; Barreiro, P. High voltage electrification of tractor and agricultural machinery–A review. Energy Convers. Manag. 2016, 115, 117–131. [Google Scholar] [CrossRef]
- Scolaro, E.; Beligoj, M.; Perez, M.E.; Alberti, L.; Renzi, M.; Mattetti, M. Electrification of Agricultural Machinery a Review. Proc. IEEE 2021, 1–18, Submitted. [Google Scholar]
- ISO. ISO/CD 23316-1: Tractors and Machinery for Agriculture and Forestry—Electrical High Power Interface 700VDC/480VAC—Part 1: General Description under Development; ISO: Geneve, Switzerland, Under Development.
- Rahe, F.; Resch, R. Electrification of Agricultural Machinery from the Perspective of an Implement. Manufacturer; SAE International: Warrendale, PA, USA, 2017. [Google Scholar]
- Bumberger, R.; Klinger, W.; Botev, D. Electric Traction Drive on a Plough–More power for the Driveline. In Land.Technik AgEng 2017; VDI-Berichte: Hannover, Germany, 2017. [Google Scholar]
- Gugel, B.B. Electrification as Enabler for New Tractor-Implement Solutions. In Land.Technik AgEng 2015; VDI-Berichte: Hannover, Germany, 2015; Volume 6, pp. 65–70. [Google Scholar]
- Heckmann, M.; Bernhardt, H. Comparative Analysis of Hydrostatic and Electric Rear Axle Traction Drives, include In-Field-Tests. In Land.Technik AgEng 2013; VDI-Berichte: Hannover, Germany, 2013. [Google Scholar]
- Wiecha, J.G.; Bernhardt, H.; Bögel, T.; Herlitzius, T. Reducing draft force on mounted implements by an electrified traction roller. In International Conference on Agricultural Engineering AgEng 2019; VDI-Berichte: Hannover, Germany, 2019. [Google Scholar]
- Strasser, R.; Badua, S.; Sharda, A.; Mangus, D.; Haag, L. Performance of planter electric-drive seed meter during simulated planting scenarios. Appl. Eng. Agric. 2019, 35, 925–935. [Google Scholar] [CrossRef]
- Weinmann, O.; Götz, T.; Wessels, T.; Rahe, F. Electrification of a Tractor with Implement; VDI-Berichte: Düsseldorf, Germany, 2012. [Google Scholar]
- Dambrauskas, K.; Vanagas, J.; Zimnickas, T.; Kalvaitis, A.; Ažubalis, M. A Method for Efficiency Determination of Permanent Magnet Synchronous Motor. Energies 2020, 13, 1004. [Google Scholar] [CrossRef]
- Cavacece, M.; Valentini, P.P.; Vita, L. Mechanical Efficiency Analysis of a Cardan Joint. In Proceedings of the 2004 ASME Design Engineering Technical Conferences and Computers and Information in Engineering Conference, Salt Lake City, UT, USA, 28 September–2 October 2004. [Google Scholar]
- An, K.; Wang, W. Transmission performance and fault analysis of a vehicle universal joint. Adv. Mech. Eng. 2017, 9. [Google Scholar] [CrossRef]
- Gruber, M.; Joseph, P.; Chong, T. On the mechanisms of serrated airfoil trailing edge noise reduction. In Proceedings of the 17th AIAA/CEAS Aeroacoustics Conference (32nd AIAA Aeroacoustics Conference), Portland, OR, USA, 5–8 June 2011; American Institute of Aeronautics and Astronautics: Reston, VA, USA, 2011. [Google Scholar]
- Molari, G.; Mattetti, M.; Perozzi, D.; Sereni, E. Monitoring of the tractor working parameters from the CAN-Bus. J. Agric. Eng. 2013, 44, 384–386. [Google Scholar] [CrossRef]
- ISO. ISO 11783-7: Tractors and Machinery for Agriculture and Forestry-Serial Control and Communications Data Network Implement. Messages Application Layer; ISO: Geneve, Switzerland, 2015; p. 185. [Google Scholar]
- SAE. J1939/71-Vehicle Application Layer; Ground Vehicle Standard: Warrendale, PA, USA, 2016. [Google Scholar]
- Marx, S.E. Controller Area Network (Can) Bus J1939 Data Acquisition Methods And Parameter Accuracy Assessment Using Nebraska Tractor Test Laboratory Data. Ph.D. Thesis, University of Nebraska, Lincoln, Nebraska, 2015. [Google Scholar]
- Marx, S.; Luck, J. Assessing accuracy of machine CAN bus data using SAE J1939 and Nebraska tractor test laboratory data. Am. Soc. Agric. Biol. Eng. 2014, 3, 1893–1901. [Google Scholar]
- UNI UNI EN ISO 11201. Acoustics—Noise Emitted by Machinery and Equipment—Determination of Emission Sound Pressure Levels at a Work Station and at Other Specified Positions in an Essentially Free Field Over a Reflecting Plane with Negligible Environmental Corrections; ISO: Geneve, Switzerland, 2010. [Google Scholar]
- Geerlings, H.; van Duin, R. A new method for assessing CO2-emissions from container terminals: A promising approach applied in Rotterdam. J. Clean. Prod. 2011, 19, 657–666. [Google Scholar] [CrossRef]
- Herzan, G. Quick Action Couplings: The Tractor To Implement. Hydraulic Interface; ASABE Distinguished Lecture Series: St. Joseph, MI, USA, 1982; pp. 1–14. [Google Scholar]
- Mattetti, M.; Maraldi, M.; Sedoni, E.; Molari, G. Optimal criteria for durability test of stepped transmissions of agricultural tractors. Biosyst. Eng. 2019, 178, 145–155. [Google Scholar] [CrossRef]
- Escolà, A.; Rosell-Polo, J.R.; Planas, S.; Gil, E.; Pomar, J.; Camp, F.; Llorens, J.; Solanelles, F. Variable rate sprayer. Part 1–Orchard prototype: Design, implementation and validation. Comput. Electron. Agric. 2013, 95, 122–135. [Google Scholar] [CrossRef]
- Thomas, R.S.; Buckmaster, D.R. Relative Safety of Traditional Agricultural Tractor Power Take–Off (PTO) Drivelines Compared to Fluid Power–A Review. J. Agric. Saf. Health 2003, 9, 241–250. [Google Scholar] [CrossRef] [PubMed]
- Molari, G.; Badodi, M.; Guarnieri, A.; Mattetti, M. Structural Strength Evaluation of Driver’s Protective Structures for Self-Propelled Agricultural Machines. J. Agric. Saf. Health 2014, 20, 165–174. [Google Scholar]
- Beer, S.; Deboy, G.; Field, W. Analysis of 151 Agricultural Driveline-Related Incidents Resulting in Fatal and Non-Fatal Injuries to U.S. Children and Adolescents Under Age 18 from 1970 through 2004. J. Agric. Saf. Health 2007, 13, 147–164. [Google Scholar] [CrossRef] [PubMed]
- Beer, S.; Field, W.E. Analysis of Factors Contributing to 674 Agricultural Driveline-Related Injuries and Fatalities Documented Between 1970 and 2003. J. Agromed. 2005, 10, 3–19. [Google Scholar] [CrossRef]
- Karlson, T.; Noren, J. Farm tractor fatalities: The failure of voluntary safety standards. Am. J. Public Health 1979, 69, 146–149. [Google Scholar] [CrossRef][Green Version]
- Hogan, C.; Ruland, R. High-pressure Injection Injuries to the Upper Extremity: A Review of the Literature. J. Orthop. Trauma 2006, 20, 503–511. [Google Scholar] [CrossRef] [PubMed]


Publisher’s Note: MDPI stays neutral with regard to jurisdictional claims in published maps and institutional affiliations. |
© 2021 by the authors. Licensee MDPI, Basel, Switzerland. This article is an open access article distributed under the terms and conditions of the Creative Commons Attribution (CC BY) license (https://creativecommons.org/licenses/by/4.0/).