Abstract
In China, deep tillage (DT; to >20 cm soil depth) has increased crop yields by improving soil properties, while no-tillage (NT) has been recommended to reduce the labor and machinery costs. Local farmers are willing to adopted rotary tillage (RT; harrowing to 10–15 cm depth) for easy management. However, the effects of these tillage management methods on agronomic productivity, greenhouse gas (GHG) emissions, soil organic carbon (SOC) sequestration, and economic return have not been quantified systematically, and their effectiveness remains in question. Here, we present a meta-analysis of the effects of these methods using 665 paired measurements from 144 peer-reviewed studies. The results indicated that DT significantly increased crop yields by 7.5% relative to RT, and even greater increases were observed in regions with low temperatures and with a wheat cropping system. In contrast, NT resulted in a yield reduction of 3.7% relative to RT, however, controlling for the appropriate temperature and long extension duration (>15 yr) could reduce yield losses and even increase the yield. Both DT and NT significantly enhanced SOC sequestration relative to RT. Adoption of DT would lead to both higher total GHG emissions (N2O and CH4) and increased energy costs, while NT reduced GHG emissions. DT management exhibited a positive net profit for all cropping systems; NT decreased the net profit for rice and wheat but increased the profit for maize. Our study highlighted the agronomic, environmental, and economic benefits and trade-offs for the different tillage methods and should enable investors and policymakers to ensure the best tillage management decisions are made depending on the location-specific conditions.
1. Introduction
Agriculture faces many challenges to sustainably feed a growing population by increasing yields while mitigating climate change [1,2]. Soil management is at the heart of these challenges because resilient and productive soils are necessary to sustainably intensify agriculture [3,4]. Reasonable tillage management can effectively improve the soil quality and agricultural sustainability, serving to conserve and regenerate productive soil. Although the effects of tillage management on crop yield depend on localized climate and soil conditions, it is meaningful to evaluate the yield effects at the regional or national scale [5,6,7,8]. Meanwhile, integrated assessments of tillage alternatives in terms of their ability to mitigate climate change and sequester soil carbon (SOC), are lacking [9,10,11,12]. This relationship must be quantified to set a general framework for how soil management could potentially contribute to sustainable intensification goals while achieving food security and mitigating climate change.
China has a long history of implementing tillage management to achieve high yields [13]. Deep tillage (DT), with a tillage depth of >20 cm, can relieve soil compaction, improve root proliferation, and thereby increase crop yields [14,15]. However, DT promotes the activity of soil microbes, which may increase the emission of greenhouse gases, such as nitrous oxide (N2O) and methane (CH4) [16,17]. No-tillage (NT) management does not disturb the soil and retains at least 30% of crop residues on the soil surface, which increases its water retention potential, reduces cost, increases efficiency, and reduces soil erosion [18,19,20]. Rotary tillage (RT) generally uses a cultivation depth of <20 cm; it has the advantage of being convenient in terms of mechanical equipment, it ensures good quality of the cultivated land, and has a low power requirement. In practice, RT has been widely-adopted and has spread quickly across China due to being easy to manage with low costs, and especially in the paddy fields of South China, the proportion of rotary tillage is more than 80% [16,21,22]. Current research has focused on the difference between conventional DT and NT practices [23,24,25]. We compared deep tillage and no tillage with rotary tillage and analyzed their benefits and trade-off effects, hoping to recognize promising alternatives, which is essential for local producers and policymakers.
In general, DT increased crop yield while NT decreased yield relative to conventional RT [16,26]. However, their relationship to yield is highly influenced by climate conditions, soil properties, and soil management practices [8,23], and the effect may even be reversed under different environmental conditions and management plans [6,8,23]. For example, because DT increased the temperature of arable land, it tended to result in higher yield, especially at relatively low temperatures [21,27]. Long-term NT management combined with straw returning is conductive to promoting the soil fertility, water conservation, and the microbial activity of rhizosphere soil [8,28,29], thereby maintaining or even increasing crop yield following an extended duration of NT. These inconsistent results highlight the importance of developing a mathematical understanding of how yield responses to tillage management plants are influenced by environment and management systems, and this can be used to protect and manage our soil and crop production.
The magnitude and direction of climate change mitigation vary due to the highly variable effects of tillage management plans on SOC changes and soil GHG fluxes. DT-induced increases in crop biomass can result in greater crop residue return to the soil, but intensive soil disturbance might increase SOC losses from stimulated decomposition [30,31]. Meanwhile, deep plowing may increase the SOC compared with NT, possibly due to soil mixing and turning the residue over onto the topsoil [16]. Some have suggested that soil N2O emissions are expected to be greater with NT compared to conventional DT due to soil compaction and the higher soil moisture content [23,25], while others predict fewer emissions under NT owing to reduced soil temperatures and limited soil microbial activities [32,33]. Also, GHG emissions of the fuel used for tillage should be considered because NT and RT practices significantly reduce fuel consumption [10].
Profitability is important when it comes to evaluating the impact of various tillage practices. The yield change brought about by alternative tillage practices represents an important economic factor [34]. Meanwhile, labor and machine expenses for intensive tillage account for a high share of the agricultural costs [34]. For example, the yield response could be offset or exacerbated by changes in the soil, and for different crops; NT treatment provided a higher net benefit than DT for maize production [10]. Recently, the global warming cost and impacts of GHG emissions in terms of their harmful effects on the environment and human health were also added into the equation of the economic benefits [20,35]. Thus, a comprehensive trade-off analysis should examine the most economical and appropriate tillage strategy for sustainable intensification.
This study aims to address the limits and uncertainties of our current understanding of the effects of tillage on agronomic productivity, climate change mitigation, and economic return as a function of climate conditions, soil properties, and soil management. Based on data compiled from the literature, we employed a meta-analytical method to investigate variation in yield, GHG emissions, and SOC resulting from different tillage implementation plans, hoping to clarify the trade-offs or co-benefits of agronomic, economic, and environmental benefits under various tillage treatments. Based on the above research objective, our investigation was comprised of three steps. First, we regarded the RT as the control and compared it with DT and NT. Second, we explored crop yield changes induced by tillage under different climatic conditions, soil properties and management plans. Third, we investigated the extent to which climate change mitigation causes changes in SOC, GHG emissions, and energy consumption. Our assessment will help to determine whether a tillage method can achieve sustainable development by increasing yields while mitigating climate change.
2. Materials and Methods
2.1. Database Compilation
We conducted a comprehensive literature review to search for peer-reviewed publications that reported the effects of tillage management on yield, SOC sequestration, and GHG emissions prior to November 2018. We selected wheat, maize, and rice as our research objects. Wheat, maize, and rice are important cereal crops in China, accounting for 56% of China’s arable land and 58% of the total plant protein in China [36]. Besides, the availability of data also limits the analysis for other crops, as the tillage managements of other crops are relatively simple in China. All data were derived from publications found by searching for keywords (‘tillage management’, ‘deep tillage’, ‘no-tillage’, ‘rotary tillage’, ‘yield’, and ‘GHG emission’) in the Web of Science database and the China Knowledge Resource Integrated Database. The literature needed to satisfy the following criteria: (a) only field experiments associated with three cereal crops (wheat, maize, rice) were included in this study; (b) experiments contained at least two different tillage management plans, including RT as the control; and (c) crop yield, SOC sequestration, or cumulative GHG emission during the crop growth period had to be explicitly reported with the published data. If the data were presented in a graph, the data were digitized using Get Data Graph Digitizer software. Publications amounting to 144 in number were included in our database, and the time period of the literature was from 1999 to 2018, mainly published in the 2010s (meta-analysis references were available in the Supplementary Materials). In total, 551 comparisons for yield, 213 comparisons for SOC sequestration, and 153 comparisons for GHG emissions derived from 144 publications were selected from the databases. The following details were also compiled from the selected publications: location (longitude/latitude), climatic conditions (annual mean temperature and precipitation), soil properties (soil bulk density, SOC, and available N), N application rate, tillage duration, yield components [spike numbers (for wheat and rice) or cob numbers (for maize), grain numbers per spike (wheat and rice) or cob (maize), and thousand kernel weight] and experimental treatments [crop types, available agronomic traits, and straw return (SR)].
2.2. Data Analyses
We conducted a random-effect meta-analysis to assess the variable effects by comparing the results of tillage management treatments and the controls using the following equation:
where ln R is the effect size calculated as the natural log of the response ratio for each comparison, Xt is the mean value of the variable (e.g., yield, GHG emission, and SOC sequestration) in DT or NT treatments, and Xc is the mean value of the variable in RT treatments. Log-transformation of the response ratio was carried out to stabilize the variance. Its variance (v) is estimated as:
where nt and nc are the sample sizes for treatments and controls, respectively, and St and Sc are the standard deviation for the treatment and control groups, respectively. The effect size of each observation was weighted by the inverse of the variance. Resampling procedures [bootstrap (n = 4999)] were used to generate the mean effect and 95% confidence intervals (CIs) for each grouping category. Mean effect sizes of treatment were considered significantly different from those of the control if the 95% CIs did not overlap with zero, while the effects for which the 95% CIs overlapped with zero were not significant. To improve the explanatory power, the mean effect size was transformed back to the percentage change for the DT or NT management plans relative to the RT practice and computed as:
ln R = ln(Xt/Xc) = ln(Xt) − ln(Xc)
v = St2/ntXt2 + Sc2/ncXc2
(elnR − 1) × 100%
A nonparametric smooth regression was fitted for the continuous variables based on a Gaussian process model. Shaded bands indicate 95% CIs, which can be considered significantly positive or negative if the 95% CIs do not overlap with zero. The meta-analysis and Gaussian process models were implemented using R software (version 3.6).
2.3. Economic and Environmental Estimate
The estimated benefits for grain yield and net profit were calculated using the following Equations (4)–(6):
where YT is the crop yield of tillage treatment (DT or NT; kg ha−1), YCK is the crop yield of RT (kg ha−1), YR is the relative crop yield (kg ha−1), YP represents the yield profit [Chinese yuan (CNY) ha−1], Cprice represents the price of cereal crops (maize, wheat, and rice prices are 2.2, 2.4, and 2.8 CNY kg−1, respectively; National Compilation of Cost-benefit Data of Agricultural Products, 2015), and PN represents the net profit (CNY ha−1). CT and CGW represent the relative tillage cost and global warming cost (subtracting the cost of the tillage treatment from the RT; CNY ha−1), respectively; the CT parameters were based on the published literature, and the parameters are listed in Table 1. The cost of global warming is defined here as the cost caused by nitrous oxide and methane emissions from different tillage managements, and we calculated the global warming cost according to the market price of CO2 for 2008, which closed at 169.36 CNY per ton, based on the published literature [20].
YR = YT − YCK
YP = YR × Cprice
PN = YP − CT − CGW

Table 1.
Relative costs and GHG emissions of tillage methods. Relative tillage costs (CNY ha−1) and GHG emissions (kg CO2-eq ha−1) for DT and NT compared to RT. Values were obtained from the cited literature. GHG, greenhouse gas; CNY, Chinese yuan; DT, deep tillage; NT, no tillage; RT, rotary tillage.
We calculated and estimated the total GHG emissions (kg CO2-eq ha−1) based on the emissions of N2O and CH4, SOC sequestration, and machine fuel consumption produced by different tillage management practices, and the functions are listed as Equations (7)–(9):
where CE (GHG) is the cumulative GHG (kg ha−1) emissions; we used the Intergovernmental Panel on Climate Change (IPCC) factors (25 for CH4 and 298 for N2O) to calculate the GHG emissions (kg CO2-eq ha−1) [37]. GHG tillage represents the GHG emission due to machine fuel consumption. We calculated GHG tillage based on data from the published literature, and the parameters are listed in Table 1. The △GHG (kg CO2-eq ha−1) represents the total GHG emissions.
GHG (CH4) = CE (CH4) × 25
GHG (N2O) = CE (N2O) × 298
△GHG = GHG (CH4) + GHG (N2O) + GHG tillage
3. Results
3.1. Tillage Impacts on Crop Yields under Different Environments
On average, DT increased yields by 7.5% (n = 285), while NT reduced yields by 3.7% (n = 266), which differed significantly from RT (Figure 1). The low yield for NT contributed significantly to an average 3.6% reduction in spike or cob numbers, but there were no significant effects for grain number or thousand kernel weight (TKW). DT significantly increased spike or cob numbers and the number of grains per spike or cob (3.0% and 5.1%, respectively); DT also partially increased the TKW, although the effect was not significant (Figure 1). Meanwhile, the crop leaf area index (LAI) was significantly increased with DT but decreased with NT. There was no significant difference in plant height and emergence rate between the different tillage practices (Figure 1).
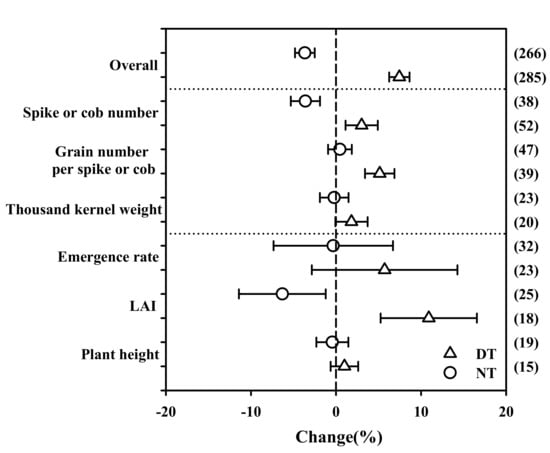
Figure 1.
Changes in crop yields and agronomic traits under DT and NT compared to RT management plans. Triangles and circles indicate the effect size of DT and NT, respectively. The number of observations (n) for each category is shown in parentheses. Error bars represent 95% confidence intervals (CIs). Differences are considered significant when the CIs do not include zero. LAI: leaf area index; DT, deep tillage; NT, no tillage; RT, rotary tillage.
Based on the available data, average precipitation, and temperature, SOC, tillage duration, crop category, and SR were effective predictors of the impacts of tillage on crop yield (Figure 2). The increased yield observed for DT relative to RT showed a downward trend with increased annual precipitation (Figure 2a) and also decreased significantly with a rise in temperature (Figure 2b). The largest increase in crop production occurred under relatively low annual temperatures. The SOC stock exhibited an optimal level for increased crop production under DT, and this increase remained stable or was reduced only slightly when continuous DT was implemented for cereal crops (Figure 2c,d). Positive and significant yield effects were detected for different cereal crops under DT, and the effects were significantly higher in wheat than in rice (Figure 2e).
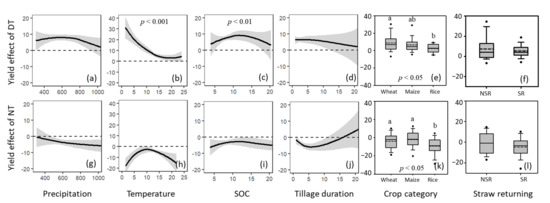
Figure 2.
Relative yield percentage changes in DT and NT compared with RT management plans, dependent on climatic conditions ((a,g), annual mean precipitation; (b,h), annual average temperature), soil properties ((c,i), soil organic carbon (SOC)) and experimental conditions ((d,j), tillage duration; (e,k), crop category; (f,l), SR). (a–f) are for DT practice; (g–l) are for NT practice. Shaded bands indicate 95% confidence intervals. p < 0.001, 0.01, 0.05 indicate significant correlation between tillage-induced yield effects. Different letters for crop category (e,k) indicate significant difference between treatments at p < 0.05. SR, straw returning; NSR, no straw returning; DT, deep tillage; NT, no tillage; RT, rotary tillage.
NT showed a reduction in yield with increased precipitation; however, there was a lower yield reduction, or even no yield loss, at moderate temperatures (Figure 2g,h). Similar to DT management plans, higher yield was detected in response to an optimal SOC content (Figure 2i). Continuous adoption of NT reduced the negative effects on crop yields and even increased yield when NT was carried out for >15 years (Figure 2j). The application of NT in paddy fields resulted in a significant yield reduction compared with wheat and maize (Figure 2k). The application of SR did not change the yield response to tillage when compared with no SR (NSR; Figure 2f,l).
3.2. Effects on Soil Carbon Sequestration and GHG Emission
In general, despite a large variation in the basic SOC content, DT and NT management plans both had significant and positive effects on SOC sequestration relative to RT. DT significantly increased SOC sequestration by 5.8% (n = 29, p < 0.05) and NT increased SOC sequestration by 5.2% (n = 43, p < 0.01) compared to RT (Figure 3A). The storage of SOC changed with tillage and cropping duration, and there were increases in SOC storage under DT and NT of 0.35 and 0.87 Mg C ha−1 per season, respectively (Figure 3B). Due to the differences in soil disturbance, DT significantly reduced soil bulk density by 3.9%, and NT increased the bulk density by 4.4%. No significant differences were detected for soil-available N (Figure 3A).
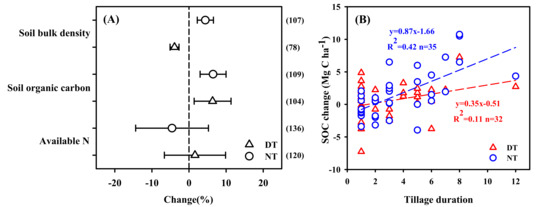
Figure 3.
(A) Changes in soil properties under different tillage systems. Error bars represent 95% CIs. Triangles and circles indicate the effect size of DT and NT, respectively. The number of observations in each category is shown in parentheses. Differences are considered significant when the CIs do not include zero. (B) Linear relationships between tillage duration and SOC changes (Mg C ha−1) under the DT and NT compared with RT management. Tillage duration was plotted against SOC changes for DT (triangles in red) and NT (circles in blue) in comparison with RT management. Red and blue dotted lines are the linear response for DT and NT, respectively. SOC, soil organic carbon; DT, deep tillage; NT, no tillage; RT, rotary tillage.
Both CH4 and N2O are important contributors to GHG emissions and varied according to the cropping systems used. For the upland crops, DT significantly increased N2O emissions by 15.1% relative to RT (n = 32; Figure 4). In paddy fields, DT increased N2O and CH4 emissions by 7.3% and 6.6%, respectively, but the effects were not significant. NT reduced N2O emission by 3.2% and 6.0% for upland crops and rice, respectively, and reduced CH4 emission by 7.4% in the paddy fields. CH4 tends to be absorbed in dry land; DT promoted CH4 absorption by 5.0%, and NT reduced CH4 absorption by 9.2% compared to RT (Figure 4).
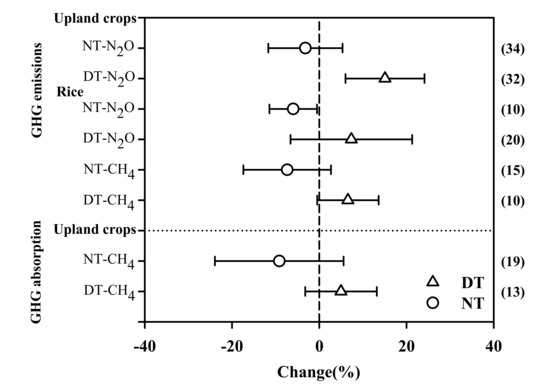
Figure 4.
Changes in GHG emissions and absorption for different cropping systems under DT and NT compared with RT management plans. Triangles and circles indicate DT and NT, respectively. The number of observations (n) for each category is shown in parentheses. Error bars represent 95% CIs. Differences are considered significant when the CIs do not include zero. GHG, greenhouse gas; DT, deep tillage; NT, no tillage; RT, rotary tillage.
Overall, DT exhibited field GHG emissions of 167 and 135 kg CO2-eq ha−1 season−1 in paddy fields and upland crops, respectively, caused by stimulation of N2O or CH4 emissions. NT practice performed better, reducing field GHG emissions by 213 and 99 kg CO2- eq ha−1 in paddy fields and upland crops, respectively (Table 2). Adopting DT management practices led to increased machinery fuel use which increased GHG emissions by 92 kg CO2-eq ha−1, whereas GHG emissions were reduced by 126 kg CO2-eq ha−1 with NT due to less machinery use relative to RT. Consequently, DT showed total GHG emissions of 259 and 227 kg CO2-eq ha−1 for paddy fields and upland crops, respectively. NT implemented in rice and upland cropping systems reduced the total GHG emissions by 338 and 225 kg CO2-eq ha−1, respectively, compared with RT (Table 2).
Table 2.
Comparison of GHG emissions for different cropping systems under DT and NT compared to RT management plans. Average seasonal emissions of N2O and CH4, and the GHG emissions caused by fuel consumption are expressed as CO2-equivalents. The radiative forcing potentials for N2O and CH4 are 298 and 25 times greater, respectively, than for CO2 in a 100-year time horizon. GHG, greenhouse gas; DT, deep tillage; NT, no tillage; RT, rotary tillage.
3.3. Economic Benefits of Tillage
We calculated the net benefits of the different tillage management systems based on the yield profit, tillage cost, and global warming cost. DT significantly enhanced yield profits, with increases of 1263, 1346, and 1036 CNY ha−1 for maize, wheat, and rice, respectively. The reductions in crop yield following NT resulted in profit penalties of 238, 710, and 1918 CNY ha−1 for maize, wheat, and rice, respectively. Compared with RT, DT increased labor and machinery costs by 188 CNY ha−1, while NT reduced labor and machinery costs by 407 CNY ha−1 (Table 3). Compared with RT, the estimated global warming cost increased by 38 and 44 CNY ha−1 under DT; however, these were reduced by 38 and 57 CNY ha−1 under NT for upland crops and rice, respectively (Table 3). The results show that DT yielded increased net profit for wheat compared to maize and rice (1120 vs. 1037 and 804 CNY ha−1, respectively). NT showed a total net profit of 207 CNY ha−1 for maize, but due to massive yield reductions, rice and wheat showed negative net profits of 1454 and 265 CNY ha−1, respectively (Table 3).
Table 3.
Comparison of economic benefits for different cropping systems under DT and NT compared to RT management plans. The relative yield and tillage costs correspond to the yield and tillage costs of DT and NT compared to RT. CNY, Chinese yuan; DT, deep tillage; NT, no tillage; RT, rotary tillage.
4. Discussion
4.1. Crop Production
Generally, DT increased crop yield and NT decreased crop yield (Figure 1), consistent with previous comprehensive analyses [5,8,51]. We determined that spike or cob number was the key factor affecting yield as a result of the different tillage practices, and this could be explained by the fact that soil compaction affected spike or cob number and the emergence rate [52]. In terms of agronomic traits, LAI differed significantly, and this was also reported previously, where higher root penetration was associated with increased uptake of soil water and nutrients under DT, resulting in the promotion of leaf growth and dry matter accumulation [15,53].
Our analysis indicated that the yield effect of DT was not sensitive to changes in precipitation, consistent with a previous comprehensive analysis of the Loess Plateau in China [54]. Although intensive soil disturbance may increase soil water evaporation, DT practice could improve the soil structure, porosity, and water-holding capacity, and these inconsistencies may have led to the yield being insensitive to increases in precipitation [16,54]. There was a marked positive yield effect at relatively low temperatures under DT. It is possible that DT loosens soil and warms the arable land, both of which are beneficial to crop yields, especially during low temperatures [21,27]. DT-induced crop yield tended to be higher with an optimal SOC content, as was reported previously [8], and this may be attributed to the increased SOC, which would reduce the effects of soil-water storage and nutrient release. The increased yield response for DT remained stable regardless of the tillage duration, indicating that DT has continuous effects on yield increase [55].
NT reduced crop production relative to RT, consistent with previous results [26,56]. Our study showed that the trend of low yields under NT could be mitigated by certain environmental and management variables. Yield decreased continuously with increasing precipitation, indicating that NT resulted in less yield reduction in arid areas and that excessive precipitation dramatically reduced yield production [54]. Another previous analysis reported that NT performed better under dry conditions, regardless of whether crops were rain fed or irrigated [6]. The yield reduction induced by NT was mitigated by moderate temperatures, suggesting that the implementation of NT in warm regions may increase yield. Continuous NT exhibited a more substantial yield effect, which was consistent with previous reports that a longer NT duration maintained increased yields [6,8]. We noticed a slight reduction in maize yield under NT management, but recent research conducted in the North China Plain showed that the NT effect on maize yield was not significant compared with RT [26].
4.2. Climate Change Mitigation
Higher N2O emissions were detected in upland crops following DT practice, consistent with previous findings [17,57,58]. Yan et al. (2016) reported that annual N2O emissions were significantly higher under DT management than under RT and NT, and there was no significant difference between RT and NT [17]. This may be explained by the fact that DT enhances soil microbial activity and accelerates denitrification, thus increasing N2O emissions [17,21]. NT reduced N2O and CH4 emissions in paddy fields compared with cultivated soil, as reported in previous studies [59,60,61]. The reduced CH4 emission in paddy fields following NT practice was attributed to the higher soil bulk density and lower dissolved organic carbon content than in cultivated soil [62]. A long-term research project showed that NT could somewhat reduce the emission flux of N2O compared to RT [59], but the response to the different tillage plans varied according to the environment and management practices [63,64].
Over a whole life-cycle assessment, DT exhibited a positive net total GHG emission in terms of field emissions and energy costs, while NT tended to reduce the total GHG emissions. DT practice simultaneously increased fuel consumption and field GHG emissions [10,57,58]. Rice production in conjunction with DT practices exhibited higher GHG emissions than upland crops, mainly due to the greatly increased CH4 emissions in paddy fields [34,65]. However, NT resulted in reduced GHG emissions in the soil. This was due to the reduced fuel consumption for NT, and Lu et al. (2017) considered that fuel-usage for tillage was the major producer of GHG emissions [10]. Reduced N2O or CH4 emissions were an important component of the total reduction in GHG emissions, and this was especially the case in paddy fields under NT management, where there was a substantial reduction in CH4 emissions compared with RT and DT [59,60,62].
Tillage management strongly alters the soil structure and SOC distribution and causes changes in the characteristics of the soil properties and soil carbon storage [11,12]. In our study, SOC sequestration increased significantly following the implementation of DT and NT. Additionally, as NT results in less disturbance of the soil structure and a reduction in the decomposition rate of SOC within the aggregates, it has great potential to sequester carbon in the soil and has been widely adopted in croplands for carbon sequestration [56,66]. DT exhibited higher SOC than RT, and this may be ascribed to the mixing and burial of residues at the bottom of the plow [16,56]. In addition, significant differences were recorded under the different tillage management plans for soil bulk density (Figure 3A). NT reduced soil disturbance, and thus the bulk density and penetration resistance were higher than under the other tillage practices [18,67,68]. Meanwhile, DT management by breaking the plow pans, decreased the soil bulk density and enhanced the availability of soil nutrients, all of which were beneficial to root growth and increased tiller numbers (Figure 3A) [14,26,69].
4.3. Economic Benefits
Trade-off relationships between yield profit and relative tillage costs were determined in a comparison of economic benefit, following the implementation of DT and NT. Although the costs increased for DT, they were completely offset by the significant promotion of yield profit for different crop categories [38]. By contrast, NT reduced the costs, which partly offset the reduction in yield profit [10,34]. It is worth noting that a positive net profit of 207 CNY ha−1 was determined for maize. This is possibly because NT had only a minor effect on yield, mainly because DT was often implemented in the preceding crop in the North China Plain. DT effectively loosened the soil, and in combination with other management strategies (e.g., SR), these were all beneficial to the yield production [26].
4.4. Limitations and Implications
Our analysis summarized and analyzed the benefits and trade-offs of tillage management plans based on currently available field data; however, there are some limitations. First, the available data on gas emissions (N2O and CH4) used in this study are substantially less than those for the crop yield (153 vs. 551 for gas emission and yield), and the database is still not sufficiently large to accurately evaluate gas emissions for DT and NT, especially for rice cropping systems (Figure 4). In the future, more controlled field experiments are needed that can fully examine tillage-induced GHG emissions in different agro-ecological regions to assess the effects of GHG emission more accurately. Second, parameters concerning the effects of management costs and global warming costs induced by the different tillage practices are limited and vary greatly, which may lead to bias in the economic and environmental evaluations. Therefore, future research should consider an expanded investigation of the economic and environmental parameters under diverse cropping conditions. Third, we only calculated GHG emissions and fuel consumption in the equation for the global warming costs and did not consider SOC sequestration since we did not have robust or accurate economic parameters for SOC change. Lastly, different crop rotation patterns or other factors may have potential impacts on the tillage management. For example, Cui et al. (2021) found that under the no tillage practice, the net photosynthetic rate of wheat-maize intercropping was more than 30% higher than that of wheat-maize rotation and rape-maize rotation, thereby affecting the crop yield [70]. Although these limitations may affect the ultimate results, the trends observed for the different tillage systems remain unchanged. We aimed to help those interested in improving the analysis parameters, and the overall results will be beneficial to our understanding of tillage systems in the context of crop production and climate change.
From a sustainability perspective, the choice of tillage management system depends on the agronomic, economic, and environmental benefits, which are largely affected by the tillage-induced crop yield, tillage costs, and GHG emissions. NT has been adopted and has spread throughout the agro-ecological area in China, and in 2014 accounted for 7.3 M ha [71]. Our results have shown that NT has great potential in terms of SOC sequestration and GHG mitigation. Although NT exhibited a significant total yield reduction, the yield penalty can be reduced or even reversed by favorable ambient conditions and agricultural strategies. Our study indicated that the ultimate goals of higher yields and reduced GHG emissions are achievable if guidance and innovative technologies can be adopted by agricultural producers. Through the continued use of NT, agricultural producers will focus increasingly on the economic effects, and reduced economic benefits may prevent farmers from implementing NT in practice. Consequently, subsidy policies are needed to effectively resolve the dilemma between the economic benefits and environmental costs by providing compensation.
This study showed the positive effects of DT practices on crop production, especially when optimal management practices are adopted collectively. However, DT increased GHG emissions, which would hamper the wide-spread use of this technique, especially in today’s climate of sustainable agricultural development. Whether this undesirable side-effect of DT practice can be attenuated remains to be fully investigated. In general, the trade-offs and benefits of the tillage management plans investigated in this study may underlie policy formulation, such as the National Planning of Conservation Tillage Project of China and could help policymakers to improve policies for sustainable crop production further while providing an insight into sustainable tillage strategies.
5. Conclusions
Sustainable intensification of agriculture requires a healthy, cultivated soil environment as a prerequisite. Tillage is a soil management strategy that profoundly affects the crop yield, SOC sequestration, and GHG emissions by changing soil properties. Our meta-analysis provides an insight into the trade-offs and benefits of tillage management plans and shows that tillage has a dual influence on crop productivity and climate change mitigation. In general, DT significantly increased crop yield by 7.5%, with higher economic benefits for different crops, but also exhibited higher total GHG emissions. Although NT significantly reduced crop yield by 3.7% and showed negative net economic benefits (except for maize), the total GHG emissions were relatively low. Our study showed that DT management plans should attenuate the environmental costs through abatement strategies to achieve both economic and environmental benefits. NT showed tremendous potential for SOC sequestration and GHG mitigation, and the yield penalty could be reduced by combining optimal management plans to achieve the goal of sustainable development. Clearly, in the future, more attention should be focused on strengthening field management plans to achieve the optimal strategy for tillage practice.
Supplementary Materials
The following are available online at https://www.mdpi.com/article/10.3390/agronomy11081495/s1. Database resource information: Detailed database resource from previous literature for this meta-analysis, which contained 144 published studies.
Author Contributions
Conceptualization, Z.C. and Y.W.; data curation, Y.W., H.W., H.Y. and Y.Y.; writing—original draft preparation, Y.W., H.W., H.Y. and Y.Y.; writing—review and editing, Z.C., Y.W. and H.W.; supervision, Z.C. All authors have read and agreed to the published version of the manuscript.
Funding
This research was funded by the Science and Technology Project of Yunnan Branch of China National Tobacco Corporation, Research and Demonstration of Non-point Source Pollution Prevention Technology in Tobacco-planting Area of Erhai Lake Basin (2020530000241005) and Science and Technology Plan Project of Qinghai Province (2019-NK-A11-02).
Conflicts of Interest
The authors declare no conflict of interest.
References
- Chen, X.; Cui, Z.; Fan, M.; Vitousek, P.; Zhao, M.; Ma, W.; Wang, Z.; Zhang, W.; Yan, X.; Yang, J.; et al. Producing more grain with lower environmental costs. Nature 2014, 514, 486–489. [Google Scholar] [CrossRef]
- Tilman, D.; Balzer, C.; Hill, J.; Befort, B.L. Global food demand and the sustainable intensification of agriculture [Sustainability Science]. Proc. Natl. Acad. Sci. USA 2011, 108, 20260–20264. [Google Scholar] [CrossRef]
- Cameron, K.C.; Di, H.J.; Moir, J.L. Nitrogen losses from the soil/plant system: A review. Ann. Appl. Biol. 2013, 162, 145–173. [Google Scholar] [CrossRef]
- Lal, R. Sequestering carbon and increasing productivity by conservation agriculture. J. Soil Water Conserv. 2015, 70, 55A–62A. [Google Scholar] [CrossRef]
- Pittelkow, C.M.; Liang, X.; Linquist, B.A.; Van Groenigen, K.J.; Lee, J.; Lundy, M.E.; Van Gestel, N.; Six, J.; Venterea, R.T.; Van Kessel, C. Productivity limits and potentials of the principles of conservation agriculture. Nature 2015, 517, 365–368. [Google Scholar] [CrossRef]
- Pittelkow, C.M.; Linquist, B.A.; Lundy, M.E.; Liang, X.; Van Groenigen, K.J.; Lee, J.; Van Gestel, N.; Six, J.; Venterea, R.T.; Van Kessel, C. When does no-till yield more? A global meta-analysis. Field Crop. Res. 2015, 183, 156–168. [Google Scholar] [CrossRef]
- Van den Putte, A.; Govers, G.; Diels, J.; Gillijns, K.; Demuzere, M. Assessing the effect of soil tillage on crop growth: A meta-regression analysis on European crop yields under conservation agriculture. Eur. J. Agron. 2010, 33, 231–241. [Google Scholar] [CrossRef]
- Zhao, X.; Liu, S.-L.; Pu, C.; Zhang, X.-Q.; Xue, J.-F.; Ren, Y.-X.; Zhao, X.-L.; Chen, F.; Lal, R.; Zhang, H.-L. Crop yields under no-till farming in China: A meta-analysis. Eur. J. Agron. 2017, 84, 67–75. [Google Scholar] [CrossRef]
- Lal, R. Soil carbon sequestration impacts on global climate change and food security. Science 2004, 304, 1623–1627. [Google Scholar] [CrossRef]
- Lu, X.; Lu, X. Tillage and crop residue effects on the energy consumption, input–output costs and greenhouse gas emissions of maize crops. Nutr. Cycl. Agroecosyst. 2017, 108, 323–337. [Google Scholar] [CrossRef]
- Ussiri, D.A.N.; Lal, R. Long-term tillage effects on soil carbon storage and carbon dioxide emissions in continuous corn cropping system from an alfisol in Ohio. Soil Tillage Res. 2009, 104, 39–47. [Google Scholar] [CrossRef]
- Zhang, M.-Y.; Wang, F.-J.; Chen, F.; Malemela, M.P.; Zhang, H.-L. Comparison of three tillage systems in the wheat-maize system on carbon sequestration in the North China Plain. J. Clean. Prod. 2013, 54, 101–107. [Google Scholar] [CrossRef]
- Zhang, H.; Yang, S.; Ma, W.; Wang, G.; Shi, G. Historical change in the theory and technique of cultivation in ancient China. Chin. J. Soil Sci. 2006, 37, 994–998. [Google Scholar]
- Cai, H.; Ma, W.; Zhang, X.; Ping, J.; Yan, X.; Liu, J.; Yuan, J.; Wang, L.; Ren, J. Effect of subsoil tillage depth on nutrient accumulation, root distribution, and grain yield in spring maize. Crop J. 2014, 2, 297–307. [Google Scholar] [CrossRef]
- Wasaya, A.; Tahir, M.; Ali, H.; Hussain, M.; Yasir, T.A.; Sher, A.; Ijaz, M.; Sattar, A. Influence of varying tillage systems and nitrogen application on crop allometry, chlorophyll contents, biomass production and net returns of maize (Zea mays L.). Soil Tillage Res. 2017, 170, 18–26. [Google Scholar] [CrossRef]
- He, J.; Shi, Y.; Yu, Z. Subsoiling improves soil physical and microbial properties, and increases yield of winter wheat in the Huang-Huai-Hai Plain of China. Soil Tillage Res. 2019, 187, 182–193. [Google Scholar] [CrossRef]
- Yan, C.; Zhang, Y.; Hu, C.; Dong, W.; Wang, Y.; Li, X.; Qin, S. Greenhouse gas exchange and comprehensive global warming potential under different wheat-maize rotation patterns. Chin. J. Eco-Agric. 2016, 24, 704–715. [Google Scholar] [CrossRef]
- Alvarez, R.; Steinbach, H.S. A review of the effects of tillage systems on some soil physical properties, water content, nitrate availability and crops yield in the Argentine Pampas. Soil Tillage Res. 2009, 104, 1–15. [Google Scholar] [CrossRef]
- Denardin, L.G.d.O.; Carmona, F.d.C.; Veloso, M.G.; Martins, A.P.; Freitas, T.F.S.d.; Carlos, F.S.; Marcolin, É.; Camargo, F.A.d.O.; Anghinoni, I. No-tillage increases irrigated rice yield through soil quality improvement along time. Soil Tillage Res. 2019, 186, 64–69. [Google Scholar] [CrossRef]
- Wang, G.L.; Ye, Y.L.; Chen, X.P.; Cui, Z.L. Determining the optimal nitrogen rate for summer maize in China by integrating agronomic, economic, and environmental aspects. Biogeosciences 2014, 11, 2639–2664. [Google Scholar] [CrossRef]
- Gong, H.; Li, J.; Ma, J.; Li, F.; Ouyang, Z.; Gu, C. Effects of tillage practices and microbial agent applications on dry matter accumulation, yield and the soil microbial index of winter wheat in North China. Soil Tillage Res. 2018, 184, 235–242. [Google Scholar] [CrossRef]
- Wang, L.F.; Shangguan, Z.P. Water-use efficiency of dryland wheat in response to mulching and tillage practices on the Loess Plateau. Sci. Rep. 2015, 5, 12225. [Google Scholar] [CrossRef] [PubMed]
- Huang, Y.; Ren, W.; Wang, L.; Hui, D.; Grove, J.H.; Yang, X.; Tao, B.; Goff, B. Greenhouse gas emissions and crop yield in no-tillage systems: A meta-analysis. Agric. Ecosyst. Environ. 2018, 268, 144–153. [Google Scholar] [CrossRef]
- Mei, K.; Wang, Z.; Huang, H.; Zhang, C.; Shang, X.; Dahlgren, R.A.; Zhang, M.; Xia, F. Stimulation of N2O emission by conservation tillage management in agricultural lands: A meta-analysis. Soil Tillage Res. 2018, 182, 86–93. [Google Scholar] [CrossRef]
- Zhao, X.; Liu, S.L.; Pu, C.; Zhang, X.Q.; Xue, J.F.; Zhang, R.; Wang, Y.Q.; Lal, R.; Zhang, H.L.; Chen, F. Methane and nitrous oxide emissions under no-till farming in China: A meta-analysis. Glob. Chang. Biol. 2016, 22, 1372–1384. [Google Scholar] [CrossRef]
- Ren, B.; Li, X.; Dong, S.; Liu, P.; Zhao, B.; Zhang, J. Soil physical properties and maize root growth under different tillage systems in the North China Plain. Crop J. 2018, 6, 669–676. [Google Scholar] [CrossRef]
- Zhou, J.; Shi, X.; Li, Y.; Zhang, X. Effects of different tillage practices on growing environment and yield of dryland maize. Agric. Res. Arid. Areas 2016, 34, 134–139. [Google Scholar] [CrossRef]
- Kohl, L.; Oehl, F.; Heijden, M.G.A. Agricultural practices indirectly influence plant productivity and ecosystem services through effects on soil biota. Ecol. Appl. 2014, 24, 1842–1853. [Google Scholar] [CrossRef] [PubMed]
- Rusinamhodzi, L.; Corbeels, M.; Van Wijk, M.T.; Rufino, M.C.; Nyamangara, J.; Giller, K.E. A meta-analysis of long-term effects of conservation agriculture on maize grain yield under rain-fed conditions. Agron. Sustain. Dev. 2011, 31, 657–673. [Google Scholar] [CrossRef]
- Kibet, L.C.; Blanco-Canqui, H.; Jasa, P. Long-term tillage impacts on soil organic matter components and related properties on a Typic Argiudoll. Soil Tillage Res. 2016, 155, 78–84. [Google Scholar] [CrossRef]
- Li, H.; Mollier, A.; Ziadi, N.; Shi, Y.; Parent, L.; Morel, C. Soybean root traits after 24 years of different soil tillage and mineral phosphorus fertilization management. Soil Tillage Res. 2017, 165, 258–267. [Google Scholar] [CrossRef]
- Drury, C.F.; Reynolds, W.D.; Yang, X.M.; McLaughlin, N.B.; Welacky, T.W.; Calder, W.; Grant, C.A. Nitrogen Source, Application Time, and Tillage Effects on Soil Nitrous Oxide Emissions and Corn Grain Yields. Soil Sci. Soc. Am. J. 2012, 76, 1268–1279. [Google Scholar] [CrossRef]
- Gregorich, E.G.; Rochette, P.; St-Georges, P.; Mckim, U.F.; Chan, C. Tillage effects on N 2 O emission from soils under corn and soybeans in Eastern Canada. Can. J. Soil Sci. 2008, 88, 153–161. [Google Scholar] [CrossRef]
- Zhang, Z.S.; Guo, L.J.; Liu, T.Q.; Li, C.F.; Cao, C.G. Effects of tillage practices and straw returning methods on greenhouse gas emissions and net ecosystem economic budget in rice–wheat cropping systems in central China. Atmos. Environ. 2015, 122, 636–644. [Google Scholar] [CrossRef]
- Hao, Y.; Ye, Y.; Cui, Z.; Chen, X. Managing nitrogen for sustainable wheat production. J. Clean. Prod. 2017, 162, 1308–1316. [Google Scholar]
- Food and Agriculture Organization of the United Nations (FAOSTAT) Datebase. Available online: http://www.fao.org/faostat/zh/#data (accessed on 15 January 2021).
- Intergovernmental Panel on Climate Change (IPCC). Climate Change 2007: The Physical Science Basis; Cambridge University Press: Cambridge, UK, 2007. [Google Scholar]
- Xie, J.; Lingling, L.I.; Zhang, R.; Chai, Q.; Luo, Z.; Cai, L. Effect of Tillage System on Rain-fed Maize Yield and Soil Physical Characteristics for One Film Used Two Years. J. Soil Water Conserv. 2016, 30, 184–189. [Google Scholar] [CrossRef]
- Hu, H.Y.; Li, Z.J.; Ning, T.Y. Effects of subsoiling and urea types on water use efficiency of different maize cultivars. Scientia Agricultura Sinica 2011, 44, 1963–1972. [Google Scholar] [CrossRef]
- Zhang, S.; Ma, J.; Cui, A.; Hao, X.; Guo, C. Effect of Different Tillage Techniques on Yield and Water Utilization in Winter Wheat. Chinese Agricultural Science Bulletin 2006, 22, 110–113. [Google Scholar] [CrossRef]
- Hong-Jie, L.I.; Ning, T.Y.; Shao, G.Q.; Wang, Y.; Tian, S.Z.; Zeng-Jia, L.I.; Xue-Yong, Q.U. Effects of Different Tillage and Nitrogen Rates on Yield of Wheat and Maize Cropping System. Shandong Agric. Sci. 2009, 3, 8–11. [Google Scholar] [CrossRef]
- Li, H.; Lu, W.; Liu, Y.; Zhang, X. Effect of different tillage methods on rice growth and soil ecology. Chin. J. Appl. Ecol. 2001, 12, 553–556. [Google Scholar]
- Fan, J.W. Effect of Management Practices on N2O Emissions and Soil Organic Carbon from the Typical Winter Wheat-Summer Maize Cropland in North China Plain. Master’s Dissertation, Chinese Academy of Agricultural Sciences, Beijing, China, 2016. [Google Scholar]
- Han, B. Studies on the Effects of Conservation Tillage Systems on Soil Health and the Responses of Crops. Ph.D. Dissertation, Shandong Agricultural University Taian, Shandong, China, 2007. [Google Scholar]
- Ying-Ying, X.U.; Wang, J.H.; Liu, Y.T.; Gao, P.; Wang, Y.X.; Yang, H.Y.; Kan-Chao, Y.U.; Xuan-Liang, G.E.; Chi, L.; Fan, J.S. Effects of Different Returning Methods of Straw on Soil Physical Property, Yield of Corn. J. Maize Sci. 2018, 26, 78–84. [Google Scholar] [CrossRef]
- Sun, L. Effects of Long-Term Conservation Tillage on Soil Melioration, Carbon Storage and Greenhouse Gas Mitigation of Wheat Field on Weibei Arid Plateau. Ph.D. Dissertation, Northwest A&F University, Yangling, China, 2018. [Google Scholar]
- Zhang, X.Q. Effects of Tillage Practices on Soil Carbon Sequestration and Crop Growth under a Wheat-Maize Cropping System in the North China Plain. Ph.D. Dissertation, China Agricultural University, Beijing, China, 2017. [Google Scholar]
- Tian, S.Z. Responses of Soil Organic Carbon Pool, Greenhouse Gas Emission and Carbon Footprint to a Long-Term Tillage and Residue Management System. Ph.D. Dissertation, Shandong Agricultural University, Taian, Shandong, China, 2014. [Google Scholar]
- Wang, B.W. The Rules and Regulations of Farmland Carbon Cycle under Conservational Tillage. Ph.D. Dissertation, Shandong Agricultural University: Taian, China, 2013. [Google Scholar]
- Zhu, J. Studies on CO2 Emission and Carbon Footprint of Farmland in Song-Nen Plain. Master’s Dissertation, Northeast Agricultural University, Harbin, China, 2015. [Google Scholar]
- Schneider, F.; Don, A.; Hennings, I.; Schmittmann, O.; Seidel, S.J. The effect of deep tillage on crop yield—What do we really know? Soil Tillage Res. 2017, 174, 193–204. [Google Scholar] [CrossRef]
- Li, B.; Fan, C.H.; Zhang, H.; Chen, Z.Z.; Sun, L.Y.; Xiong, Z.Q. Combined effects of nitrogen fertilization and biochar on the net global warming potential, greenhouse gas intensity and net ecosystem economic budget in intensive vegetable agriculture in southeastern China. Atmos. Environ. 2015, 100, 10–19. [Google Scholar] [CrossRef]
- Anjum, S.A.; Ashraf, E.U.; Tanveer, M.; Qamar, R.; Khan, I. Morphological and Phenological Attributes of Maize Affected by Different Tillage Practices and Varied Sowing Methods. Am. J. Plant Sci. 2014, 05, 1657–1664. [Google Scholar] [CrossRef][Green Version]
- Wei, H.; Wang, S.; Yang, W.; Sun, H.; Yin, L.; Deng, X. Meta Analysis on Impact of No-Tillage and Subsoiling Tillage on Spring Maize and Winter Wheat Yield and Water Use Efficiency on the Loess Plateau. Sci. Agric. Sin. 2017, 50, 461–473. [Google Scholar] [CrossRef]
- Ma, S.; Yu, Z.; Shi, Y.; Gao, Z.; Luo, L.; Chu, P.; Guo, Z. Soil water use, grain yield and water use efficiency of winter wheat in a long-term study of tillage practices and supplemental irrigation on the North China Plain. Agric. Water Manag. 2015, 150, 9–17. [Google Scholar] [CrossRef]
- Asenso, E.; Hu, L.; Issaka, F.; Tian, K.; Zhang, L.; Zhang, L.; Zeng, J.; Zhu, Y.F.; Li, J. Four tillage method assessments on soil organic carbon, total nitrogen, biological activities, and maize grain yield in Southern China. Food Energy Secur. 2019, 8, e176. [Google Scholar] [CrossRef]
- Hu, N.; Wang, B.; Gu, Z.; Tao, B.; Zhang, Z.; Hu, S.; Zhu, L.; Meng, Y. Effects of different straw returning modes on greenhouse gas emissions and crop yields in a rice–wheat rotation system. Agric. Ecosyst. Environ. 2016, 223, 115–122. [Google Scholar] [CrossRef]
- Zhang, J.; Hang, X.; Lamine, S.M.; Jiang, Y.; Afreh, D.; Qian, H.; Feng, X.; Zheng, C.; Deng, A.; Song, Z.; et al. Interactive effects of straw incorporation and tillage on crop yield and greenhouse gas emissions in double rice cropping system. Agric. Ecosyst. Environ. 2017, 250, 37–43. [Google Scholar] [CrossRef]
- Cui, S.Y.; Xue, J.F.; Chen, F.; Tang, W.G.; Zhang, H.L.; Lal, R. Tillage Effects on Nitrogen Leaching and Nitrous Oxide Emission from Double-Cropped Paddy Fields. Agron. J. 2014, 106, 15–23. [Google Scholar] [CrossRef]
- Feng, J.; Chen, C.; Zhang, Y.; Song, Z.; Deng, A.; Zheng, C.; Zhang, W. Impacts of cropping practices on yield-scaled greenhouse gas emissions from rice fields in China: A meta-analysis. Agric. Ecosyst. Environ. 2013, 164, 220–228. [Google Scholar] [CrossRef]
- Li, C.; Zhang, Z.; Guo, L.; Cai, M.; Cao, C. Emissions of CH4 and CO2 from double rice cropping systems under varying tillage and seeding methods. Atmos. Environ. 2013, 80, 438–444. [Google Scholar] [CrossRef]
- Li, D.; Liu, M.; Cheng, Y.; Wang, D.; Qin, J.; Jiao, J.; Li, H.; Hu, F. Methane emissions from double-rice cropping system under conventional and no tillage in southeast China. Soil Tillage Res. 2011, 113, 77–81. [Google Scholar] [CrossRef]
- Gregorich, E.G.; Rochette, P.; Hopkins, D.W.; Mckim, U.F.; St-Georges, P. Tillage-induced environmental conditions in soil and substrate limitation determine biogenic gas production. Soil Biol. Biochem. 2006, 38, 2614–2628. [Google Scholar] [CrossRef]
- Harada, H.; Kobayashi, H.; Shindo, H. Reduction in greenhouse gas emissions by no-tilling rice cultivation in Hachirogata polder, northern Japan: Life-cycle inventory analysis. Soil Sci. Plant Nutr. 2010, 53, 668–677. [Google Scholar] [CrossRef]
- Yao, Z.; Zheng, X.; Wang, R.; Xie, B.; Butterbach-Bahl, K.; Zhu, J. Nitrous oxide and methane fluxes from a rice–wheat crop rotation under wheat residue incorporation and no-tillage practices. Atmos. Environ. 2013, 79, 641–649. [Google Scholar] [CrossRef]
- Ogle, S.M.; Swan, A.; Paustian, K. No-till management impacts on crop productivity, carbon input and soil carbon sequestration. Agric. Ecosyst. Environ. 2012, 149, 37–49. [Google Scholar] [CrossRef]
- Nawaz, A.; Farooq, M.; Ahmad, R.; Basra, S.M.A.; Lal, R. Seed priming improves stand establishment and productivity of no till wheat grown after direct seeded aerobic and transplanted flooded rice. Eur. J. Agron. 2016, 76, 130–137. [Google Scholar] [CrossRef]
- Zhang, H.L.; Lal, R.; Zhao, X.; Xue, J.F.; Chen, F. Opportunities and Challenges of Soil Carbon Sequestration by Conservation Agriculture in China. Adv. Agron. 2014, 124, 1–36. [Google Scholar]
- Scanlan, C.A.; Davies, S.L. Soil mixing and redistribution by strategic deep tillage in a sandy soil. Soil Tillage Res. 2019, 185, 139–145. [Google Scholar] [CrossRef]
- Cui, W.Q.; Yang, C.H.; Tian, K. Effects of Different Tillage Patterns on Photosynthetic Characteristics and Yield of Wheat and Maize in Oasis Irrigation Area. Mol. Plant Breed. 2021, 31, 20–26. [Google Scholar]
- Liu, W.; Li, W.; Kan, Z.; Zhao, H. The Current Research Status of Conservation Tillage Technology. J. Agric. Mech. Res. 2017, 7, 256–261. [Google Scholar]
Publisher’s Note: MDPI stays neutral with regard to jurisdictional claims in published maps and institutional affiliations. |
© 2021 by the authors. Licensee MDPI, Basel, Switzerland. This article is an open access article distributed under the terms and conditions of the Creative Commons Attribution (CC BY) license (https://creativecommons.org/licenses/by/4.0/).