Article

Deep Learning-Based Growth Prediction System: A Use Case of China Agriculture

by
Tamoor Khan
1,
Hafiz Husnain Raza Sherazi
2,*,
Mubashir Ali
3,
Sukumar Letchmunan
4,* and
Umair Muneer Butt
4,*
1
School of Economic Information Engineering, Southwestern University of Finance and Economics, Chengdu 610000, China
2
School of Computing and Engineering, University of West London, London W5 5RF, UK
3
Department of Management, Information and Production Engineering, University of Bergamo, 24044 Bergamo, Italy
4
School of Computer Sciences, Universiti Sains Malaysia, Gelugor 11800, Malaysia
*
Authors to whom correspondence should be addressed.
Agronomy 2021, 11(8), 1551; https://doi.org/10.3390/agronomy11081551
Submission received: 18 May 2021 / Revised: 26 July 2021 / Accepted: 29 July 2021 / Published: 3 August 2021
(This article belongs to the Special Issue Applications of Deep Learning in Smart Agriculture)

Abstract

:
Agricultural advancements have significantly impacted people’s lives and their surroundings in recent years. The insufficient knowledge of the whole agricultural production system and conventional ways of irrigation have limited agricultural yields in the past. The remote sensing innovations recently implemented in agriculture have dramatically revolutionized production efficiency by offering unparalleled opportunities for convenient, versatile, and quick collection of land images to collect critical details on the crop’s conditions. These innovations have enabled automated data collection, simulation, and interpretation based on crop analytics facilitated by deep learning techniques. This paper aims to reveal the transformative patterns of old Chinese agrarian development and fruit production by focusing on the major crop production (from 1980 to 2050) taking into account various forms of data from fruit production (e.g., apples, bananas, citrus fruits, pears, and grapes). In this study, we used production data for different fruits grown in China to predict the future production of these fruits. The study employs deep neural networks to project future fruit production based on the statistics issued by China’s National Bureau of Statistics on the total fruit growth output for this period. The proposed method exhibits encouraging results with an accuracy of 95.56% calculating by accuracy formula based on fruit production variation. Authors further provide recommendations on the AGR-DL (agricultural deep learning) method being helpful for developing countries. The results suggest that the agricultural development in China is acceptable but demands more improvement and government needs to prioritize expanding the fruit production by establishing new strategies for cultivators to boost their performance.

1. Introduction

In developing countries, farming plays a pivotal role in the economy and offers their rural inhabitants a variety of nutrients, revenue, and numerous job opportunities. Farming has been engaged in the processing of essential food crops for decades. At present, forestry, dairy products, and fruit growth are protected through agricultural farming. Agricultural activities are often the backbone of a majority of countries that offer tremendous employment opportunities to the population other than food supply and goods manufacturing. Fruit plantation is one of the significant and rewarding horticultural divisions. The production and protection of fruit per capita have recently been considered a significant parameters in a country’s growth and quality of live. There are plenty of economic benefits for fruit production including revenue generation, soil degradation control, air quality, and growth in the job market.
Specifically, the statistics from China agriculture industry reveal that it produces jobs for more than 300 millions farmers. With reference to the agriculture industry, several studies have been reported in the literature employing machine learning applications for predictive analysis. In the last few years, the use of artificial neural network (ANN) for forecasting analysis has caught significant attention from the research community. Machine learning techniques have been explored in a wide range of agricultural applications, i.e., plat characteristic estimation [1], agrarian production [2], fruites analysis [3], flowers bloom strength analysis [4], and animal body part analysis [5], to name a few.
In an interesting study [6], the authors discuss the influence of climate change on crop adaption for cultivation in China. The study outlines the suitability of farmers according to climate changes for the cultivation of vegetables, and some farmers have chosen to cultivate wheat and maize in response to climate changes. Z. Huang et al. discuss progress about developments in agriculture, rural areas and farmers in China which is beneficial for economic and agricultural growth [7]. S. Zarifneshat et al. proposed an approach to predict the apple scar quantity by using the applications of artificial neural network [8]. R. Zhao et al. analyze, classify, and outline the fundamental concepts, benefits, and drawbacks of the modern paddy rice mapping approach with machine learning techniques [9]. YS. Murat et al. utilized ANN for transport energy demand prediction through economic and transportation indicators [10]. The agronomic responses of fruit crop to fertilizer may be low over the time with increasing application of potassium, nitrogen, and phosphorus fertilizer, particularly in Chinese fruit crops. Therefore, it will be beneficial for the nutrient advisory and fertilizer control of fruit crops to quantify those responses [11].
The applications of ANNs have been studied in several fascinating domains such as powder metallurgy material analysis [12,13]. To predict milk output on dairy farms, a feedforward artificial neural network with a postprocessing polynomial is presented in [14]. M. Korosec et al. present a neuro-fuzzy model by using the principle of “product manufacturability” to define and accept the degree of “pretentiousness-machining difficulty” [15,16,17]. It is always complicated to predict global rice trade because buyers and sellers are influenced by several unpredictable factors that interact in a complex way. H. C. Co et al. compare the reliability of artificial neural networks with ARIMA models and an exponential smoothing is predicted on rice exports of Thailand [18].
As far as Chinese fruit production is concerned, very few studies have been reported in the literature [19,20]. Friis, C et al. [21] proposed banana plantation investments in (Luang Namtha Province, Laos). F. Viani et al. implanted an autonomous wireless decision support system for water agriculture in the network gateway [22]. Determining the MC (moisture content) and humidity of agricultural products by capacitive sensor is defined in the fringing area [23]. H. Ochiai et al. collected the agriculture application data by DTN-based collection of sensors [24]. C. Kone et al. used the Wireless Sensor Network for agricultural production [25]. The effectiveness of planetary remote sensing systems is demonstrated by the growing need for anti-hail plastic net cover in agricultural orchards [26]. Three deep learning models are used to evaluate farmland quality results by simulating their accuracy and analyzing distribution patterns applied by Xiangzhou et al. [27]. In another similar study, ML algorithms are utilized to estimate potato tuber yield from distal sensing data of pasture properties [28]. In order to collect agriculture-related data, many devices have been developed and different prediction analysis are performed on the collected data [29].
In this study, we utilized different machine learning and deep learning techniques for fruit growth prediction for China. The primary objective of this work is to predict fruit growth from fruit data by using the applications of ML and deep learning for the relative variation in fruit production. We employed Spatial Prediction (SP), Support Vector Machine (SVM), Logistic regression (LR), AdaBoost, Multilayer Perceptron (MLP) Neural Network, and Agricultural Deep-Learning (AGR-DL) for predictive analysis. In the experimental evaluation, AGR-DL outperformed the classical machine learning techniques. Based on data from the time series, the proposed models obtained an average accuracy of 95.56% which clearly argues about the usefulness of the proposed approach compared to the counterparts.
The rest of this article is organized as follows. Section 2 covers materials and methods encompasses a system model by describing different AI techniques and the proposed model (i.e., AGR-DL). The experimental results are presented in Section 3. Section 4 presents discussions and recommendations, while the concluding remarks are provided in Section 5.

2. Materials and Methods

The estimation of agricultural production is one of the greatest concerns for governments and local administrations. A clear roadmap is inevitable by the governmental food authorities to provide farmers with realistic expectations of food growth and to strategize on improving their annual yields. There are various learning approaches for the forecasting financial prices including the ANN, genetic algorithm, and support vector machines. However, ANN is a standard technique, widely accepted to be deployed in this domain. Therefore, the strategies for optimizing the efficiency of ANN are investigated in order to understand the patterns using ANN in fruit processing. In this study, we have used publically available dataset that is taken from the Food and Agriculture Organization (FAO) of the United Nations data repository (http://www.fao.org/faostat/en/#data/QCs accessed on 15 June 2021). The performance of the used predictive models is evaluated by using the production output of the following fruits as features: graper, apples, bananas, pears, and citrus, along with the respective year of production. These are the only quantative variables available in the dataset that could be considered for predictive analysis, and most of the other attributes are descriptive only and have no influence on the prediction results.
Deep learning is a papular paradigm for a plenty of use cases and has been broadly studied for its role in the growth prediction. However, the inputs considered are mostly derived from the data available within the annual fruit growth data itself. Such separation might ignore factors that impact production. A consideration of publicly available data for fruit prediction can improve the prediction accuracy and future fruit production. Some studies dicussed about the fruits productoin of different countries and clarified on how the circumstances of this transition by villagers could be interpreted and evaluated [30].

2.1. Spatial Prediction

Production of agricultural fruits is one of the most critical sectors in Chinese agriculture. Inadequate monitoring of fruit production makes it difficult to explain the spatial distribution of fruit production in a region and to identify critical priority areas with declining fruit production rates. Regional authorities have shown special concern for stream segment quantities and spatial distribution whose fruit production falls below the standard being virtually inappropriate to be used. The fruit production model based on spatial regression was chosen to further predict true negative (TN) concentrations for all stream segments throughout fruit production because of classification performance improvement. To predict TN concentrations throughout fruit production, a total of 38 separate annual sites were generated along the main stem and fruit production lines. In these generated sites, TN concentrations were predicted by using a spatial regression model based on fruit development. The concentration of TN at each generating site was then estimated based on residues at 8 adjacent monitoring sites using Equations (1) and (2).
In the unmonitored fruit production, the estimated spatial regression model may help to predict TN rates. In some unmonitored fruit production, TN concentration can be estimated (denoting position 0), as follows [31]:
z ^ 1 = X 1 β ^ + ε ^ 1
where z ^ 1 is the position 1 TN concentration, X1 is the position 1 vector plus (p − 1) essential descriptive variables values, β ^ is the vector of p calculated coefficients of spatial regression, and ε ^ 1 is the residual regression at position 1 which was determined by ordinary kriging based on the residual regression at nearby monitoring sites:
ε ^ 1 = j = 1 n λ j ε ^ j
where n is the number of monitoring fruit production kriging, ε ^ j is the regression residual at monitoring fruit production j, and λj is the ordinary kriging weight of monitoring site j. The exponential autocorrelation function estimated during spatial regression (in Equation (1)) was used to derive the ordinary kriging weights.
where n is the amount of fruit production monitoring by kriging; ε ^ j is the residual regression in monitoring fruit production j, and λj is the normal kriging weight of monitoring site j. During spatial regression, to obtain the ordinary kriging weights, the exponential autocorrelation function is calculated by using Equation (1).

2.2. Logistic Regression Model

Logistic regression is often employed when the predictor variables are not normally distributed, and some of them may be categorical. The spatial prediction is based on dependent and independent variables that are available across the region in a spatially predictable way or linear direction. The fundamental hypothesis is that a specific dependent variable is classified as a binary variable by logistic regression (i.e., presence, absence, etc.).
Therefore, the logistic regression predicts the probability of presence and absence variables and gives the predictor variable as observed value. The regression of the logistic system is a special s-shaped curve that is produced by taking a linear regression that can generate any y value between −∞ and +∞. We transform it with the function that produces a p probability between (0, 1) and y approaches minus and plus infinity (see Equation (3)) [32].
ρ ( y = 1 | x ) = exp ( β 0 + β 1 x ) 1 + exp ( β 0 + β 1 x )
In above equation x is the data vector. The independent variable coefficients are β and value of the conditional output variable is y. For calculation of β before prediction, the maximum probability formula could be employed. Statistically dependent model equation is used for results validation. The accurate analytical models are based on the survey technique and chosen descriptive variables. They may relate to simple methods which work on selective measuring scales.

2.3. SVM Regression

The origins of SVM can be traced back to Vapnik and Lener’s discriminant work. The nonlinear general version of SVM is quite recent [33]. In 1998, Vapnik extended the theory of nonlinear regression by using the SVM framework [34]. The SVM regression is based on the substitution of the kernel, where X [m × p] is replaced by [m × m] kernel matrix L and β ^ [p × 1] is replaced by b ^ [ m × 1 ] . The Gaussian radial base function (RBF) kernel was chosen to model non-linear processes. L is defined as
L = ( L 1 , 1 . . . L 1 , m . . . . . . . . . L m , 1 . . . L m , m )
where the RBF function defines L i , j :
L i , j = e x i T x j T 2 e 2
Equation (5) shows more samples to produce RBF output close to 1, while fewer samples of the same type give output close to 0. As a result, L may be seen as a type of sample–sample matrix for correlation, which is theoretically a nonlinear measure of similitudes between two samples. The kernel width parameter μ is associated with data trust; adapting μ also has effects on the nonlinear regression. As the kernel increases, (wider) the model becomes simpler. The calculation of the regression vector b ^ , a [m × 1] vector follows a different objective than the classical PLSR or MLR models.
Rather than aiming to reduce just the preview error, the SVM objective function is enhanced by the root mean square (rms) size, which represents model complexity. Optimization of SVM method is very difficult. Below is the classic equation with PLSR and MLR:
min ( e ) = min ( j = 1 m ( x x ^ ) 2 )
It is replaced by a so-called primal-dual form:
min ( e ) = min ( j = 1 m ξ j 2 + Γ ( a ^ T a ^ ) 2 )
The ξ j e-insensitive error of generalization is defined as where Γ is a regularization boundary and for final result extending Γ places have a greater emphasis on decreasing the RMS extent of the model coefficients. It replaces the old style least-square rule b ^ ( x x ^ j ) 2 and is characterized by utilizing the significance threshold ε :
ξ j = { 0 , i f | x j x ^ j | < ε | x j x ^ j | < ε , o t h e r w i s e
Therefore, a single residual magnitude error is less than ǫ and is set to zero. It assumes that any error that is less than a good thing is unsafe (unimportant), and that if it fits below, a solution is likely to be over-fitting. The described goal function alters the model training approach. A b ^ j coefficient equal to zero is given to all calibration samples that have a residue error less than ǫ, which means this sample is redundant and easier to anticipate by the other samples.
Samples of non-zero b-coefficients are called vectors of support. This method is conceptually identical to the threshold of PLSR model coefficients for the automated selection of variables. Based on the model of inequality constraints, do not explicitly address the b ^ solution employing a linear system. In this case, the model is optimized by quadratic programming in the field of Lagrangian multipliers. The optimization-based process is slower than least square methods, but it is still a convex process and a global minimum.

2.4. AdaBoost

Briefly, we study the multi-classification problem and the AdaBoost algorithm before testing the current AGR-DL algorithm. From the set of ( y 1 ,   d 1 ) , , ( y m ,   dm ) training data input y j R p (prediction variable) assumed and the output (response variable) dj are qualitative and finite set { 1 ,   2 , , L } [35]. K is the class number. The aim is to evaluate the D(y) for a new input y from the training classification rule. Data from unknown probability samples P r o b ( Y ,   D ) are generally assumed to be training data, distributed independently, and identically. The misclassification error rate of a classifier D(y) is given with the 0/1 loss.
1 l = 1 L E y [ I d ( y ) = l P r o b ( D = l | Y ) ]
It is clear that
D * ( y ) = arg max l P r o b ( D = l | Y = y )
Minimize this quantity with a misclassification error rate equal to the Equation (11).
1 E y m a x l P r o b ( D = l | Y )
The classifier and error rate are regarded as classifiers for Bayes and error rate for Bayes. The AdaBoost method is an iterative method which attempts to bring Bayes D*(y) by incorporating several weak classifications. The AdaBoost develops a classification tree that generates class labels begins with the unweighted training sample [35]. If a training data locality is not classified, it raises (aids) the weight of the training data point.
The second classifier is trained using new weights that are no longer equal. Second time, misclassified training set have increased their weights and the process is repeated. Generally, 500 or 1000 classifiers can be built in this way. Almost every classifier has the score, and the ultimate classifier has been allotted to the known as the linear combination of the classifiers at each stage.

2.5. Multilayer Perceptron Neural Network

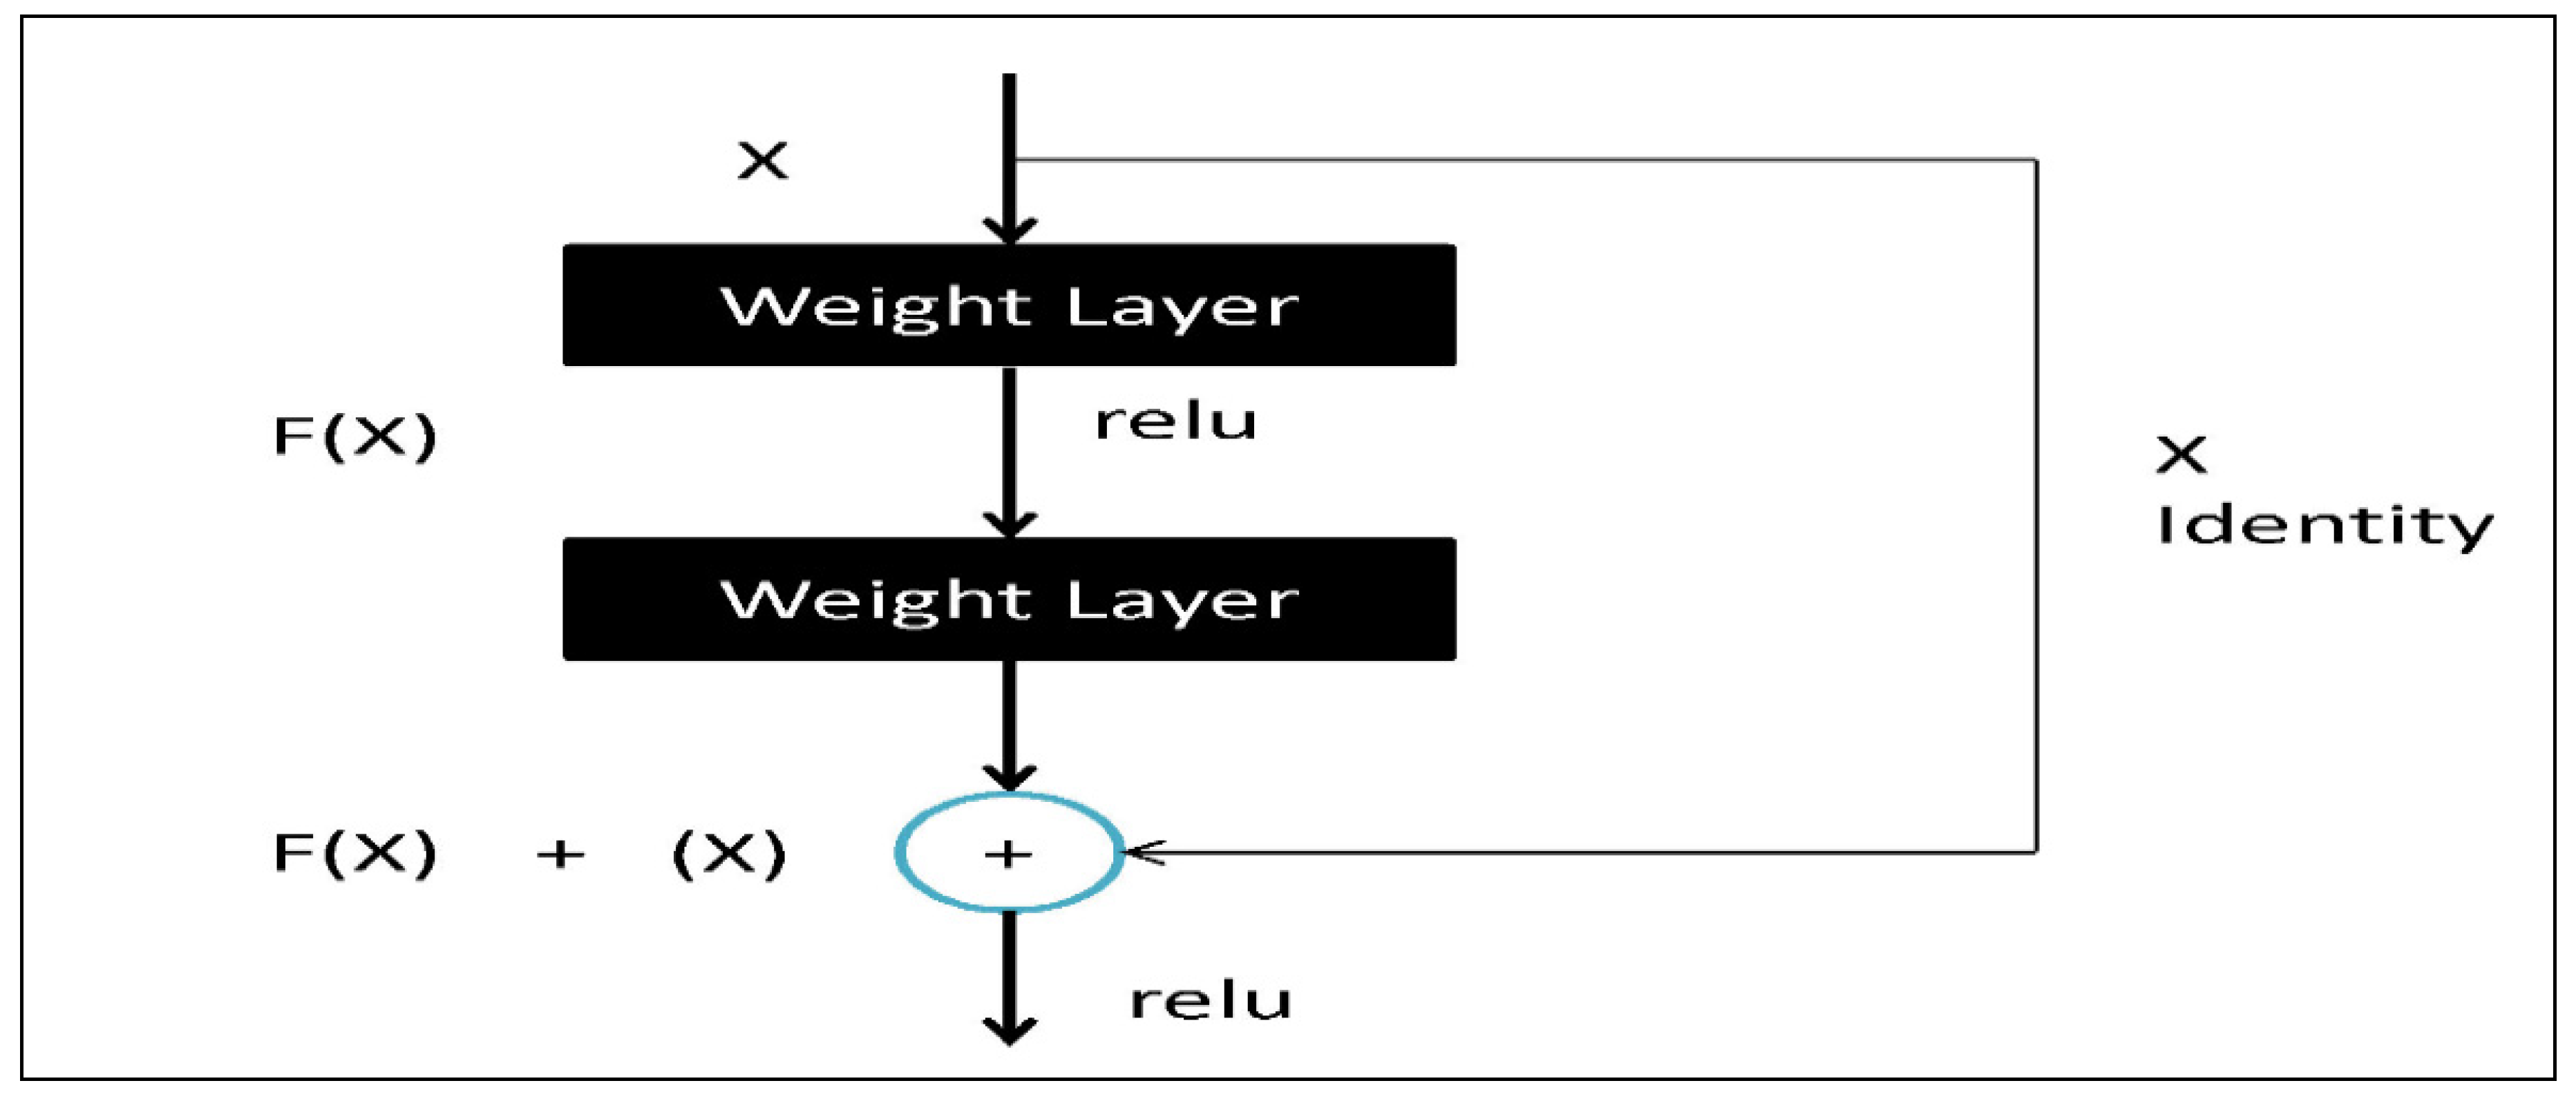
Figure 1 illustrates an MLP network with such a hidden layer. The network is effective for vector mapping, i.e., by incorporating an input vector, Xr the network reacts via the vector Zr in its output ( f o r   r   = 1 , , R ) . In this work, there are two variants of the MLP training algorithm, i.e., Basic Backpropagation (BB) and Backpropagation with Declining Learning rate Factor (BDLRF) were employed [36]. The source code for the implementation of such ANN models has also been implemented in Python software (see Figure 1). H ((y) + y) can be formulated using “shortcut relations” in neural networks as demonstrated in Figure 2.

2.6. Agricultural Deep Learning (AGR-DL)

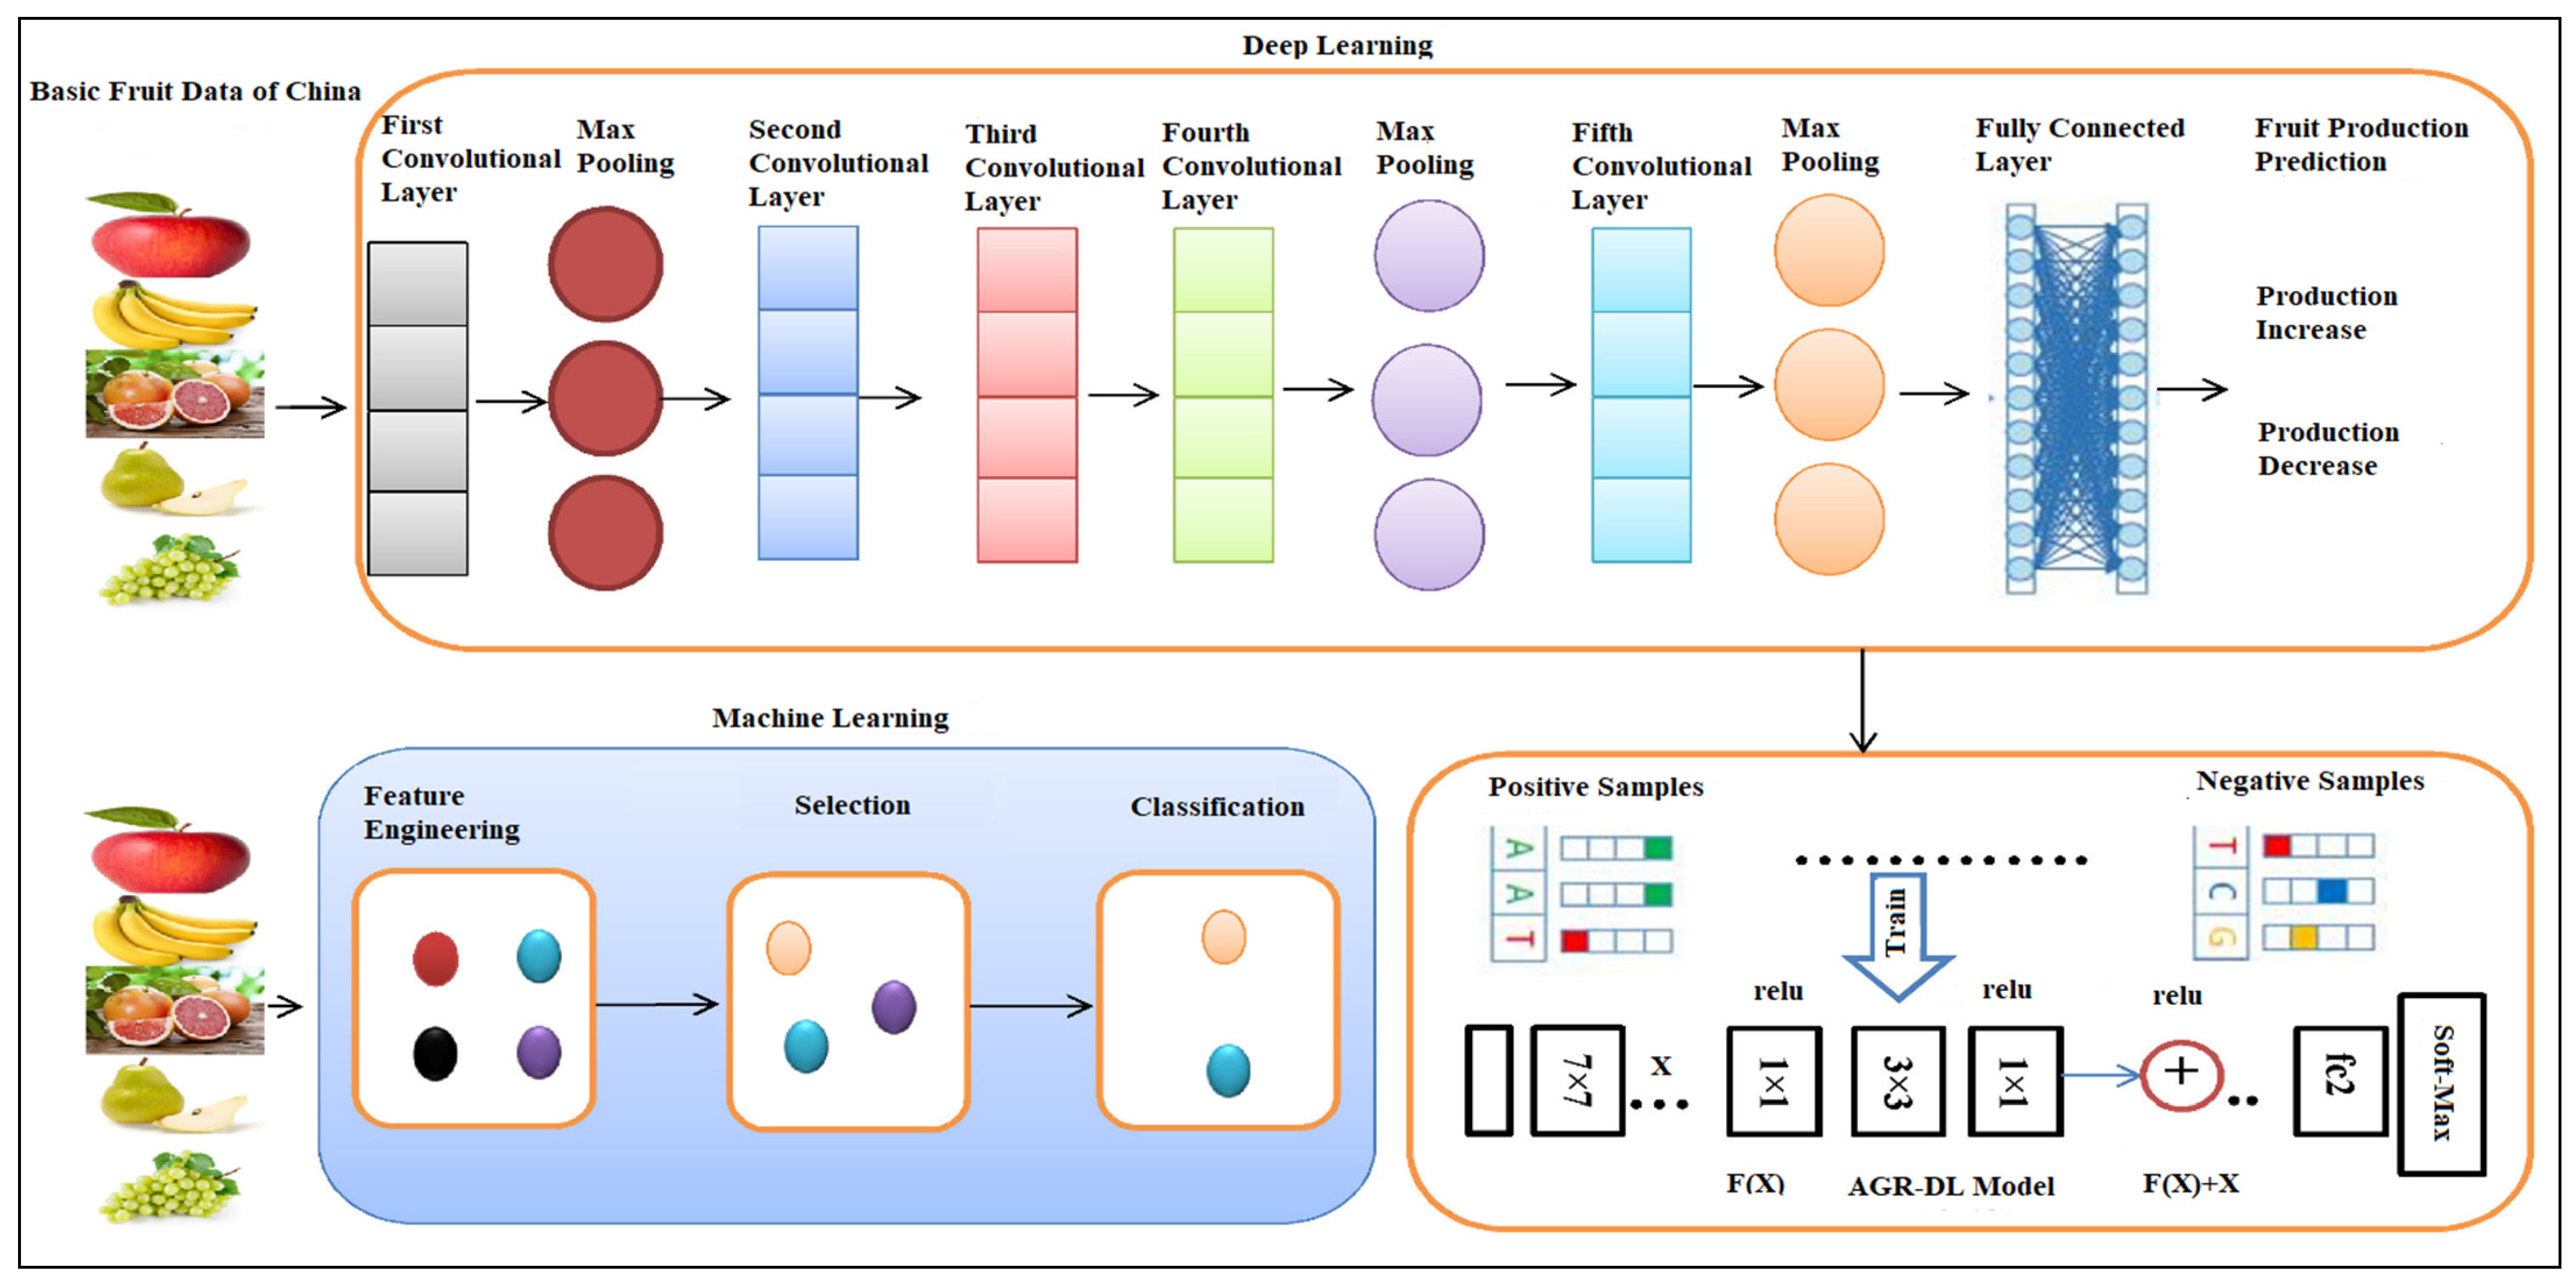
Modern deep learning approaches can resolve agricultural problems more productively than conventional machine learning techniques. A deep convolutionary network is a group of neural multilayer networks that can model nonlinear relationships and is organized into a sequence of functional layer by layer structure [37].
Deep learning architectures contain different variants, two of them are convolutional neural networks (CNNs) and recurring neural networks (RNNs). The CNN are widely used for the domain of computer vision and RNN are used specifically for the processing of natural language. The latest CNN-based work cannot extract features directly from the DNA sequences. The links between the units in the RNN can be directed in sequence graph which allows RNN to extract fruit data differently and effectively [38].
In recurring neural networks, the number of model parameters is substantially reduced by converting and sharing parameters in comparison with fully connected neural networks. Furthermore, convolutionary layers can draw from raw sequences high-level features. The neurons in the convolutionary layer analyze the variations (increase or decrease) and patterns of fruit production close to regular weight matrices. The cumulative pooling layer is used to summarize the activation by highest value of some neighboring neurons and minimize fitness. Therefore, completely connected layers can be used to create final nonlinear combination after feature extraction on all types of layers (see Figure 3).

2.7. Method Renovation and Evaluation

The authors have developed a predictive model that forecasts agricultural fruit yields. For this reason, the use of increased or decreased fruit categories is derived from agricultural fruit results. The model was tested by Spatial Prediction, Logistic Regression, SVM Regression, AdaBoost, and Multilayer Perceptron Neural Network. The agricultural fruit was predicted on the basis of increase and decrease rank and harvested on the origin of high rank fruit production features.
Authors have also identified a way of evaluating the quality of the fruit results. The assessment approach employs several performance criteria that are widely used to determine the effectiveness of the model in the different tasks.
For predicting the accuracy, the concept and procedure are as follows: As TP (true positive) is detected, the pattern rises and is considered as increased (fruit production increased). If it is calculated to be TN (true negative), the rate falls and is labeled as declining (fruit production decreased). The FP (false positives) are characterized as cases when the trend is decreasing but consider as rising, and FN (false negatives) are found where the trend is rising but considered as falling [39].
Recall = ( TP ) ( TP ) + ( FN )
Precision = ( TP ) ( TP ) + ( FP )
Accuracy = ( TP ) + ( TN ) ( TP ) + ( FP ) + ( FN ) + ( TN )
F 1   Score = 2   ( Precision Recall ) ( Precision + Recall )

2.8. Experimental Dataset

The “National Bureau of China” has obtained time series data sets and data are available online (FAO 2020) [40,41]. To analyze the correlation between AGR-DL and the production of major fruit crops, data samples were used from 1980 to 2018. The variables used in this study are the production of fruit, apple, citrus, pear, grape, banana, and total fruit output. The output weight for each is 10,000 tons. Table 1 shows the details of China fruit production dataset along the timeframes considered for training and prediction of the system.
In this section, the experiments are performed using an open-source dataset based on fruit production, acquired from the agriculture organization website (FAO, 2020). The dataset consists of 38 years of fruit production records (tuples) and 6 features. Therefore, authors get a 38 × 6 feature matrix and obtain different accuracy with different algorithms. If the production increases from the last year, then the value is 1 and if it decreases, then the value is 0. Following are the model input features: Total number of years 38 (1980–2018), training set size 70% production (one fruit), test set size 30% production (one fruit), number of classes 5 (fruits), fruit measuring size 10,000 tonnes and production increase/decrease (i.e., 1/0).
The relationship between variables are stated below:
L o g T F P t = δ 0 + δ 1 L o g T A P t + δ 2 L o g T B P t + δ 3 L o g T C P t + δ 4 L o g T P P t + δ 5 L o g T G P t + ε t
As shown above in Equation (16), the parameters are total fruit production (TFP), total apple production (TAP), total banana production (TBP), total citrus production (TCP), total pear production (TPP), and tota grapes production (TGP). ε stands for the error terms and t represents the time. δ 0 (intercept) refers to a value of Y when X = 0, while δ 1 (regression coefficient, also known as the slope) refers to the difference in variable Y caused by a one-unit change in variable X. The hyperparameters are the learning rate 0.1, the batch size 32, and the number of epochs 100.

3. Results

3.1. Apple Production

Apple is a mild climatic fruit produced in a large number of European and Asian regions. Apples are the 4th largest feed fruit in the world and have a production potential in 94 countries and a fresh-weight yield of 69.60 million tons from 4.85 million hectares [41]. The change in weather patterns as given in the U.N. Fourth Assessment Report [42], the temperature increases and continues to change in the future. Since 1850, the warmest years were a patch of eleven years (1995–2006). The extreme weather affects the crop growth as a result of global warming, and thus threatens food security [43,44].
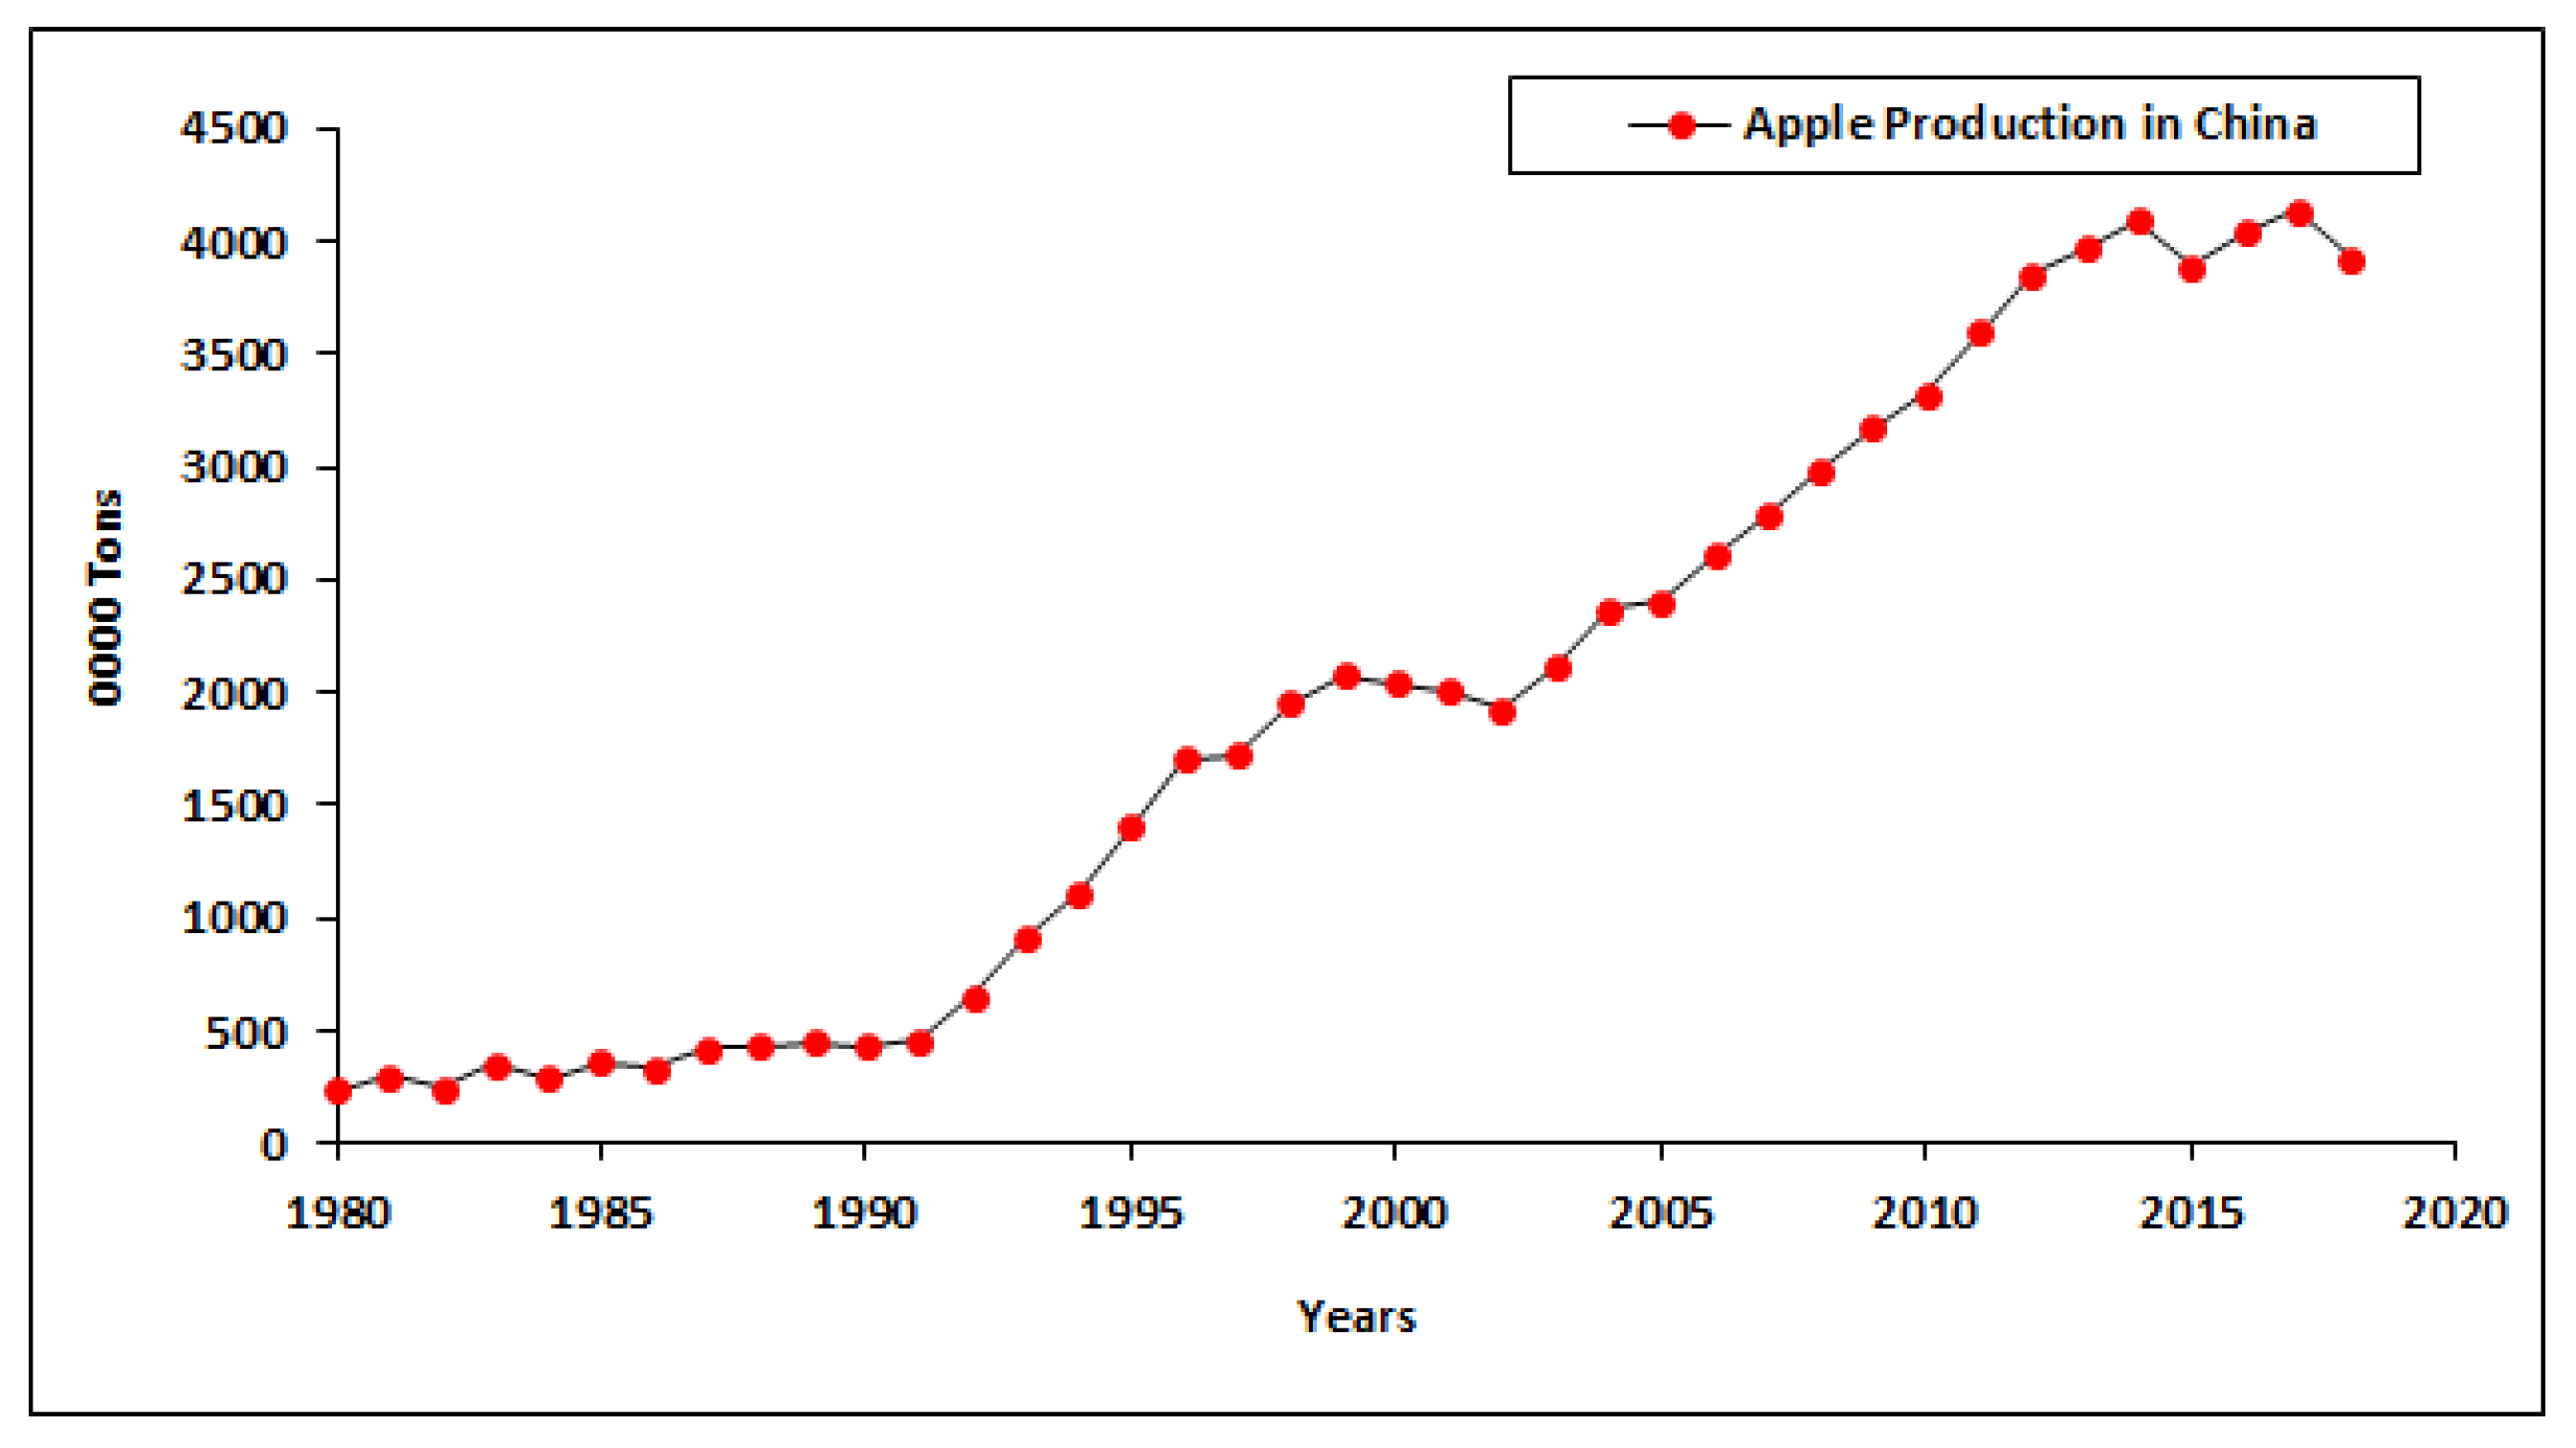
There are variations in crop productions and yields from one place to another as a result of climate change [45,46]. The effects of global warming are extremely significant on farmland. It influences the apple’s flowering, time of blooming, color, size and shape. The soils appear to exhibit a strong geographic association with climate, particularly on a global level. With the passage of time, climate tends to become the prime influencer on soil characteristics, the impacts of parent material has less energy and extreme weather strongly influences the parent material’s physical and chemical reactions. The temperature is an important component in natural vegetation growth, and soil temperature influences plant growth. The extreme weather also influences the horizons development, such as soil translocation of dissolved ions. In this article, the authors quantify the WTP (“willingness to pay”) by consumers, a premium price for fruit quality certification, and a strategy for monitoring fresh fruit regulations [47]. W. Ma et al. [48] investigates the effects of cooperative membership on measures of farm success, such as apple crops. In China, apple was grown at 236.3 tonnes (10,000) in 1980, and in 1990, the apple production was up to 431.9 tonnes, while in 2000, the apple production was at 2043.1 tonnes. The output rose to 3326.3 tonnes in 2010 and the output grew to 4831.5 tonnes in 2018. The production of apples from 1980 to 2018 is presented in Figure 4 in tens of thousands of tonnes.

3.2. Citrus Production

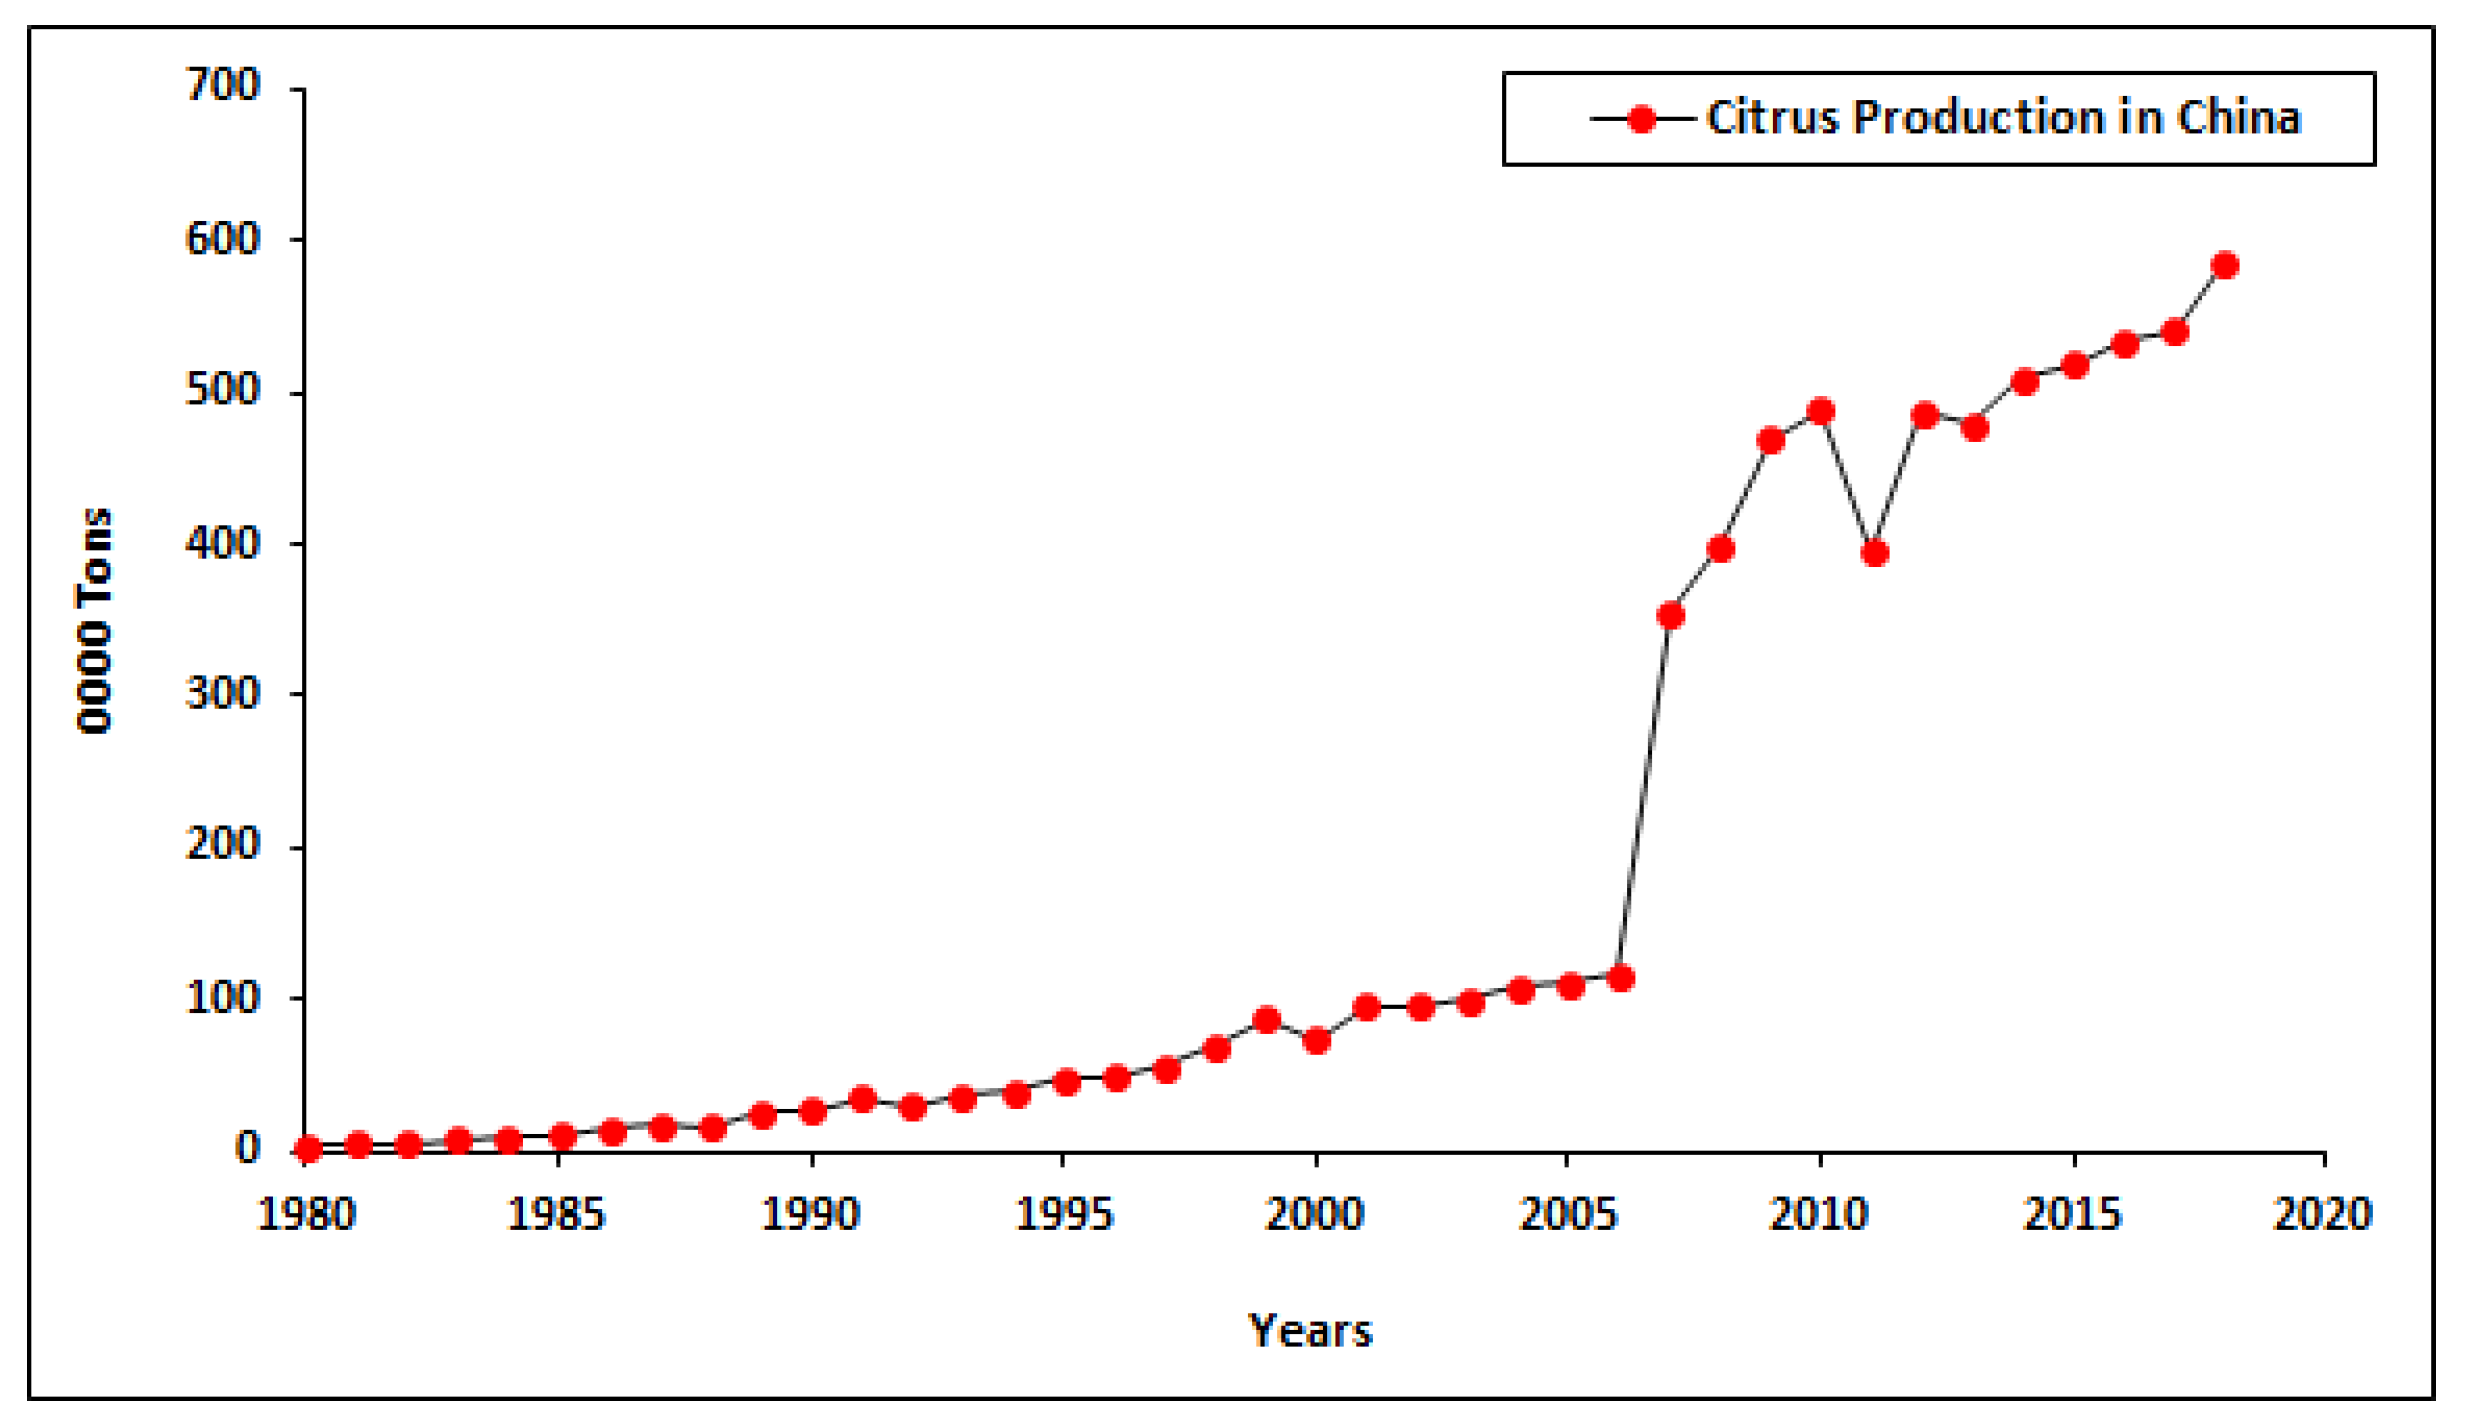
The most valuable fruit cultivation in foreign trade is citrus fruit. There are two main sectors for citrus fruits: the market for fresh fruit and processed citrus fruits (mainly orange juice). For Citrus capital, China is one of the leading producer. Except high tariffs on citrus making domestic sales profitable, China could play a major role in orange juice and processed citrus markets. X. Guan et al. [49] fruit extracts of Chinese wild Citrus. Wang, Y. et al. [50] are focused on hilly citrus production knowledge. The production of citrus in China increased to 71.3 tonnes in 1980 (10,000) and the production grew to 485.5 tonnes in 1990; output rose to 878.3 tonnes in 2000, 2645.2 tonnes in 2010, and output increased to 2556.3 tonnes in 2015, and output rose to 2556.3 tonnes in 2018. The production of citrus from 1980 to 2018 is given in Figure 5 in tens of thousands of tonnes.

3.3. Pear Production

Pears are among the major fruits in temperate climates like in China. Because of its broad climate and soil adaptability, pears can be produced in temperate regions. In China, pear production amounted to 146.6 tonnes in 1980 (10,000 tonnes), and pear production increased to 235.3 tonnes in 1990. The production amounted to 841.2 tonnes in 2000, which increased up to 1505.7 tonnes in 2010. In 2015, the production rose to 1798.8 tonnes and reached 2718.2 tonnes in 2018 [42]. The production of pears from 1980 to 2018 is shown in Figure 6 in tens of thousands of tonnes.

3.4. Grape Production

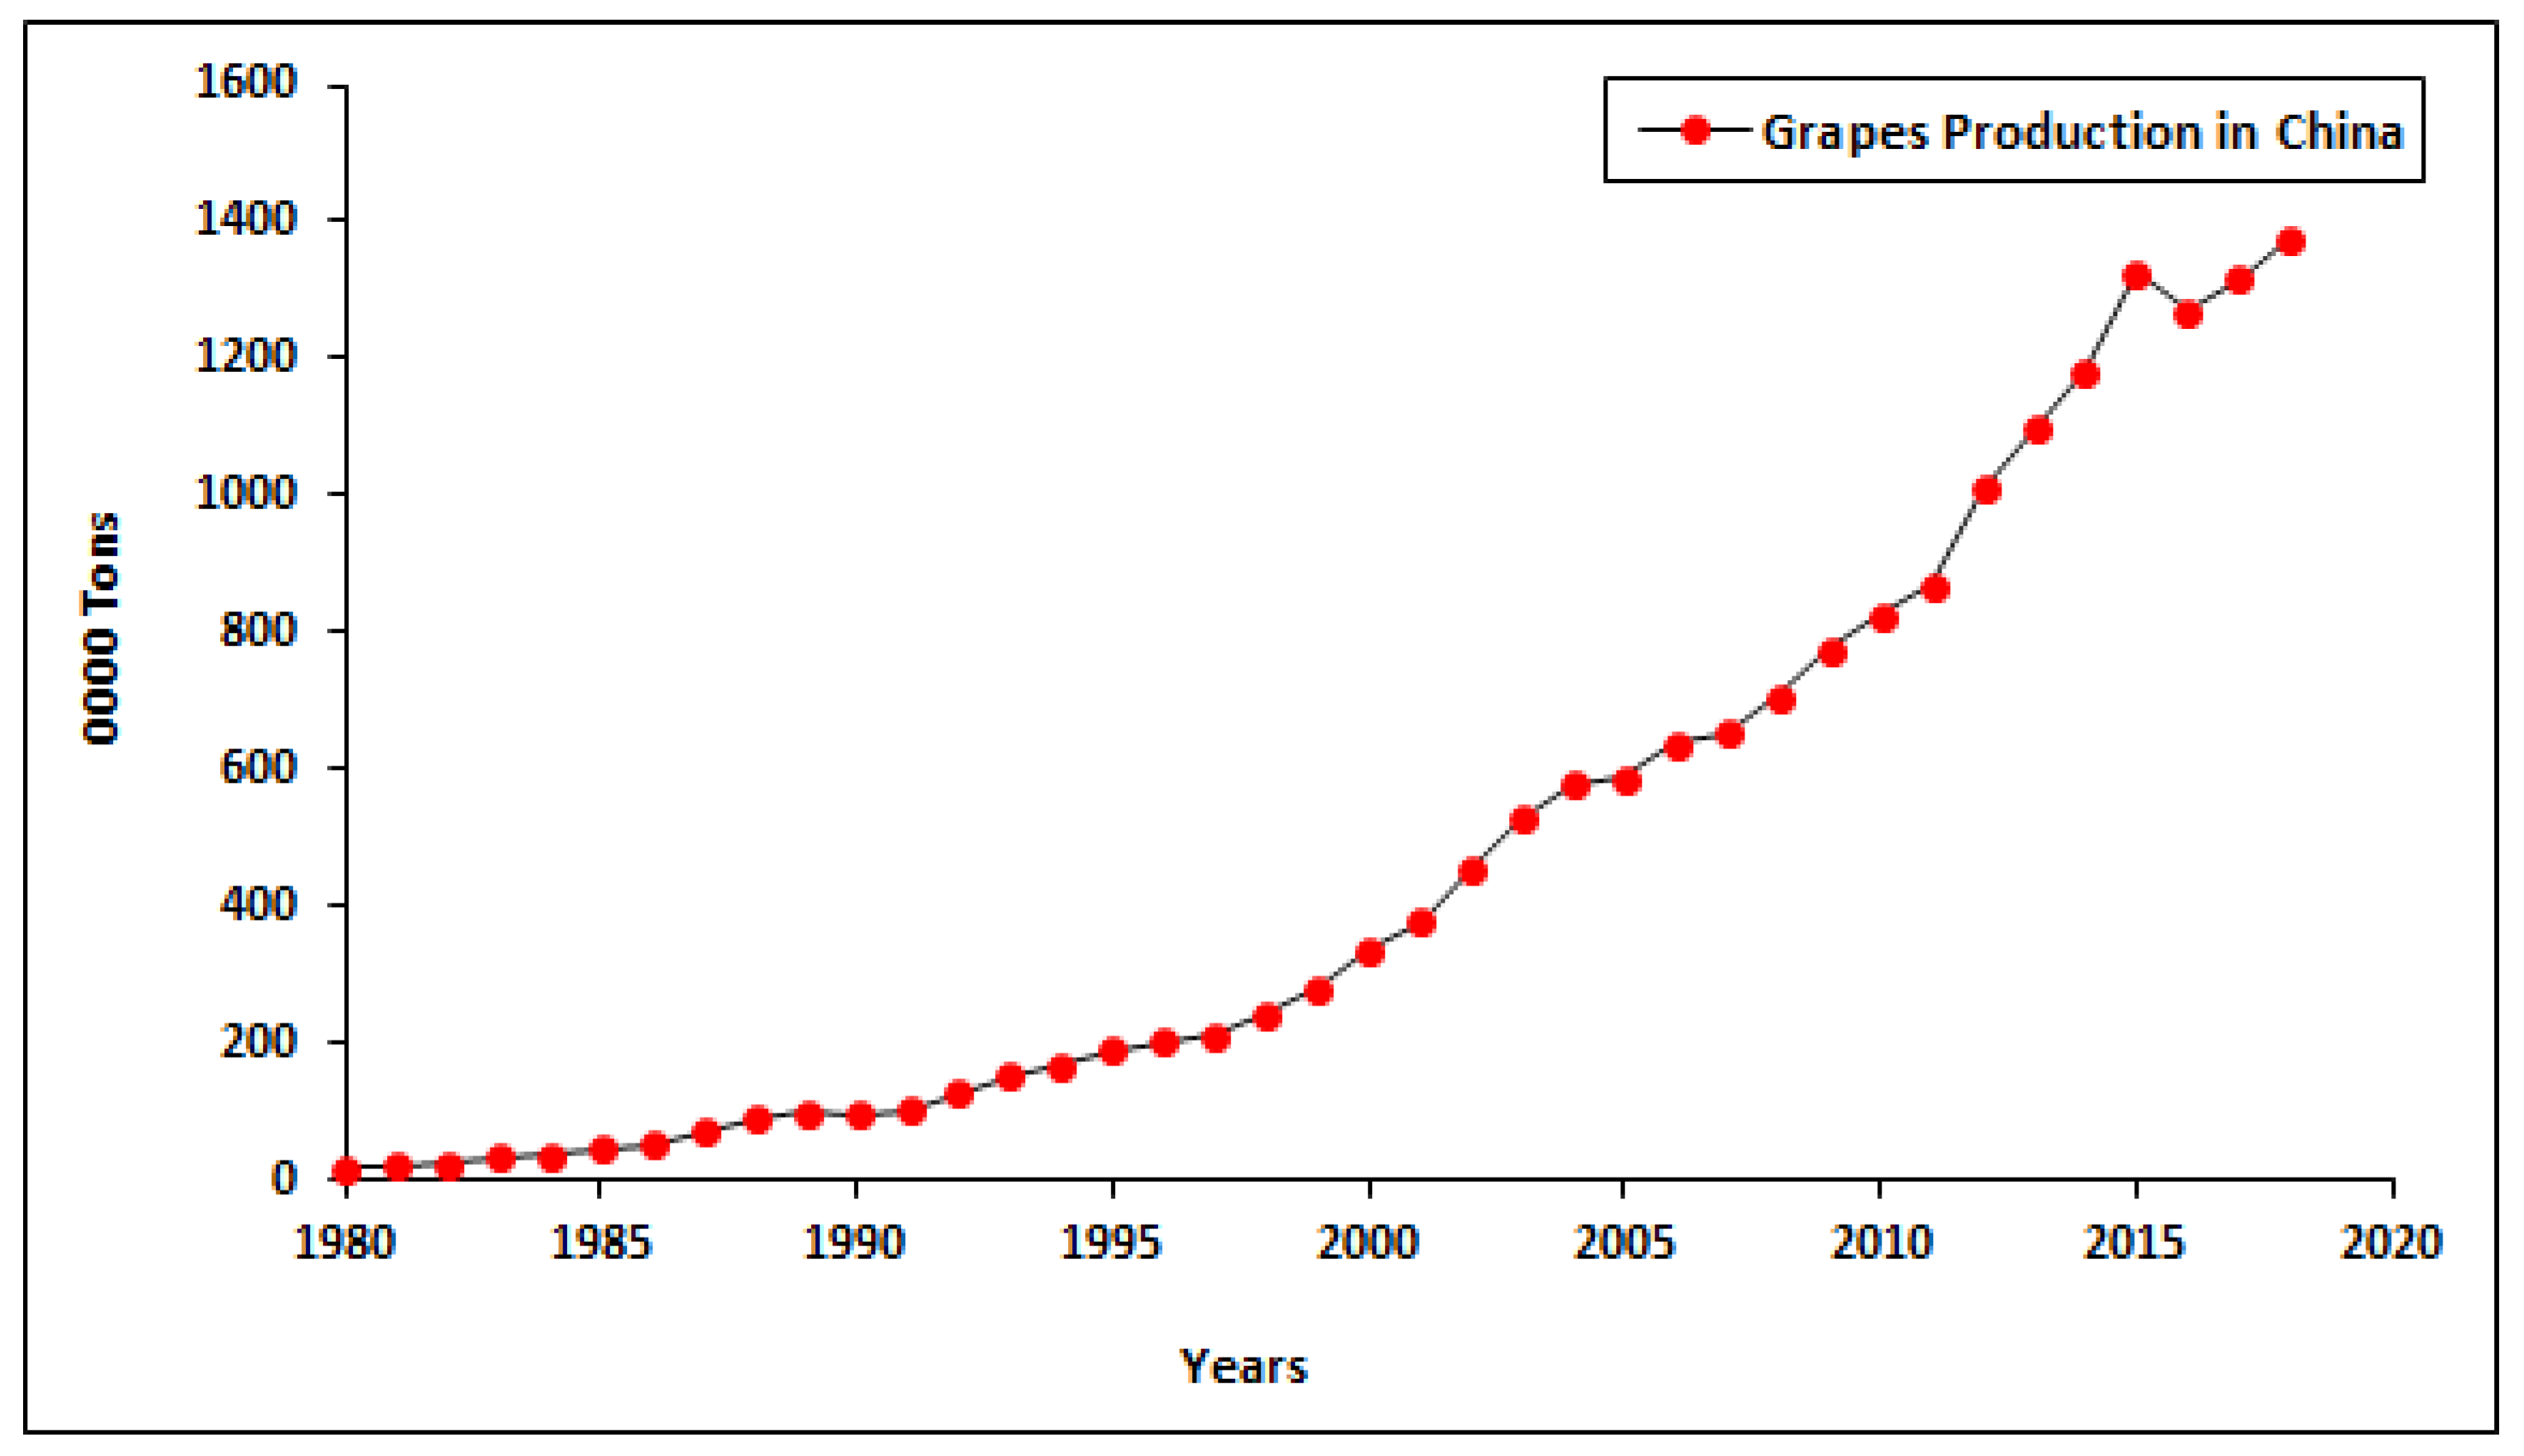
The grape agriculture is now really common and it can make a lot of financial gains for farmers. Most of the grapes varieties come from Chines provinces like Hebei, Xinjiang, Liaoning, Shandong, and Henan, and good source of income per acre for formers. The farming industry provides a grape agribusiness consultancy in China. Furthermore, there are different varieties and qualities of grapes in China. Li, Q et al. [51] compared the east China to west China Cabernet Sauvignon grown. In China, grapes output increased from 11.0 tonnes to 328.2 tonnes between 1980 and 2000, up to 854.9 tonnes in 2010, production increased to 1353.6 tonnes and 2045.8 tonnes in 2015 and 2018, respectively. The production of grapes from 1980 to 2018 is depicted in Figure 7 in tens of thousands of tonnes.

3.5. Banana Production

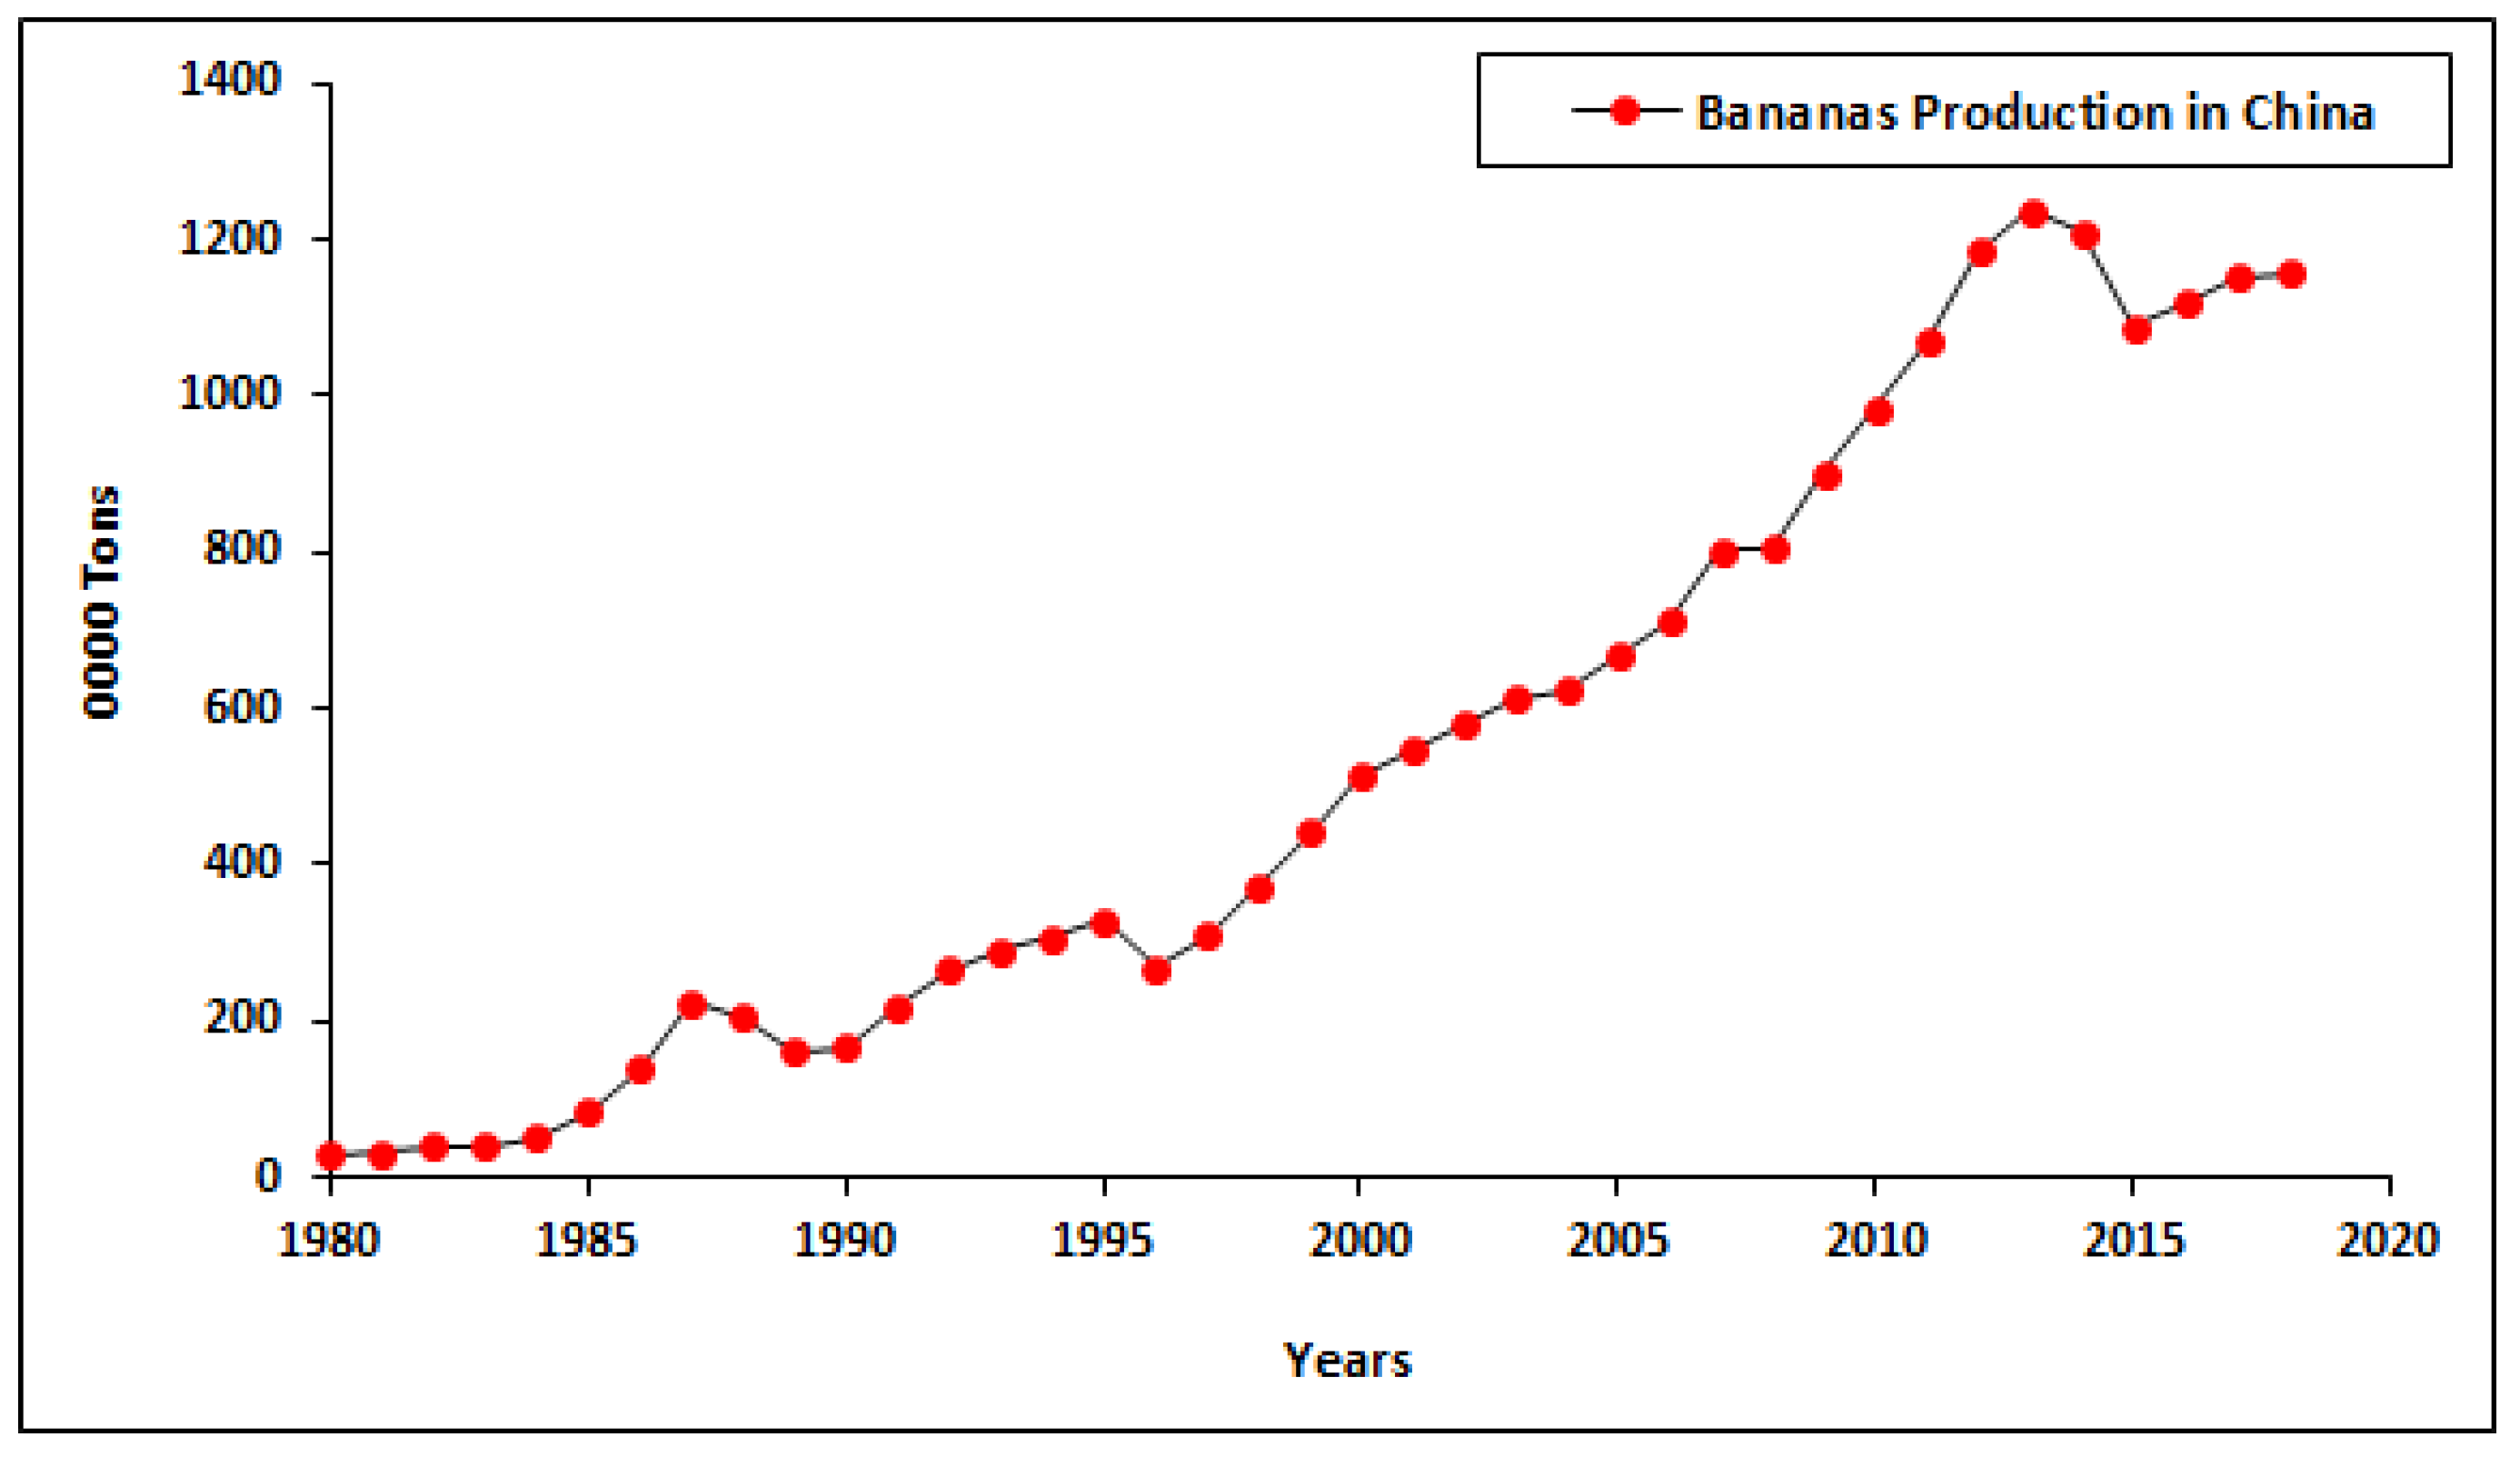
Bananas are another most important fruit, along with vegetables corn, wheat, and rice. Almost 130 countries cultivate bananas by using 0.1% land, according to (FAO 2013) with a total capital investment of 9 billion USD and an approximate retail value of 25 billion USD. The main consumption of bananas is domestic, and only 17% of bananas are exported to foreign markets each year. From Latin America, one-third of bananas are exported by the similar amount to the United States or Europe (FAO 2013) [41]. The banana marketplace is considered heavy in vertical and horizontal integration within the value chain. Bananas have traditionally been cultivated on plantations and in past few decades some viruses, plagues, and fungi have spread epidemically, possibly as a result of reduced immunity from monoculture [52]. The production of bananas from 1980 to 2018 is shown in Figure 8 in tens of thousands of tonnes.
In China, banana production in 1980 amounted to 6.1 (10,000) tonnes and, in 1990, it rose to 145.6 tonnes. In 2000, output amounts to 494.1 tonnes, it reached 956.1 tonnes in 2010, and expanded to 1150.4 tonnes in 2015, demand soared to 1380.7 tonnes in 2018.
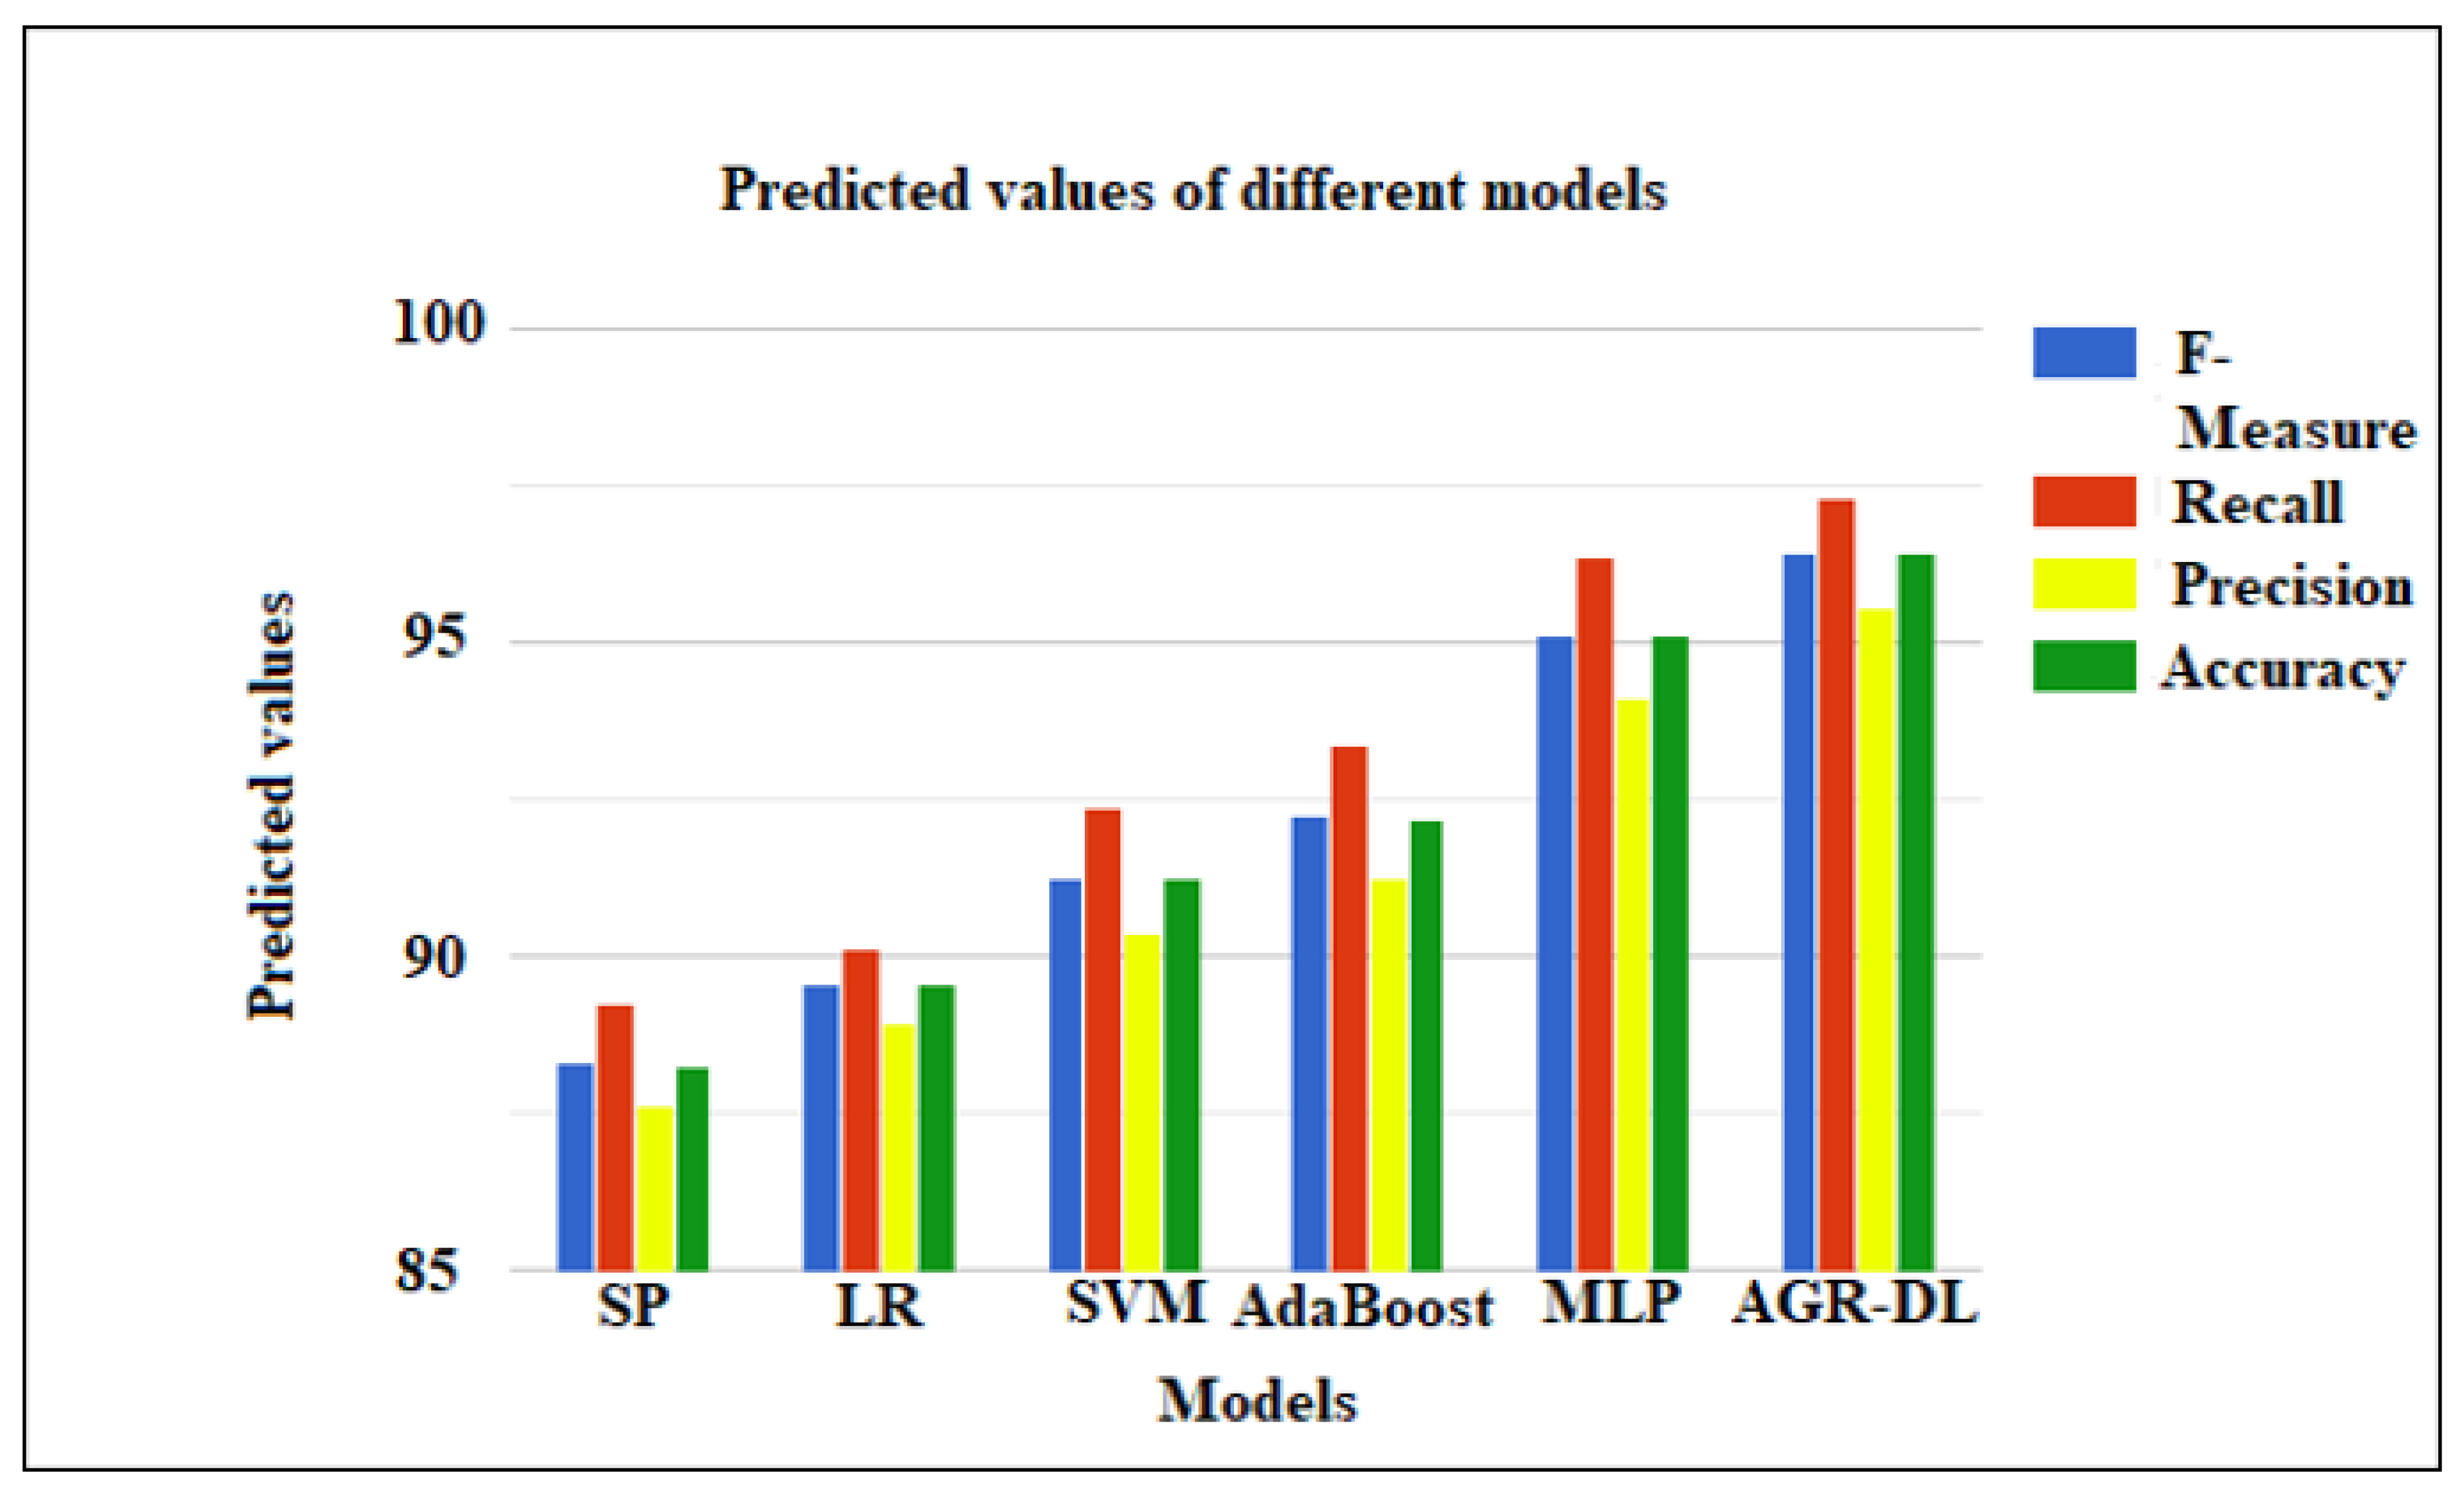
Figure 9 shows the F-measure, recall, precision and predicted accuracy, of different methods, machine learning methods (SP, LR, SVM, AdaBoost, MLP, and AGR-DL) have good accuracy. Figure 10 Shows the precision plot of AGR model.
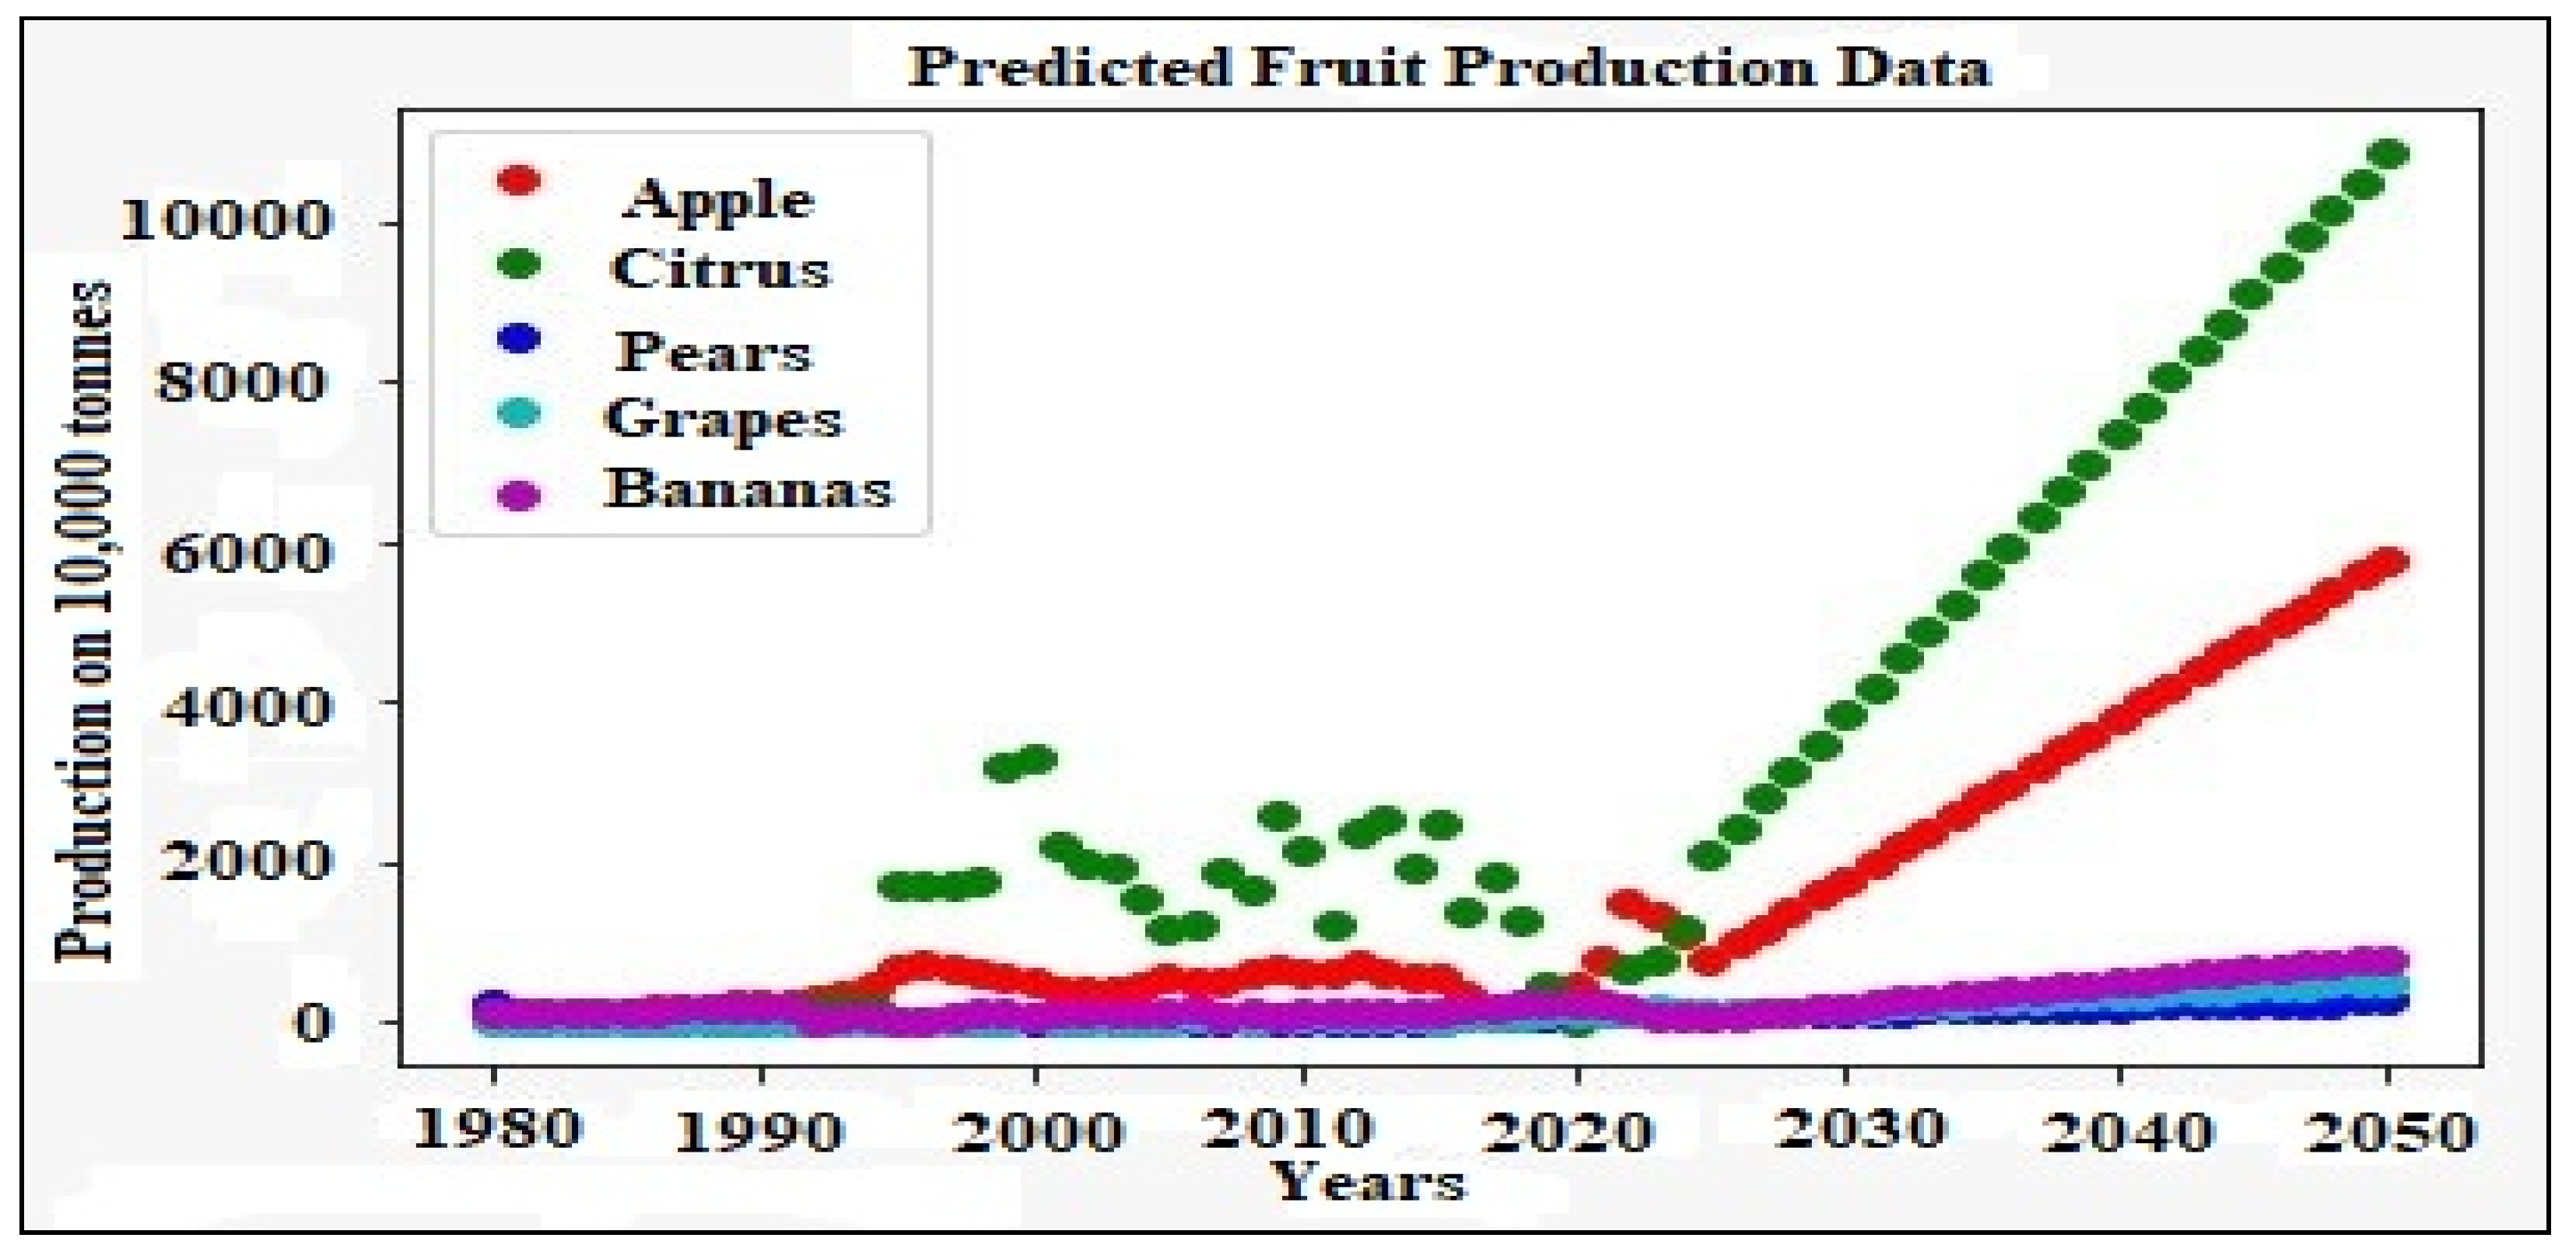
Figure 11 shows the history fruit production data, and Figure 12 shows the predicted future fruit production date.
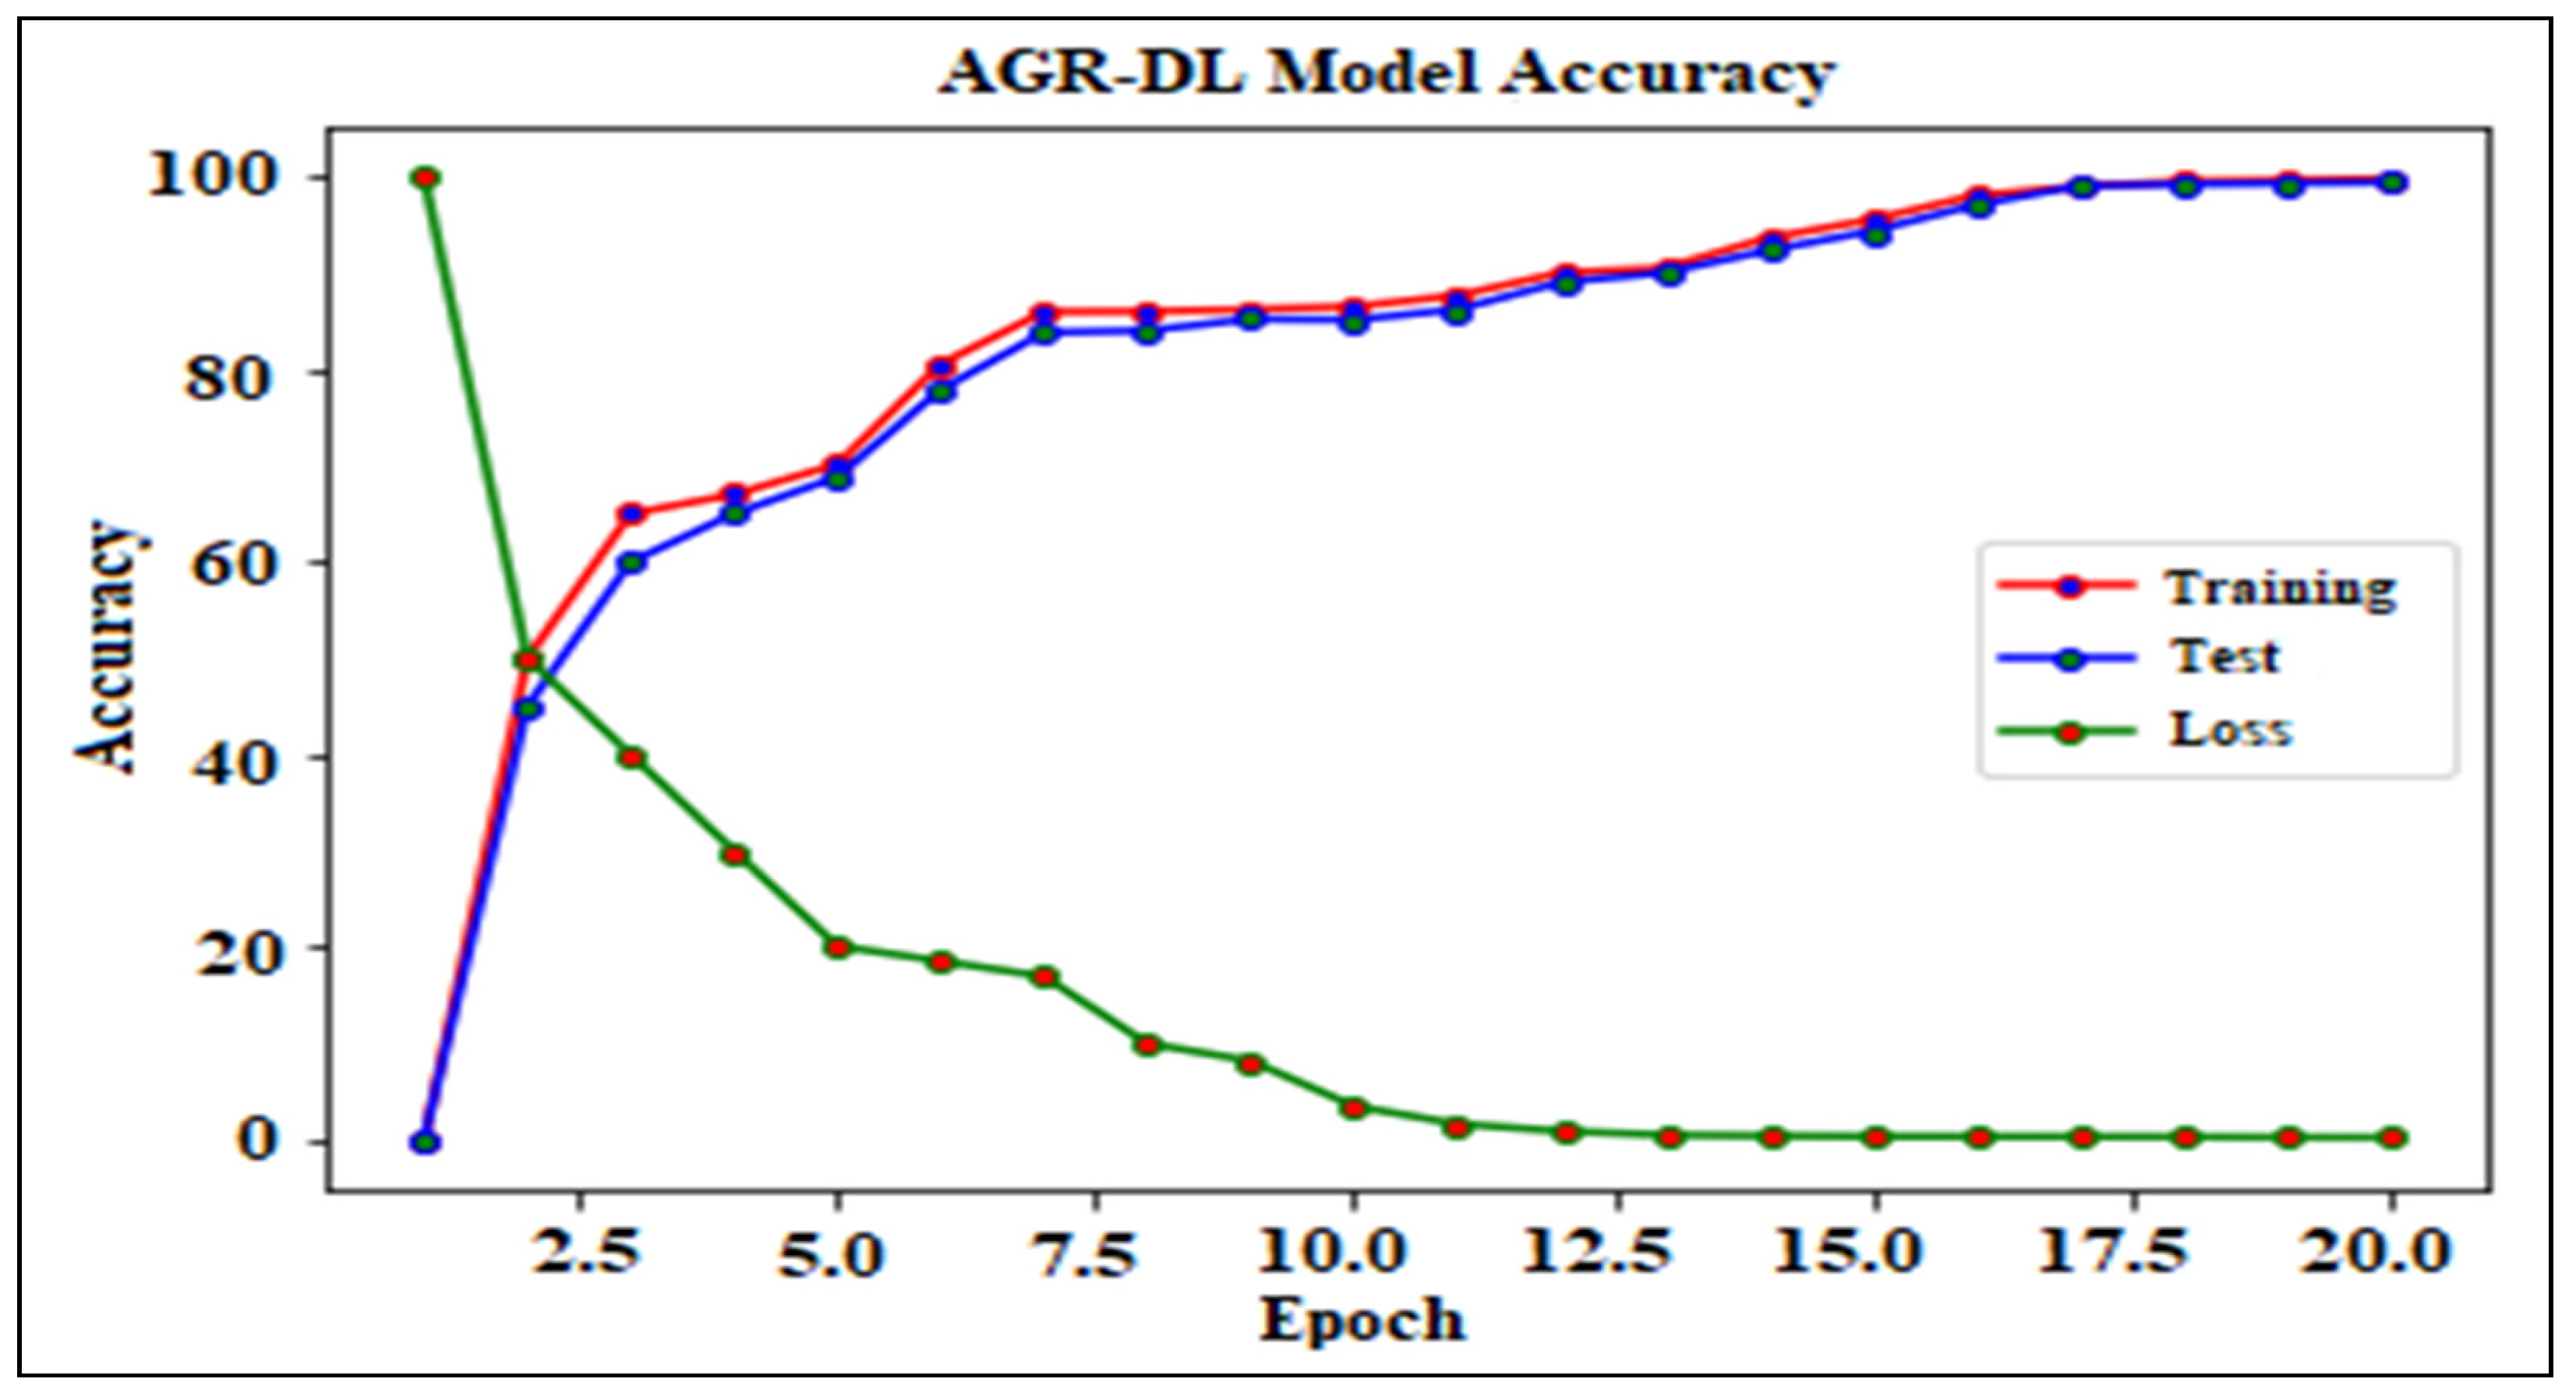
Figure 13 shows the training, test, and loss of the AGR-DL model, and it has a minimum loss.

3.6. Comparison of Study

In this section, a comparative analysis of the proposed approach has been presented with existing state of the art approaches. In the literature, serious efforts have been made to predict the fruit growth prediction for different countries, but a very limited work is reported in the literature for fruite growth prediction of China. The production of crops rose to 35% in China from 1990 to 2006 while the most of the growth depending on vegetables and fruits [11]. Therefore, it is an important research direction to utilize latest machine learning techniques for this analysis. In Table 2, the results of our proposed approach have been compared with an existing approach [53]. In this approach [53], authors have also considered the five different categories of fruit, i.e., apple, banana, grapes, citrus, and pears. The main objective of their study was to find a correlation between AGDP (agriculture gross domestic product) and fruit growth. They performed their analysis on a dataset (1980 to 2015) taken from the Ministry of Agriculture (MOA) of China and the China Bureau of Statistics. They performed different statistics test as well as regression analysis to determine the relationship between AGDP and fruit growth. Their experimental variables are AGDP (in million RMB), production output of apples, bananas, grapes, citrus, and pears (in 10,000 tonnes).
In this proposed approach, authors have considered the time series data from 1980 to 2018 and have applied different machine learning and deep learning techniques. They have used the following experimental variables: production output of apples, banans, grapes, citrus and pear (in 10,000 tons) with the respective year to train and test the machine learning and deep learning models.
It is obvious from the results presented in Table 2, the AGR-DL performs far better than the existing approach. AGR-DL demonstrates an average accuracy of 96.42 ± 2%. Table 3 illustrates that the variations are small when compared to the increase in precision, which suggests that AGR-DL is conducting randomly. The AGR-DL achives up to 95.56% precision which clearly argues about the superiority of the proposed approach compared to its counterparts.

4. Discussion and Recommendations

Fruit provides the necessary nutrition for our bodies by supplying the necessary sugar levels required to maintain a healthier lifestyle. Fruit provides the perfect supplement for hormonal imbalances and has many other positive effects, including curing some critical ailments. Fruit growth also plays an important role in the economy of a country, therefore, many countries have been utilizing a range of machine learning techniques for in depth analysis on fruit data and take appropriate decisions after getting the valuable information from available big data. For instance, Bresilla et al. [54] detected and counted fruits (apple and pear) under the tree canopy using novel convolutional deep learning algorithms based on single-shot detectors. This study used the image data of 5000 fruits and predicted the accuracy of more than 90% of them. Similarly, Khan et al. [55] finds effect of cimate change on fruit by cointegration and machine learning methods with an accuracy of 90.00 ± 2%. Dang et al. [56] presented a used convolution neural network (CNNs) and Efficient Net architecture for fruit recognition using the 360 fruit dataset. According to the results, the suggested model is 95% accurate. Khan et al. [57] used three machine learning methods (LM, SCG, and BR) and predict future fruit production from 1980 to 2025 with an accuracy of 76.30 ± 2%. Arab et al. [58] used an artificial neural network and regression analysis to find different vegetation index (NDVI) of grape fruit with accuracy 2018 (R = 0.95).
In this paper, we have utilized different machine learning and deep learning techniques for fruit growth prediction. We considered five different fruit categories and trained the models by using the production value in the respective year as feature set. Table 2 presents the experimental results of the applied machine learning models. The results exhibit that AGR-DL performed far better than the baseline methods. AGR-DL has an average precision of 95.56± 2 percent in the data set. Furthermore, the findings shown in Table 2 illustrate that the variations are small when compared to the increases in precision, which suggests that AGR-DL is conducting randomly. The Experimental results are presented in Table 2 and it is clear that the proposed approach performs better in terms of higher accuracy.
We also performed a comparative analysis of the proposed approach with an existing state-of-the-art approach, and the results are presented in Table 3. In the existing appraoch [53], the authors considered the five different categories of fruits: apples, bananas, grapes, citrus, and pears. The main objective of their study was to find a correlation between AGDP (agriculture gross domestic product) and fruit growth. The objective of their work is to determine the relationship between AGDP and fruit growth. It is obvious from the results given in Table 3, proposed deep learning based approach for fruit growth prediction outperforms its counterpart with higher precision.

5. Conclusions

The production of fresh fruits is important for every country and their production rate is critical to the farmers who rely entirely on the agricultural policies of government. The production rate improves dramatically when the governments start focusing on the policy making to facilitate formers. This research uses current data on fruit production (of China) to establish the AGR-DL method in order to forecast fruit production and presents the findings of the proposed method. The authors employ deep neural networks in the AGR-DL model, which frequently forecasts patterns in the production of agricultural fruit. In order to predict fruit production, five machine learning models (SP, LR, SVM, AdaBoost, MLP, and AGR-DL) have been employed as baseline. The deployed algorithms demonstrate a fair precision of 87.65%, 88.96%, 90.37%, 91.23%, and 94.12%, respectively, but AGR-DL is capable to achive upto 95.56% precision which clearly argues about the superiority of the prosed approach compared to its counterparts. From this analysis, the authors recommend that government should follow the future prediction system to focus on valuable decision-making to increase the fruit production as required. Moreover, it is also helpful for the former to find out which fruit’s production is deficient so they can focus on that fruit for the next year. As a future work, different deep learning algorithms could be implemented for other countries using the available datasets to provide valuable guidelines for the development of a new (more accurate) models. Furthermore, it is also possible to compare the population growth with fruit production of different countries. Similarly, a comparison of fruit production and policies in the developed countries with the developing countries could also be valuable.

Author Contributions

Conceptualization and methodology T.K.; H.H.R.S.; M.A.; writing—original draftpreparation T.K.; M.A.; U.M.B., Review and editing, T.K.; H.H.R.S.; M.A.; S.L. All authors have read and agreed to the published version of the manuscript.

Funding

This work was supported by financial support from Universiti Sains Malaysia (USM) under FRGS grant number FRGS/1/2020/TK03/USM/02/1 and the School of Computer Sciences USM.

Conflicts of Interest

The authors declare no conflict of interest.

Abbreviations

The following abbreviations are used in this manuscript: AGR-DL Agriculture deep learning; ANN Artificial neural network; SP Spatial Prediction; LR Logistic regression; SVM Support vector machine; TN concentrations True negative concentrations; PLSR Partial least squares regression; MLR Multiple linear regression; RBF Radial base function; SVM Support vector machine; R.MS extent Root mean squared extent; BDLRF Backpropagation with Declining Learning rate Factor.

References

  1. Niazian, M.; Niedbała, G. Machine Learning for Plant Breeding and Biotechnology. Agriculture 2020, 10, 436. [Google Scholar] [CrossRef]
  2. Liakos, K.; Busato, P.; Moshou, D.; Pearson, S.; Bochtis, D. Machine Learning in Agriculture: A Review. Sensors 2018, 18, 2674. [Google Scholar] [CrossRef] [PubMed] [Green Version]
  3. Darwin, B.; Dharmaraj, P.; Prince, S.; Popescu, D.E.; Hemanth, D.J. Recognition of Bloom/Yield in Crop Images Using Deep Learning Models for Smart Agriculture: A Review. Agronomy 2021, 11, 646. [Google Scholar] [CrossRef]
  4. Dias, P.A.; Tabb, A.; Medeiros, H. Apple flower detection using deep convolutional networks. Comput. Ind. 2018, 99, 17–28. [Google Scholar] [CrossRef] [Green Version]
  5. Pereira, T.D.; Aldarondo, D.E.; Willmore, L.; Kislin, M.; Wang, S.S.-H.; Murthy, M.; Shaevitz, J.W. Fast animal pose estimation using deep neural networks. Nat. Methods 2018, 16, 117–125. [Google Scholar] [CrossRef] [PubMed]
  6. Wang, J.; Mendelsohn, R.; Dinar, A.; Huang, J. How chinese farmers change crop choice to adapt to climate change. Clim. Chang. Econ. 2010, 1, 167–185. [Google Scholar] [CrossRef]
  7. Huang, Z.; Liang, Q. Agricultural organizations and the role of farmer cooperatives in China since 1978: Past and future. China Agric. Econ. Rev. 2018, 10, 48–64. [Google Scholar] [CrossRef]
  8. Zarifneshat, S.; Rohani, A.; Ghassemzadeh, H.R.; Sadeghi, M.; Ahmadi, E.; Zarifneshat, M. Predictions of apple bruise volume using artificial neural network. Comput. Electron. Agric. 2012, 82, 75–86. [Google Scholar] [CrossRef]
  9. Zhao, R.; Li, Y.; Ma, M. Mapping Paddy Rice with Satellite Remote Sensing: A Review. Sustainability 2021, 13, 503. [Google Scholar] [CrossRef]
  10. Murat, Y.S.; Ceylan, H. Use of artificial neural networks for transport energy demand modeling. Energy Policy 2006, 34, 3165–3172. [Google Scholar] [CrossRef]
  11. Li, W.; Yang, M.; Wang, J.; Wang, Z.; Fan, Z.; Kang, F.; Wang, Y.; Luo, Y.; Kuang, D.; Chen, Z.; et al. Agronomic Responses of Major Fruit Crops to Fertilization in China: A Meta-Analysis. Agronomy 2020, 10, 15. [Google Scholar] [CrossRef] [Green Version]
  12. Cherian, R.P.; Smith, L.N.; Midha, P.S. A neural network approach for selection of powder metallurgy materials and process parameters. Artif. Intell. Eng. 2000, 14, 39–44. [Google Scholar] [CrossRef]
  13. Smith, L.N.; German, R.M.; Smith, M.L. A neural network approach for solution of the inverse problem for selection of powder metallurgy materials. J. Mater. Process. Technol. 2002, 120, 419–425. [Google Scholar] [CrossRef]
  14. Sanzogni, L.; Kerr, D. Milk production estimates using feed forward artificial neural networks. Comput. Electron. Agric. 2001, 32, 21–30. [Google Scholar] [CrossRef]
  15. Korosec, M.; Balic, J.; Kopac, J. Neural network based manufacturability evaluation of free form machining. Int. J. Mach. Tools Manuf. 2005, 45, 13–20. [Google Scholar] [CrossRef]
  16. Hu, R.; Yang, Z.; Kelly, P.; Huang, J. Agricultural extension system reform and agent time allocation in China. China Econ. Rev. 2009, 20, 303–315. [Google Scholar] [CrossRef]
  17. Agrawal, D.; Schorling, C. Market share forecasting: An empirical comparison of artificial neural networks and multinomial logit model. J. Retail. 1996, 72, 383–407. [Google Scholar] [CrossRef]
  18. Co, H.C.; Boosarawongse, R. Forecasting Thailand’s rice export: Statistical techniques vs. artificial neural networks. Comput. Ind. Eng. 2007, 53, 610–627. [Google Scholar] [CrossRef]
  19. Ali, A.; Imran, M.M. Evaluating the potential of red edge position (R.E.P.) of hyperspectral remote sensing data for real time estimation of LAI & chlorophyll content of kinnow mandarin (Citrus reticulata) fruit orchards. Sci. Hortic. 2020, 267, 109326. [Google Scholar] [CrossRef]
  20. Vakil-Baghmisheh, M.-T.; Pavešić, N. A Fast Simplified Fuzzy ARTMAP Network. Neural Process. Lett. 2003, 17, 273–316. [Google Scholar] [CrossRef]
  21. Friis, C.; Nielsen, J.Ø. Small-scale land acquisitions, large-scale implications: Exploring the case of Chinese banana investments in Northern Laos. Land Use Policy 2016, 57, 117–129. [Google Scholar] [CrossRef] [Green Version]
  22. Viani, F.; Bertolli, M.; Salucci, M.; Polo, A. Low-Cost Wireless Monitoring and Decision Support for Water Saving in Agriculture. IEEE Sens. J. 2017, 17, 4299–4309. [Google Scholar] [CrossRef]
  23. McIntosh, R.B.; Casada, M.E. Fringing Field Capacitance Sensor for Measuring the Moisture Content of Agricultural Commodities. IEEE Sens. J. 2008, 8, 240–247. [Google Scholar] [CrossRef]
  24. Ochiai, H.; Ishizuka, H.; Kawakami, Y.; Esaki, H. A DTN-Based Sensor Data Gathering for Agricultural Applications. IEEE Sens. J. 2011, 11, 2861–2868. [Google Scholar] [CrossRef]
  25. Kone, C.T.; Hafid, A.; Boushaba, M. Performance Management of IEEE 802.15.4 Wireless Sensor Network for Precision Agriculture. IEEE Sens. J. 2015, 15, 5734–5747. [Google Scholar] [CrossRef]
  26. Biffi, L.J.; Mitishita, E.; Liesenberg, V.; Santos, A.A.D.; Gonçalves, D.N.; Estrabis, N.V.; Silva, J.D.A.; Osco, L.P.; Ramos, A.P.M.; Centeno, J.A.S.; et al. ATSS Deep Learning-Based Approach to Detect Apple Fruits. Remote Sens. 2021, 13, 54. [Google Scholar] [CrossRef]
  27. Wang, L.; Zhou, Y.; Li, Q.; Xu, T.; Wu, Z.; Liu, J. Application of Three Deep Machine-Learning Algorithms in a Construction Assessment Model of Farmland Quality at the County Scale: Case Study of Xiangzhou, Hubei Province, China. Agriculture 2021, 11, 72. [Google Scholar] [CrossRef]
  28. Abbas, F.; Afzaal, H.; Farooque, A.A.; Tang, S. Crop Yield Prediction through Proximal Sensing and Machine Learning Algorithms. Agronomy 2020, 10, 1046. [Google Scholar] [CrossRef]
  29. Kuznetsova, A.; Maleva, T.; Soloviev, V. Using YOLOv3 Algorithm with Pre- and Post-Processing for Apple Detection in Fruit-Harvesting Robot. Agronomy 2020, 10, 1016. [Google Scholar] [CrossRef]
  30. Zhang, L.; Kono, Y.; Kobayashi, S. The process of expansion in commercial banana cropping in tropical China: A case study at a Dai village, Mengla County. Agric. Syst. 2014, 124, 32–38. [Google Scholar] [CrossRef]
  31. Jang, Y.M.; Mallipeddi, R.; Lee, M. Exogenous and Endogenous Based Spatial Attention Analysis for Human Implicit Intention Understanding. In Neural Information Processing: ICONIP 2013; Lecture Notes in Computer, Science; Lee, M., Hirose, A., Hou, Z.G., Kil, R.M., Eds.; Springer: Berlin/Heidelberg, Germany, 2013; Volume 8226. [Google Scholar]
  32. Prodanova, K.; Negreva, M.; Vitlianova, K. Diagnostic Values of Some Fibrinolytic Indicators for Rejecting the Presence of Paroxysmal Atrial Fibrillation. Int. J. Basic Sci. Appl. Comput. 2020, 2, 1–6. [Google Scholar] [CrossRef]
  33. Møller, M.F. A scaled conjugate gradient algorithm for fast supervised learning. Neural Netw. 1993, 6, 525–533. [Google Scholar] [CrossRef]
  34. Dan Foresee, F.; Hagan, M.T. Gauss-Newton approximation to Bayesian learning. In Proceedings of the International Conference on Neural Networks (ICNN’97), Houston, TX, USA, 12 June 1997. [Google Scholar] [CrossRef]
  35. Freund, Y.; Schapire, R.E. A Decision-Theoretic Generalization of On-Line Learning and an Application to Boosting. J. Comput. Syst. Sci. 1997, 55, 119–139. [Google Scholar] [CrossRef] [Green Version]
  36. Yu, C.; Liu, B. A backpropagation algorithm with adaptive learning rate and momentum coefficient. In Proceedings of the 2002 International Joint Conference on Neural Networks, Honolulu, HI, USA, 12–17 May 2002. [Google Scholar] [CrossRef]
  37. He, K.; Zhang, X.; Ren, S.; Sun, J. Deep Residual Learning for Image Recognition. In Proceedings of the 2016 IEEE Conference on Computer Vision and Pattern Recognition (CVPR), Las Vegas, NV, USA, 27–30 June 2016; pp. 770–778. [Google Scholar] [CrossRef] [Green Version]
  38. Shen, Y.; Yin, Y.; Zhao, C.; Li, B.; Wang, J.; Li, G.; Zhang, Z. Image Recognition Method Based on an Improved Convolutional Neural Network to Detect Impurities in Wheat. IEEE Access 2019, 7, 162206–162218. [Google Scholar] [CrossRef]
  39. Powers, D.M.W. Evaluation: From precision, Recall and F-Measure to ROC, Informedness, Markedness & correlation. J. Mach. Learn. Technol. 2011, 2, 37–63. [Google Scholar] [CrossRef]
  40. FAO. World Food and Agriculture—Statistical Yearbook 2020; FAO: Rome, Italy, 2020. [Google Scholar]
  41. Rehman, A.; Deyuan, Z.; Hussain, I.; Iqbal, M.S.; Yang, Y.; Jingdong, L. Prediction of Major Agricultural Fruits Production in Pakistan by Using an Econometric Analysis and Machine Learning Technique. Int. J. Fruit Sci. 2018, 18, 445–461. [Google Scholar] [CrossRef]
  42. Miraglia, M.; Marvin, H.J.P.; Kleter, G.A.; Battilani, P.; Brera, C.; Coni, E.; Cubadda, F.; Croci, L.; De Santis, B.; Vespermann, A.; et al. Climate change and food safety: An emerging issue with special focus on Europe. Food Chem. Toxicol. 2009, 47, 1009–1021. [Google Scholar] [CrossRef]
  43. Nordhaus, W.D. A Review of the Stern Review on the Economics of Climate Change. J. Econ. Lit. 2007, 45, 686–702. [Google Scholar] [CrossRef]
  44. Supit, I.; van Diepen, C.A.; de Wit, A.J.W.; Kabat, P.; Baruth, B.; Ludwig, F. Recent changes in the climatic yield potential of various crops in Europe. Agric. Syst. 2010, 103, 683–694. [Google Scholar] [CrossRef]
  45. Olesen, J.E.; Trnka, M.; Kersebaum, K.C.; Skjelvåg, A.O.; Seguin, B.; Peltonen-Sainio, P.; Rossi, F.; Kozyra, J.; Micale, F. Impacts and adaptation of European crop production systems to climate change. Eur. J. Agron. 2011, 34, 96–112. [Google Scholar] [CrossRef]
  46. Winterbourn, M.J.; Cadbury, S.; Ilg, C.; Milner, A.M. Mayfly production in a New Zealand glacial stream and the potential effect of climate change. Hydrobiologia 2008, 603, 211–219. [Google Scholar] [CrossRef]
  47. Wang, L.; Huo, X. Willingness-to-pay price premiums for certified fruits—A case of fresh apples in China. Food Control. 2016, 64, 240–246. [Google Scholar] [CrossRef]
  48. Ma, W.; Abdulai, A. Does cooperative membership improve household welfare? Evidence from apple farmers in China. Food Policy 2016, 58, 94–102. [Google Scholar] [CrossRef]
  49. Guan, X.; Tan, S.; Buchholz, G.; Peter, N.; Zhou, Z. A method to evaluate the bioactive function of fruit extracts of Chinese wild Citrus with microtubular activity. J. Integr. Agric. 2017, 16, 867–873. [Google Scholar] [CrossRef] [Green Version]
  50. Wang, Y.; Wang, Y.; Wang, J.; Yuan, Y.; Zhang, Z. An ontology-based approach to integration of hilly citrus production knowledge. Comput. Electron. Agric. 2015, 113, 24–43. [Google Scholar] [CrossRef]
  51. Li, Q.; He, F.; Zhu, B.-Q.; Liu, B.; Sun, R.-Z.; Duan, C.-Q.; Reeves, M.J.; Wang, J. Comparison of distinct transcriptional expression patterns of flavonoid biosynthesis in Cabernet Sauvignon grapes from east and west China. Plant Physiol. Biochem. 2014, 84, 45–56. [Google Scholar] [CrossRef] [PubMed]
  52. Crozier, S.J.; Preston, A.G.; Hurst, J.W.; Payne, M.J.; Mann, J.; Hainly, L.; Miller, D.L. Cacao seeds are a “Super Fruit”: A comparative analysis of various fruit powders and products. Chem. Cent. J. 2011, 5, 5. [Google Scholar] [CrossRef] [Green Version]
  53. Abdul, R.; Zhang, D.; Luan, J. The Production and prediction of major chinese agricultural fruits using an econometric analysis and machine learning technique. Afr. J. Agric. Res. 2018, 13, 2134–2145. [Google Scholar] [CrossRef]
  54. Bresilla, K.; Perulli, G.D.; Boini, A.; Morandi, B.; Corelli Grappadelli, L.; Manfrini, L. Single-Shot Convolution Neural Networks for Real-Time Fruit Detection Within the Tree. Front. Plant Sci. 2019, 10, 611. [Google Scholar] [CrossRef] [Green Version]
  55. Khan, T.; Qiu, J.; Banjar, A.; Alharbey, R.; Alzahrani, A.O.; Mehmood, R. Effect of climate change on fruit by co-integration and machine learning. Int. J. Clim. Chang. Strateg. Manag. 2021. ahead-of-print. [Google Scholar] [CrossRef]
  56. Chung, D.T.P.; van Tai, D. A fruits recognition system based on a modern deep learning technique. J. Phys. Conf. Ser. 2019, 1327, 012050. [Google Scholar] [CrossRef]
  57. Khan, T.; Qiu, J.; Qureshi, M.A.A.; Iqbal, M.S.; Mehmood, R.; Hussain, W. Agricultural Fruit Prediction Using Deep Neural Networks. Procedia Comput. Sci. 2020, 174, 72–78. [Google Scholar] [CrossRef]
  58. Arab, T.S.; Noguchi, R.; Matsushita, S.; Ahamed, T. Prediction of grape yields from time-series vegetation indices using satellite remote sensing and a machine-learning approach. Remote Sens. Appl. Soc. Environ. 2021, 22, 100485. [Google Scholar] [CrossRef]
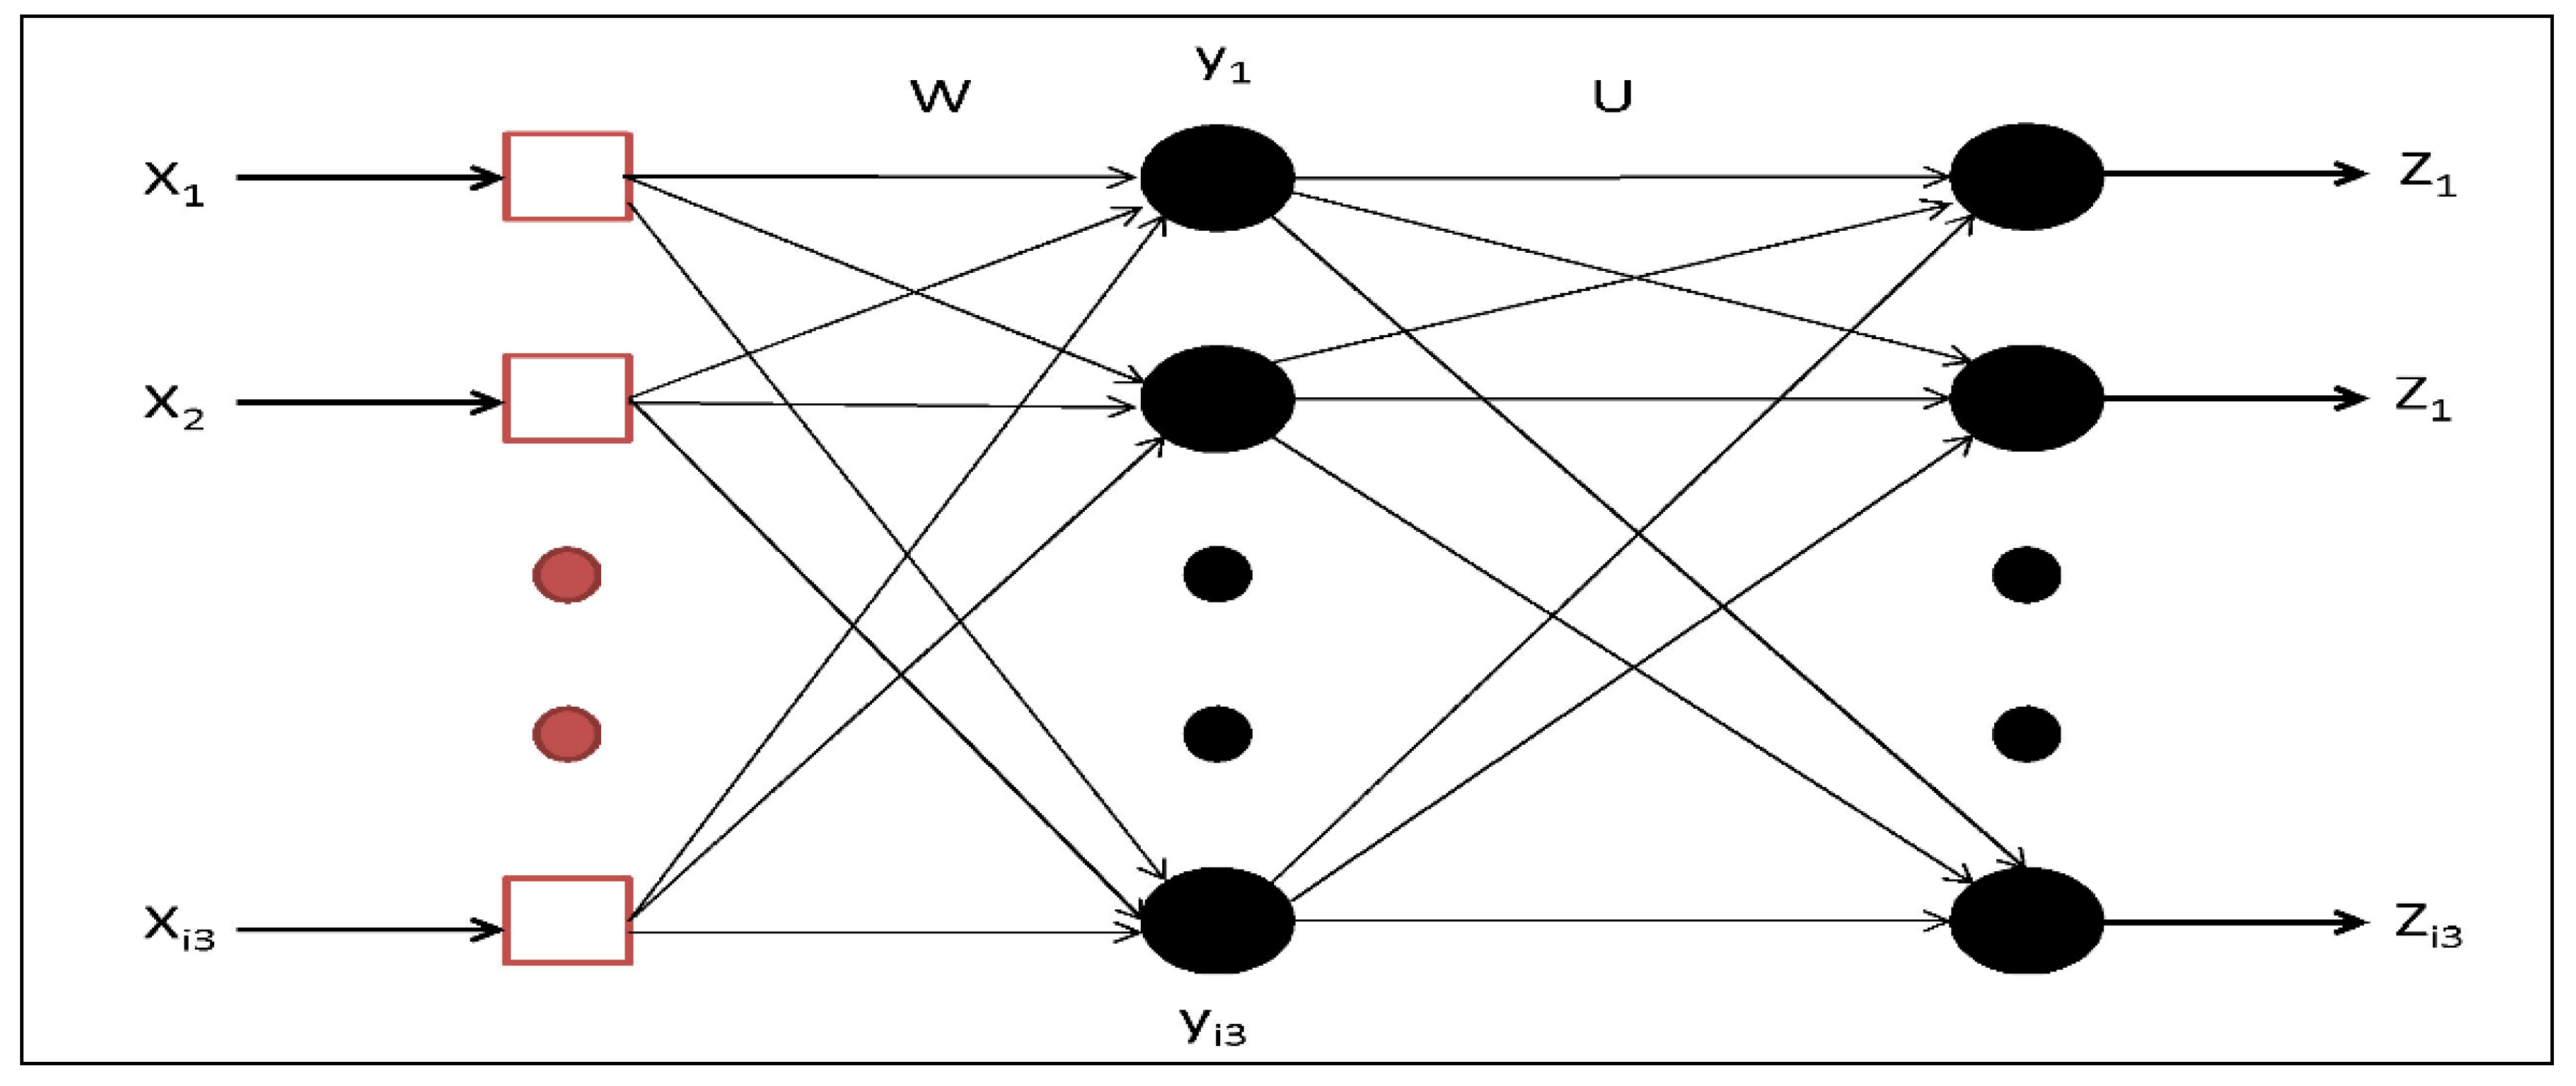
Figure 1. MLP with one hidden layer configuration.
Agronomy 11 01551 g001
Figure 2. Building block for Residual Learning.
Agronomy 11 01551 g002
Figure 3. Proposed method for agricultural production (AGR-DL).
Agronomy 11 01551 g003
Figure 4. Apple production in China from 1980 to 2018.
Agronomy 11 01551 g004
Figure 5. Citrus production in China from 1980 to 2018.
Agronomy 11 01551 g005
Figure 6. Pears production in China from 1980 to 2018.
Agronomy 11 01551 g006
Figure 7. Grapes production in China from 1980 to 2018.
Agronomy 11 01551 g007
Figure 8. Bananas production in China from 1980 to 2018.
Agronomy 11 01551 g008
Figure 9. Predicted values of different models.
Agronomy 11 01551 g009
Figure 10. AGR-production results on AGR-dataset.
Agronomy 11 01551 g010
Figure 11. Original fruit production data.
Agronomy 11 01551 g011
Figure 12. Predicted fruit production data.
Agronomy 11 01551 g012
Figure 13. Proposed method agricultural deep learning (AGR-DL) accuracy.
Agronomy 11 01551 g013
Table 1. Details of dataset.
Fruit Type Training DataPredicted DataProduction (10,000 tons)
Apples 1980–20182019–20504131.4
Bananas1980–20182019–20503556.3
Citrus1980–20182019–20501798.8
Pears1980–20182019–20501353.6
Grapes1980–20182019–20501150.40
Table 2. Comparative analysis.
StudyPredicted DatasetRecallAccuracyF-MeasurePrecision
[53]1980–2030X51.26 ± 1XX
AGR-DL1980–205097.34 ± 2%96.42 ± 2%96.43 ± 2%95.56 ± 2%
Table 3. Predicted outcomes.
ModelsPredicted DataRecallAccuracyF-MeasurePrecision (%)
SP1980–205089.2588.2888.2987.65 ± 2%
LR1980–205090.1489.5689.5788.96 ± 2%
SVM1980–205092.3791.2391.2490.37 ± 2%
AdaBoost1980–205093.3692.2192.2591.23 ± 2%
MLP1980–205096.3995.1395.1494.12 ± 2%
AGR-DL1980–205097.3496.4296.4395.56 ± 2%
Publisher’s Note: MDPI stays neutral with regard to jurisdictional claims in published maps and institutional affiliations.