
Climate Variability and Change Affect Crops Yield under Rainfed Conditions: A Case Study in Gedaref State, Sudan

 ,
, 
Abstract
:1. Introduction
2. Methodology
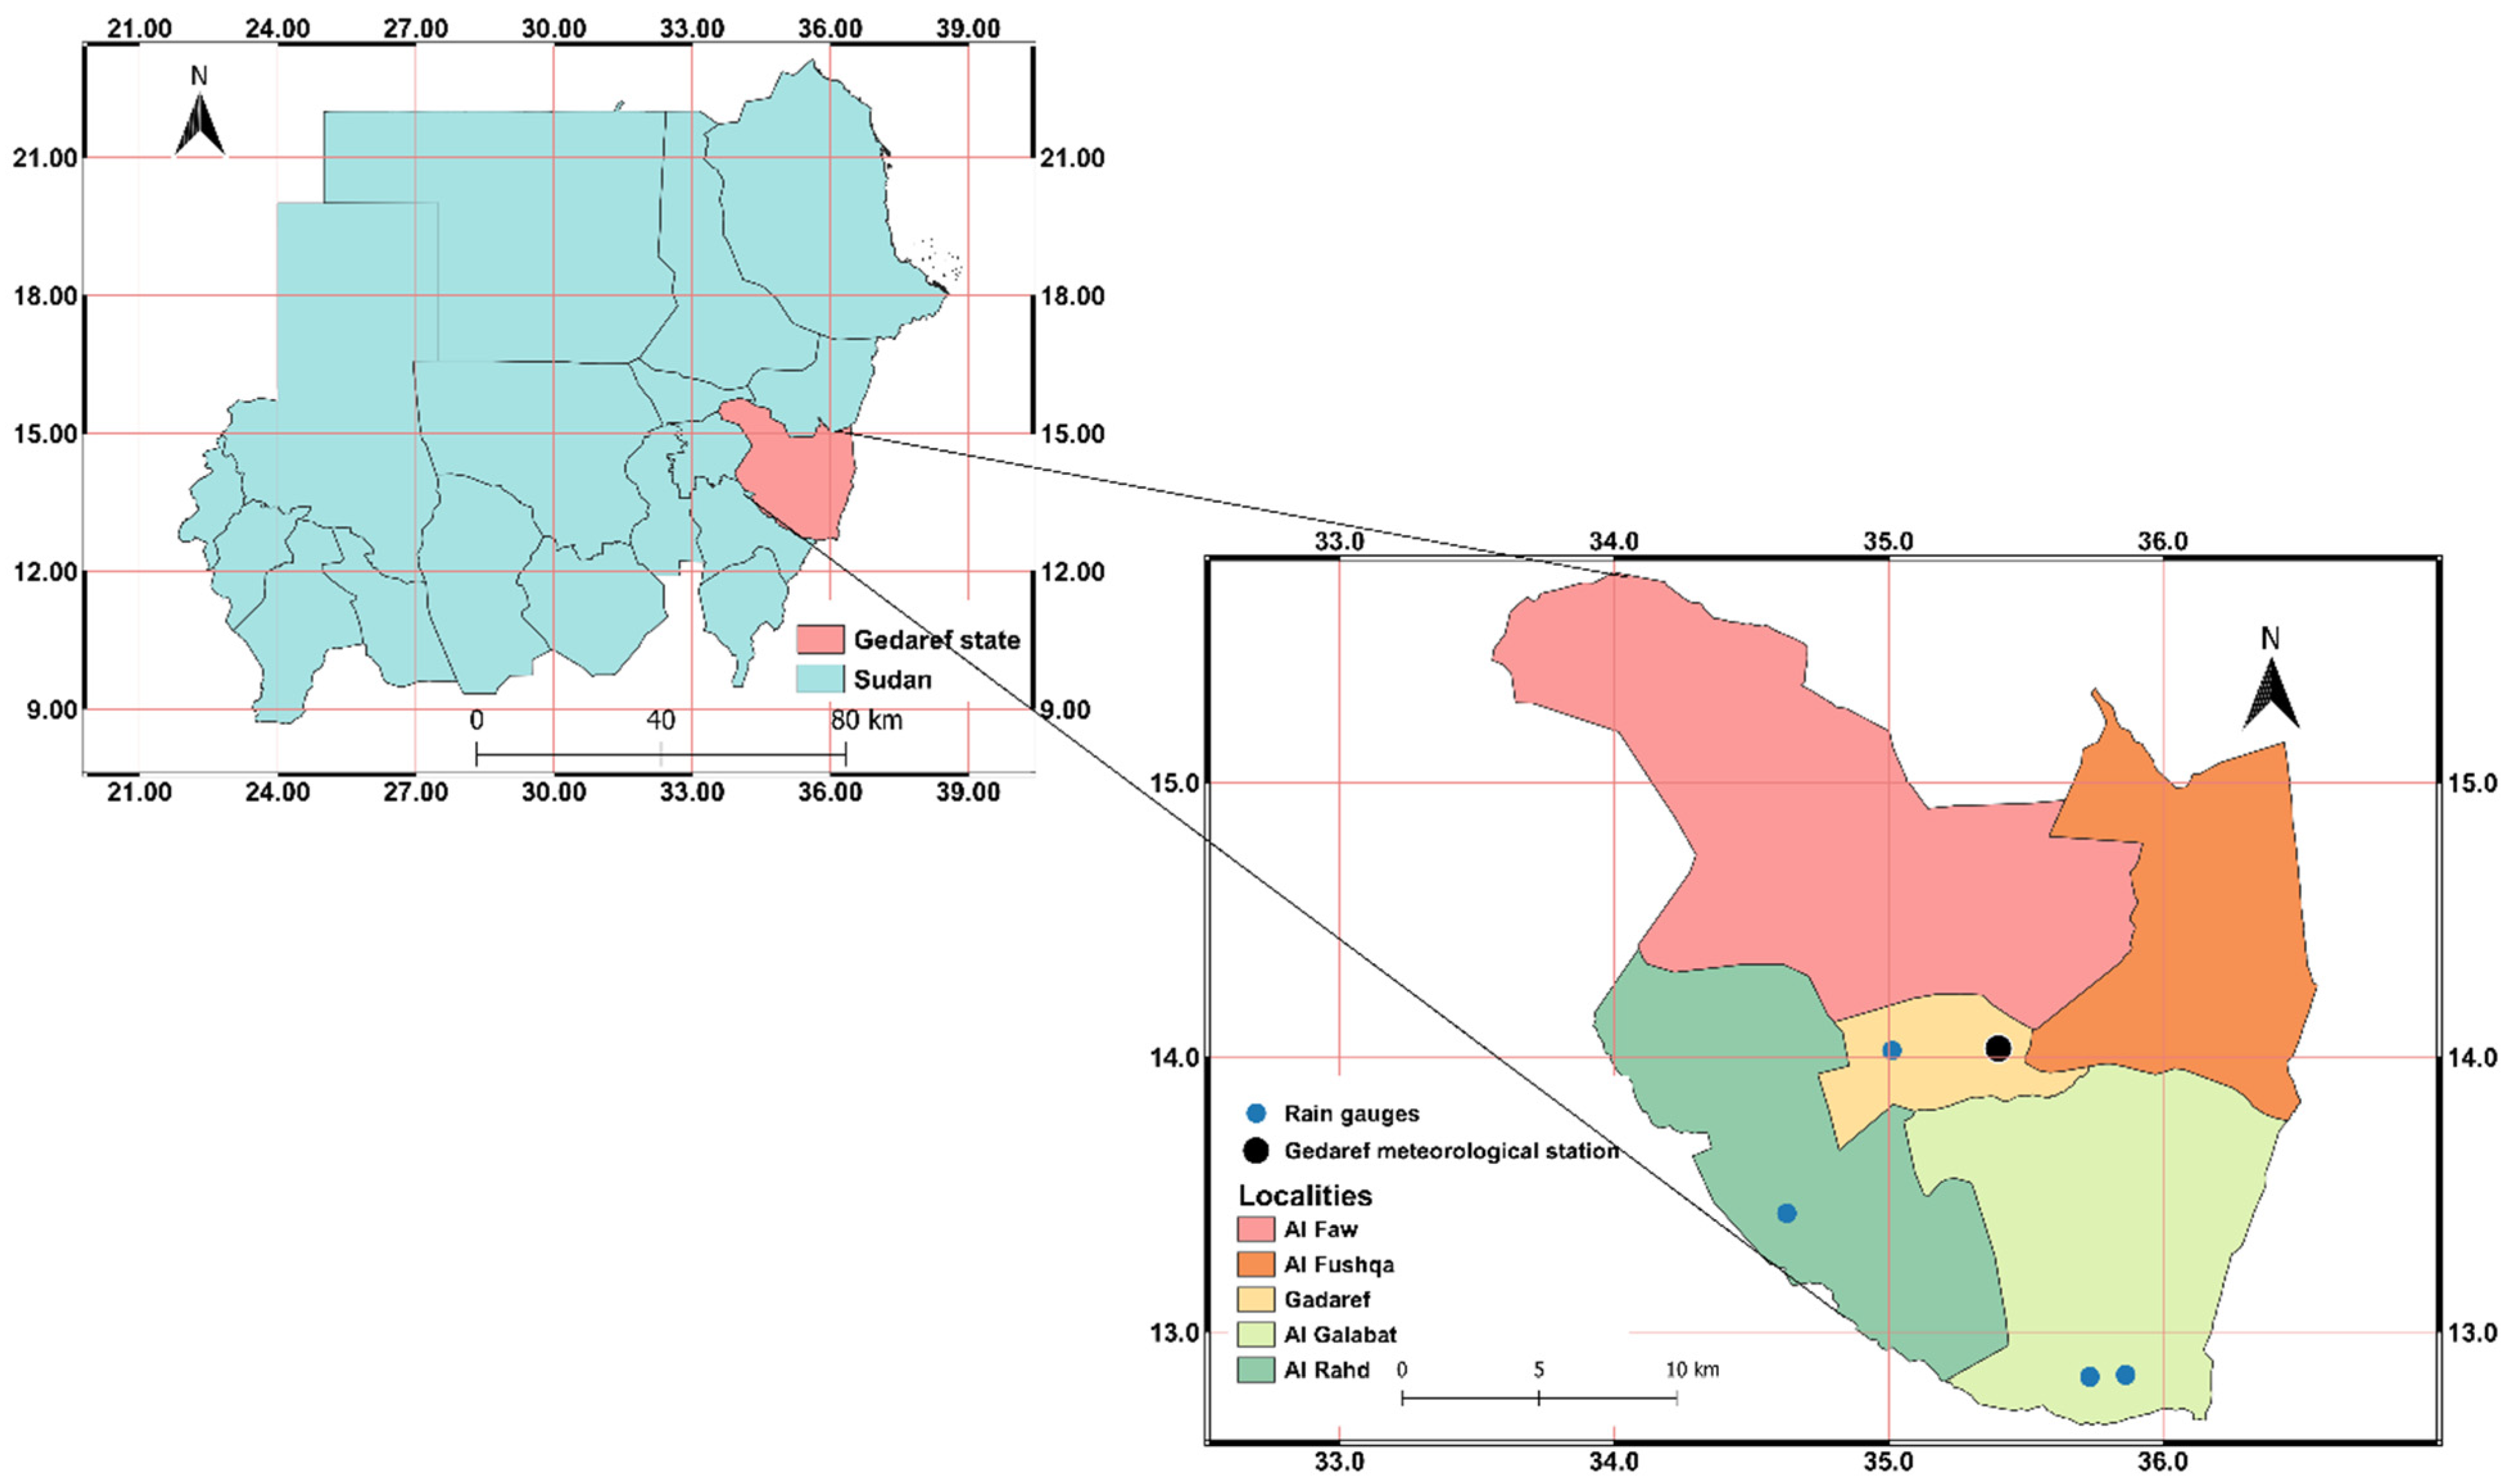
2.1. Study Area
2.2. Secondary Data Collection
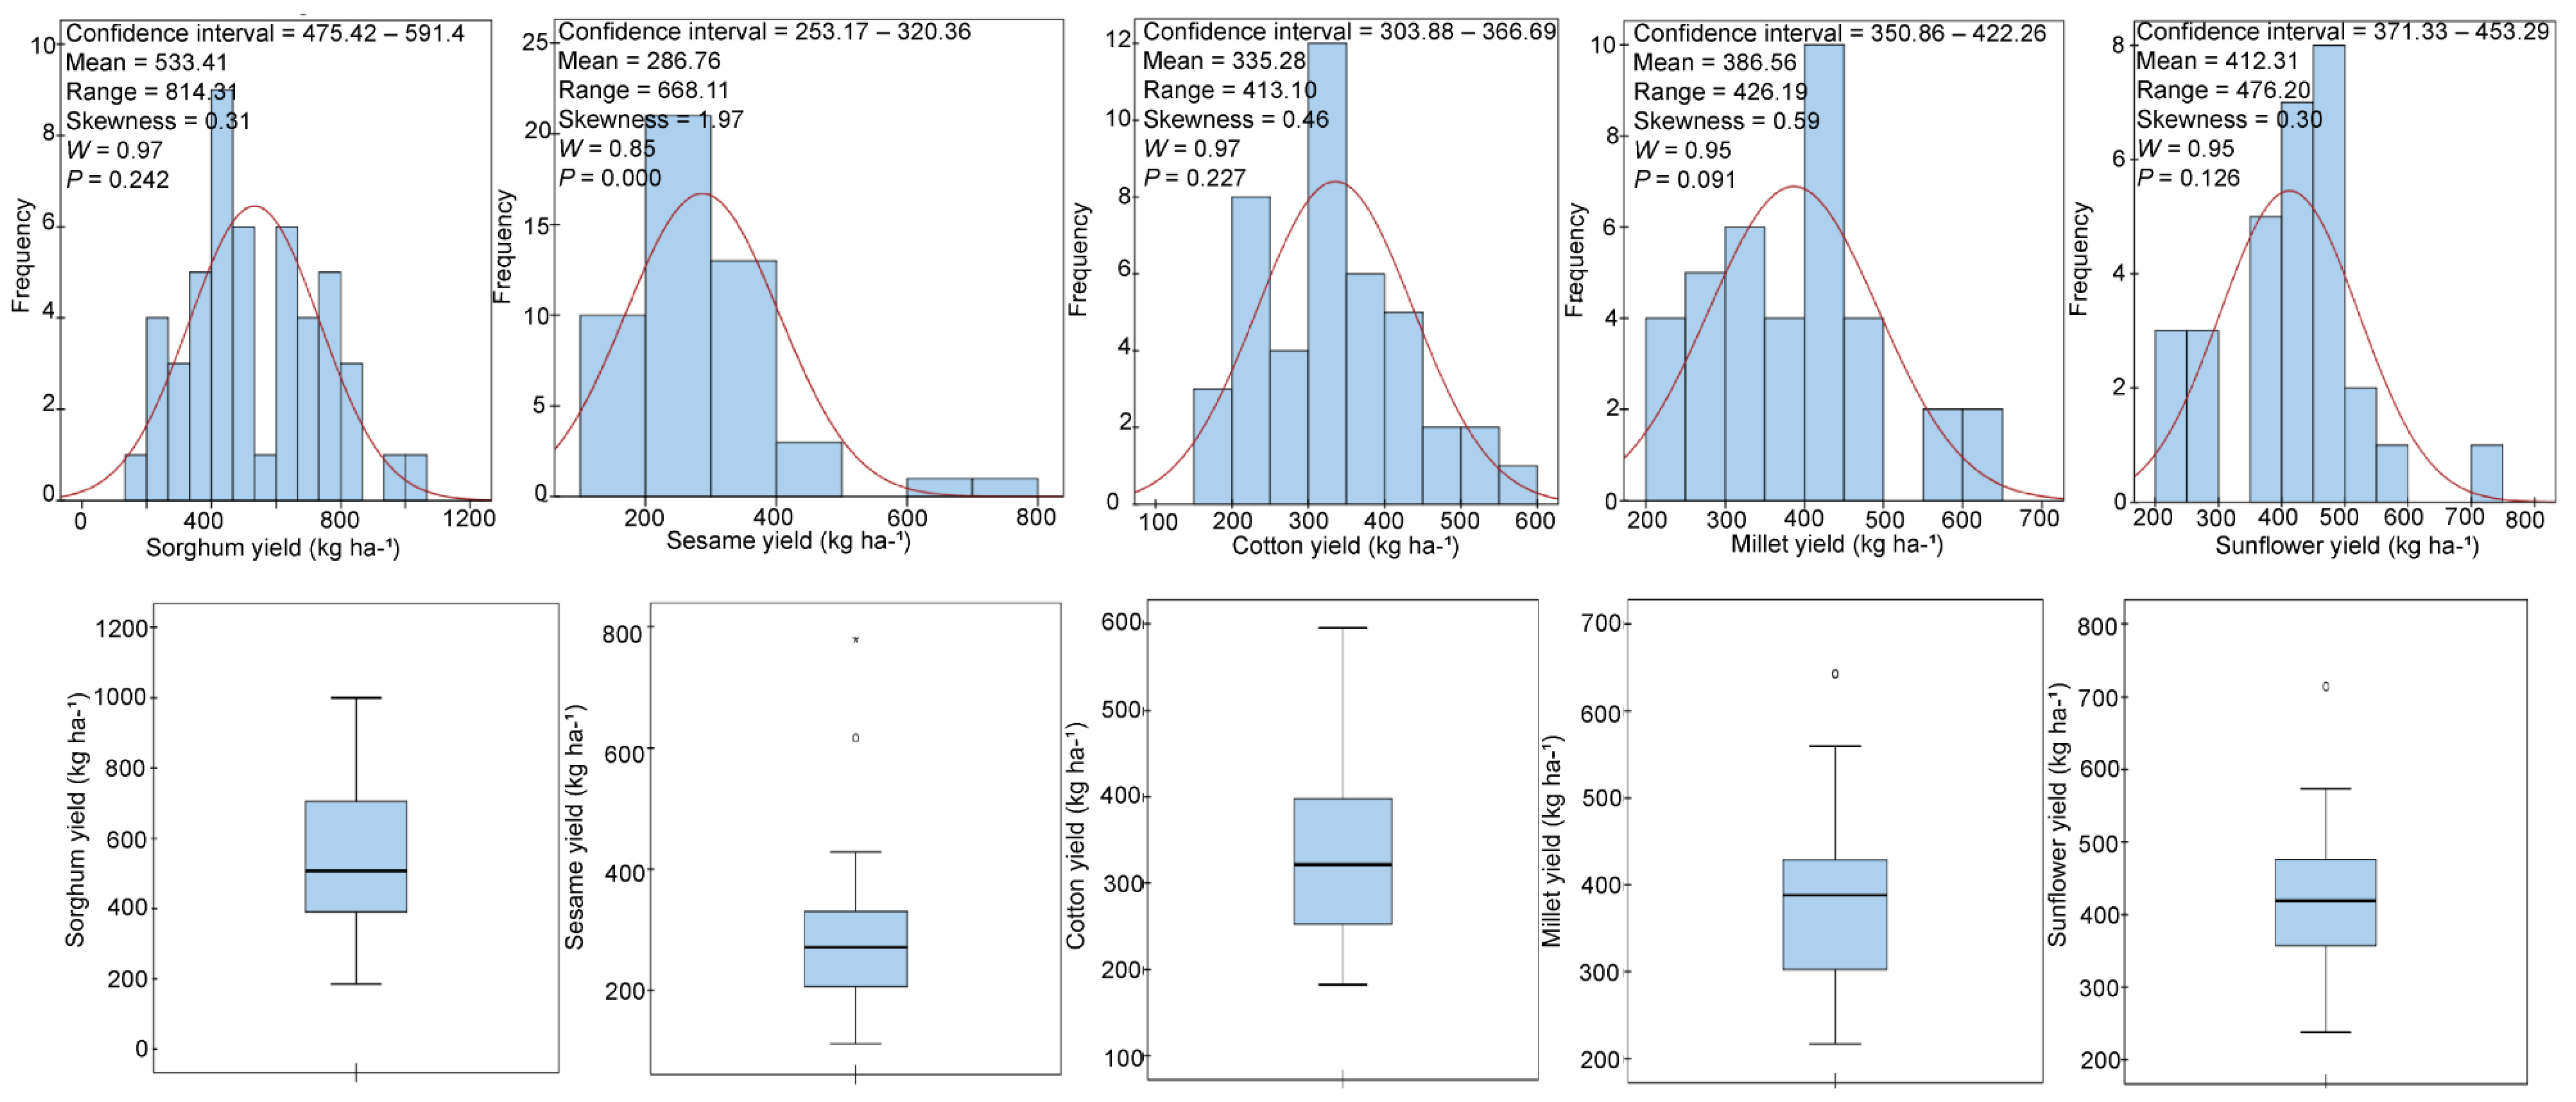
2.3. Data Quality Assessment
2.4. Data Analysis
2.4.1. Trend Analysis
2.4.2. Temperature and Rainfall Variability Analysis
2.4.3. Rain Season Characteristics
2.4.4. Analysis of Relationships between the Climate Variables and Crop Yield
2.4.5. Validation
3. Results
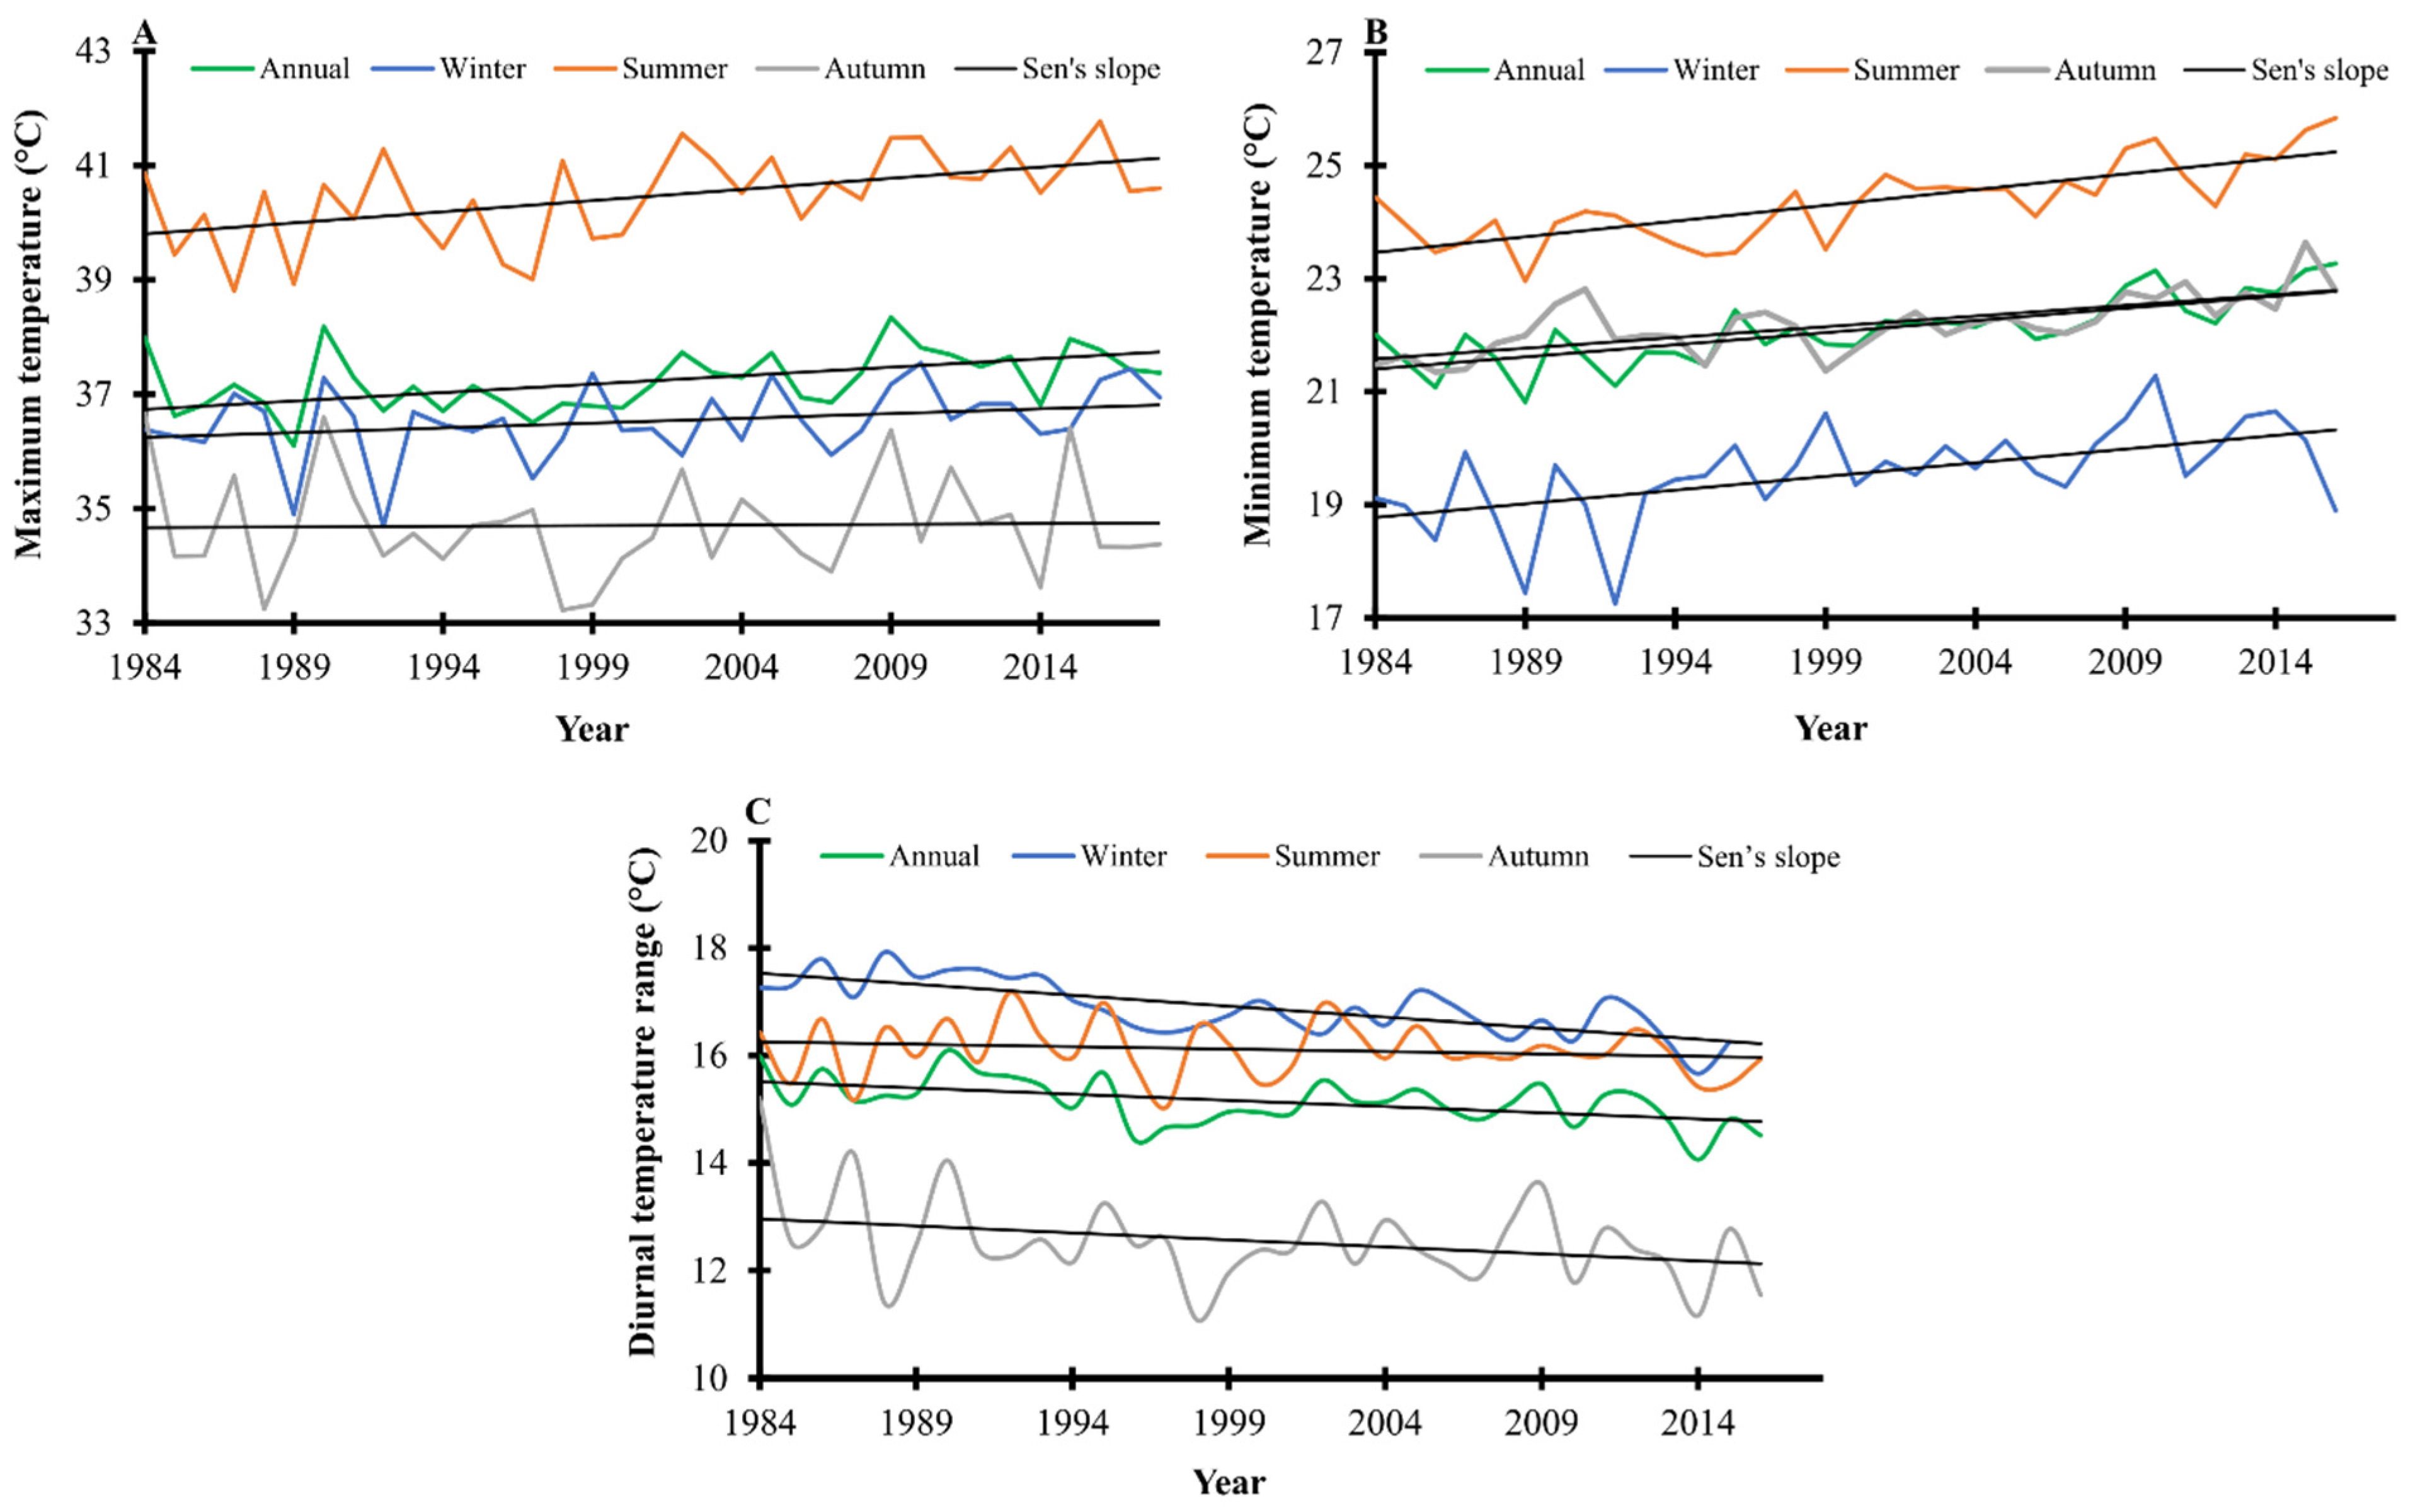
3.1. Estimation of Annual and Seasonal Temperature Trends in Gedaref State
3.2. Determination of Annual Rainfall Trends in Gedaref State
3.3. Assessment of Annual Crop Yield Trends in Gedaref State
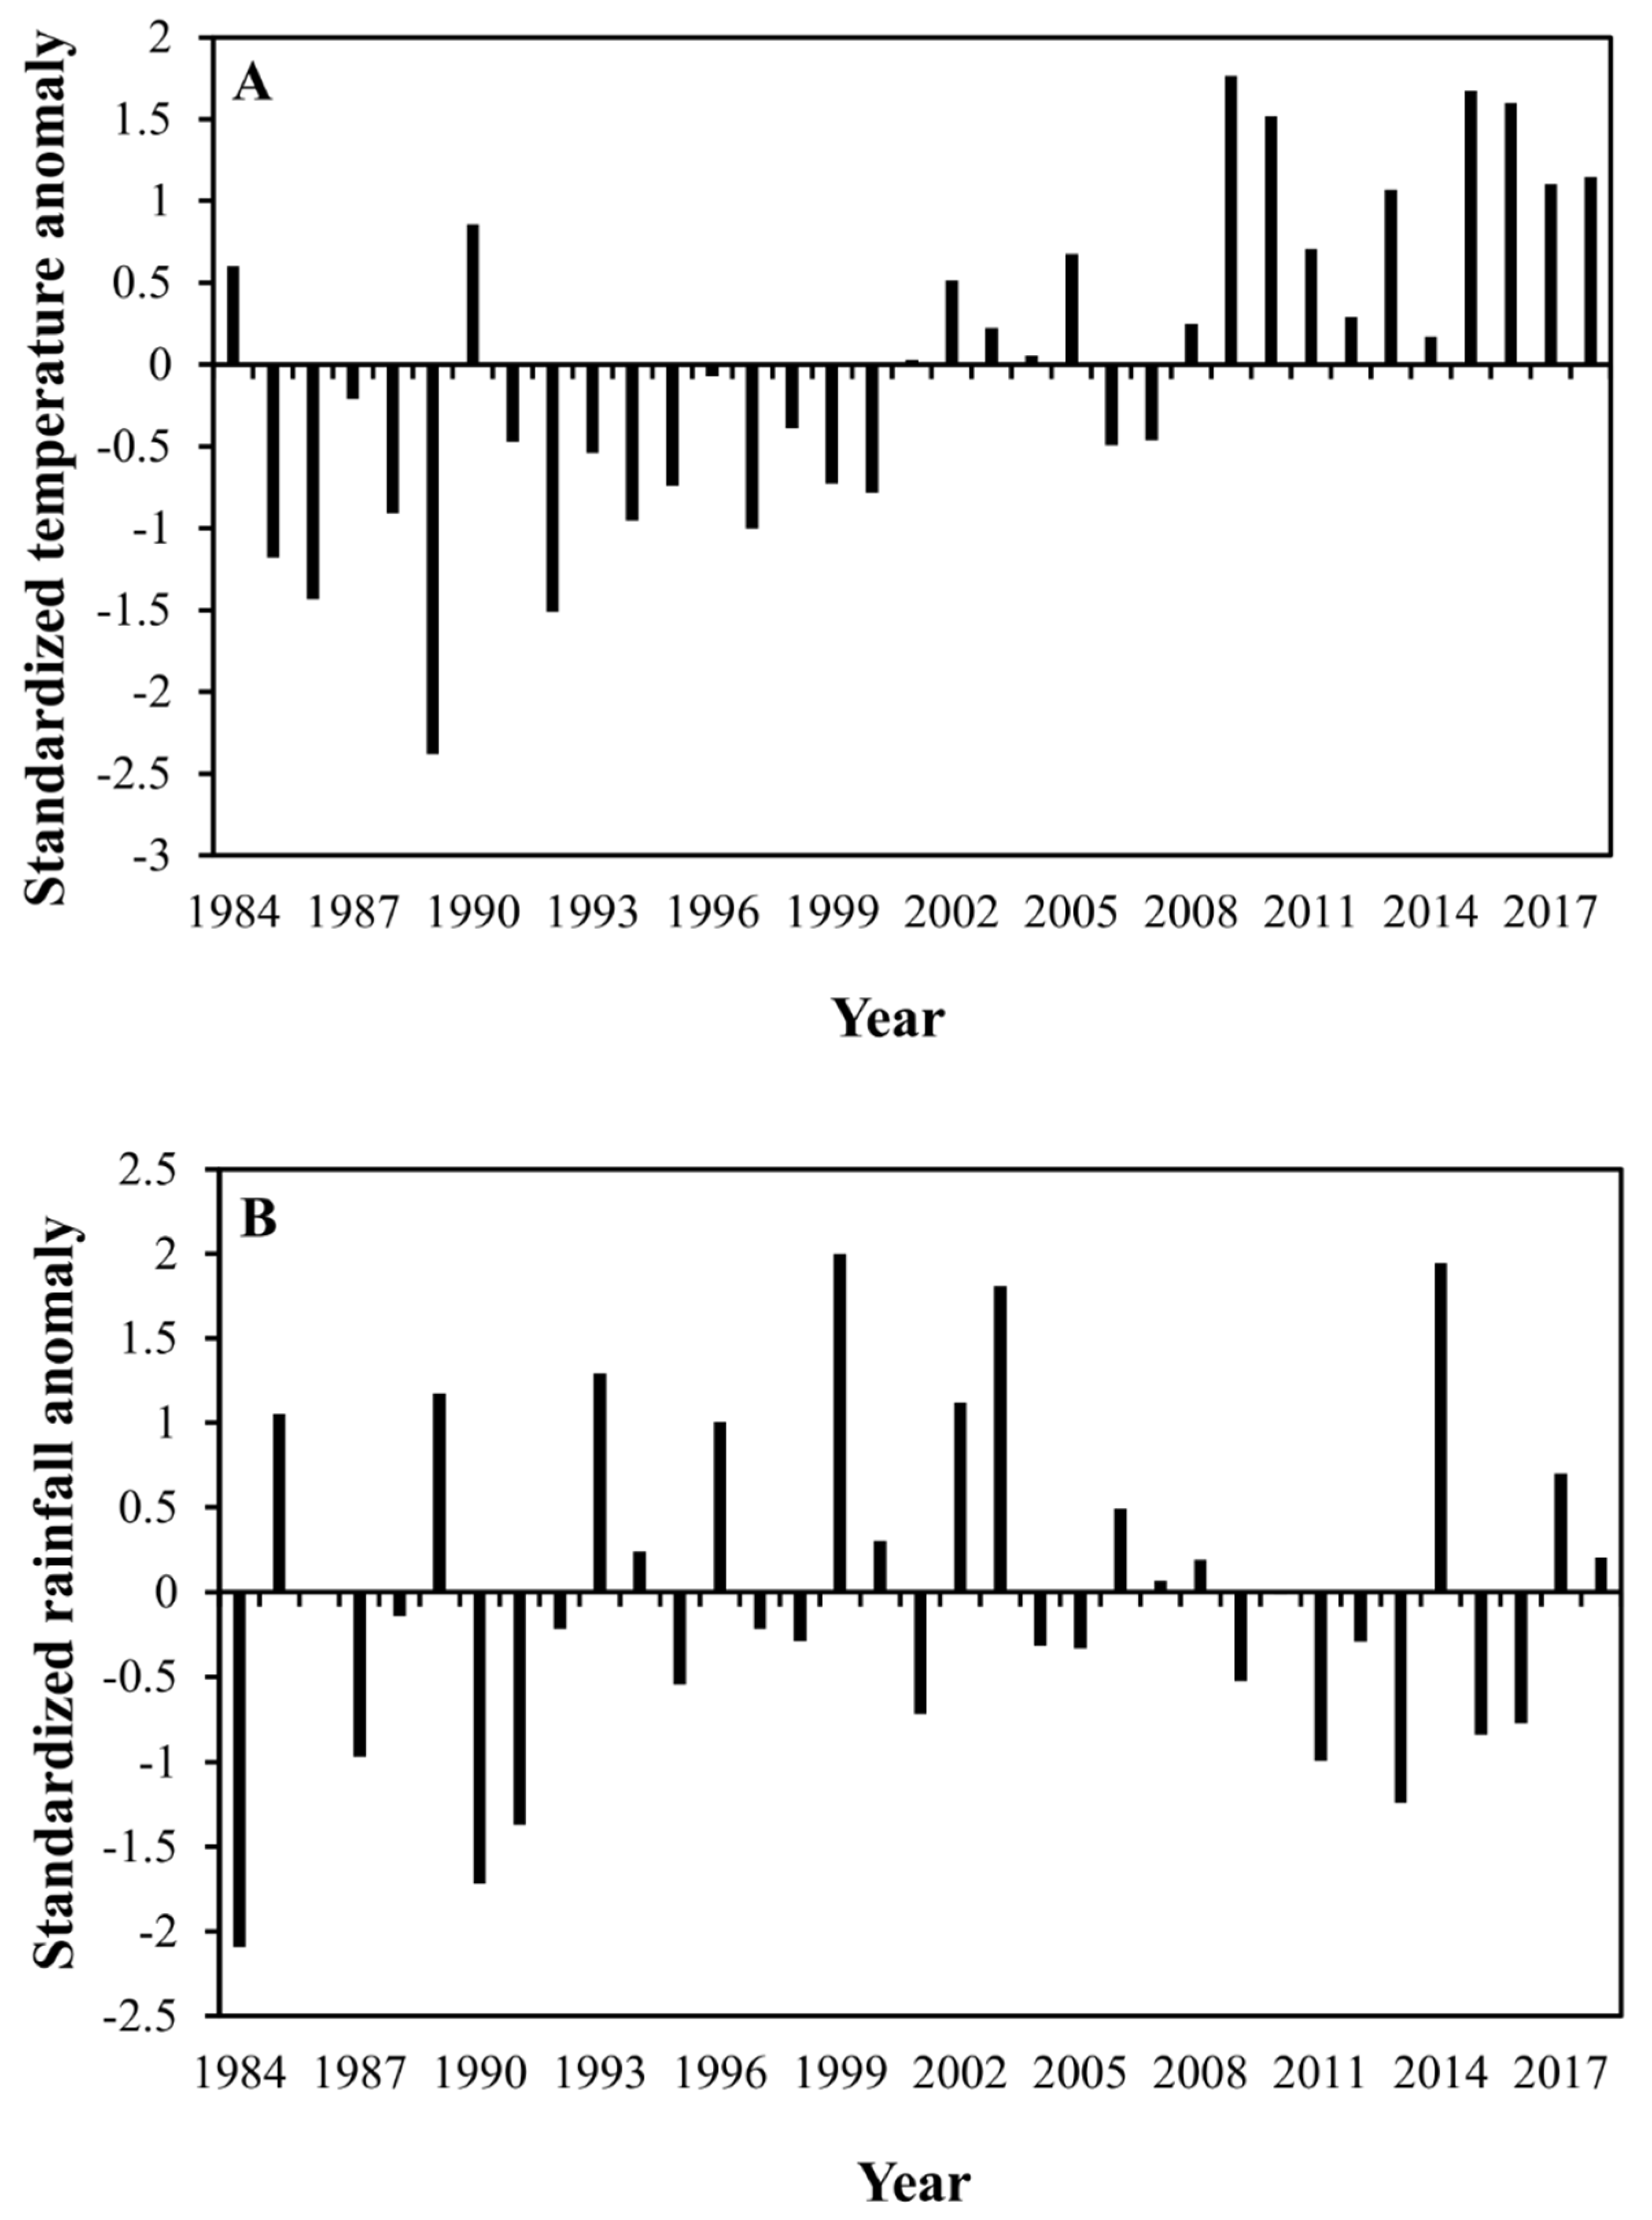
3.4. Estimation of Temperature and Rainfall Variability Indices
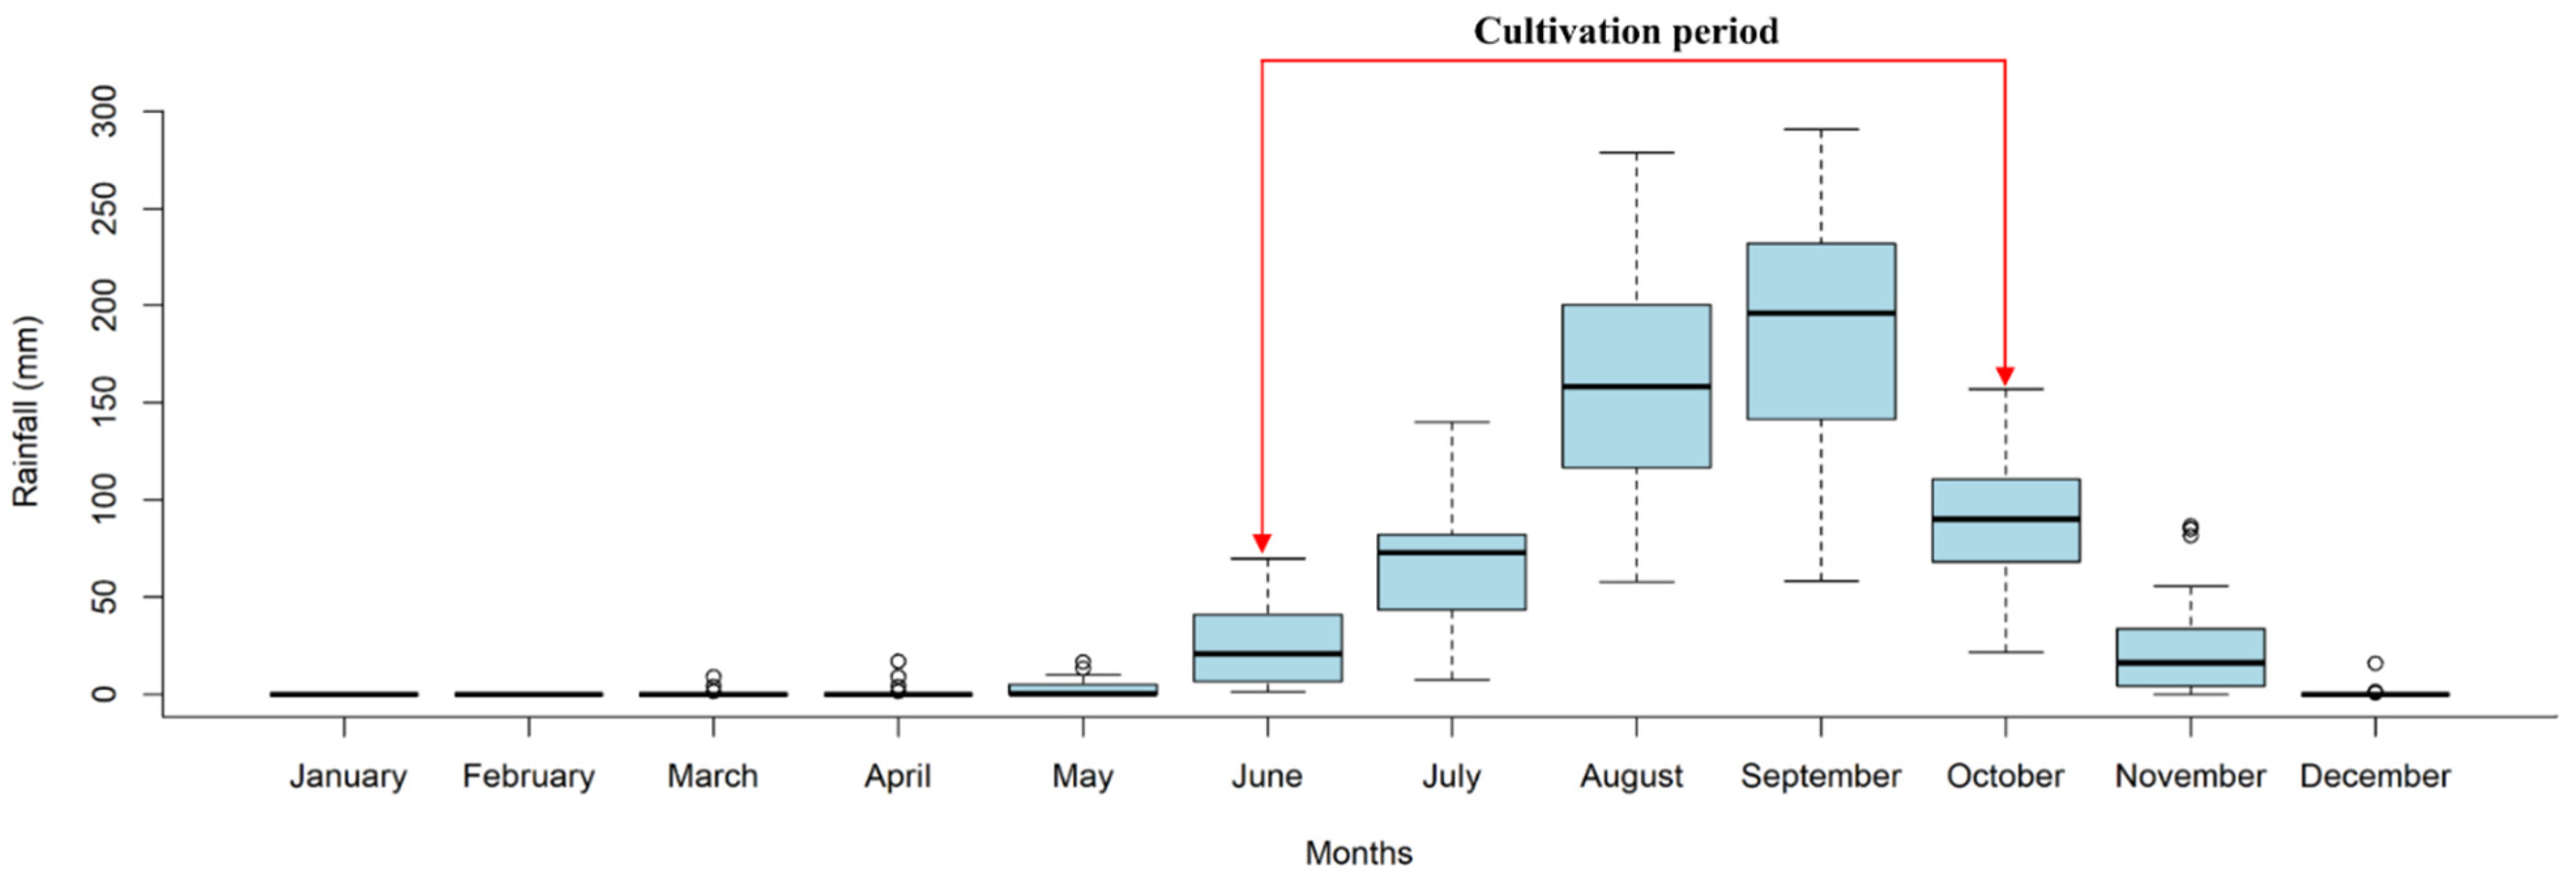
3.5. Characteristics of Rainy Seasons in Gedaref State
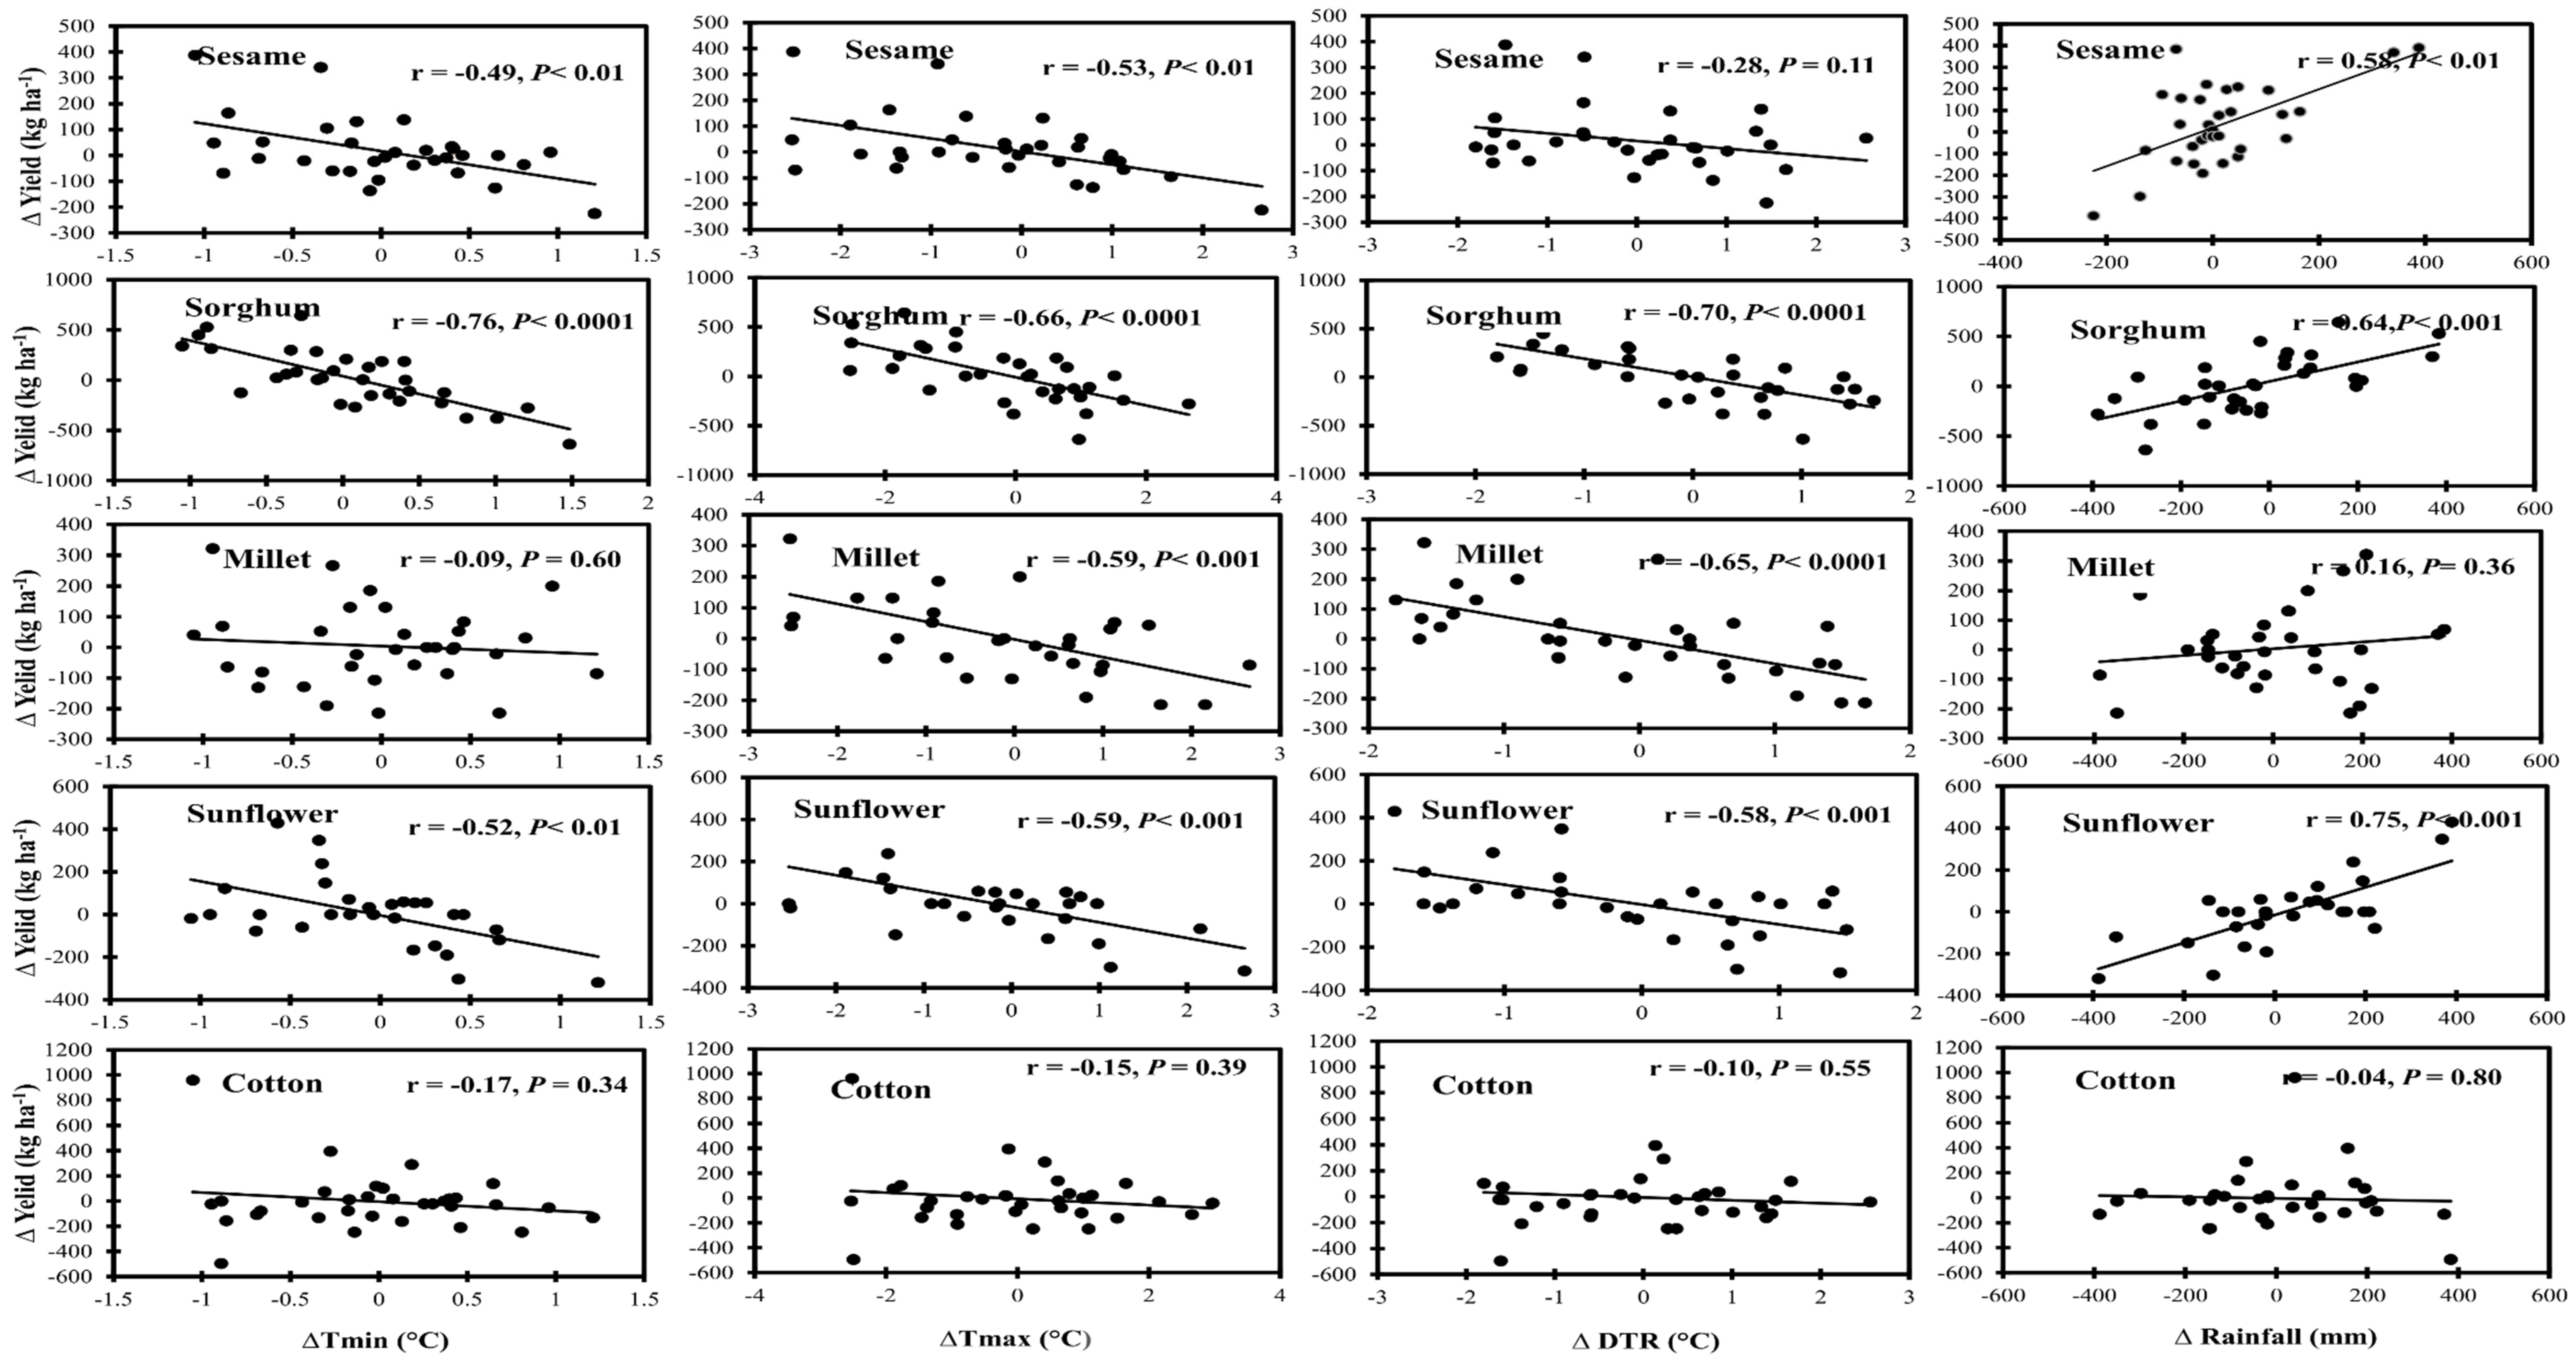
3.6. Assessment of the Relationship between Climatic Variables and Crop Yield in Gedaref State
4. Discussion
5. Conclusions
Author Contributions
Funding
Data Availability Statement
Acknowledgments
Conflicts of Interest
Appendix A

Appendix B
References
- Intergovernmental Panel on Climate Change (IPCC). Climate Change 2014: Impacts, Adaptation, and Vulnerability. Part B: Regional Aspects; Cambridge University Press: Cambridge, UK, 2014; p. 688.
- Déqué, M.; Calmanti, S.; Christensen, O.B.; Aquila, A.D.; Maule, C.F.; Haensler, A.; Nikulin, G.; Teichmann, C. A multi-model climate response over tropical Africa at + 2 °C. Clim. Serv. 2017, 7, 87–95. [Google Scholar] [CrossRef] [Green Version]
- Almazroui, M.; Saeed, F.; Saeed, S.; Islam, M.N.; Ismail, M.; Klutse, N.A.B.; Siddiqui, M.H. Projected change in temperature and precipitation over Africa from CMIP6. Earth. Syst. Environ. 2020, 4, 455–475. [Google Scholar] [CrossRef]
- Kangalawe, R.Y.; Lyimo, J.G. Climate change, adaptive strategies and rural livelihoods in semiarid Tanzania. Nat. Resour. 2013, 4, 266–278. [Google Scholar] [CrossRef] [Green Version]
- Raza, A.; Razzaq, A.; Mehmood, S.S.; Zou, X.; Zhang, X.; Lv, Y.; Xu, J. Impact of climate change on crops adaptation and strategies to tackle its outcome: A review. Plants 2019, 8, 34. [Google Scholar] [CrossRef] [PubMed] [Green Version]
- Lemi, T.; Hailu, F. Effects of climate change variability on agricultural productivity. Int. J. Environ. Sci. Nat. Res. 2019, 17, 555953. [Google Scholar] [CrossRef]
- Duku, C.; Zwart, S.J.; Hein, L. Impacts of climate change on cropping patterns in a tropical, sub-humid watershed. PLoS ONE 2018, 13, e0192642. [Google Scholar] [CrossRef] [PubMed] [Green Version]
- You, L.; Ringler, C.; Wood-Sichra, U.; Robertson, R.; Wood, S.; Zhu, T.; Nelson, G.; Guo, Z.; Sun, Y. What is the irrigation potential for Africa? A combined biophysical and socioeconomic approach. Food Policy 2011, 36, 770–782. [Google Scholar] [CrossRef] [Green Version]
- Sawa, B.; Adebayo, A. Effects of pentad dry spells on the yield of some crops in the semi-arid eco-climatic region of northern Nigeria. Zaria Geogr. 2018, 19, 49–60. [Google Scholar]
- Mertz, O.; Halsnæs, K.; Olesen, J.E.; Rasmussen, K. Adaptation to climate change in developing countries. Environ. Manag. 2009, 43, 743–752. [Google Scholar] [CrossRef] [Green Version]
- Lawson, E.T.; Alare, R.S.; Salifu, A.R.Z.; Thompson-Hall, M. Dealing with climate change in semi-arid Ghana: Understanding intersectional perceptions and adaptation strategies of women farmers. GeoJournal 2020, 85, 439–452. [Google Scholar] [CrossRef] [Green Version]
- Eltohami, A. Anthropogenic and Climatic Factors: As Causes of Drought Disaster in Sudan. 2nd World Irrigation Forum (WIF2) 2016. Available online: https://www.icid.org/wif2_full_papers/wif2_w.2.2.11.pdf (accessed on 6 June 2021).
- Elhag, K.; Zhang, W. Monitoring and assessment of drought focused on its impact on sorghum yield over Sudan by using meteorological drought indices for the period 2001–2011. Remote Sens. 2018, 10, 1231. [Google Scholar] [CrossRef] [Green Version]
- Opere, A. Floods in Kenya. In Kenya: A Natural Outlook: Geo-Environmental Resources and Hazards; Paron, P., Olago, D.O., Omuto, C.T., Eds.; Elsevier: Amsterdam, The Netherlands, 2013; Volume 16, pp. 315–330. [Google Scholar] [CrossRef]
- FAO. Plan of Action (2015–2019): Resilient Livelihoods for Sustainable Agriculture, Food Security and Nutrition; FAO: Rome, Italy, 2015. Available online: http://www.fao.org/faolex/results/details/en/c/LEX-FAOC201507/ (accessed on 6 June 2021).
- Siddig, K.; Stepanyan, D.; Wiebelt, M.; Grethe, H.; Zhu, T. Climate change and agriculture in the Sudan: Impact pathways beyond changes in mean rainfall and temperature. Ecol. Econ. 2020, 169, 106566. [Google Scholar] [CrossRef] [Green Version]
- Mahgoub, F. Current Status of Agriculture and Future Challenges in Sudan; Nordiska Afrikainstitutet: Uppsala, Sweden, 2014; p. 98. Available online: http://urn.kb.se/resolve?urn=urn%3Anbn%3Ase%3Anai%3Adiva-1839 (accessed on 6 June 2021).
- Mohmmed, A.; Li, J.; Elaru, J.; Elbashier, M.M.; Keesstra, S.; Artemi, C.; Martin, K.; Reuben, M.; Teffera, Z.; Teffera, Z. Assessing drought vulnerability and adaptation among farmers in Gadaref region, Eastern Sudan. Land Use Policy 2018, 70, 402–413. [Google Scholar] [CrossRef] [Green Version]
- Ali, A.B.; Elshaikh, N.A.; Hong, L.; Adam, A.; Haofang, Y. Conservation tillage as an approach to enhance crops water use efficiency. Acta Agric. Scand. B Soil Plant Sci. 2017, 67, 252–262. [Google Scholar] [CrossRef]
- Murenzi, H. Investigating the Effect of Climate Variability Maize Yield in Rwanda. Master Dissertation, Department of Meteorology, School of Physical Sciences, University of Nairobi, Nairobi, Kenya, 2018. Available online: https://ccafs.cgiar.org/resources/publications/investigating-effect-climate-variability-maize-yield-rwanda (accessed on 6 June 2021).
- Hasan, M.; Kumar, L. Yield trends and variabilities explained by climatic change in coastal and non-coastal areas of Bangladesh. Sci. Total Environ. 2021, 795, 148814. [Google Scholar] [CrossRef] [PubMed]
- Glover, E.K.; Elsiddig, E.A. The causes and consequences of environmental changes in Gedaref, Sudan. Land Degrad. Dev. 2012, 23, 339–349. [Google Scholar] [CrossRef]
- Idreas, A.E.L.A. Effect of Mechanized Rain Fed Farming on Vegetation Cover and Effect of Shelter Belts on Environment at Ghadambaliya Area Gedaref State (SUDAN). Doctoral Dissertation, Sudan University of Science and Technology, Khartoum, Sudan, 2015. Available online: http://repository.sustech.edu/handle/123456789/13520 (accessed on 1 June 2021).
- Yagoub, Y.E.; Li, Z.; Musa, O.S.; Anjum, M.N.; Wang, F.; Xu, C.; Bo, Z. Investigation of vegetation cover change in Sudan by using modis data. J. Geogr. Inf. Syst. 2017, 9, 279. [Google Scholar] [CrossRef] [Green Version]
- Elagib, N.A.; Khalifa, M.; Rahma, A.E.; Babker, Z.; Gamaledin, S.I. Performance of major mechanized rainfed agricultural production in Sudan: Sorghum vulnerability and resilience to climate since 1970. Agric. For. Meteorol. 2019, 276, 107640. [Google Scholar] [CrossRef]
- Klayman, D. Statistical and Graphical Procedures for Evaluating Data Quality: The Case of Large-Scale Data Collection and Monitoring System. J. Appl. Sociol. 2002, 19, 22–34. [Google Scholar]
- Mann, H.B. Nonparametric tests against trend. Econometrica 1945, 13, 245–259. Available online: https://www.jstor.org/stable/1907187 (accessed on 5 May 2021). [CrossRef]
- Kendall, M.G. Rank Correlation Methods; Charles Griffin: London, UK, 1948. [Google Scholar]
- Sen, P.K. Estimates of the regression coefficient based on Kendall’s tau. J. Am. Stat. Assoc. 1968, 63, 1379–1389. [Google Scholar] [CrossRef]
- Koudahe, K.; Kayode, A.J.; Samson, A.O.; Adebola, A.A.; Djaman, K. Trend analysis in standardized precipitation index and standardized anomaly index in the context of climate change in Southern Togo. Atmos. Clim. Sci. 2017, 7, 401–423. [Google Scholar] [CrossRef] [Green Version]
- Stern, R.; Parsons, D.; Stern, D.; Torgbor, F. R Instat. 2020. Available online: http://r-instat.org/ (accessed on 6 June 2021).
- Ngetich, K.F.; Mucheru-Muna, M.; Mugwe, J.N.; Shisanya, C.A.; Diels, J.; Mugendi, D.N. Length of growing season, rainfall temporal distribution, onset and cessation dates in the Kenyan highlands. Agric. For. Meteorol. 2014, 188, 24–32. [Google Scholar] [CrossRef]
- Ntirenganya, F. Analysis of rainfall variability in Rwanda for small-scale farmers coping strategies to climate variability. East. Afri. J. Sci. Techn. 2018, 8, 75–96. [Google Scholar]
- Ojara, M.A.; Lou, Y.; Aribo, L.; Namumbya, S.; Uddin, M.J. Dry spells and probability of rainfall occurrence for Lake Kyoga Basin in Uganda, East Africa. Nat. Hazards 2020, 100, 493–514. [Google Scholar] [CrossRef]
- Sibanda, S.; Grab, S.W.; Ahmed, F. Long-term rainfall characteristics in the Mzingwane catchment of south-western Zimbabwe. Theor. Appl. Climatol. 2020, 139, 935–948. [Google Scholar] [CrossRef]
- Tadross, M.A.; Hewitson, B.C.; Usman, M.T. The interannual variability of the onset of the maize growing season over South Africa and Zimbabwe. J. Clim. 2005, 18, 3356–3372. [Google Scholar] [CrossRef]
- Moyo, M.; Dorward, P.; Craufurd, P. Characterizing long term rainfall data for estimating climate risk in semi-arid Zimbabwe. In Climate Change Adaptation in Africa; Leal Filho, W., Belay, S., Kalangu, J., Menas, W., Munishi, P., Musiyiwa, K., Eds.; Springer International Publishing: New York, NY, USA, 2017; pp. 661–675. [Google Scholar] [CrossRef]
- Setiawan, B.I. A simple method to determine patterns of wet and dry seasons. IOP Conf. Ser. Earth Environ. Sci. 2020, 542, 012055. [Google Scholar] [CrossRef]
- Laux, P.; Jäckel, G.; Tingem, M.R.; Kunstmann, H. Onset of the rainy season and crop yield in West Africa. In Proceedings of the EGU General Assembly Conference, Vienna, Austria, 19–24 April 2009; p. 11276. Available online: https://ui.adsabs.harvard.edu/abs/2009EGUGA..1111276L/abstract (accessed on 3 August 2021).
- Nicholls, N. Increased Australian wheat yield due to recent climate trends. Nature 1997, 387, 484–485. [Google Scholar] [CrossRef]
- Hoogenboom, G.; Porter, C.H.; Boote, K.J.; Shelia, V.; Wilkens, P.W.; Singh, U.; White, J.W.; Asseng, S.; Lizaso, J.I.; Moreno, L.P.; et al. The DSSAT crop modeling ecosystem. In Advances in Crop Modeling for a Sustainable Agriculture; Boote, K.J., Ed.; Burleigh Dodds Science Publishing: Cambridge, UK, 2019; pp. 173–216. [Google Scholar] [CrossRef]
- Ding, Z.; Ali, E.F.; Elmahdy, A.M.; Ragab, K.E.; Seleiman, M.F.; Kheir, A.M.S. Modeling the combined impacts of deficit irrigation, rising temperature and compost application on wheat yield and water productivity. Agric. Water Manag. 2021, 244, 106626. [Google Scholar] [CrossRef]
- Lobell, D.B.; Field, C.B. Global scale climate–crop yield relationships and the impacts of recent warming. Environ. Res. Lett. 2007, 2, 014002. [Google Scholar] [CrossRef]
- Peltonen-Sainio, P.; Jauhiainen, L.; Trnka, M.; Olesen, J.E.; Calanca, P.; Eckersten, H.; Eitzinger, J.; Gobin, A.; Kersebaum, K.C.; Kozyra, J.; et al. Coincidence of variation in yield and climate in Europe. Agric. Ecosyst. Environ. 2010, 139, 483–489. [Google Scholar] [CrossRef]
- El-Maayar, M.; Lange, M.A. A methodology to infer crop yield response to climate variability and change using long-term observations. Atmosphere 2013, 4, 365–382. [Google Scholar] [CrossRef] [Green Version]
- Zhang, Z.; Liu, X.; Wang, P.; Shuai, J.; Chen, Y.; Song, X.; Tao, F. The heat deficit index depicts the responses of rice yield to climate change in the northeastern three provinces of China. Reg. Environ. Chang. 2014, 14, 27–38. [Google Scholar] [CrossRef]
- Poudel, S.; Shaw, R. The relationships between climate variability and crop yield in a mountainous environment: A case study in Lamjung district, Nepal. Climate 2016, 4, 13. [Google Scholar] [CrossRef] [Green Version]
- Loh, P.S.; Alnoor, H.I.M.; He, S. Impact of climate change on vegetation cover at south Port Sudan area. Climate 2020, 8, 114. [Google Scholar] [CrossRef]
- Bannayan, M.; Asadi, S.; Nouri, M.; Yaghoubi, F. Time trend analysis of someagroclimatic variables during the last half century over Iran. Theor. Appl. Climatol. 2020, 140, 839–857. [Google Scholar] [CrossRef]
- Elagib, N.A. Trends in intra-and inter-annual temperature variabilities across Sudan. Ambio 2010, 39, 413–429. [Google Scholar] [CrossRef] [Green Version]
- Platts, P.J.; Omeny, P.; Marchant, R. AFRICLIM: High-resolution climate projections for ecological applications in Africa. Afr. J. Ecol. 2015, 53, 103–108. [Google Scholar] [CrossRef] [Green Version]
- Hamid, A.A.; Eltayeb, Y.H. Space Borne Technology for Drought Monitoring in Sudan. Presentation, 2017. Available online: http://www.un-spider.org/sites/default/files/Hamid.pdf (accessed on 6 June 2021).
- Tadele, Z. Drought Adaptation in Millets. In Abiotic and Biotic Stress in Plants: Recent Advances and Future Perspectives; Shanker, A., Shanker, C., Eds.; InTech: Rijeka, Croatia, 2016; pp. 639–662. [Google Scholar]
- Khalifa, E.A. Volatility of sorghum production under rainfall system in Gadarif State, Sudan. Russ. J. Agric. Socio-Econ. Sci. 2016, 56, 137–144. [Google Scholar] [CrossRef]
- Rowhani, P.; Lobell, D.B.; Linderman, M.; Ramankutty, N. Climate variability and crop production in Tanzania. Agric. For. Meteorol. 2011, 151, 449–460. [Google Scholar] [CrossRef]
- Ibrahim, A.M. The impact of rainfall on the yields of staple crops-sorghum and sesame in Sudan. J. Plant Sci. Res. 2015, 2, 1–4. [Google Scholar]
- Traore, K.; Sidibe, D.K.; Coulibaly, H.; Bayala, J. Optimizing yield of improved varieties of millet and sorghum under highly variable rainfall conditions using contour ridges in Cinzana, Mali. Agric. Food Secur. 2017, 6, 1–13. [Google Scholar] [CrossRef] [Green Version]
- Sultan, B.; Bella-Medjo, M.; Berg, A.; Quirion, P.; Janicot, S. Multi-scales and multi-sites analyses of the role of rainfall in cotton yields in West Africa. Int. J. Climatol. 2010, 30, 58–71. [Google Scholar] [CrossRef]
- Cetin, O.; Basbag, S. Effects of climatic factors on cotton production in semi-arid regions—A review. Res. Crop. 2010, 11, 785–791. [Google Scholar]
- Hammer, G.; Chapmanz, S.; Singhl, V.; Nguyenl, C.; van Oosteroml, E.; McLeang, G.; Zheng, B.; Jordan, D. Grain sorghum varietal reactions to heat stress and environment. Grains Res. Dev. Coop. 2015, 212. Available online: https://grdc.com.au/resources-and-publications/grdc-update-papers/tab-content/grdc-update-papers/2015/07/grain-sorghum-varietal-reactions-to-heat-stress-and-environment. (accessed on 3 August 2021).
- Nath, R.; Chakraborty, P.K.; Chakraborty, A. Effect of climatic variation on yield of sesame (Sesamum indicum L.) at different dates of sowing. J. Agron. Crop. Sci. 2001, 186, 97–102. [Google Scholar] [CrossRef]
- Kumazaki, T.; Yamada, Y.; Karaya, S.; Tokumitsu, T.; Hirano, T.; Yasumoto, S.; Katsuta, M.; Michiyama, H. Effects of day length and air temperature on stem growth and flowering in sesame. Plant Prod. Sci. 2008, 11, 178–183. [Google Scholar] [CrossRef]
- Öztürk, Ö.; Şaman, O. Effects of different plant densities on the yield and quality of second crop sesame. Int. J. Agric. Biol. Eng. 2012, 6, 644–649. [Google Scholar] [CrossRef]
- Ali, A.Y.A.; Guisheng, Z.; Hassan, A.; Yagoub, S.O.; Farah, G.A.; Ahamed, N.E.; Ibrahim, E.G. Sesame seed yield and growth traits response to different row spacings in semi-arid regions. Univers. J. Agric. Res. 2020, 8, 88–96. [Google Scholar] [CrossRef]
- Msongaleli, B.M.; Tumbo, S.D.; Kihupi, N.I.; Rwehumbiza, F.B. Performance of sorghum varieties under variable rainfall in central Tanzania. Int. Sch. Res. Not. 2017, 2017, 2506946. [Google Scholar] [CrossRef] [Green Version]
- Mundia, C.W.; Secchi, S.; Akamani, K.; Wang, G. A regional comparison of factors affecting global sorghum production: The case of North America, Asia and Africa’s Sahel. Sustainability 2019, 11, 2135. [Google Scholar] [CrossRef] [Green Version]
- Mijić, A.; Liović, I.; Kovačević, V.; Pepó, P. Impact of weather conditions on variability in sunflower yield over years in eastern parts of Croatia and Hungary. Acta Agron. Hung. 2012, 60, 397–405. [Google Scholar] [CrossRef]


| Parameter | Range | Sen’s Slope | 95% Confidence Interval | Coefficient of Variation (CV %) | p-Value | |
|---|---|---|---|---|---|---|
| Minimum | Maximum | |||||
| Annual Tmin | 20.817 | 23.266 | 0.045 | 0.031–0.061 | 2.65 | <0.0001 |
| Annual Tmax | 36.100 | 38.343 | 0.030 | 0.014–0.043 | 4.33 | 0.001 |
| Annual DTR | 14.064 | 16.090 | −0.023 | −0.234–0.142 | 6.82 | <0.003 |
| Winter Tmin | 17.248 | 21.283 | 0.048 | 0.025–0.070 | 4.29 | <0.001 |
| Winter Tmax | 34.687 | 37.548 | 0.017 | −0.001–0.039 | 1.74 | 0.069 |
| Winter DTR | 15.661 | 18.350 | −0.037 | −0.207–0.192 | 3.38 | <0.001 |
| Summer Tmin | 22.957 | 25.838 | 0.056 | 0.036–0.071 | 2.83 | <0.0001 |
| Summer Tmax | 38.809 | 41.771 | 0.039 | 0.014–0.63 | 3.19 | 0.003 |
| Summer DTR | 15.034 | 17.174 | −0.009 | −0.304–0.246 | 3.19 | 0.288 |
| Autumn Tmin | 21.349 | 23.637 | 0.038 | 0.023–0.051 | 2.33 | <0.0001 |
| Autumn Tmax | 33.228 | 36.676 | 0.002 | −0.026–0.034 | 2.58 | 0.809 |
| Autumn DTR | 11.073 | 15.207 | −0.026 | −0.001–0.312 | 6.81 | 0.045 |
| Location | Range | Sen’s Slope | 95% Confidence Interval | Coefficient of Variation (CV %) | p-Value | |
|---|---|---|---|---|---|---|
| Minimum | Maximum | |||||
| Gedaref | 322.000 | 871.000 | −0.323 | −3.967–3.636 | 21.29 | 0.841 |
| El gadabalea | 285.000 | 755.000 | 2.571 | 1.032–5.533 | 21.63 | 0.217 |
| Am Senat | 435.000 | 1070.000 | 3.100 | −1.250–7.091 | 22.35 | 0.150 |
| Samsam | 420.000 | 1023.000 | −3.222 | −7.757–0.769 | 20.59 | 0.131 |
| El hawata | 222.000 | 809.000 | 2.611 | −1.679–7.152 | 26.57 | 0.183 |
| Mean for all five locations | 425.4000 | 753.8000 | 0.9627 | −34.200–41.080 | 14.73 | 0.4135 |
| Crop Yield | Range | Slope | 95% Confidence Interval | Coefficient of Variation (CV %) | p-Value | |
|---|---|---|---|---|---|---|
| Minimum | Maximum | |||||
| Sorghum | 185.718 | 1000.020 | −0.409 | −0.676–−0.141 | 37.85 | 0.003 |
| Sesame | 111.907 | 780.016 | 0.163 | −0.127–0.453 | 40.78 | 0.263 |
| Cotton | 58.096 | 1190.500 | −0.018 | −0.311–0.276 | 55.49 | 0.905 |
| Millet | 216.671 | 642.870 | −0.025 | −0.368–0.318 | 29.29 | 0.883 |
| Sunflower | 238.100 | 833.350 | 0.607 | 0.310–0.903 | 30.16 | 0.000 |
| Season | Onset Date | Day of the Year for Onset | Cessation Date | Day of the Year for Cessation | Length of the Rainy Season (Day) | Total Rain (mm) |
|---|---|---|---|---|---|---|
| 1984 | 7-July | 189 | 16-September | 260 | 76 | 286 |
| 1985 | 20-June | 171 | 12-October | 285 | 114 | 669 |
| 1986 | 29-June | 180 | 3-October | 275 | 96 | 525 |
| 1987 | 19-June | 170 | 12-October | 285 | 115 | 445 |
| 1988 | 29-June | 181 | 18-September | 262 | 81 | 532 |
| 1989 | 22-June | 173 | 19-September | 262 | 89 | 682 |
| 1990 | 15-June | 166 | 25-September | 268 | 102 | 335 |
| 1991 | 13-July | 129 | 1-October | 274 | 80 | 308 |
| 1992 | 4-July | 186 | 13-October | 287 | 101 | 520 |
| 1993 | 18-June | 169 | 28-September | 271 | 102 | 693 |
| 1994 | 17-June | 168 | 24-September | 267 | 99 | 579 |
| 1995 | 17-June | 168 | 19-September | 262 | 94 | 499 |
| 1996 | 22-June | 174 | 30-September | 274 | 100 | 576 |
| 1997 | 25-June | 166 | 24-September | 267 | 91 | 505 |
| 1998 | 17-July | 198 | 10-October | 283 | 85 | 552 |
| 1999 | 20-June | 171 | 8-October | 281 | 110 | 766 |
| 2000 | 24-June | 176 | 1-October | 275 | 99 | 621 |
| 2001 | 23-June | 174 | 7-October | 280 | 106 | 430 |
| 2002 | 10-July | 191 | 21-September | 264 | 73 | 629 |
| 2003 | 21-June | 172 | 2-October | 275 | 103 | 820 |
| 2004 | 20-June | 172 | 10-October | 284 | 112 | 579 |
| 2005 | 22-June | 173 | 20-September | 263 | 90 | 504 |
| 2006 | 19-June | 170 | 28-September | 271 | 101 | 626 |
| 2007 | 24-June | 175 | 7-September | 250 | 75 | 575 |
| 2008 | 23-June | 175 | 12-September | 256 | 81 | 528 |
| 2009 | 2-July | 183 | 15-September | 258 | 75 | 510 |
| 2010 | 23-June | 174 | 14-October | 287 | 113 | 544 |
| 2011 | 19-June | 170 | 13-September | 256 | 86 | 408 |
| 2012 | 23-June | 175 | 28-August | 241 | 66 | 511 |
| 2013 | 21-July | 202 | 16-September | 259 | 57 | 418 |
| 2014 | 24-June | 175 | 4-October | 277 | 102 | 787 |
| 2015 | 9-July | 190 | 28-September | 271 | 81 | 399 |
| 2016 | 18-June | 170 | 13-October | 287 | 117 | 440 |
| 2017 | 18-June | 169 | 6-September | 249 | 80 | 535 |
| 2018 | 29-June | 180 | 29-September | 272 | 92 | 556 |
| Crop | Intercept | Tmin (°C) | Tmax (°C) | DTR (°C) | Rainfall (mm) | R2 | Cross−Validated R2 | |
|---|---|---|---|---|---|---|---|---|
| Sesame | Coefficient | −0.734 | −23.337 | −32.206 | 10.891 | 0.239 | 0.41 | 0.38 |
| p−value | 0.96 | 0.59 | 0.22 | 0.64 | 0.07 | |||
| Sorghum | Coefficient | 33.980 | −260.213 | 40.452 | −132.345 | 0.110 | 0.70 | 0.69 |
| p−value | 0.293 | <0.001 | 0.42 | <0.05 | 0.65 | |||
| Millet | Coefficient | −8.578 | 217.319 | −191.497 | 102.271 | −0.021 | 0.54 | 0.54 |
| p−value | 0.61 | < 0.05 | < 0.05 | 0.19 | 0.84 | |||
| Sunflower | Coefficient | −16.746 | 9.8571 | −16.042 | −25.435 | 0.536 | 0.61 | 0.62 |
| p−value | 0.43 | 0.87 | 0.65 | 0.49 | <0.01 | |||
| Cotton | Coefficient | −3.610 | −93.661 | −17.070 | 0.000 | −0.277 | 0.06 | 0.08 |
| p−value | 0.93 | 0.40 | 0.67 | - | 0.33 | |||
Publisher’s Note: MDPI stays neutral with regard to jurisdictional claims in published maps and institutional affiliations. |
© 2021 by the authors. Licensee MDPI, Basel, Switzerland. This article is an open access article distributed under the terms and conditions of the Creative Commons Attribution (CC BY) license (https://creativecommons.org/licenses/by/4.0/).
Share and Cite
Osman, M.A.A.; Onono, J.O.; Olaka, L.A.; Elhag, M.M.; Abdel-Rahman, E.M. Climate Variability and Change Affect Crops Yield under Rainfed Conditions: A Case Study in Gedaref State, Sudan. Agronomy 2021, 11, 1680. https://doi.org/10.3390/agronomy11091680
Osman MAA, Onono JO, Olaka LA, Elhag MM, Abdel-Rahman EM. Climate Variability and Change Affect Crops Yield under Rainfed Conditions: A Case Study in Gedaref State, Sudan. Agronomy. 2021; 11(9):1680. https://doi.org/10.3390/agronomy11091680
Chicago/Turabian StyleOsman, Maysoon A. A., Joshua Orungo Onono, Lydia A. Olaka, Muna M. Elhag, and Elfatih M. Abdel-Rahman. 2021. "Climate Variability and Change Affect Crops Yield under Rainfed Conditions: A Case Study in Gedaref State, Sudan" Agronomy 11, no. 9: 1680. https://doi.org/10.3390/agronomy11091680
APA StyleOsman, M. A. A., Onono, J. O., Olaka, L. A., Elhag, M. M., & Abdel-Rahman, E. M. (2021). Climate Variability and Change Affect Crops Yield under Rainfed Conditions: A Case Study in Gedaref State, Sudan. Agronomy, 11(9), 1680. https://doi.org/10.3390/agronomy11091680