Article

Climate Variability and Change Affect Crops Yield under Rainfed Conditions: A Case Study in Gedaref State, Sudan

by
Maysoon A. A. Osman
1,2,3,*,
Joshua Orungo Onono
1,4,
Lydia A. Olaka
1,5,
Muna M. Elhag
6 and
Elfatih M. Abdel-Rahman
2
1
Institute for Climate Change and Adaptation (ICCA), College of Biological and Physical Sciences, University of Nairobi, P.O. Box 30197, Nairobi 00100, Kenya
2
International Centre of Insect Physiology and Ecology (icipe), P.O. Box 30772, Nairobi 00100, Kenya
3
Department of Forestry and Environment, Faculty of Forest Science and Technology, University of Gezira, P.O. Box 20, Wad Madani 21111, Sudan
4
Department of Public Health, Pharmacology and Toxicology, University of Nairobi, P.O. Box 29053-00625, Nairobi 00100, Kenya
5
Department of Geology, College of Physical and Biological Sciences, University of Nairobi, P.O. Box 30197, Nairobi 00100, Kenya
6
Water Management and Irrigation Institute, University of Gezira, P.O. Box 20, Wad Medani 21111, Sudan
*
Author to whom correspondence should be addressed.
Agronomy 2021, 11(9), 1680; https://doi.org/10.3390/agronomy11091680
Submission received: 14 July 2021 / Revised: 18 August 2021 / Accepted: 19 August 2021 / Published: 24 August 2021

Abstract

:
It is projected that, on average, annual temperature will increase between 2 °C to 6 °C under high emission scenarios by the end of the 21st century, with serious consequences in food and nutrition security, especially within semi-arid regions of sub-Saharan Africa. This study aimed to investigate the impact of historical long-term climate (temperature and rainfall) variables on the yield of five major crops viz., sorghum, sesame, cotton, sunflower, and millet in Gedaref state, Sudan over the last 35 years. Mann–Kendall trend analysis was used to determine the existing positive or negative trends in temperature and rainfall, while simple linear regression was used to assess trends in crop yield over time. The first difference approach was used to remove the effect of non-climatic factors on crop yield. On the other hand, the standardized anomaly index was calculated to assess the variability in both rainfall and temperature over the study period (i.e., 35 years). Correlation and multiple linear regression (MLR) analyses were employed to determine the relationships between climatic variables and crops yield. Similarly, a simple linear regression was used to determine the relationship between the length of the rainy season and crop yield. The results showed that the annual maximum temperature (Tmax) increased by 0.03 °C per year between the years 1984 and 2018, while the minimum temperature (Tmin) increased by 0.05 °C per year, leading to a narrow range in diurnal temperature (DTR). In contrast, annual rainfall fluctuated with no evidence of a significant (p > 0.05) increasing or decreasing trend. The yields for all selected crops were negatively correlated with Tmin, Tmax (r ranged between −0.09 and −0.76), and DTR (r ranged between −0.10 and −0.70). However, the annual rainfall had a strong positive correlation with yield of sorghum (r = 0.64), sesame (r = 0.58), and sunflower (r = 0.75). Furthermore, the results showed that a longer rainy season had significant (p < 0.05) direct relationships with the yield of most crops, while Tmax, Tmin, DTR, and amount of rainfall explained more than 50% of the variability in the yield of sorghum (R2 = 0.70), sunflower (R2 = 0.61), and millet (R2 = 0.54). Our results call for increased awareness among different stakeholders and policymakers on the impact of climate change on crop yield, and the need to upscale adaptation measures to mitigate the negative impacts of climate variability and change.

1. Introduction

The Intergovernmental Panel on Climate Change (IPCC) states that the average annual temperature will increase by 2–6 °C in Africa under high emission scenarios (RCP8.5) by the end of the 21st century [1]. This increment is expected to be higher within the arid regions of the African continent compared to the rate of global average temperature increment [2,3]. The effect of rising temperature combined with fluctuating rainfall and scarcity of water for irrigation is argued to have a pronounced negative impact on crop yield, particularly in semi-arid and arid regions in Africa [4,5]. Consequently, this threatens the food and nutrition security situation in agriculture-based economies, which is the main source of livelihood for the resource-poor communities, especially in sub-Saharan Africa, where millions of people depend on agriculture for their livelihood support.
In the past decades, climate variability and change have become a serious challenge to agricultural production in many parts of the world [6], particularly within Sub-Saharan Africa [7]. This is because an estimated 97% of existing arable lands in the region are under rainfed agriculture, which is experiencing high fluctuation in the amount of rainfall [8]. In general, several studies have reported that crop yield under rainfed agriculture is considerably influenced by climate variables, with rainfall being associated with a higher impact on the level of yield. Specifically, Sawa and Adebayo [9] argued that both frequencies of occurrence and length of dry spells are the main variables influencing crop yield under rainfed production systems. Furthermore, the implementation of poor adaptation measures coupled with the vulnerability of the rainfed agricultural sector in Sub-Saharan Africa has major effects on crop production [10].
Previous studies have shown that the impact of changing climate is high within the semi-arid regions of Africa [1,11]. The principal climatic effects in semi-arid regions include rising temperature, shifting in dates of the beginning and end of the rainy seasons, prolonged and frequent dry spells, and changes in the length of the cropping season. Hence, crop production in semi-arid areas is reportedly affected by the existence of extreme climate events, such as floods and droughts. For example, following the severe drought in Sudan in the year 1984, crop production, particularly in the main crop production areas such as the Gedaref rainfed region, substantially decreased; consequently, the country was exposed to a severe famine [12]. As a result of such a famine, it was reported that about 55 thousand people died, while the survivors were recorded to have suffered socio-economic loss especially in communities that rely on crop farming and agro-ecosystem services [13]. Similarly, because of El Niño-associated flooding during the years 1997/1998 in Kenya, the production of food crops was reported to have decreased, resulting in famine and loss of lives of people who mainly rely on crops as a source of food and income [14].
In Sudan, agriculture is an important sector of the country’s economy, accounting for approximately one-third of its gross domestic product (GDP) and about half of the population are engaged in agricultural activities [15]. Millions of people in Sudan mainly depend on the agricultural sector for their livelihood, including cultivation, transportation, and marketing. It is expected that the population of Sudan, approximately 43 million people, will double by the year 2050 [16]. This increment will put pressure on available natural resources to produce sufficient amounts of agricultural outputs to meet the rising demand for food. Indeed, reports show that the county has witnessed rainfall fluctuations, rising in temperature, increasing frequency of floods, and recurrent droughts which have significantly affected agricultural production [16], especially in the rainfed sector. For instance, crop farming supports livelihood sources for about 80% of its population and households, directly through agricultural production and indirectly through labour workforce in the agricultural sector.
Gedaref state is the most important and the largest rainfed area in Sudan, where crop farming supports livelihood sources for about 80% of its population and households, directly through agricultural production and indirectly through labour workforce in the agricultural sector [17,18]. However, some studies have shown that the yield of main crops (e.g., sorghum and sesame) in the state is usually highly fluctuated [17,19]. It is speculated that the fluctuation in the timing and duration of the rainy season could have an important influence on crop yield [20]. However, there is a lack of science-led evidence and assessment of climate effects on crop yield in the Gedaref region. Although assessment of the impact of climate change on crop yield is problematic due to many overlapping factors that affect yield, such as improved technologies and management practices [21], determining the existence of any relationship between climatic factors and crop yield is fundamental in risk assessment. Furthermore, understanding the responses of crops to the shifts in inter-and intra-seasonal rainfall patterns is useful information for agricultural planning and designing of adaptation measures. Therefore, the objectives of this study were to (1) assess the trends in temperature, rainfall, and main crops yield in Gedaref state, and (2) to investigate the impact of rainfall and temperature variables on the main crops yield in Gedaref state. The findings from this study are useful for extension workers and policymakers in designing and upscaling adaptation measures to mitigate the negative impacts of climate change and variability under similar agro-climatic settings.

2. Methodology

2.1. Study Area

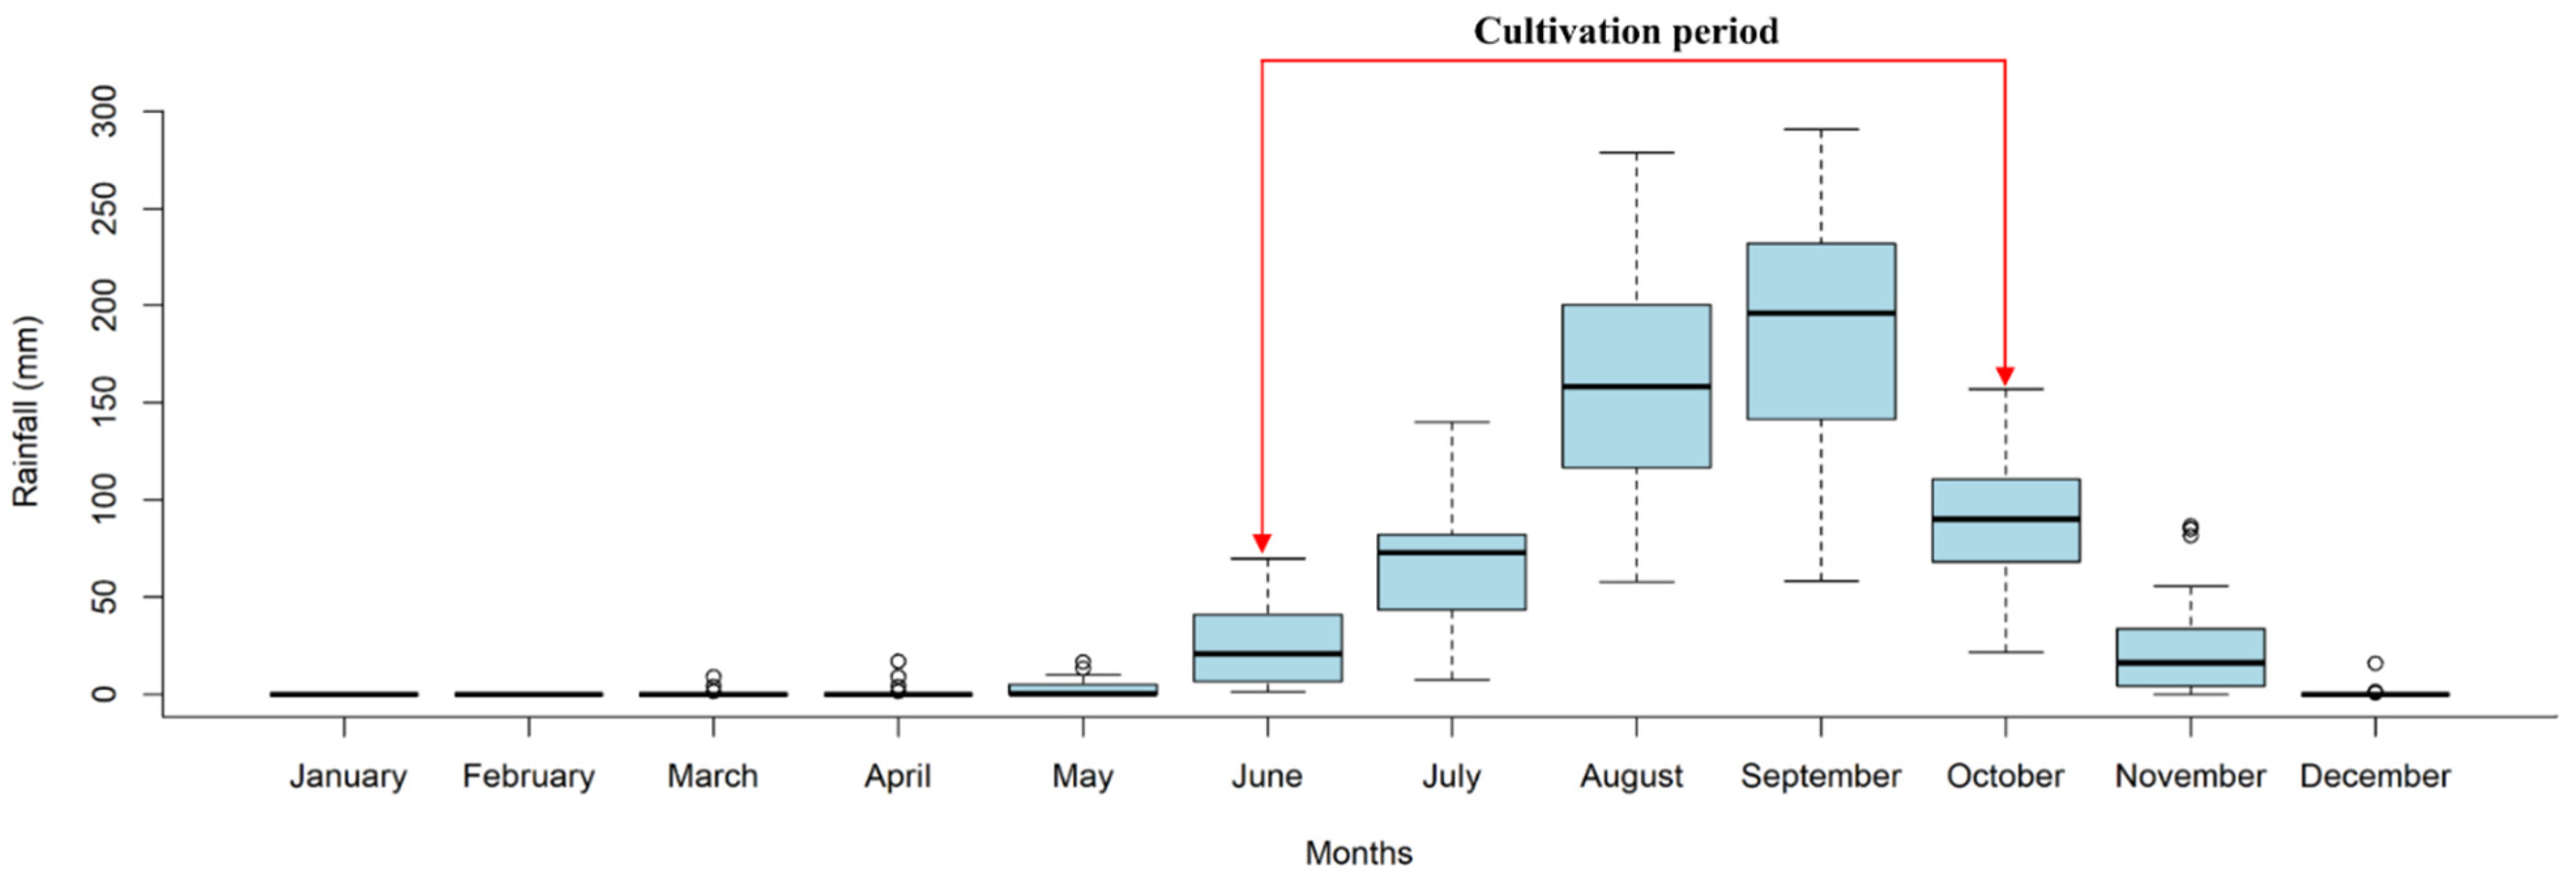
Gedaref state is located in the eastern part of Sudan between Longitudes 33°–37° E and Latitudes 12°–16° N with an altitude of 600 m above sea level, covering an area of about 78.228 km2. The state borders Sennar state to the South, Kassala and Khartoum states in the North, Gezira in the West, and Ethiopia to the East (Figure 1). The state is characterized by a semi-arid agro-ecological production system. The soil of the area is Vertisols, which is characterized by deep, dark, heavy cracking clay [22]. The annual rainfall in Gedaref ranges between 200 and 800 mm with a mean annual value of 600 mm [23] and an average annual temperature of 30 °C [24]. This state is the most important rainfed agricultural area in Sudan, as it receives the highest amount of rainfall in the country. It is largely recognized as the land of sorghum and sesame in the country, where about one-third of these two crops are produced under a rainfed mechanized farming system [25]. Other crops such as cotton, groundnut, millet, and sunflower are also cultivated in the area under rainfed conditions. Sorghum and millet are grown for food consumption, with sorghum being the staple food in the entire country. Sesame and sunflower are grown mainly for oil production as well as for export, while cotton is an industrial cash crop. The growing season for all of these crops extends from June to October each year, which corresponds to the rainy season in Sudan (Figure 2). The main farming practices used in Gedaref state are zero tillage, fertilizer and pesticide applications, planting drought tolerant and early maturing varieties, and practicing crop rotation. Gedaref state was selected as a study area because it is Sudan’s hub of rainfed crop production. Also, the state has a long history (about 77 years) of a well-established rainfed mechanized farming system where secondary data on crop yield and climate variables can be readily obtained.

2.2. Secondary Data Collection

Daily minimum (Tmin) and maximum (Tmax) temperature, which refer to the lowest and highest values of the daily temperature records, respectively, as well as daily rainfall data from 1984 to 2018 were obtained from Gedaref meteorological station (latitude 14.03° N; longitude 35.40° E; altitude 600 m). Gedaref meteorological station is run by the Sudan Meteorological Authority. The Tmin and Tmax were estimated every three hours daily using an alcohol thermometer. On the other hand, the daily rainfall was measured and recorded every six hours daily using rain gauges where a rainy day starts from 8:01 am and ends on the following day at 8:00 a.m. local time (Greenwich Mean Time: GMT + 2). In addition, annual rainfall data for the same period (i.e., 1980 to 2018) were obtained from different locations in Gedaref state, namely Elghadambliya (latitude 14.023° N; longitude 35.012° E; altitude; 497 m), Um Seinat (latitude 12.845° N; longitude 35.864° E; altitude; 572 m), Samsam (latitude 12.838° N; longitude 35.733° E; altitude; 527 m), and Elhawata (latitude 13.431° N; 34.629° E; altitude; 444 m), where rainfall data were also measured using rain gauges. Data on yield for five major crops, viz., sorghum, sesame, cotton, sunflower, and millet at the Gedaref state scale were obtained from the Ministry of Agriculture, Gedaref. Basically, the crop yield data were collected from some representative farmers’ fields. Crop production (ton) data and harvested area (ha) were obtained for the period 1970–2018, except for millet and sunflower, which were only available between 1982 and 2018, and 1987 and 2018, respectively. Annual yield (kg ha−1) for each crop was calculated by dividing the total crop production by the harvested area.

2.3. Data Quality Assessment

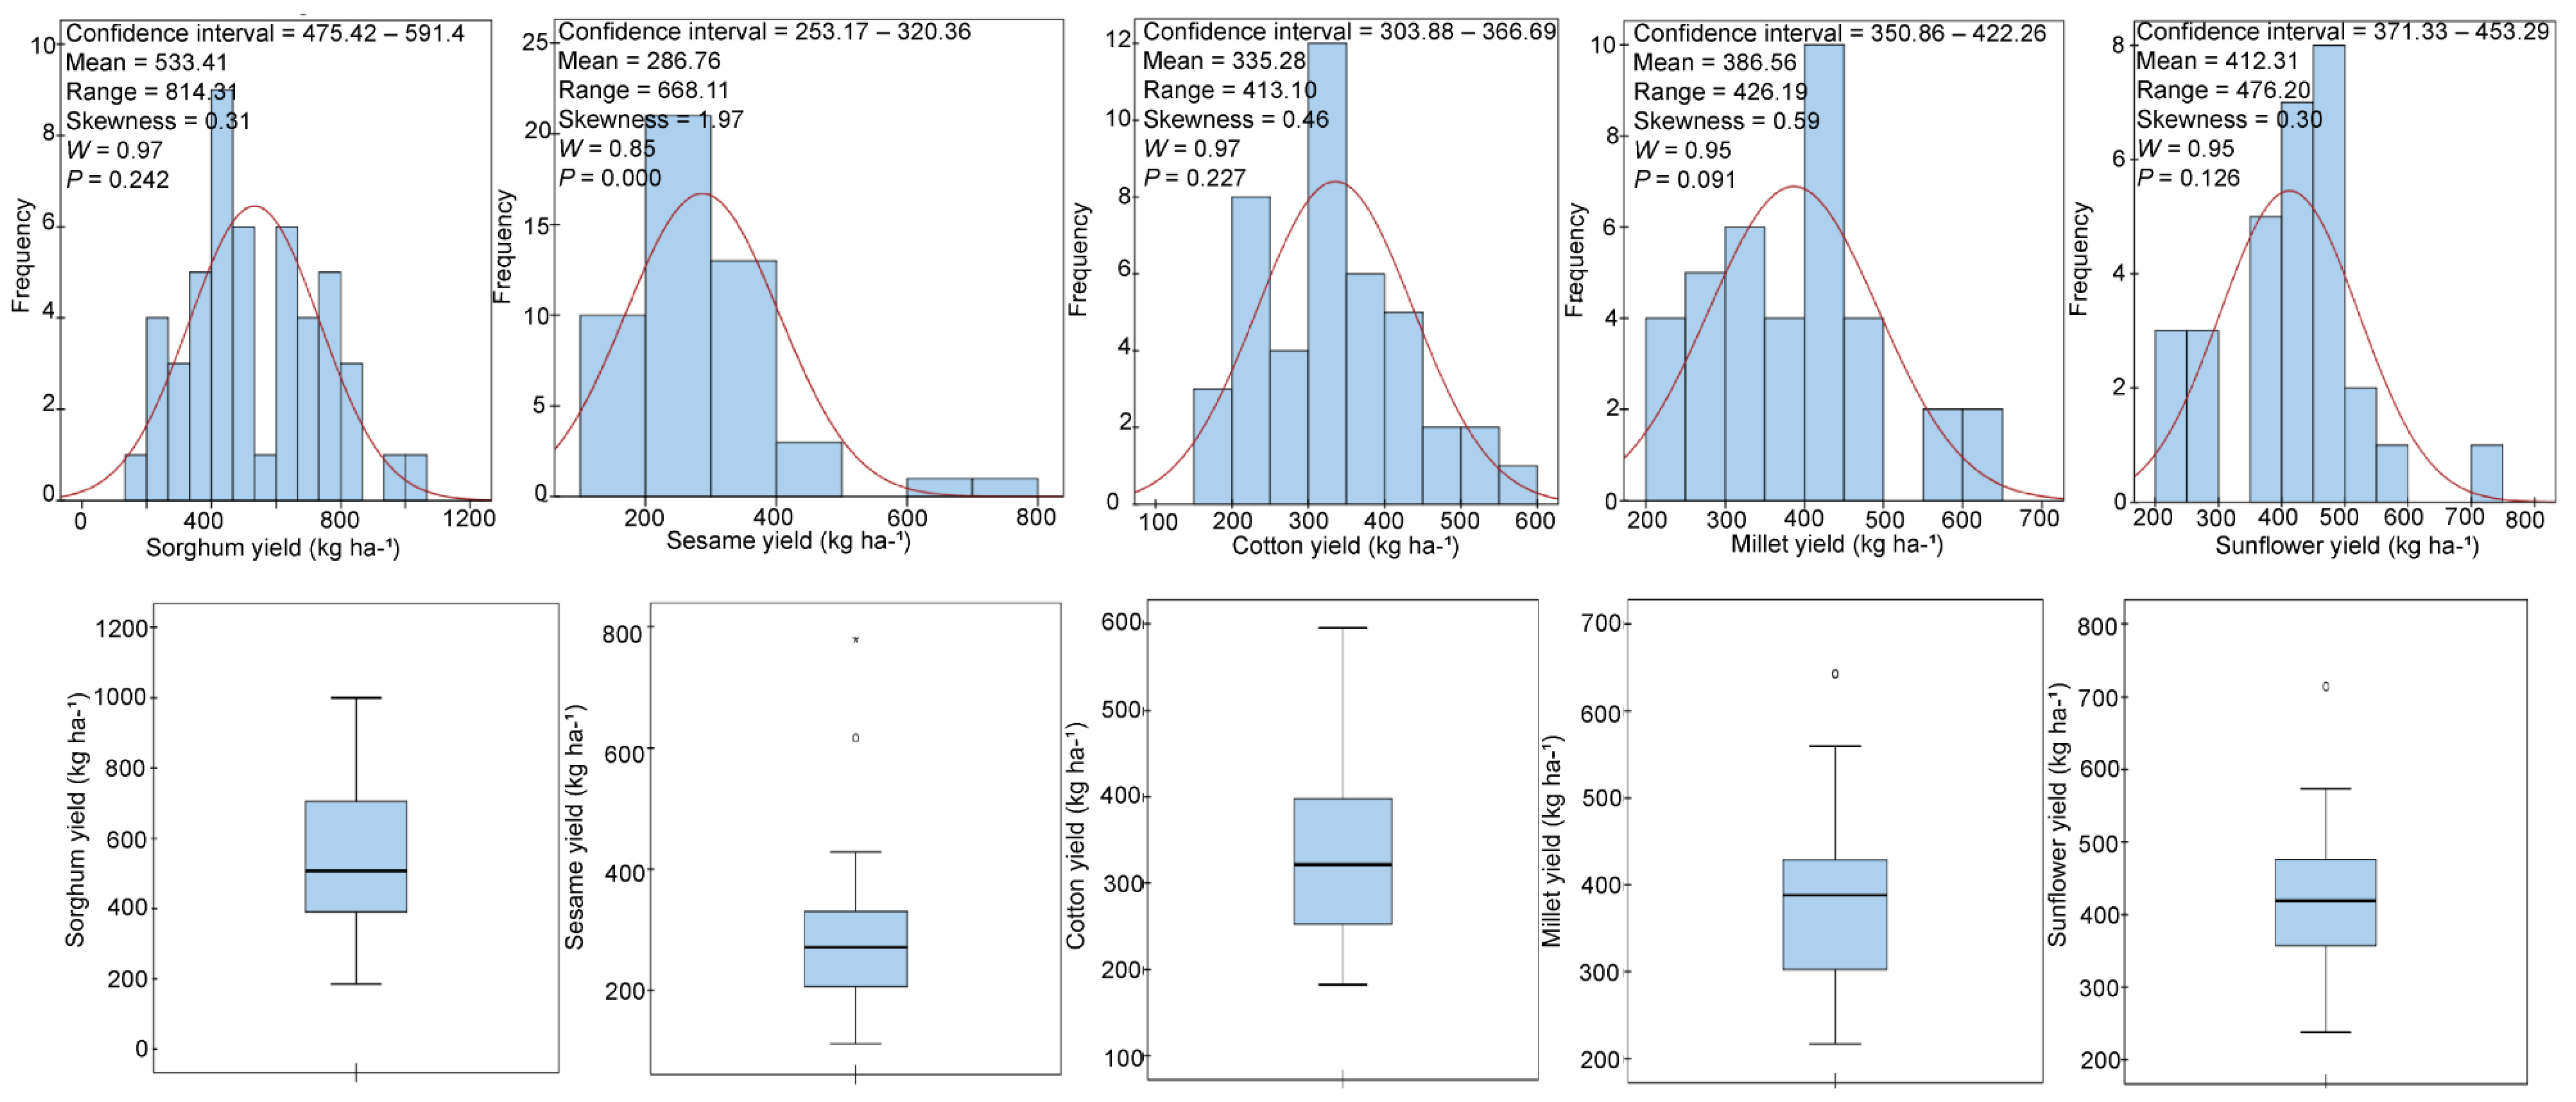
Complete records were obtained for climate and crop yields, and these datasets were measured during the above-mentioned periods with no missing values. Since these are secondary datasets, we subjected them to a descriptive statistical analysis (skewness coefficient, mean, range, and confidence interval) and Shapiro–Wilk test (p-value and W value) of inferential statistics prior to trend and regression analyses to evaluate their quality. A summary of descriptive statistics provides useful information about the data quality. For instance, a mean value that describes the center of a dataset distribution can be an indicator of data quality since there is prior knowledge (e.g., expert knowledge) about the dataset itself. Additionally, a close to zero skewness value indicates a moderately skewed dataset that can fit a normal distribution, which is a good indicator of data quality [26]. Normally distributed data imply that the observations were collected with less bias and errors that hinder the quality of the data [26]. Among our climatic datasets, rainfall was normally distributed (skewness = 0.33, W = 0.97 and p = 0.629), while Tmax (skewness = 0.199, W = 0.98 and p = 0.001) and Tmin (skewness = −0.34, W = 0.98 and p = 0.001) slightly deviated from a normal distribution (Appendix A). On the other hand, all crop yield datasets were normally distributed (sorghum: skewness = 0.31, W = 0.97 and p = 0.242, cotton: skewness = 0.46, W = 0.97 and p = 0.242, millet: skewness = 0.59, W = 0.95 and p = 0.227, and sunflower: skewness = 0.30, W = 0.95 and p = 0.126), except sesame: skewness = 1.97, W = 0.85, and p = 0.000 (Appendix B). Furthermore, the climate and crop yield datasets had a few outliers in the Tmin, rainfall, and sesame, millet, and sunflower yield observations. These statistical metrics ensured the quality of the data that met our assumption for the present study.

2.4. Data Analysis

2.4.1. Trend Analysis

The average annual Tmax, Tmin, and diurnal temperature range (DTR: which refers to the range between Tmax and Tmin) were calculated from the daily temperature records of Gedaref metrological station for each year (1984–2018) and season of the year (i.e., summer: March to May, winter: February to November, and autumn: June to October). Afterward, Tmax, Tmin, and annual rainfall temperature variables were subjected to Mann–Kendall trend analysis to assess the positive or negative trend in temperature and rainfall. A Mann–Kendall trend test is a nonparametric test (distribution-free) that is not sensitive to outliers [27,28], and is widely used for analyzing time-series historical data to assess if there is a significant increasing or decreasing trend in variables of interest (e.g., temperature and rainfall) over time. In the present study, the Mann–Kendall trend test was computed using Equation (1):
i = 1 n 1 j = 1 + i n s i g n = ( x j x i )
where:
x j = the data value at time j ;
x i = the data value at time   i ;
n = the length of the time-series data;
sign ( x j x i ) = the sign function which can be defined as follows:
S i g n   ( x j x i ) = { 1   i f   ( x j x i ) > 0 2   i f   ( x j x i ) = 0 1   i f   ( x j x i ) < 0
The increasing trend is explained by a very high positive value of the Mann–Kendall test, while the decreasing trend is explained by a very low negative value. To statistically quantify the significance of the trend in the temperature and rainfall data, we applied Sen‘s slope estimator test [29]. In specific, the slope (Q), which is the change in the temperature and rainfall as a function of time (i.e., years), was calculated for all possible data pairs as follow (Equation (3)):
  Q = x j x i j i
where x j and x i are the data value in the time series at time j and i , respectively.
Since there are a number of Q s (N), they are ranked from smallest to largest in the time-series data, then Sen’s slope was estimated as the median of these values (Equation (4)):
Q i = { Q ( N + 1 2 )                                             i f   N   i s   o d d   1 2   ( Q   N 2 + Q   N + 2 2 )         i f   N   i s   e v e n
On the other hand, simple linear regression was employed to assess the trend of crop yield over time. This is because crop yield data depend on many factors rather than climatic variables; a reason that does not meet the assumption of the Mann–Kendall trend analysis test [27,28]. In addition, the yield data were normally distributed (Appendix B), hence linear regression was preferred over a Mann–Kendall trend analysis.

2.4.2. Temperature and Rainfall Variability Analysis

To assess the annual temperature and rainfall variabilities in our study area over 35 years (1984–2018), we calculated the standardized anomaly index. Standardized anomaly index is a common index used to indicate temperature and rainfall fluctuations in regional climate change studies [30]. The standardized anomaly index was calculated as follows (Equation (5)):
S A I = X X i σ
where X is the mean temperature or rainfall of a year, X i is the mean value over the long-term, and σ is the standard deviation value over the long-term. Years with an above long-term average were indicated as the most warming periods, while the years with values below the long-term average were considered as cold periods. Similarly, years with above long-term average rainfall were indicated as the years with surplus rainfall, while years with below long-term average rainfall were indicated as the years with deficit rainfall.
Moreover, the coefficient of variation (CV) was calculated as follows (Equation (6)) to assess the variability (fluctuation) in each temperature and rainfall variable and crop yield data:
C V = σ μ 100
where CV is the coefficient of variation; σ is standard deviation; μ is the mean of the time series data set of each climatic variable (i.e., Tmin, Tmax, DTR, and rainfall) and crop yield.

2.4.3. Rain Season Characteristics

The onset and cessation dates and length of the rainy season were analysed using R INSTAT software version 0.6.6 [31]. This was done by applying the threshold procedure to determine variations in the rainy season characteristics such as onset, cessation, and the length of the rainy season. The threshold for a rainy day was set at 0.85 mm [32,33] and the mean rainfall was calculated for every 5 days (pentads) of the rainy season. This threshold value is appropriate for agricultural purposes in the tropical region because the accumulation of such an amount of rain contributes greatly to soil moisture [32,33,34]. Furthermore, we defined the onset of the rainy season as a “date when the amount of rainfall accumulation is 20 mm in 1 or 2 days within 3 dekads (dekad = 10 days), but not followed by more than 10 consecutive dry days in the next 3 dekads” [35]. This amount of rainfall is sufficient for germination and growth of the crop during the first month after planting. The cessation of the rainy season has several definitions. Here, we adopted the approach proposed by [36], which defines the cessation of the rainy season as the date when the rain is less than 20 mm within 3 dekads followed by 2 dekads of dry days. This approach was widely used to determine the end of the rainy season [37,38]. Rainfall is the most significant factor affecting crop growth and yield, particularly in semi-arid regions where rainfall is limited to only a few months per year [39]. Therefore, simple linear regression analysis was used to determine the relationship between the length of the rainy season and crop yield. The following steps were taken to determine this relationship: (1) we used the first difference approach to generate anomalies in crop yield and length of the rainy season and (2) we employed simple linear regression analysis to test the impact of the length of the rainy season on crop yield anomalies.

2.4.4. Analysis of Relationships between the Climate Variables and Crop Yield

Due to the effect of non-climatic factors such as crop management practices and new cultivars on crop yield, some statistical methods such as the first difference approach [40] and crop simulation models such as decision support system for agrotechnology transfer (DSSAT) [41] are used to evaluate the effect of climate change on crop yield [42]. However, models such as DSSAT require some settings and parameters, such as crop genetic coefficient, that might not have been estimated to simulate crop yield under Gedaref climatic conditions. Hence, in this study, we used the first difference approach to remove the effects of non-climatic factors on crop yield. The first difference approach was initially introduced by Nicholls [40] and thereafter adopted by studies that evaluated the effect of climate change on crop yield [43,44,45,46]. The first difference values for crop yield and climatic variables (i.e., anomalies) for the period 1984–2018 were generated as follows (Equation (7)):
Δ Y = Y t Y t 1 Δ X = X t X t 1
where Δ Y is the yield difference in two consecutive years; that is the yield in year t and   t 1 , respectively, while Δ X is the difference in the climatic variable in two consecutive years; that is the climatic variable during crops growing season (June–October) in year   t and t 1 , respectively.
To estimate quantitative relationships between climate variables and crop yield, the anomalies generated from the first difference for climate variables and crop yield were subjected to a Pearson’s correlation analysis to determine the association between the crop yield and climatic variables. In addition, a multiple linear regression model was used to quantify the impact of climate change on crop yield using the anomalies of the first difference [47]. The following linear equation (Equation (8)) was used to determine such a relationship for each crop:
Y = a + b 1 T m i n + b 2 T m a x + b 3 D T R + b 4 R a i n f a l l
where, Y is the observed change in yield (kg ha−1) due to climatic variables, a is the intercept of the regression model, and   b 1 ,   b 2 , b 3 , and b 4 are the regression coefficients of Tmin, Tmax, DTR, and rainfall, respectively.

2.4.5. Validation

A leave-two-out cross-validation procedure was used to validate the simple and multiple linear regression models. In specific, the data were divided into k samples (k = total number of crop yield samples) and then samples were removed two-by-two. Yield predictive models were fitted k times using all k data points, except for the removed ones, and validated using these omitted (holdout) ones. A cross-validated R2 between the observed and predicted yield data was then calculated to test the certainty of the models.

3. Results

3.1. Estimation of Annual and Seasonal Temperature Trends in Gedaref State

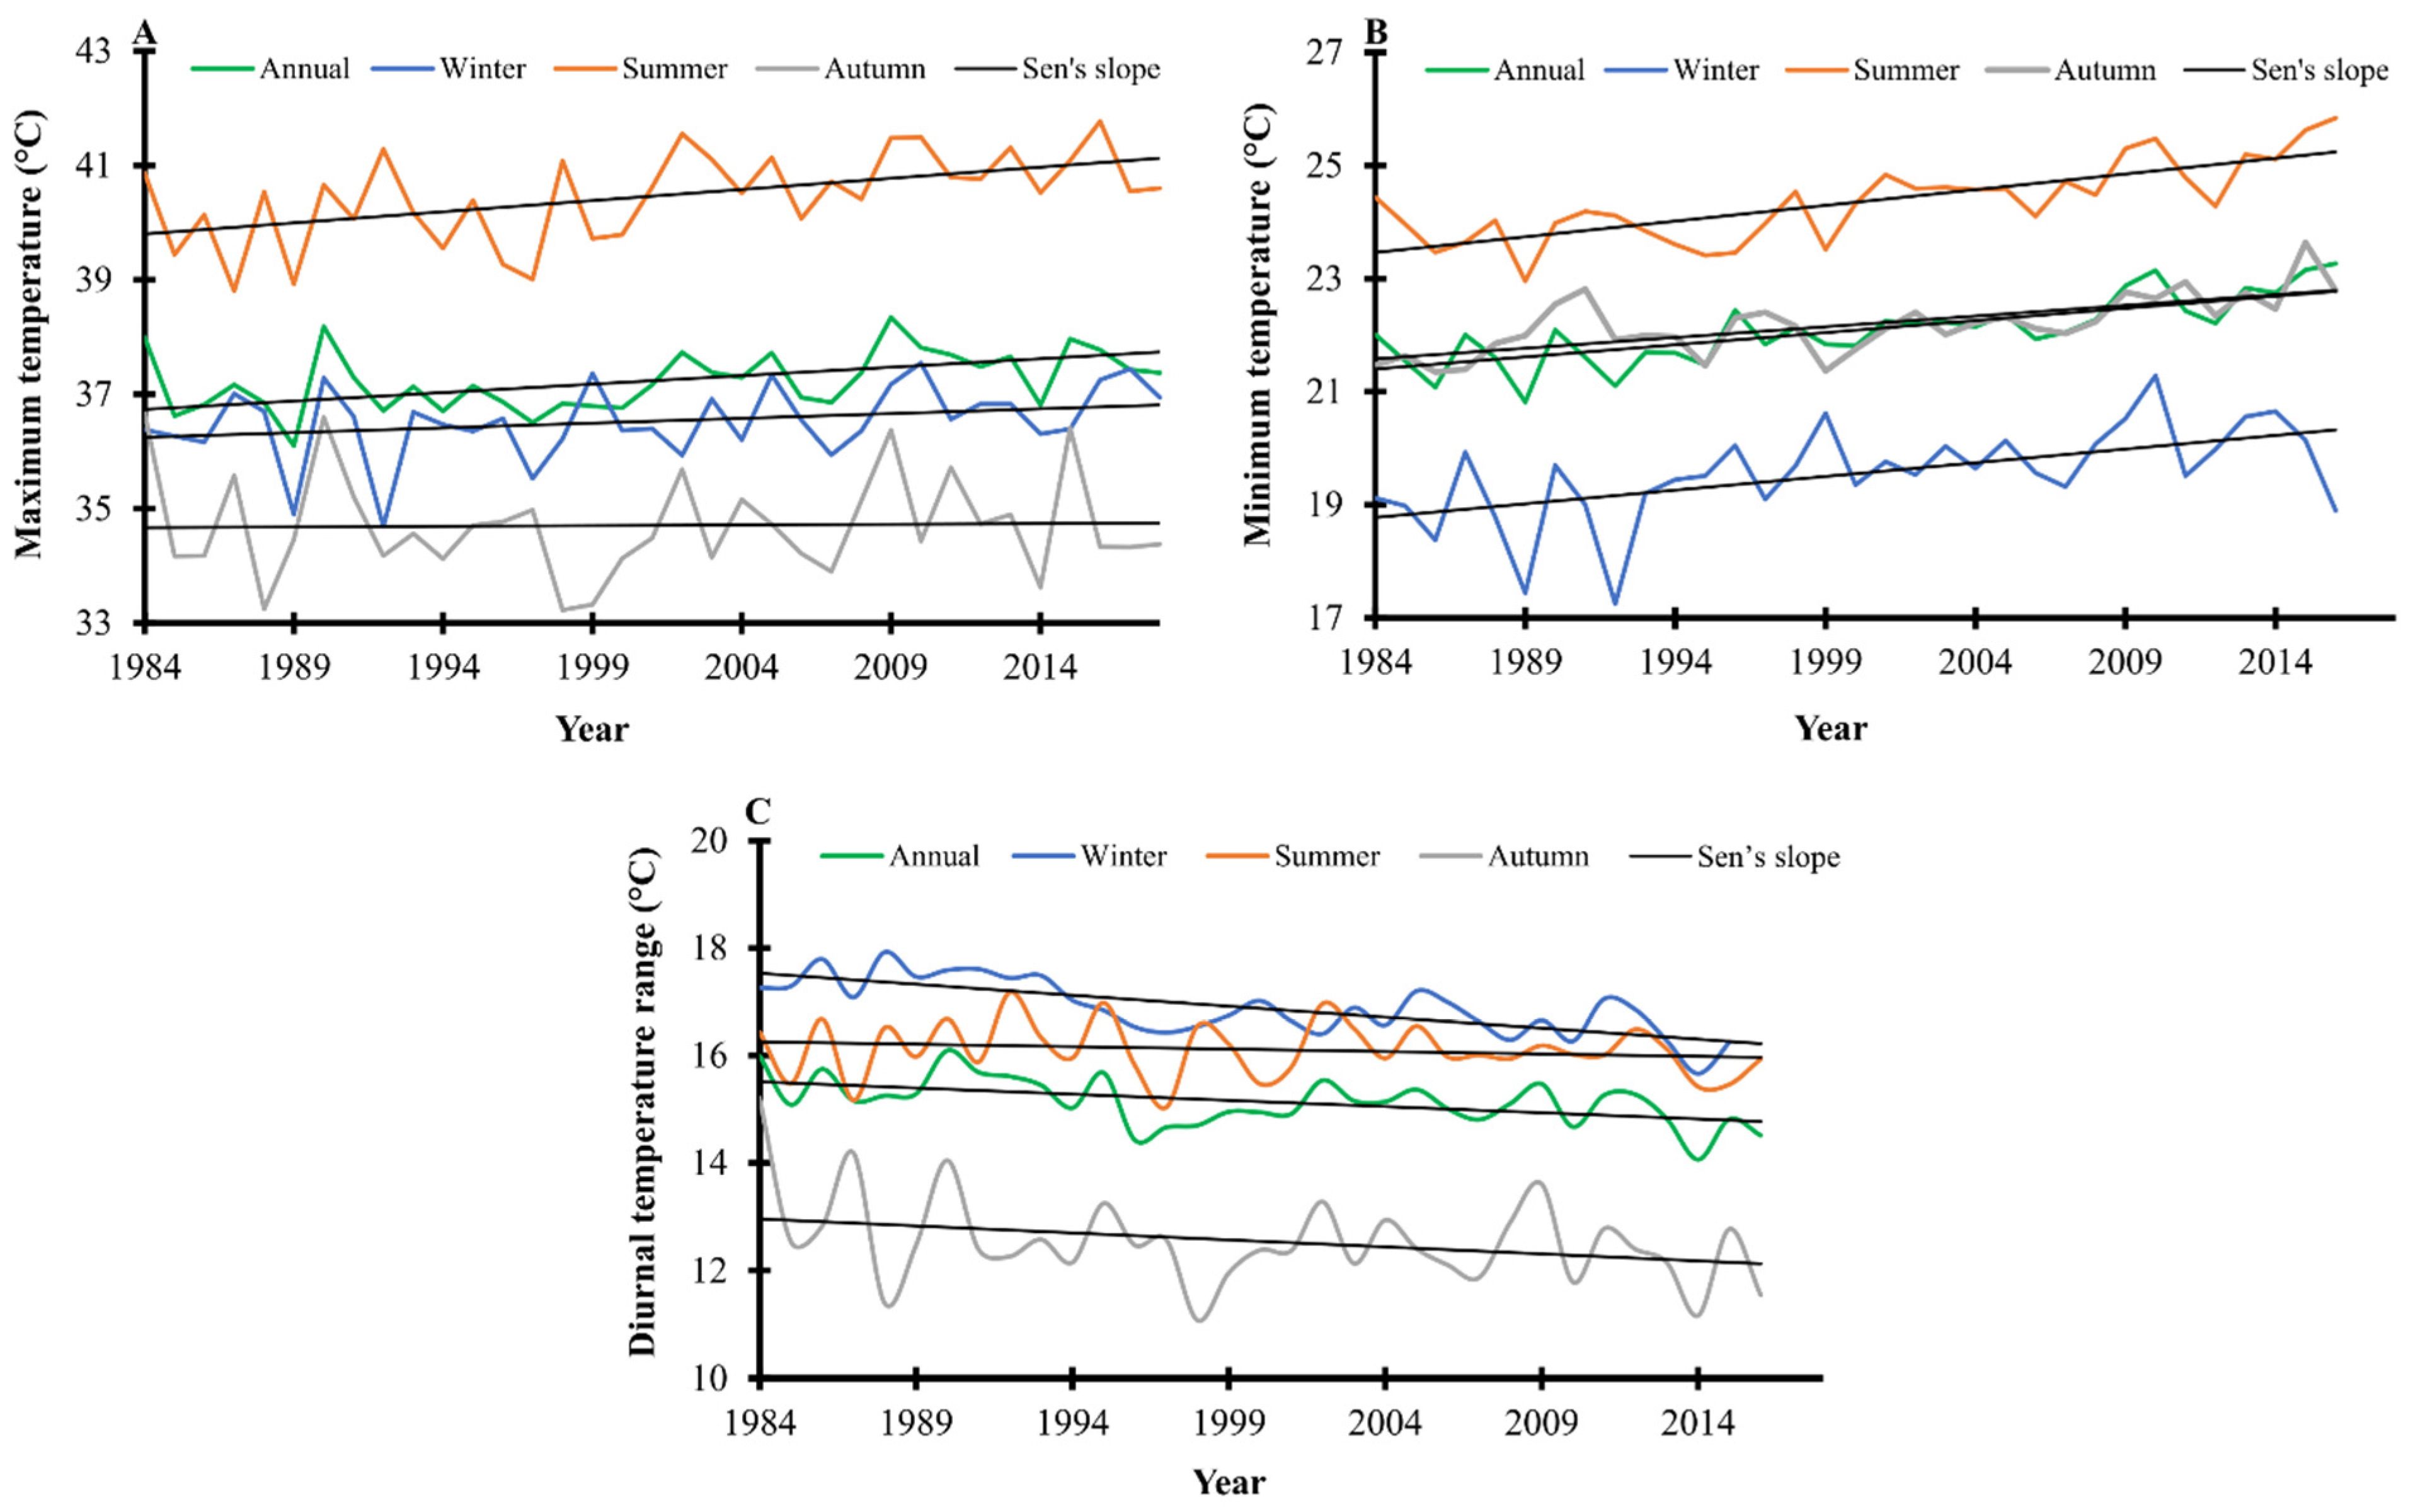
The Mann–Kendall and Sen’s slope trend analysis showed that the annual Tmax significantly (p < 0.01) increased in Gedaref state by 0.03 °C per year, between the years 1984 and 2018, with a confidence interval ranged between 0.01 and 0.04 °C (Table 1; Figure 3A). Similarly, the annual Tmin significantly (p < 0.0001) increased by 0.05 °C per year, with a confidence interval ranged between 0.03 and 0.06 °C (Table 1; Figure 3B). Between the years 1984 and 2018, the Tmin in Gedaref state ranged between 20.81 and 23.26 °C per year, while the values of the Tmax ranged from 36.10 to 38.34 °C (Table 1). The annual DTR had significantly (p < 0.01) decreased by 0.02 °C per year, with a confidence interval between −0.23 and 0.14 °C for the study period (Table 1; Figure 3C). The seasonality trend showed that the Tmax increased by 0.02 and 0.04 °C per year in winter and summer, respectively, with no change reported in autumn (Table 1; Figure 3A), while the Tmin in winter, summer, and autumn has significantly (p < 0.001) increased by 0.05 °C, 0.06 °C, and 0.04 °C per year, respectively (Table 1; Figure 3B). The highest decrease in DTR was reported in winter with an estimated value of 0.03 °C per year (p < 0.001).

3.2. Determination of Annual Rainfall Trends in Gedaref State

Mann–Kendall and Sen’s slope trends for the annual rainfall data for the five different stations are presented in Table 2 and Figure 4, respectively. Overall, there was a variation in the annual rainfall trends between 1980 and 2018, with no significant (p ranged between 0.131 and 0.841) increase or decrease in the amount of rainfall within this period in the five locations. Rainfall decreased in Gedaref and Samsam by about 0.3 mm per year and increased in the other three locations by about 2.5–3.1 mm per year (Table 2) during the study period, with high variability in El hawata (CV = 26.57%) and low variability in Samsam (CV = 20.59%). The highest decrease in rainfall was recorded at the Samsam location, fluctuating from 420 to 1023 mm (Table 2; Figure 4D). The overall trend of the average rainfall recorded in the five locations revealed that the rainfall has increased by ≈1.0 mm in Gedaref state between 1980–2018, with CV of 14.73% (Table 2; Figure 4F).

3.3. Assessment of Annual Crop Yield Trends in Gedaref State

The trend analysis showed a decrease in the annual yield of the five studied crops between 1970 and 2018, with the exception of sunflower and sesame, which had a yield increment (Table 3; Figure 5). However, there was a significant yield change for sorghum (p < 0.01) and sunflower (p < 0.001) only (Table 3; Figure 5). In specific, sorghum and cotton recorded the highest (0.41 kg ha−1 per year) and lowest (0.02 kg ha−1 per year) yield decrement, while sunflower recorded a yield increment of about 0.61 kg ha−1 per year (Table 3; Figure 5).

3.4. Estimation of Temperature and Rainfall Variability Indices

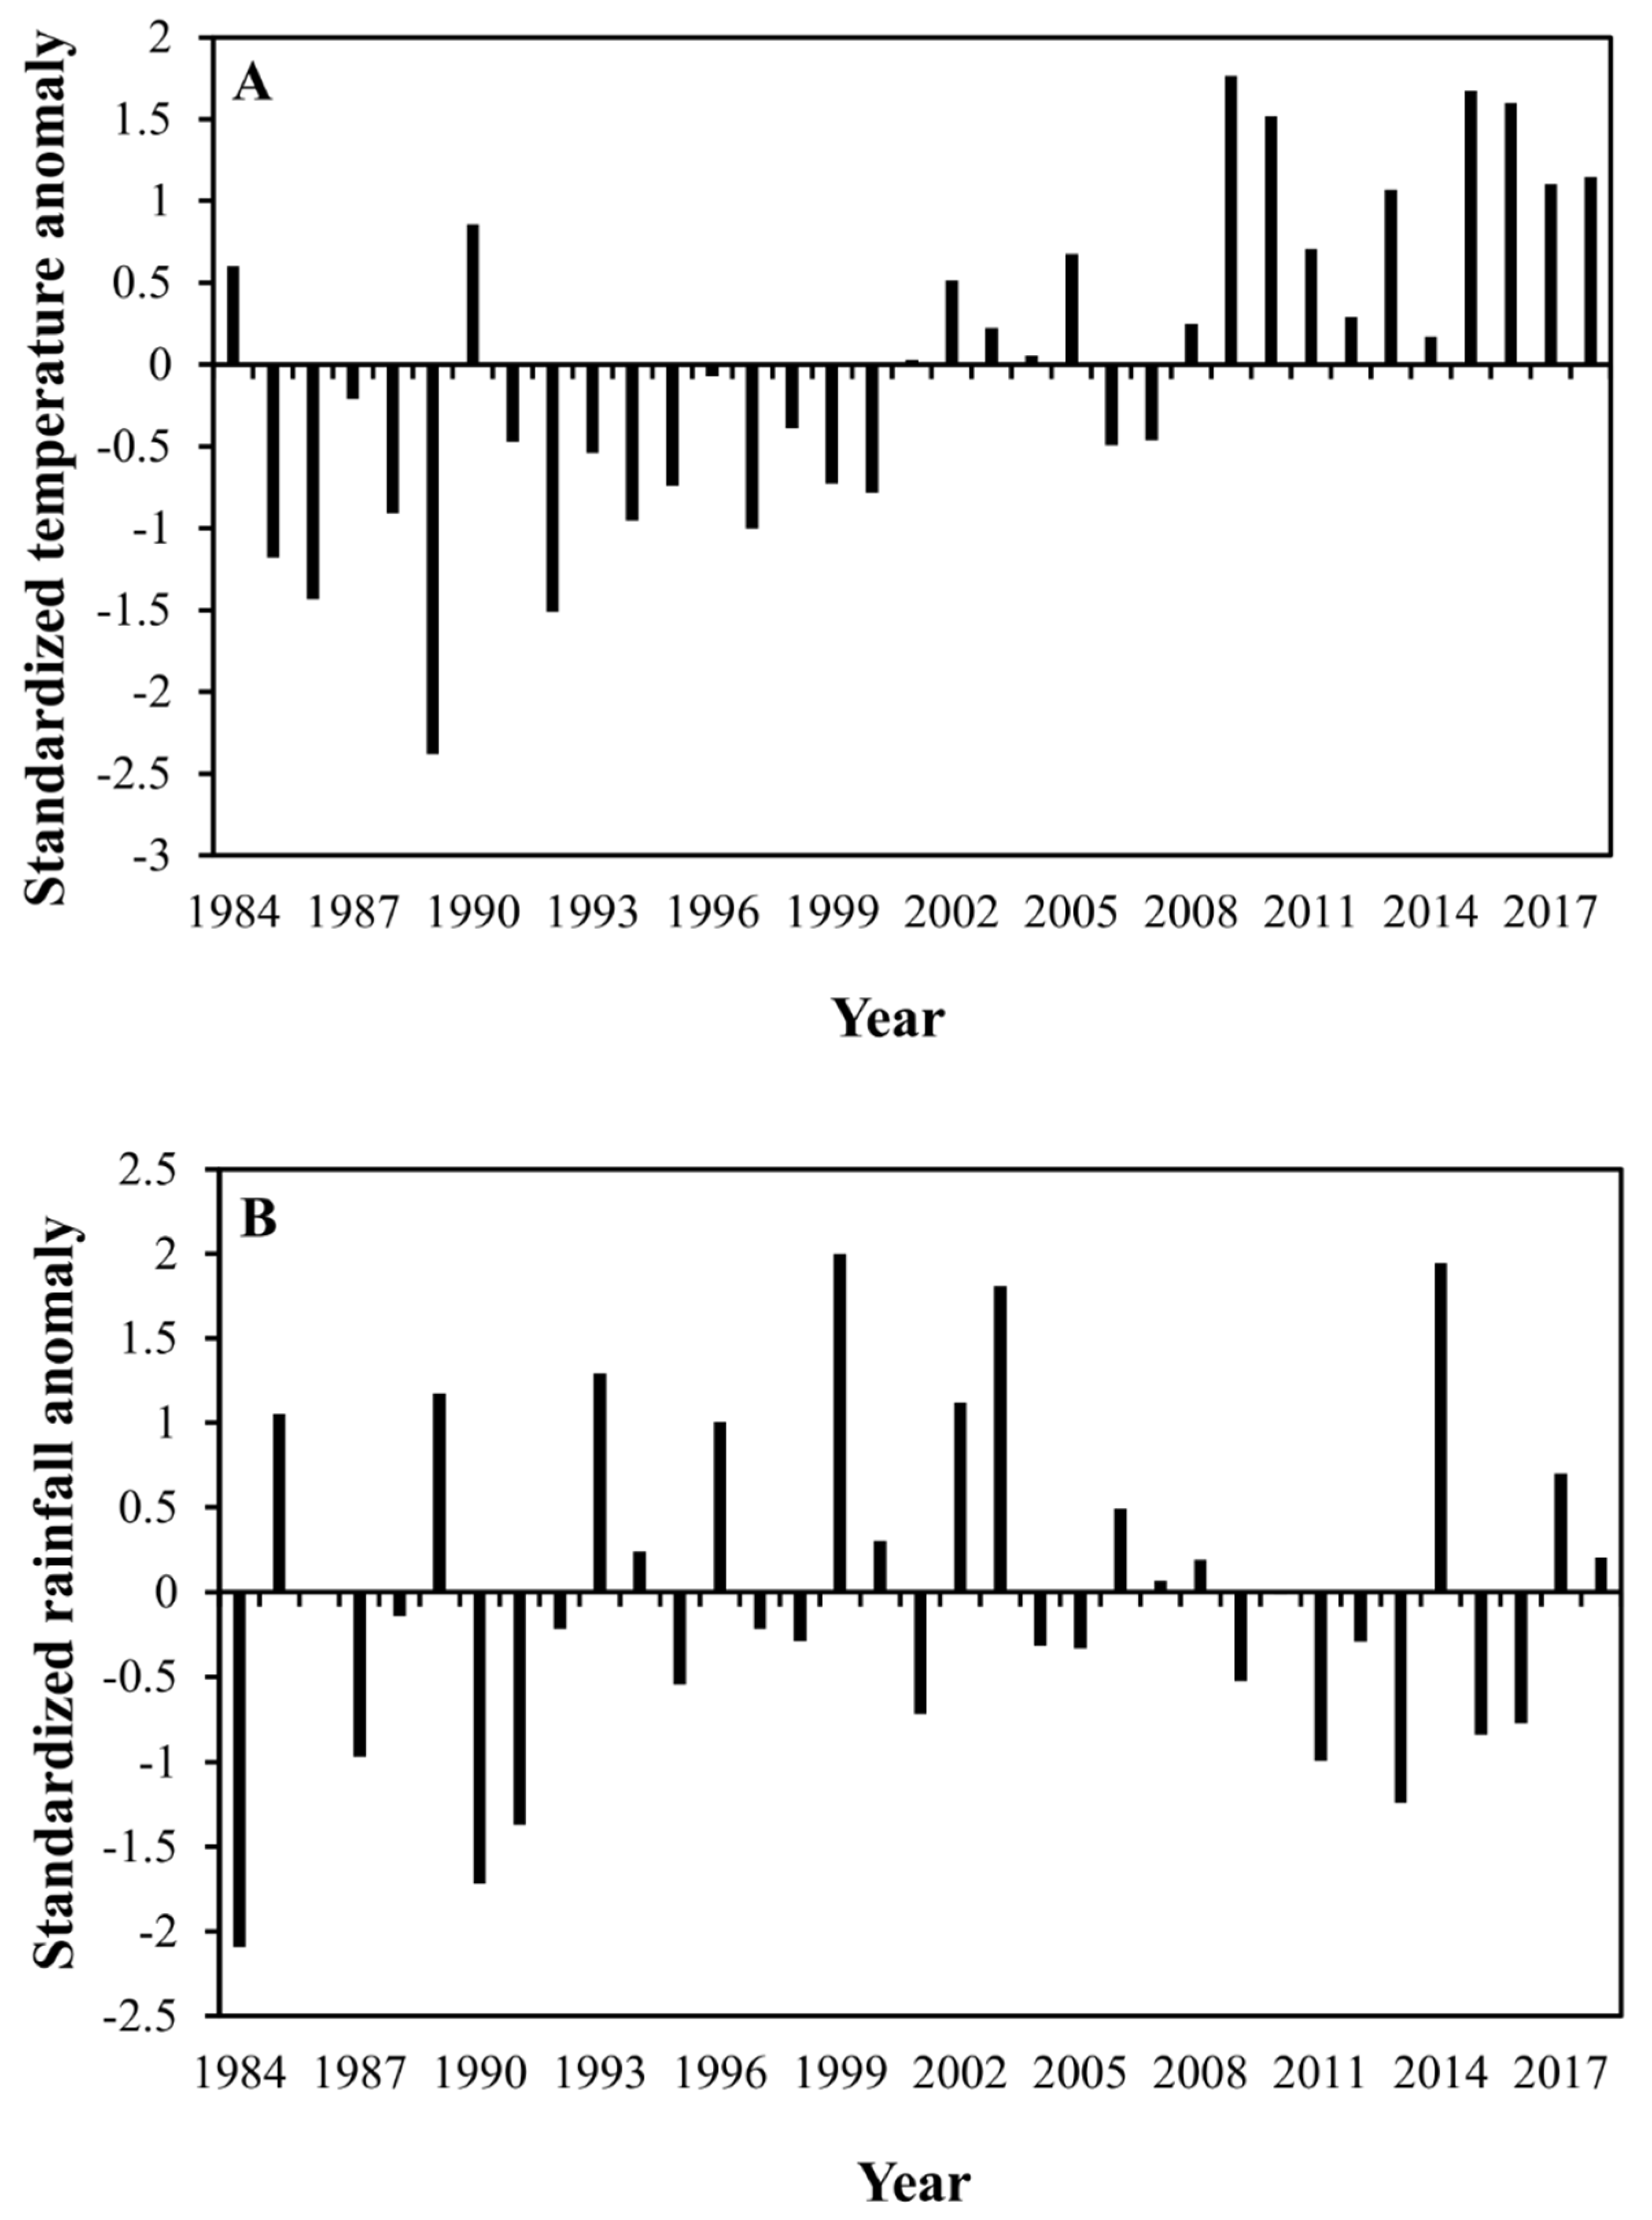
The temperature and rainfall anomalies that occur in Gedaref state for the period 1984–2018 were described by mean annual temperature and rainfall. Standardized anomaly index for the mean annual temperature in Gedaref state was characterized by the below long-term average between 1984 and 2000, indicating cold years (Figure 6A). The cold years started in 1985 and continued with only one warm year (i.e., 1990) until 2000. Afterward, there were warm years which continued until 2018, which are characterized by being above the long-term average with two breaks of cold years (Figure 6A). Standardized rainfall anomaly index for long-term annual rainfall of Gedaref for the period 1984–2018 was used to identify the years with rainfall deficit and the years with surplus rainfall. The coefficient of variation for annual rainfall was 23%, which indicates that there was no high variation in the amount of rainfall between the years. The year 1984 experienced the highest rainfall deficit occurrence followed by 1990, 1991, 2013, 2011, and 1987, in decreasing order of magnitude (Figure 6B). In contrast, the years with the highest surplus rainfall were 1999, 2014, 2003, and 2002, as can be observed in Figure 6B.

3.5. Characteristics of Rainy Seasons in Gedaref State

On average, the starting dates of the rains in Gedaref state were estimated to range between the second and third dekad of June, which corresponds to the 166–176 days of the year. The cessation dates estimated between the second and third dekad of September and the first and second dekad of October, which falls between the 250–287 days of the year (Table 4). The length of the rainy season in Gedaref state ranged between 57 days (2013 season) and 117 days (2016 season) (Table 4). Some exceptions are noticed in the years 1991, 1998, and 2013 when onset dates occurred within the second and third dekad of July, while cessation date exceptions are 2007 and 2012 in the first dekad of September and the year of 2017 in the third dekad of August (Table 4). The total amount of rainfall ranged between 286 and 820 mm, with an average of 539.7 mm per season (Table 4).
Linear regression analysis showed that an increase in the length of the rainy season significantly increased the yield of sesame (p < 0.001 and R2 = 0.47), sorghum (p < 0.001 and R2 = 0.43), sunflower (p < 0.001 and R2 = 0.49), and cotton (p < 0.05 and R2 = 0.22) (Figure 7). However, the yield of millet was not significantly (p = 0.432 and R2 = 0.02) affected by the length of the rainy season (Figure 7).

3.6. Assessment of the Relationship between Climatic Variables and Crop Yield in Gedaref State

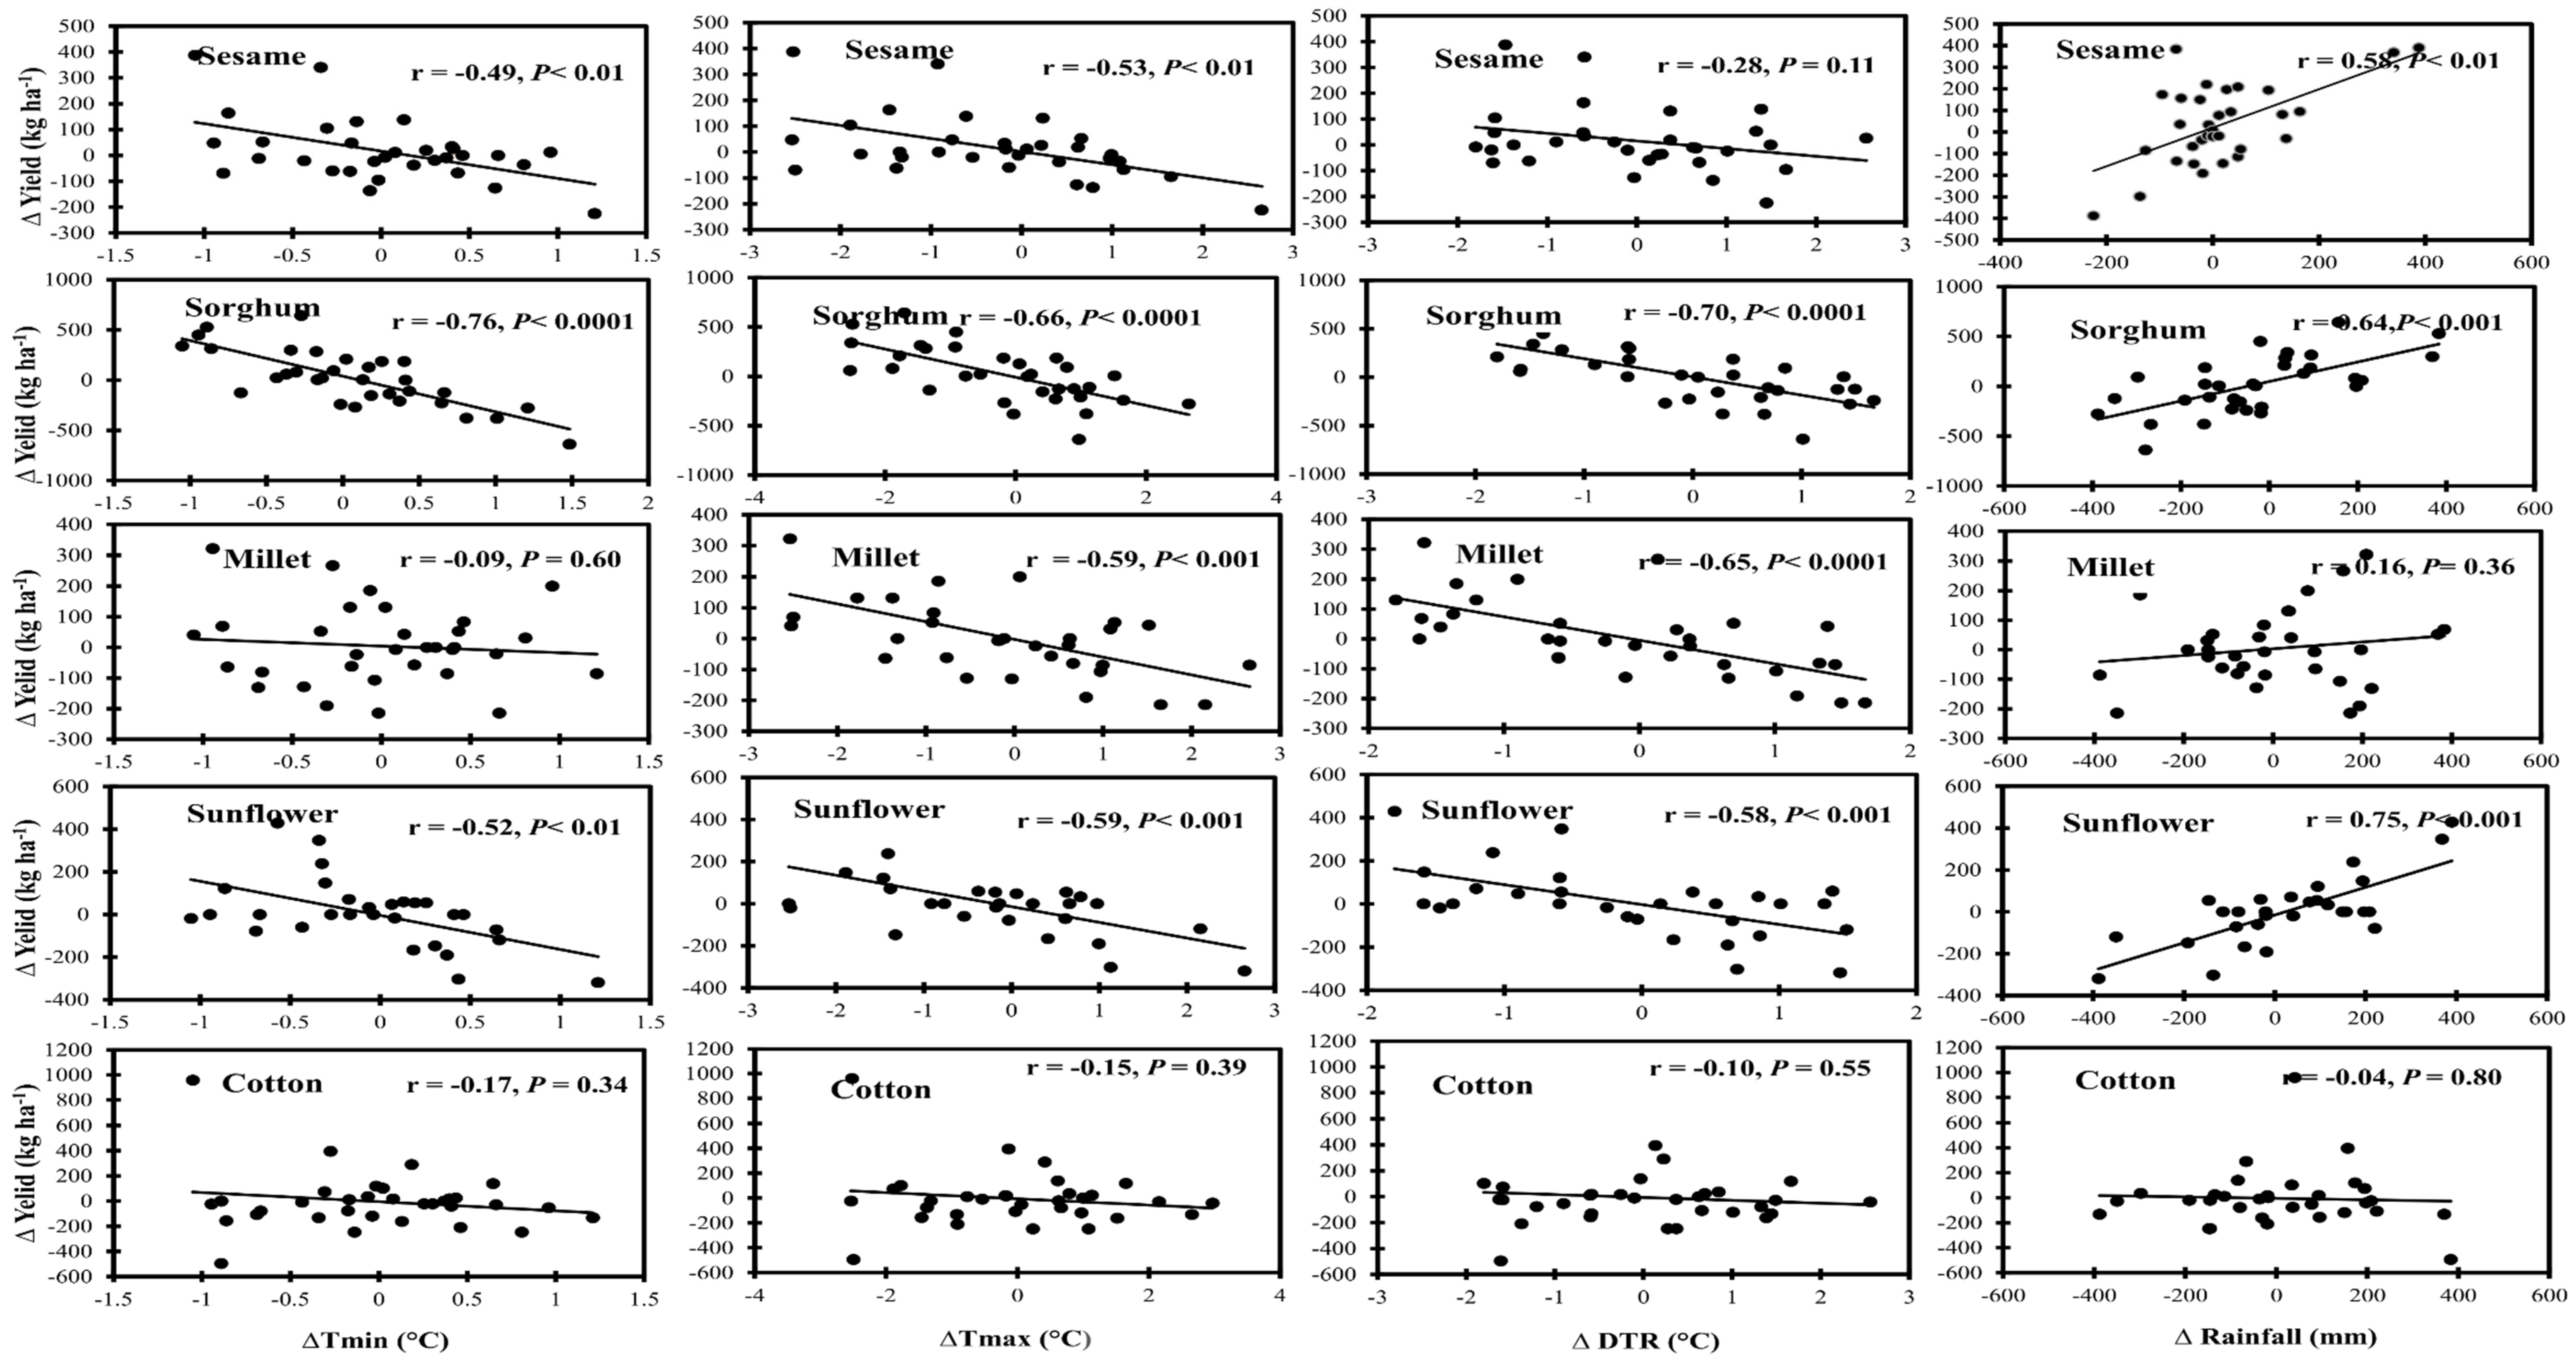
The result of the relationships among crop yield and temperature variables as well as rainfall, as assessed using Pearson’s correlation, are presented in Figure 8. There were negative relationships among the temperature-based variables (Tmin, Tmax, and DTR) and crop yield, whereas the relationships among rainfall and crop yield were positive. The associations among all studied climate variables and most of the crop yields were significantly correlated (p < 0.01), with correlation coefficient values of above 0.5, except for millet and Tmin and rainfall, cotton and all climate variables, and sesame and DTR (Figure 8).
The results of the multiple linear regression analysis estimating the changes in yield of each of the five crops as a function of temperature-based and rainfall predictor variables are presented in Table 5. When all the climate variables were combined in one linear model, the result showed that 50% to 70% of sorghum, millet, and sunflower yield variabilities could be explained by the studied climatic variables. This was also confirmed by the cross-validated R2, which ranged between 0.54 and 0.69, attesting to the certainty of the crop yield estimate models (Table 5). However, the regression coefficients were only significant (p < 0.05) for Tmin and DTR on sorghum yield changes. In addition, the coefficients of Tmin and Tmax were significant (p < 0.05) for the change in millet yield model, and rainfall in the sunflower yield model (Table 5). For sesame and cotton, only 41% and 6% of their yield variability, respectively, could be explained by the climatic predictor variables, indicating a very weak relationship between these variables and the change in yield of these two crops.

4. Discussion

In this study, we provided information on climate trends and their effect on the yield of five main crops grown in Gedaref state, which is the most important rainfed agricultural area in Sudan that lies in the semi-arid region. The crops were grown under rainfed conditions during the rainy season (June–October). Our results showed that there is an increasing trend of annual temperature over the last 35 years. These results agree with the findings of Loh et al. [48], who reported an increase in mean annual temperature trend by 0.06 °C per year for the period between 1985–2015 in the Eastern part of Sudan. A similar trend was also reported for semi-arid regions of Iran where Tmin and Tmax increased over the last 50 years [49]. However, our study showed that the DTR annual trend decreased by 0.23 per decade, which was indicated by a narrowing range of Tmin and Tmax. The trends of Tmin for all seasons of the year (winter, summer, and autumn) increased, while the DTR trend decreased between 1984 and 2018. Our results are also following the findings of Elagib [50], who reported a rise in temperature in Sudan with a warming rate of 0.424, 0.357, and 0.451 °C per decade for summer, winter, and autumn seasons, respectively, between 1941 and 2005. Yet, it has been argued that an increase in mean temperature by 2.6 °C should be expected in the study area in 2070 [51] and that might have a serious impact on crop production. The rainfall trend analysis for the five locations in Gedaref state showed variation in annual rainfall, which could be explained by the fact that rainfall varies from one location to another. Nevertheless, coefficient of variation for rainfall amongst the five locations was almost similar except for El hawata, where rainfall variation was slightly higher. The trend of the overall mean for the five locations showed an increase in rainfall trend in Gadaref by ≈1 mm for the years between 1980 and 2018. However, the projected regional climatic model showed that the annual amount of rainfall in Gadaref state might decrease by 50 mm by the end of this century [51].
The standardized anomalies of annual mean temperature revealed that there was a cold period between 1984 and 2000 in our study area, which is indicated by anomalies below the long-term temperature average. However, after the year 2000, temperatures above the long-term average were detected, indicating a warm period. In fact, temperature had increased by 1.5 °C above average in the years spanning 2009, 2010, 2015, and 2016, and this warming continued until the year 2018. The year-to-year departures were not reported for temperature anomalies, suggesting that the changes for some years were slightly around the mean [30]. Similarly, the standardized anomalies of annual rainfall indicated that the year 1984 took the first highest position of rainfall deficit occurrence, followed by the years 1990, 1991, 2013, 2011, and 1987, respectively. These anomalies in annual rainfall showed that the years with rainfall deficit corresponded to the true occurrence of droughts in Sudan. For example, the rainfall deficit in 1984 led to drought throughout the country, which resulted in a famine and the death of thousands of people within the country [52]. Overall, it is clear that the mean annual temperature between 1984 and 2018 was characterized by variability at a decadal scale, unlike the annual rainfall series, which is characterized by variability between the years. The results showed that an increase in the length of the rainy season significantly increased the yield of sesame, sorghum, sunflower, and cotton. These results agree with the findings of Murenzi [20], who showed a positive relationship between the length of the rainy season and maize yield in Rwanda. However, the relationship between the length of the rainy season and cotton yield should be interpreted with caution as it could have been affected by the outliers when the change in the rainy season was above 36 days and cotton yield was more than 600 kg ha−1 (Figure 7). In addition, there was no clear relationship between the length of the rainy season and the yield of millet. This could be attributed to the fact that millet is a drought-tolerant crop with low water requirements; a characteristic that enables the crop to tolerate the terminal drought that usually occurs towards the end of the growing season during the grain filling stage [53].
The yield trend of sorghum, millet, and cotton decreased by 0.409 kg ha−1, 0.025 kg ha−1, and 0.018 kg ha−1, respectively; however, the decreases in yields have fluctuated over the years. Obviously, the fluctuating rainfall trend is associated with the fluctuation and decrease in yield of sorghum, millet, and cotton. This suggests that there is a meaningful trend in the association between these crops’ yield and rainfall. In the case of sorghum, the results were consistent with a previous study in the Gedaref region, which showed that rainfall shortage or flood can lead to a reduction in sorghum yield [54]. Our findings are similar to those reported by Rowhani et al. [55], who found a positive correlation between rainfall and sorghum yield in Tanzania, with intra-seasonal variability having a negative impact on yield. Likewise, our results agree with previous results from a study by Ibrahim [56], who concluded that the fluctuations in the amount of rainfall were the most important factor that influenced the yield of sesame in Sudan. In the case of millet, the yield trend was decreasing with the decrease in rainfall trend, as reported by Traore et al. [57]. However, the trend showed that yield reduction of millet was only −0.025 kg ha−1, compared to the other crops that require a high amount of water such as sorghum. Similarly, correlation analysis revealed that the association between the amount of rainfall and millet yield was weak and not significant, which, again confirms the low water requirements of this crop. The fluctuation in cotton yield was previously attributed to the variation in the amount of rainfall [58] when the crop is grown under rainfed conditions. Indeed, in the present study, rainfall amount was positively correlated with the yield of all crops, except cotton. When compared to other crops, water requirement by cotton depends on the length of the growing period and the favorite climatic conditions. In addition, continuous rain during the flowering and boll opening stages of cotton crop impairs pollination and thus the final crop yield [59].
In our study, temperatures were negatively correlated with crop yield regardless of the crop type. A study by Rowhani et al. [55] in Tanzania reported that the variability in the mean seasonal temperature had a negative effect on sorghum yield. This previous finding agrees with our results that showed a negative correlation between sorghum yield and the studied temperature-based variables. It has also been reported by Hammer el al. [60] that high temperature shortens the development time of sorghum, but it also leads to a significant reduction in plant height, pollen viability, and seed set, and, as a consequence, reduction in crop yield. Therefore, temperature rise, in light of global warming, might reduce the yield of sorghum in Sudan and this may have a serious consequence on food and nutrition security countrywide. Our study shows that temperature-based variables (Tmin, Tmax, and DTR) were negatively correlated with sesame yield in Gedaref state. This is consistent with the report of Nath et al. [61], who showed that the ambient temperature of 30 °C can negatively affect sesame yield in India. In addition, Kumazaki et al. [62] showed that day and night temperatures of 23 and 18 °C, respectively, affected the stem growth of sesame and that flowering of the crop also did not occur under these unfavorable conditions. Similarly, the temperature had a negative effect on the yield of millet, sunflower, and cotton. It is anticipated that this could be due to the effects of increased temperature on vegetative growth, flowering, and grain or boll filling stages.
Although the multiple linear regression results showed few significant relationships among climate variables and crop yield, the regression coefficients can be used to determine the effects of the studied climatic variables on the yield changes of the five crops [47]. For example, an increase in Tmin by 1 °C led to a reduction in the yield of sesame and sorghum by 23.3 and 260.2 kg ha−1, respectively. In addition, the sign of the regression coefficients in the regression model can indicate the direction of change in the yield versus climate variable changes [40]. Our multiple linear regression model captured between 6% and 70% variability in crop yield as a function of climatic factors. This indicates that the variation in the yield is well explained by climatic variables, except for cotton and sesame, where the model captured only 6% and 41% of their yield variations. The rest of the variations in yield that the model could not capture as a function of the climatic variables could be explained by the variance that is due to the other factors, such as fertilizer and pesticides application, and weed control, among other confounding factors. Also, it has been demonstrated that plant density in the farm is one of the most important factors that influences sesame yield [63]. A study by Ali et al. [64] in Gedaref showed that planting sesame at 5 cm between rows can increase its yield by 210.18 kg ha−1. For sorghum, our results showed that the climatic variables were responsible for 70% of the variation in its yield. This finding is in agreement with several studies, which revealed that climatic variables are the most important factors affecting sorghum yield, particularly rainfall [65,66]. Indeed, our model showed that an increase in rainfall amount by 1 mm led to an increase in sorghum yield by 0.11 kg ha−1. Also, our results depicted 54% in millet yield change that is explained by the studied climatic variables. For sunflower, our results proved that 61% of its yield change variation could be due to climatic variables. This result corroborates the findings of Mijić et al. [67], who indicated that rainfall before and during the vegetation period has a great effect on sunflower yield.
Overall, the present study has utilized secondary data and no ground survey was conducted for primary data collection. As assessed by the descriptive statistical and normal disruption analyses, the quality of our secondary data met our hypothesis that secondary data should not be highly skewed, with a few outliers, and somewhat fit a normal distribution. However, some data such as Tmin and yield of sesame were either slightly skewed or deviated from a normal distribution. It is worth noting that our long-term (≥35 years) secondary data were consistently collected with no missing values. Our study promotes the movement of open data science, data sharing, and re-use for addressing further research questions. However, our study focused only on climatic factors rather than incorporating other factors that influence yields such as soil properties and farming practices. Such factors could be included in other modelling approaches such as DSSAT and production function. Hence, our crop yield estimate models should be interpreted with some caution, as their certainties (Cross-validated R2) were not high. In this context, we recommend that the crop yield estimate models should further be assessed using an independent test dataset collected at different points in time (e.g., 2019–2021).

5. Conclusions

In conclusion, this study shows that the annual Tmin and Tmax had increased by 0.04 °C and 0.03 °C per year in the period between 1980 and 2018, while DTR decreased by 0.02 °C per year in Gedaref state. Furthermore, the state had cold and warm years between 1984 and 2000, and 2001 and 2018, respectively, and the length of the rainy season in Gedaref state ranged between 57 and 117 days. The trend of annual yield for sorghum had significantly decreased, while sunflower yield had increased in the period between 1970 and 2018. Temperature variables had a negative relationship with the yield of all crops, while an increase in the amount of rainfall significantly increased the yield of sorghum, sesame, and sunflower. Moreover, the increase in the length of the rainy season significantly increased the yield of sesame, sorghum, sunflower, and cotton. There was a high variability in crop yields, for example over 50% variability in the yield of sorghum (R2 = 0.70 and cross-validated R2 = 0.69), millet (R2 = 0.54 and cross-validated R2 = 0.54) and sunflower (R2 = 0.64 and cross-validated R2 = 0.62), which could be related to climatic variables. Our findings could be used to support awareness creation amongst different stakeholders and policymakers on the impacts of climate variability and change on crop production and the need for resource allocation to support uptake of adaptation practices that ensure resilience amongst agricultural communities within the state.

Author Contributions

Conceptualization, M.A.A.O. and J.O.O., methodology, M.A.A.O., J.O.O., and E.M.A.-R., software, M.A.A.O., validation, M.A.A.O., J.O.O., L.A.O., M.M.E. and E.M.A.-R.; formal analysis, M.A.A.O.; investigation, M.A.A.O., J.O.O. and E.M.A.-R.; formal analysis, M.A.A.O.; resources, M.A.A.O.; data curation, M.A.A.O.; writing—original draft preparation, M.A.A.O.; writing—review and editing, M.A.A.O., J.O.O., L.A.O., M.M.E. and E.M.A.-R.; formal analysis, M.A.A.O.; visualization, M.A.A.O., J.O.O., L.A.O., M.M.E. and E.M.A.-R.; formal analysis, M.A.A.O.; supervision, J.O.O., L.A.O., M.M.E. and E.M.A.-R.; formal analysis, M.A.A.O.; funding acquisition, M.A.A.O. All authors have read and agreed to the published version of the manuscript.

Funding

The financial support for this research was provided by the following organizations and agencies: Social and Environment Trade-offs in African Agriculture (SENTINEL) Project, funded by the Global Challenges Research Fund (GCRF) of the Research Councils UK; and a capacity-building competitive grant ‘Training the next generation of scientists’ provided by Carnegie Cooperation of New York through the Regional Universities Forum for Capacity Building in Agriculture (RUFORUM); UK’s Foreign, Commonwealth & Development Office (FCDO); Swedish International Development Cooperation Agency (Sida); the Swiss Agency for Development and Cooperation (SDC); Ethiopian and Kenyan Governments. The first author M.A.A.O was supported by RUFORUM Graduate Teaching Assistantship program (GTA), which is a collaborative scholarship between RUFORUM, University of Gezira, Sudan, and University of Nairobi, Kenya. M.A.A.O also was supported by the International Centre of Insect Physiology and Ecology (icipe).

Data Availability Statement

All data are available in this article.

Acknowledgments

Authors gratefully acknowledge the Ministry of Agriculture of Gedaref state, Sudan and Sudan Metrological Authority for providing the data for this study and Hasabelrasoul Mustafa and Ayman Abdelraheim for the support provided.

Conflicts of Interest

The authors declare no conflict of interest. The funders had no role in the design of the study; in the collection, analyses, or interpretation of data; in the writing of the manuscript, or in the decision to publish the results. Therefore, the views expressed herein do not necessarily reflect the official opinion of the donors.

Appendix A

Figure A1. Histogram, normal distribution, and boxplot fitted for minimum (Tmin) and maximum (Tmax) temperatures (1984–2018) and rainfall (1980–2018) data obtained from the Gedaref meteorological station, Sudan. Circles in some boxplots represent individual outlier observations.
Agronomy 11 01680 g0a1

Appendix B

Figure A2. Histogram, normal distribution, and boxplot fitted for crop yield data obtained from the Ministry of Agriculture, Gedaref, Sudan. The crop yield data were collected in 1970–2018, except for millet and sunflower, which were only available between 1982–2018 and 1987–2018, respectively. Circles in some boxplots represent individual outlier observations.
Agronomy 11 01680 g0a2

References

  1. Intergovernmental Panel on Climate Change (IPCC). Climate Change 2014: Impacts, Adaptation, and Vulnerability. Part B: Regional Aspects; Cambridge University Press: Cambridge, UK, 2014; p. 688.
  2. Déqué, M.; Calmanti, S.; Christensen, O.B.; Aquila, A.D.; Maule, C.F.; Haensler, A.; Nikulin, G.; Teichmann, C. A multi-model climate response over tropical Africa at + 2 °C. Clim. Serv. 2017, 7, 87–95. [Google Scholar] [CrossRef] [Green Version]
  3. Almazroui, M.; Saeed, F.; Saeed, S.; Islam, M.N.; Ismail, M.; Klutse, N.A.B.; Siddiqui, M.H. Projected change in temperature and precipitation over Africa from CMIP6. Earth. Syst. Environ. 2020, 4, 455–475. [Google Scholar] [CrossRef]
  4. Kangalawe, R.Y.; Lyimo, J.G. Climate change, adaptive strategies and rural livelihoods in semiarid Tanzania. Nat. Resour. 2013, 4, 266–278. [Google Scholar] [CrossRef] [Green Version]
  5. Raza, A.; Razzaq, A.; Mehmood, S.S.; Zou, X.; Zhang, X.; Lv, Y.; Xu, J. Impact of climate change on crops adaptation and strategies to tackle its outcome: A review. Plants 2019, 8, 34. [Google Scholar] [CrossRef] [PubMed] [Green Version]
  6. Lemi, T.; Hailu, F. Effects of climate change variability on agricultural productivity. Int. J. Environ. Sci. Nat. Res. 2019, 17, 555953. [Google Scholar] [CrossRef]
  7. Duku, C.; Zwart, S.J.; Hein, L. Impacts of climate change on cropping patterns in a tropical, sub-humid watershed. PLoS ONE 2018, 13, e0192642. [Google Scholar] [CrossRef] [PubMed] [Green Version]
  8. You, L.; Ringler, C.; Wood-Sichra, U.; Robertson, R.; Wood, S.; Zhu, T.; Nelson, G.; Guo, Z.; Sun, Y. What is the irrigation potential for Africa? A combined biophysical and socioeconomic approach. Food Policy 2011, 36, 770–782. [Google Scholar] [CrossRef] [Green Version]
  9. Sawa, B.; Adebayo, A. Effects of pentad dry spells on the yield of some crops in the semi-arid eco-climatic region of northern Nigeria. Zaria Geogr. 2018, 19, 49–60. [Google Scholar]
  10. Mertz, O.; Halsnæs, K.; Olesen, J.E.; Rasmussen, K. Adaptation to climate change in developing countries. Environ. Manag. 2009, 43, 743–752. [Google Scholar] [CrossRef] [Green Version]
  11. Lawson, E.T.; Alare, R.S.; Salifu, A.R.Z.; Thompson-Hall, M. Dealing with climate change in semi-arid Ghana: Understanding intersectional perceptions and adaptation strategies of women farmers. GeoJournal 2020, 85, 439–452. [Google Scholar] [CrossRef] [Green Version]
  12. Eltohami, A. Anthropogenic and Climatic Factors: As Causes of Drought Disaster in Sudan. 2nd World Irrigation Forum (WIF2) 2016. Available online: https://www.icid.org/wif2_full_papers/wif2_w.2.2.11.pdf (accessed on 6 June 2021).
  13. Elhag, K.; Zhang, W. Monitoring and assessment of drought focused on its impact on sorghum yield over Sudan by using meteorological drought indices for the period 2001–2011. Remote Sens. 2018, 10, 1231. [Google Scholar] [CrossRef] [Green Version]
  14. Opere, A. Floods in Kenya. In Kenya: A Natural Outlook: Geo-Environmental Resources and Hazards; Paron, P., Olago, D.O., Omuto, C.T., Eds.; Elsevier: Amsterdam, The Netherlands, 2013; Volume 16, pp. 315–330. [Google Scholar] [CrossRef]
  15. FAO. Plan of Action (2015–2019): Resilient Livelihoods for Sustainable Agriculture, Food Security and Nutrition; FAO: Rome, Italy, 2015. Available online: http://www.fao.org/faolex/results/details/en/c/LEX-FAOC201507/ (accessed on 6 June 2021).
  16. Siddig, K.; Stepanyan, D.; Wiebelt, M.; Grethe, H.; Zhu, T. Climate change and agriculture in the Sudan: Impact pathways beyond changes in mean rainfall and temperature. Ecol. Econ. 2020, 169, 106566. [Google Scholar] [CrossRef] [Green Version]
  17. Mahgoub, F. Current Status of Agriculture and Future Challenges in Sudan; Nordiska Afrikainstitutet: Uppsala, Sweden, 2014; p. 98. Available online: http://urn.kb.se/resolve?urn=urn%3Anbn%3Ase%3Anai%3Adiva-1839 (accessed on 6 June 2021).
  18. Mohmmed, A.; Li, J.; Elaru, J.; Elbashier, M.M.; Keesstra, S.; Artemi, C.; Martin, K.; Reuben, M.; Teffera, Z.; Teffera, Z. Assessing drought vulnerability and adaptation among farmers in Gadaref region, Eastern Sudan. Land Use Policy 2018, 70, 402–413. [Google Scholar] [CrossRef] [Green Version]
  19. Ali, A.B.; Elshaikh, N.A.; Hong, L.; Adam, A.; Haofang, Y. Conservation tillage as an approach to enhance crops water use efficiency. Acta Agric. Scand. B Soil Plant Sci. 2017, 67, 252–262. [Google Scholar] [CrossRef]
  20. Murenzi, H. Investigating the Effect of Climate Variability Maize Yield in Rwanda. Master Dissertation, Department of Meteorology, School of Physical Sciences, University of Nairobi, Nairobi, Kenya, 2018. Available online: https://ccafs.cgiar.org/resources/publications/investigating-effect-climate-variability-maize-yield-rwanda (accessed on 6 June 2021).
  21. Hasan, M.; Kumar, L. Yield trends and variabilities explained by climatic change in coastal and non-coastal areas of Bangladesh. Sci. Total Environ. 2021, 795, 148814. [Google Scholar] [CrossRef] [PubMed]
  22. Glover, E.K.; Elsiddig, E.A. The causes and consequences of environmental changes in Gedaref, Sudan. Land Degrad. Dev. 2012, 23, 339–349. [Google Scholar] [CrossRef]
  23. Idreas, A.E.L.A. Effect of Mechanized Rain Fed Farming on Vegetation Cover and Effect of Shelter Belts on Environment at Ghadambaliya Area Gedaref State (SUDAN). Doctoral Dissertation, Sudan University of Science and Technology, Khartoum, Sudan, 2015. Available online: http://repository.sustech.edu/handle/123456789/13520 (accessed on 1 June 2021).
  24. Yagoub, Y.E.; Li, Z.; Musa, O.S.; Anjum, M.N.; Wang, F.; Xu, C.; Bo, Z. Investigation of vegetation cover change in Sudan by using modis data. J. Geogr. Inf. Syst. 2017, 9, 279. [Google Scholar] [CrossRef] [Green Version]
  25. Elagib, N.A.; Khalifa, M.; Rahma, A.E.; Babker, Z.; Gamaledin, S.I. Performance of major mechanized rainfed agricultural production in Sudan: Sorghum vulnerability and resilience to climate since 1970. Agric. For. Meteorol. 2019, 276, 107640. [Google Scholar] [CrossRef]
  26. Klayman, D. Statistical and Graphical Procedures for Evaluating Data Quality: The Case of Large-Scale Data Collection and Monitoring System. J. Appl. Sociol. 2002, 19, 22–34. [Google Scholar]
  27. Mann, H.B. Nonparametric tests against trend. Econometrica 1945, 13, 245–259. Available online: https://www.jstor.org/stable/1907187 (accessed on 5 May 2021). [CrossRef]
  28. Kendall, M.G. Rank Correlation Methods; Charles Griffin: London, UK, 1948. [Google Scholar]
  29. Sen, P.K. Estimates of the regression coefficient based on Kendall’s tau. J. Am. Stat. Assoc. 1968, 63, 1379–1389. [Google Scholar] [CrossRef]
  30. Koudahe, K.; Kayode, A.J.; Samson, A.O.; Adebola, A.A.; Djaman, K. Trend analysis in standardized precipitation index and standardized anomaly index in the context of climate change in Southern Togo. Atmos. Clim. Sci. 2017, 7, 401–423. [Google Scholar] [CrossRef] [Green Version]
  31. Stern, R.; Parsons, D.; Stern, D.; Torgbor, F. R Instat. 2020. Available online: http://r-instat.org/ (accessed on 6 June 2021).
  32. Ngetich, K.F.; Mucheru-Muna, M.; Mugwe, J.N.; Shisanya, C.A.; Diels, J.; Mugendi, D.N. Length of growing season, rainfall temporal distribution, onset and cessation dates in the Kenyan highlands. Agric. For. Meteorol. 2014, 188, 24–32. [Google Scholar] [CrossRef]
  33. Ntirenganya, F. Analysis of rainfall variability in Rwanda for small-scale farmers coping strategies to climate variability. East. Afri. J. Sci. Techn. 2018, 8, 75–96. [Google Scholar]
  34. Ojara, M.A.; Lou, Y.; Aribo, L.; Namumbya, S.; Uddin, M.J. Dry spells and probability of rainfall occurrence for Lake Kyoga Basin in Uganda, East Africa. Nat. Hazards 2020, 100, 493–514. [Google Scholar] [CrossRef]
  35. Sibanda, S.; Grab, S.W.; Ahmed, F. Long-term rainfall characteristics in the Mzingwane catchment of south-western Zimbabwe. Theor. Appl. Climatol. 2020, 139, 935–948. [Google Scholar] [CrossRef]
  36. Tadross, M.A.; Hewitson, B.C.; Usman, M.T. The interannual variability of the onset of the maize growing season over South Africa and Zimbabwe. J. Clim. 2005, 18, 3356–3372. [Google Scholar] [CrossRef]
  37. Moyo, M.; Dorward, P.; Craufurd, P. Characterizing long term rainfall data for estimating climate risk in semi-arid Zimbabwe. In Climate Change Adaptation in Africa; Leal Filho, W., Belay, S., Kalangu, J., Menas, W., Munishi, P., Musiyiwa, K., Eds.; Springer International Publishing: New York, NY, USA, 2017; pp. 661–675. [Google Scholar] [CrossRef]
  38. Setiawan, B.I. A simple method to determine patterns of wet and dry seasons. IOP Conf. Ser. Earth Environ. Sci. 2020, 542, 012055. [Google Scholar] [CrossRef]
  39. Laux, P.; Jäckel, G.; Tingem, M.R.; Kunstmann, H. Onset of the rainy season and crop yield in West Africa. In Proceedings of the EGU General Assembly Conference, Vienna, Austria, 19–24 April 2009; p. 11276. Available online: https://ui.adsabs.harvard.edu/abs/2009EGUGA..1111276L/abstract (accessed on 3 August 2021).
  40. Nicholls, N. Increased Australian wheat yield due to recent climate trends. Nature 1997, 387, 484–485. [Google Scholar] [CrossRef]
  41. Hoogenboom, G.; Porter, C.H.; Boote, K.J.; Shelia, V.; Wilkens, P.W.; Singh, U.; White, J.W.; Asseng, S.; Lizaso, J.I.; Moreno, L.P.; et al. The DSSAT crop modeling ecosystem. In Advances in Crop Modeling for a Sustainable Agriculture; Boote, K.J., Ed.; Burleigh Dodds Science Publishing: Cambridge, UK, 2019; pp. 173–216. [Google Scholar] [CrossRef]
  42. Ding, Z.; Ali, E.F.; Elmahdy, A.M.; Ragab, K.E.; Seleiman, M.F.; Kheir, A.M.S. Modeling the combined impacts of deficit irrigation, rising temperature and compost application on wheat yield and water productivity. Agric. Water Manag. 2021, 244, 106626. [Google Scholar] [CrossRef]
  43. Lobell, D.B.; Field, C.B. Global scale climate–crop yield relationships and the impacts of recent warming. Environ. Res. Lett. 2007, 2, 014002. [Google Scholar] [CrossRef]
  44. Peltonen-Sainio, P.; Jauhiainen, L.; Trnka, M.; Olesen, J.E.; Calanca, P.; Eckersten, H.; Eitzinger, J.; Gobin, A.; Kersebaum, K.C.; Kozyra, J.; et al. Coincidence of variation in yield and climate in Europe. Agric. Ecosyst. Environ. 2010, 139, 483–489. [Google Scholar] [CrossRef]
  45. El-Maayar, M.; Lange, M.A. A methodology to infer crop yield response to climate variability and change using long-term observations. Atmosphere 2013, 4, 365–382. [Google Scholar] [CrossRef] [Green Version]
  46. Zhang, Z.; Liu, X.; Wang, P.; Shuai, J.; Chen, Y.; Song, X.; Tao, F. The heat deficit index depicts the responses of rice yield to climate change in the northeastern three provinces of China. Reg. Environ. Chang. 2014, 14, 27–38. [Google Scholar] [CrossRef]
  47. Poudel, S.; Shaw, R. The relationships between climate variability and crop yield in a mountainous environment: A case study in Lamjung district, Nepal. Climate 2016, 4, 13. [Google Scholar] [CrossRef] [Green Version]
  48. Loh, P.S.; Alnoor, H.I.M.; He, S. Impact of climate change on vegetation cover at south Port Sudan area. Climate 2020, 8, 114. [Google Scholar] [CrossRef]
  49. Bannayan, M.; Asadi, S.; Nouri, M.; Yaghoubi, F. Time trend analysis of someagroclimatic variables during the last half century over Iran. Theor. Appl. Climatol. 2020, 140, 839–857. [Google Scholar] [CrossRef]
  50. Elagib, N.A. Trends in intra-and inter-annual temperature variabilities across Sudan. Ambio 2010, 39, 413–429. [Google Scholar] [CrossRef] [Green Version]
  51. Platts, P.J.; Omeny, P.; Marchant, R. AFRICLIM: High-resolution climate projections for ecological applications in Africa. Afr. J. Ecol. 2015, 53, 103–108. [Google Scholar] [CrossRef] [Green Version]
  52. Hamid, A.A.; Eltayeb, Y.H. Space Borne Technology for Drought Monitoring in Sudan. Presentation, 2017. Available online: http://www.un-spider.org/sites/default/files/Hamid.pdf (accessed on 6 June 2021).
  53. Tadele, Z. Drought Adaptation in Millets. In Abiotic and Biotic Stress in Plants: Recent Advances and Future Perspectives; Shanker, A., Shanker, C., Eds.; InTech: Rijeka, Croatia, 2016; pp. 639–662. [Google Scholar]
  54. Khalifa, E.A. Volatility of sorghum production under rainfall system in Gadarif State, Sudan. Russ. J. Agric. Socio-Econ. Sci. 2016, 56, 137–144. [Google Scholar] [CrossRef]
  55. Rowhani, P.; Lobell, D.B.; Linderman, M.; Ramankutty, N. Climate variability and crop production in Tanzania. Agric. For. Meteorol. 2011, 151, 449–460. [Google Scholar] [CrossRef]
  56. Ibrahim, A.M. The impact of rainfall on the yields of staple crops-sorghum and sesame in Sudan. J. Plant Sci. Res. 2015, 2, 1–4. [Google Scholar]
  57. Traore, K.; Sidibe, D.K.; Coulibaly, H.; Bayala, J. Optimizing yield of improved varieties of millet and sorghum under highly variable rainfall conditions using contour ridges in Cinzana, Mali. Agric. Food Secur. 2017, 6, 1–13. [Google Scholar] [CrossRef] [Green Version]
  58. Sultan, B.; Bella-Medjo, M.; Berg, A.; Quirion, P.; Janicot, S. Multi-scales and multi-sites analyses of the role of rainfall in cotton yields in West Africa. Int. J. Climatol. 2010, 30, 58–71. [Google Scholar] [CrossRef]
  59. Cetin, O.; Basbag, S. Effects of climatic factors on cotton production in semi-arid regions—A review. Res. Crop. 2010, 11, 785–791. [Google Scholar]
  60. Hammer, G.; Chapmanz, S.; Singhl, V.; Nguyenl, C.; van Oosteroml, E.; McLeang, G.; Zheng, B.; Jordan, D. Grain sorghum varietal reactions to heat stress and environment. Grains Res. Dev. Coop. 2015, 212. Available online: https://grdc.com.au/resources-and-publications/grdc-update-papers/tab-content/grdc-update-papers/2015/07/grain-sorghum-varietal-reactions-to-heat-stress-and-environment. (accessed on 3 August 2021).
  61. Nath, R.; Chakraborty, P.K.; Chakraborty, A. Effect of climatic variation on yield of sesame (Sesamum indicum L.) at different dates of sowing. J. Agron. Crop. Sci. 2001, 186, 97–102. [Google Scholar] [CrossRef]
  62. Kumazaki, T.; Yamada, Y.; Karaya, S.; Tokumitsu, T.; Hirano, T.; Yasumoto, S.; Katsuta, M.; Michiyama, H. Effects of day length and air temperature on stem growth and flowering in sesame. Plant Prod. Sci. 2008, 11, 178–183. [Google Scholar] [CrossRef]
  63. Öztürk, Ö.; Şaman, O. Effects of different plant densities on the yield and quality of second crop sesame. Int. J. Agric. Biol. Eng. 2012, 6, 644–649. [Google Scholar] [CrossRef]
  64. Ali, A.Y.A.; Guisheng, Z.; Hassan, A.; Yagoub, S.O.; Farah, G.A.; Ahamed, N.E.; Ibrahim, E.G. Sesame seed yield and growth traits response to different row spacings in semi-arid regions. Univers. J. Agric. Res. 2020, 8, 88–96. [Google Scholar] [CrossRef]
  65. Msongaleli, B.M.; Tumbo, S.D.; Kihupi, N.I.; Rwehumbiza, F.B. Performance of sorghum varieties under variable rainfall in central Tanzania. Int. Sch. Res. Not. 2017, 2017, 2506946. [Google Scholar] [CrossRef] [Green Version]
  66. Mundia, C.W.; Secchi, S.; Akamani, K.; Wang, G. A regional comparison of factors affecting global sorghum production: The case of North America, Asia and Africa’s Sahel. Sustainability 2019, 11, 2135. [Google Scholar] [CrossRef] [Green Version]
  67. Mijić, A.; Liović, I.; Kovačević, V.; Pepó, P. Impact of weather conditions on variability in sunflower yield over years in eastern parts of Croatia and Hungary. Acta Agron. Hung. 2012, 60, 397–405. [Google Scholar] [CrossRef]
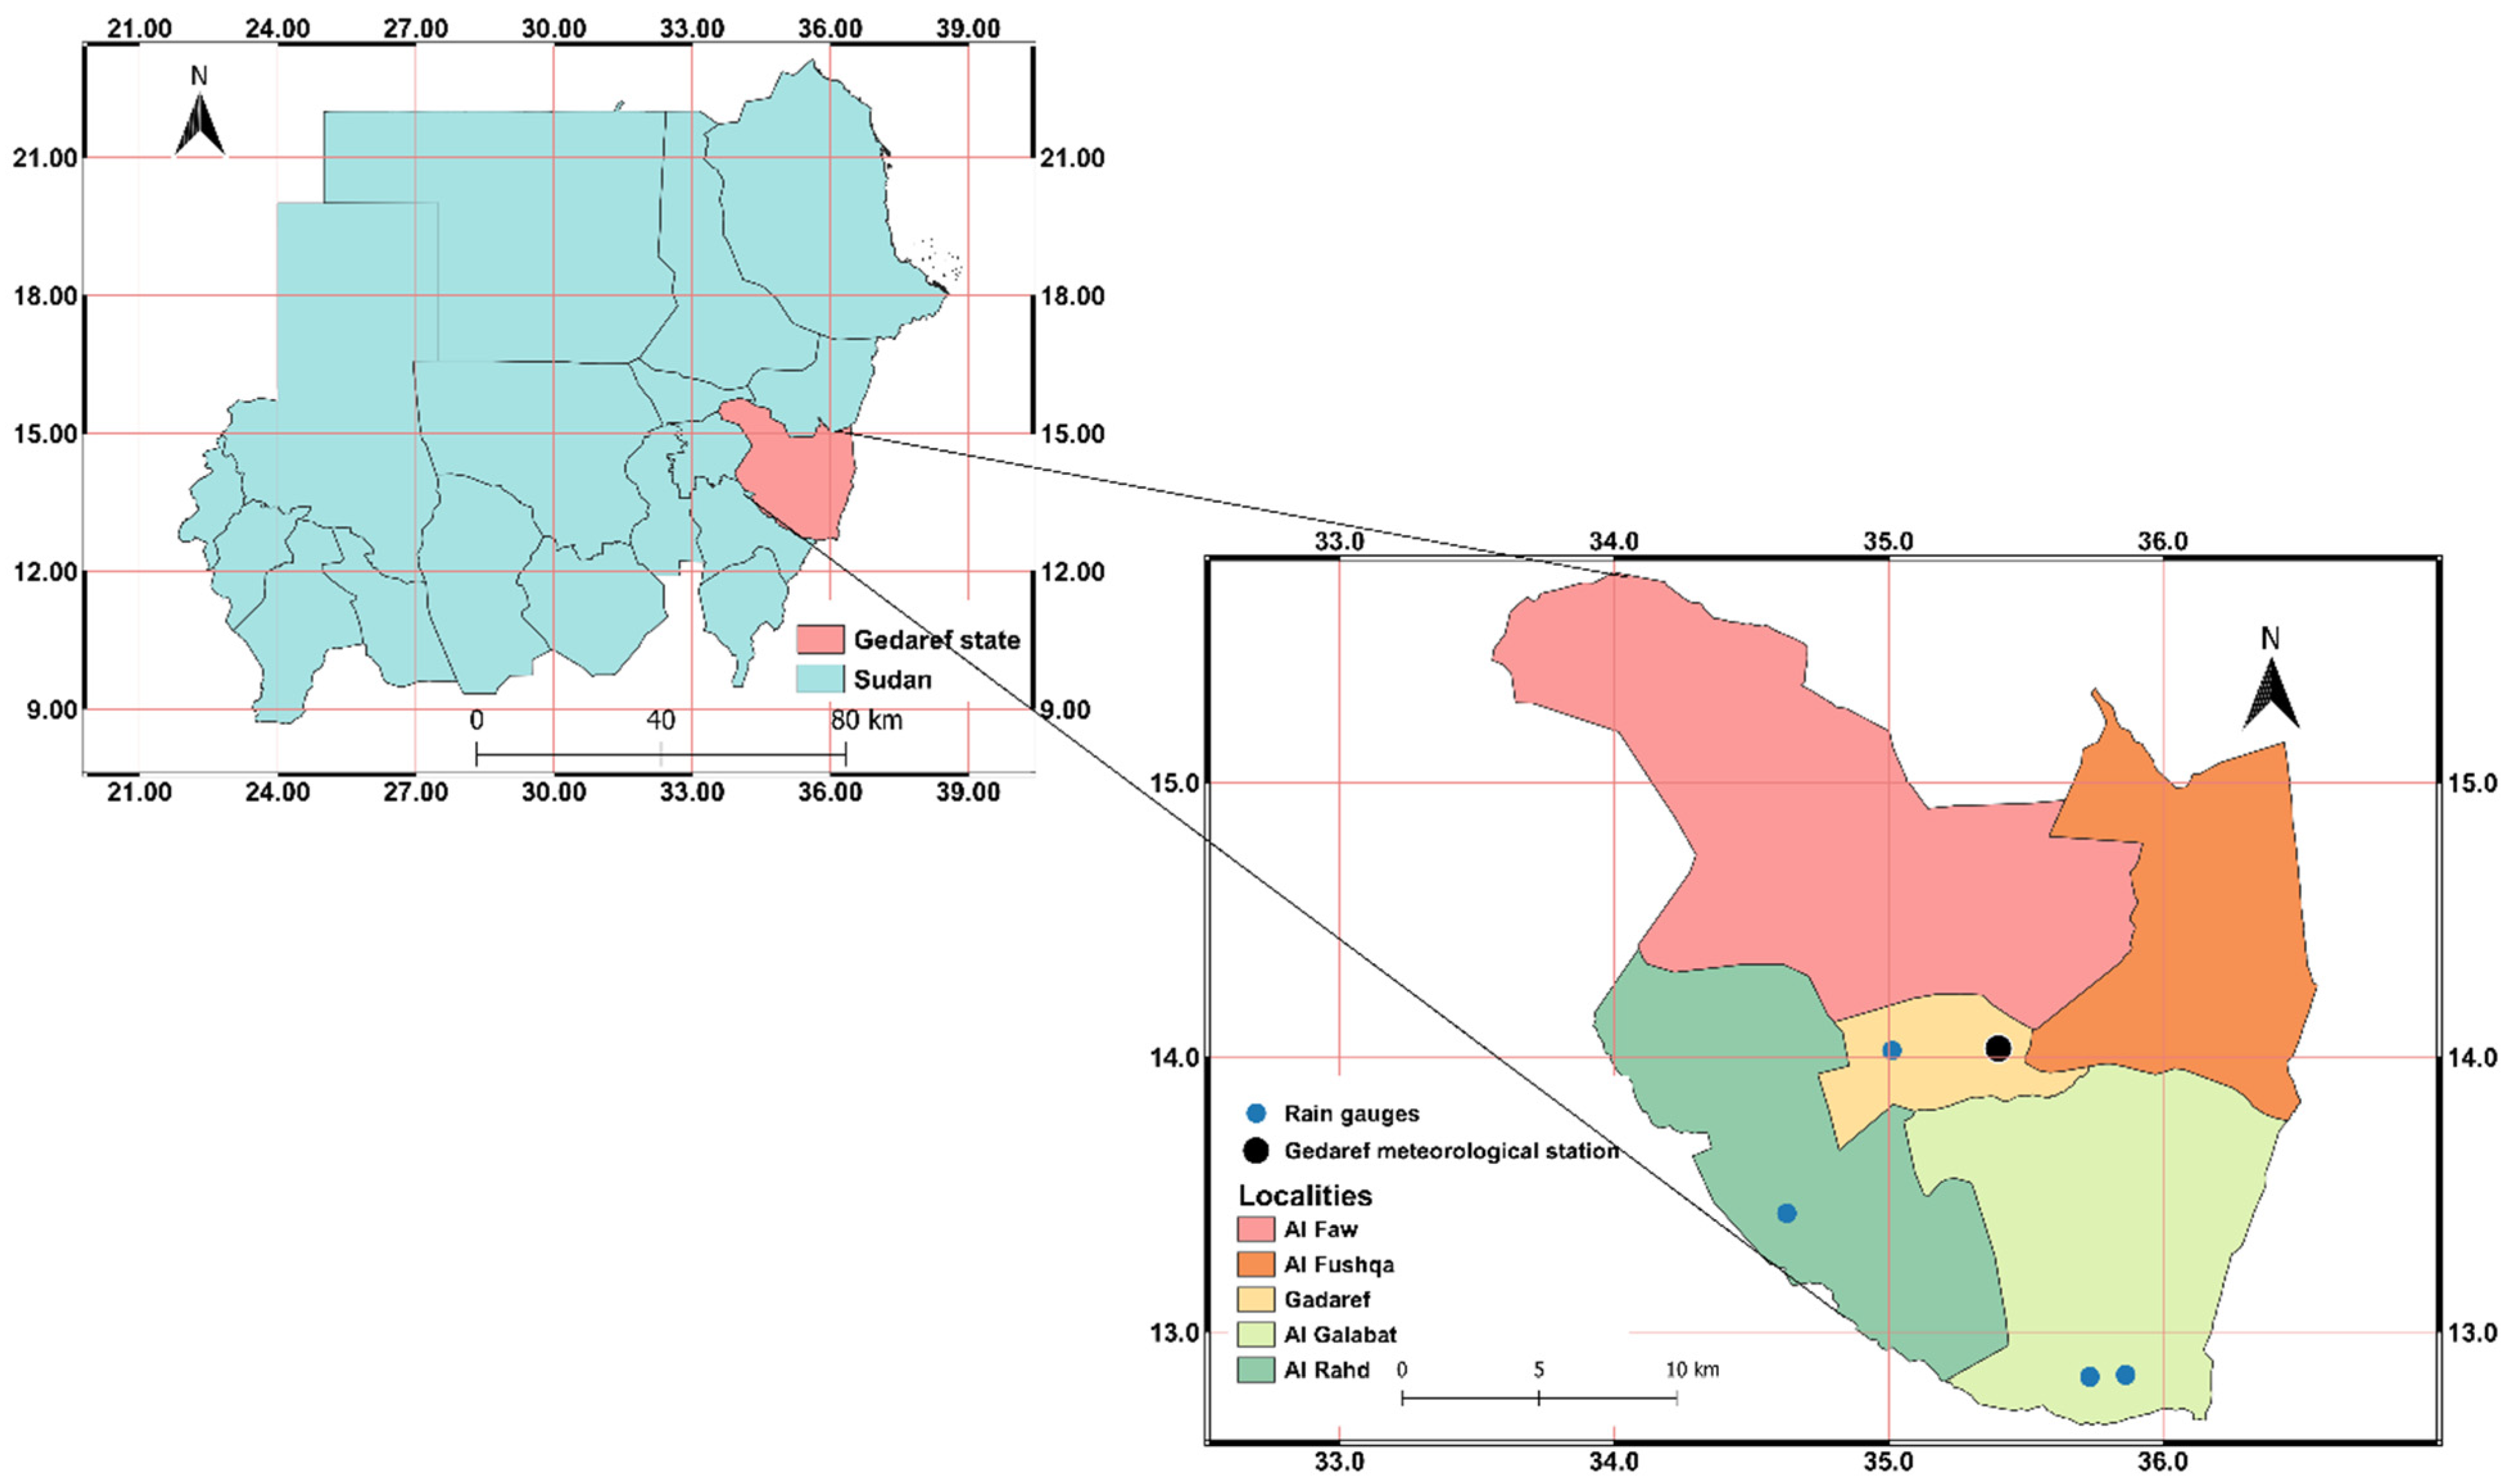
Figure 1. Location of Gedaref state in Sudan.
Agronomy 11 01680 g001
Figure 2. Boxplot showing the monthly rainfall in Gedaref state, Sudan between 1984–2018. The red arrows show the main crop cultivation period. Median rainfall values are shown by the bold lines within the boxes and the circles show outliers.
Agronomy 11 01680 g002
Figure 3. Annual and seasonal temperature trends in Gedaref state, Sudan between 1984 and 2018. (A): maximum temperature, (B): minimum temperature, and (C): diurnal temperature range.
Agronomy 11 01680 g003
Figure 4. Annual rainfall trends in five locations in Gedaref state, Sudan between 1980 and 2018. (A): Gedaref, (B): El gadabalea, (C): Am Senat, (D): Samsam, (E): El hawata, and (F): Average rainfall for all five locations.
Agronomy 11 01680 g004
Figure 5. Annual crop yield trends for the major crops grown in Gedaref State, Sudan from 19702018, (A): sorghum, (B): sesame (C): cotton, (D): millet and (E): sunflower yield trends.
Agronomy 11 01680 g005
Figure 6. Standardized anomaly index for mean temperature (A), and annual rainfall (B) in Gedaref State, Sudan from 19842018.
Agronomy 11 01680 g006
Figure 7. Relationships between the length of the rainy season and yield of five major crops grown in Gedaref state, Sudan. R2 is coefficient of determination.
Agronomy 11 01680 g007
Figure 8. Associations, as assessed by a Pearson’s correlation analysis, among climatic variables and yield of five major crops grown in Gedaref State, Sudan. r is correlation coefficient.
Agronomy 11 01680 g008
Table 1. Estimated Sen’s slope values for the annual and seasonal temperature (°C) trends at Gedaref state, Sudan between 1984–2018.
ParameterRangeSen’s Slope95% Confidence IntervalCoefficient of Variation (CV %)p-Value
MinimumMaximum
Annual Tmin20.81723.2660.0450.031–0.0612.65<0.0001
Annual Tmax36.10038.3430.0300.014–0.0434.330.001
Annual DTR14.06416.090−0.023−0.234–0.1426.82<0.003
Winter Tmin17.24821.2830.0480.025–0.0704.29<0.001
Winter Tmax34.68737.5480.017−0.001–0.0391.740.069
Winter DTR15.66118.350−0.037−0.207–0.1923.38<0.001
Summer Tmin22.95725.8380.0560.036–0.0712.83<0.0001
Summer Tmax38.80941.7710.0390.014–0.633.190.003
Summer DTR15.03417.174−0.009−0.304–0.2463.190.288
Autumn Tmin21.34923.6370.0380.023–0.0512.33<0.0001
Autumn Tmax33.22836.6760.002−0.026–0.0342.580.809
Autumn DTR11.07315.207−0.026−0.001–0.3126.810.045
Tmin, Tmax and DTR are minimum temperature, maximum temperature and diurnal temperature range, respectively.
Table 2. Estimated Sen’s slope values for annual rainfall (mm) trends reported at different stations in Gedaref State, Sudan between 1980 and 2018.
LocationRangeSen’s Slope95% Confidence IntervalCoefficient of Variation (CV %)p-Value
MinimumMaximum
Gedaref322.000871.000−0.323−3.967–3.63621.290.841
El gadabalea285.000755.0002.5711.032–5.53321.630.217
Am Senat435.0001070.0003.100−1.250–7.09122.350.150
Samsam420.0001023.000−3.222−7.757–0.76920.590.131
El hawata222.000809.0002.611−1.679–7.15226.570.183
Mean for all five locations425.4000753.80000.9627−34.200–41.08014.730.4135
Table 3. Estimated slope of linear regression for the annual yield trends for five crops (sesame, sorghum, cotton, millet, and sunflower) in Gedaref state, Sudan from 19702018.
Crop YieldRangeSlope95% Confidence IntervalCoefficient of Variation (CV %)p-Value
MinimumMaximum
Sorghum185.7181000.020−0.409 −0.676–−0.14137.850.003
Sesame111.907780.0160.163−0.127–0.45340.780.263
Cotton58.0961190.500−0.018−0.311–0.27655.490.905
Millet216.671642.870−0.025−0.368–0.31829.290.883
Sunflower238.100833.3500.6070.310–0.90330.160.000
Table 4. Estimated length of the rainy season (1984–2018) for Gedaref State, Sudan.
SeasonOnset DateDay of the Year for OnsetCessation DateDay of the Year for CessationLength of the Rainy Season (Day) Total Rain (mm)
19847-July18916-September26076286
198520-June17112-October285114669
198629-June1803-October27596525
198719-June17012-October285115445
198829-June18118-September26281532
198922-June17319-September26289682
199015-June16625-September268102335
199113-July1291-October27480308
19924-July18613-October287101520
199318-June16928-September271102693
199417-June16824-September26799579
199517-June16819-September26294499
199622-June17430-September274100576
199725-June16624-September26791505
199817-July19810-October28385552
199920-June1718-October281110766
200024-June1761-October27599621
200123-June1747-October280106430
200210-July19121-September26473629
200321-June1722-October275103820
200420-June17210-October284112579
200522-June17320-September26390504
200619-June17028-September271101626
200724-June1757-September25075575
200823-June17512-September25681528
20092-July18315-September25875510
201023-June17414-October287113544
201119-June17013-September25686408
201223-June17528-August24166511
201321-July20216-September25957418
201424-June1754-October277102787
20159-July19028-September27181399
201618-June17013-October287117440
201718-June1696-September24980535
201829-June18029-September27292556
Table 5. Multiple linear regression terms and R2 values for estimating yield, as a function of climatic variables, of five major crops grown in Gedaref state, Sudan.
CropInterceptTmin (°C)Tmax (°C)DTR (°C)Rainfall (mm)R2Cross−Validated R2
SesameCoefficient−0.734−23.337−32.20610.8910.2390.410.38
p−value0.960.590.220.640.07
SorghumCoefficient33.980−260.21340.452−132.3450.1100.700.69
p−value0.293<0.0010.42<0.050.65
MilletCoefficient−8.578217.319−191.497102.271−0.0210.540.54
p−value0.61< 0.05< 0.050.190.84
SunflowerCoefficient−16.7469.8571−16.042−25.4350.5360.610.62
p−value0.430.870.650.49<0.01
CottonCoefficient−3.610−93.661−17.0700.000−0.2770.060.08
p−value0.930.400.67-0.33
Tmin, Tmax and DTR are minimum temperature, maximum temperature and diurnal temperature range, respectively.
Publisher’s Note: MDPI stays neutral with regard to jurisdictional claims in published maps and institutional affiliations.