Article

Pre-Symptomatic Disease Detection in the Vine, Chrysanthemum, and Rose Leaves with a Low-Cost Infrared Sensor

Department of Agriculture Crop Production and Rural Environment, University of Thessaly, Fytokou St., N. Ionia, GR-38446 Magnesia, Greece
*
Author to whom correspondence should be addressed.
Agronomy 2021, 11(9), 1682; https://doi.org/10.3390/agronomy11091682
Submission received: 29 June 2021 / Revised: 19 August 2021 / Accepted: 20 August 2021 / Published: 24 August 2021

Abstract

:
Thermography is a technique based on infrared imaging, which is used nowadays to detect plants under stress caused by biotic and abiotic factors. In many cases, temperature changes have already been correlated with pathogen attacks. In this sense, thermography offers the ability of early disease detection in plant pathology. In this work, a low-cost AMG8833 Grind-Eye infrared camera combined with a 1080P RGB web camera was used to develop an integrated infrared and RGB imaging system, to record temperature changes on vine, chrysanthemum, and rose plant leaf surfaces. Vine and chrysanthemum leaves were infected with Phomopsis viticola and Septoria ssp. respectively, respectively, whereas rose plants leaves were infected with Colletotrichum spp. as well as with Podosphaera pannosa. Measurements were performed using the integrated imaging system on infected and uninfected leaves, as well as on PDA plates with active and non-active mycelium. According to the results, vine leaf tissue infected with P. viticola and rose plants leaf tissue infected with P. pannosa had a pre-symptomatic (four days after infection) decrease in temperature up to 1.6 and 1.1 °C, respectively, compared with uninfected tissue. In contrast chrysanthemum leaf tissue infected with Septoria ssp. and rose plant leaf tissue infected with Colletotrichum spp. had a pre-symptomatic (four days after infection) increased temperature up to 1.1 °C and 1.0 °C, respectively, compared with uninfected tissue. In vitro measurements showed that the active fungi mycelium had approximately 1.1 to 2.1 °C lower temperature than the non-active mycelium. The results above show that the integrated infrared and RGB imaging system developed in this work can be used to detect early disease infection before visible symptoms appeared, facilitating the decision-making process.

1. Introduction

Early detection of plant disease infection plays a crucial role in their management and prevention strategies [1,2,3]. Most plant diseases are caused by fungal organisms and express characteristic visible disease symptoms on plants (e.g., lesions, blight, cankers, galls, wilts, rots, and damping-off), within a period after their infection. These symptoms may include changes in color and/or function of the plant as it interacts with the pathogen, or visible signs of a pathogen, e.g., conidia of Erysiphales [4]. For example, when rose plants are infected with powdery mildew, neither the disease symptoms (e.g., the red blister-like areas on the upper leaf surface) nor the pathogen are visible early on. The symptoms of the infection appear much later as white powdery, when the mycelium of Podosphaera pannosa, which is the causative agent of this disease, is developed on the aerial parts of the plant [5,6]. Consequently, experts, consultants and farmers must have extremely good observation skills for early disease diagnosis, which is not always possible. In addition, the time since host infection to disease symptoms expression (incubation period), is not fixed and is strongly dependent on the pathogen, the host species, as well as the climate parameters (air temperature and relative humidity; [7,8,9,10]). The characteristic disease symptoms are vital for prognosis and treatment and for developing direct and indirect methods to identify the causative agent (-s) [11,12,13]. In this aspect, both the absence of visible symptoms early after plant infections as well as the difficulty to estimate the incubation period sets significant barriers for early disease detection and control in order to prevent their development and spread.
To detect plant diseases as soon as possible after infection, techniques such as digital photography and infrared thermography (IRT) have already been used to extract information about the health of whole plants or different plant organs [14,15,16,17]. Lowe et al. [3], has discussed the literature on plant disease detection by imaging sensors. This includes hyperspectral, multispectral, RGB, and IR digital images sensors. Lowe et al. [3], concluded that RGB and hyperspectral imaging are preferable for identifying specific plant diseases, e.g., different types of mildew, such us wheat powdery mildew caused by Blumeria graminis f. sp. tritici. However, to achieve high accuracy results, the use of hyperspectral cameras is required. More accurate results for many plant diseases are achieved with the use of hyperspectral and multispectral cameras [18] compared with RGB cameras, since in hyperspectral and multispectral images not only the visible light but a wide range of electromagnetic radiation is used. The choice between hyperspectral and multispectral imaging techniques depends on the specific application. In addition to the high cost of the hyperspectral and multispectral cameras, errors or incorrect information may result from hyperspectral, multispectral, and RGB digital images about plants’ health, due to lighting conditions [19]. This sets important barriers for the commercial use of the above techniques in the open field and greenhouse crops, suggesting that hyperspectral sensors may be a viable solution to overcome many of these measurement limitations listed above [20].
Infrared thermography accesses plant temperature. This is correlated to plant water status [15,21,22,23] and with changes in transpiration, which among others may occur due to early infections by plant pathogens [15,24]. Jones [21] presented evidence correlating the leaf temperature alteration to the plants transpiration changes, which were caused by different pathogen infections. Foliar diseases such as leaf spots often influence the transpiration rate or the water flow of the plant organ-s [15]. Many different mechanisms such as enzymatic or mechanical leaf cell membrane damage, stomatal opening induction caused by toxins produced by pathogens, and vessel plugging by fungal hyphae [19,25,26,27], can lead to water loss or water shortage and consequently to leaf temperature alteration. Image processing revealed a local decrease in temperature, due to the mesophyll cell collapse caused by toxins. In contrast, the tobacco mosaic virus (TMV) infection on leaves of the same plant was detected early using the same techniques by a local decrease in temperature. It has been shown that thermal imaging techniques were able to visualize infections of Cercospora beticola at an early stage on sugar beet leaves, before damage appeared [28,29]. In addition, infrared imaging revealed that mushrooms, yeasts, and molds each maintained lower temperatures than their surroundings [30]. Spot temperature changes on leaves surface may therefore indicate signs of possible infection.
Infrared cameras allow an inexpensive access to thermography which is well suited to visualize heterogeneity in plant response to stress [21,31]. Thermal long-wave infrared cameras or simply thermal cameras are calibrated sensors, able to record emitted radiation in the thermal range (8–14 µm or designed to detect radiation with greater wavelengths, up to around 14 µm) and provide images representing temperature values per pixel. Thus, temperature measurements can be feasibly replaced by thermal images, evaluating plant physiological status in short periods [32]. Plant phenotyping which is based on imaging techniques has become a recently available and important tool in agriculture, since leaf temperature seems to be a particularly good indicator of the physiological status of plants [33]. Leaf temperature alterations respond to both biotic and abiotic stressors, such as drought, salinity stress, and insect aggression, including microorganism infections [22,34,35,36]. Thermography is usually combined with other imaging sensors, imaging processing, and data analysis techniques to improve the precise agriculture techniques. Despite the fact that overall thermal imaging is an extremely valuable method for early biotic and abiotic stress detection on plants before the appearance of symptoms, some considerations must be taken into account when interpreting thermograms in terms of plant water adequacy or shortage. This is because plant surface temperature is mainly driven by environmental factors such as air temperature and relative humidity [32].
In this study, we used an AMG8833 infrared camera sensor module combined with a 1080P web camera to acquire infrared and RGB images from (i) fungi mycelium and (ii) vine, chrysanthemum, and rose plant leaves infected with Septoria spp., Colletotrichum spp., P. pannosa, and P. viticola, considering the most important pathogens of chrysanthemum, rose, and vine plants, respectively. The main aim is to investigate the capabilities of a low-cost thermal camera, for fast early detection of foliar diseases.

2. Materials and Methods

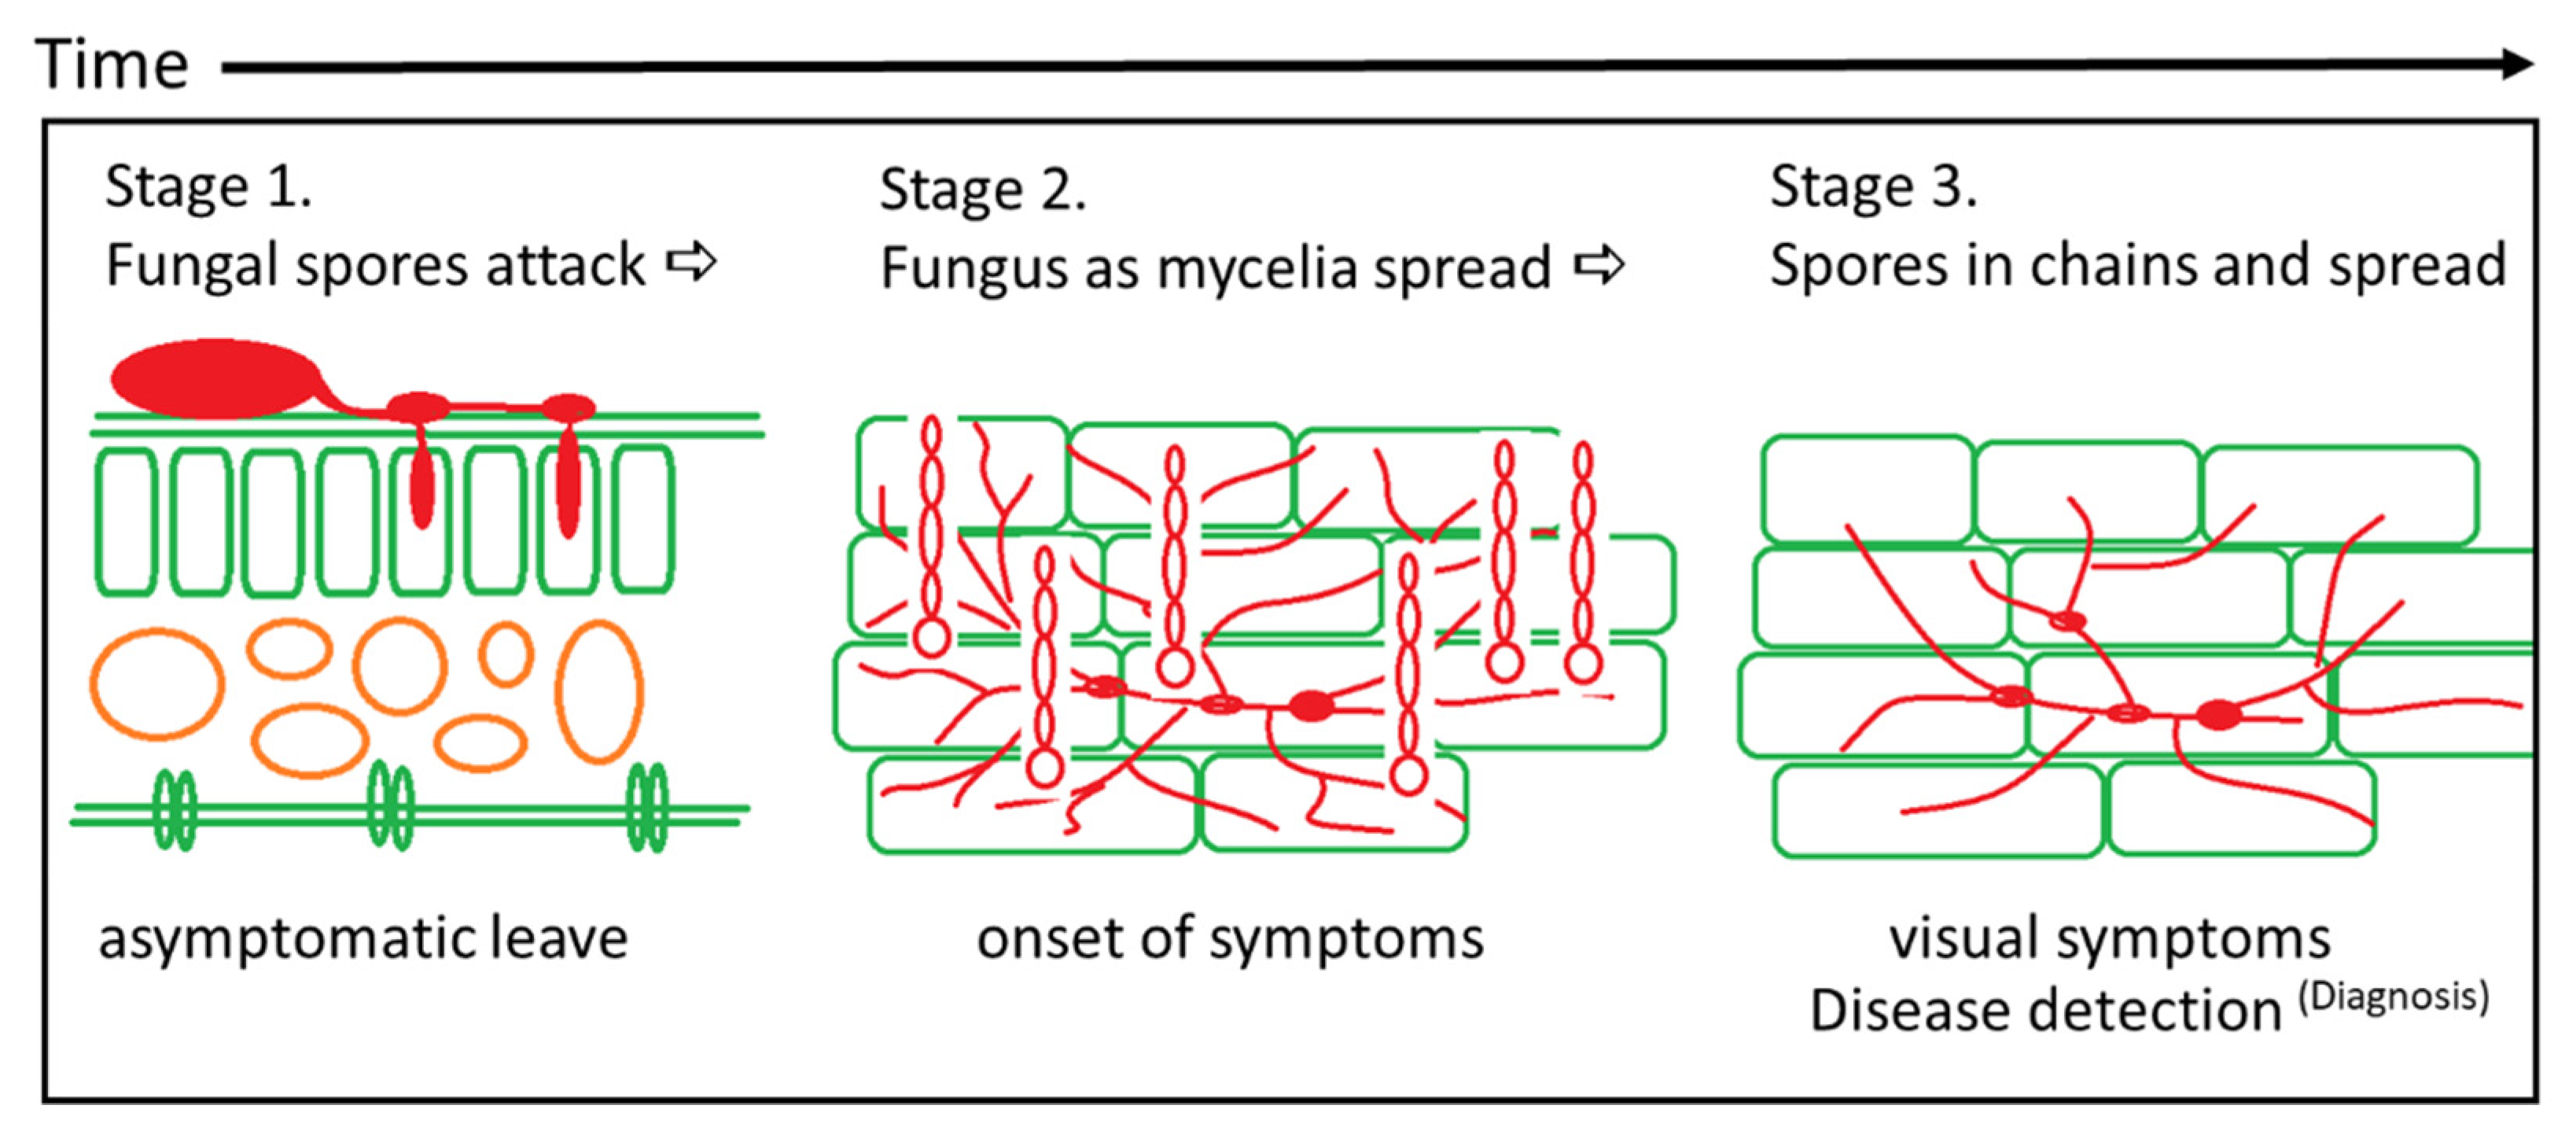
2.1. Early Disease Detection—The Methodology

Our methodology is based on Figure 1, which illustrates a typical series of events following exposure to a pathogen and the time delay until the disease diagnosis and fungus identification. Figure 1 shows in detail that fungal spores attack the plant tissue by penetrating the cells and taking moisture and nutrients from them. In this stage, leaves are clinically asymptomatic. From the infected host cells, fungus mycelia are spread across the dry leaf surface, causing a white, dusty coating on leaves, e.g., for P. pannosa infection. In this stage (stage 2, Figure 1), the leaf may be asymptomatic or in the stage of beginning the onset of symptoms. The development of sufficient mass of mycelia gives the fungus its powdery look (stage 3, Figure 1). Mycelia develops spores in chains and spreads to other plants by the means of wind currents. In this stage (stage 3), the fungus produces the common sign of powdery mildew, a visible symptom as a whitish coating on the leaf surface.
Based on the above information, no initial diagnosis can be made until stage 3. For this reason, rapid and accurate identification of the underlying agent (e.g., P. pannosa) is not possible. The time delay between stages 1 and 2 may be days, depending on environmental factors [5]. This is particularly true for emerging diseases of roses such as powdery and downy mildew.

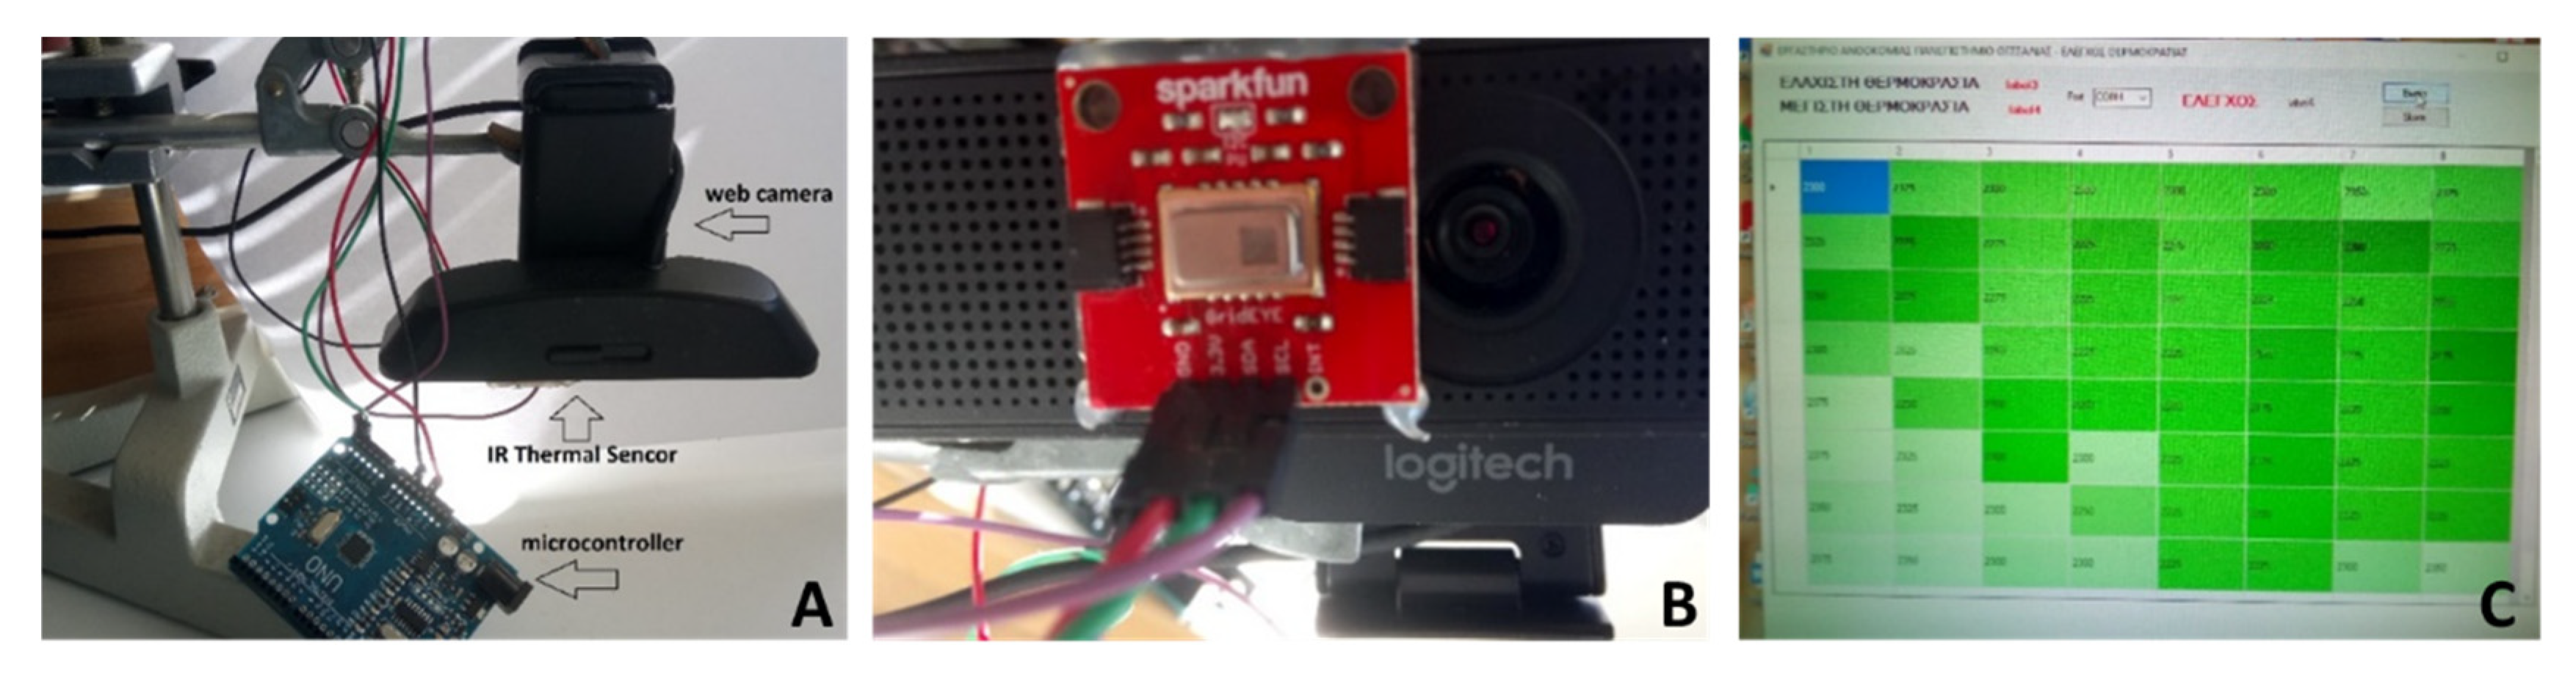
2.2. Development of Low-Cost Thermal Imaging System as a Screening Instrument

In this research, a low-cost, compact, and portable module SparkFun AMG8833 thermal camera system was used. The module is based on AMG8833 Grid-EYE manufactured by Panasonic. It consists of an array of 8 × 8 infrared sensors. The SparkFun AMG8833 thermal camera is a compact device that detects the heat energy that is being emitted by an object and converts it into an electronic signal which can be processed further to a microcontroller, or to display a thermal image on a PC screen [37] (Figure 2A). The module can be used as thermal camera (Figure 2B) and can accurately measure the temperature distributions on a surface as a fast tool without significant time delay. The thermal camera system is displayed in Figure 2A. The AMG8833 module was connected to an Arduino Uno microcontroller to acquire an array of 64 individual surface temperature readings, rising from the 8 × 8 infrared sensors. In order to match the recorded thermal image with the actual image of the object’s surface, an integrated infrared and RGB imaging system was developed. In this system, the AMG8833 module was mounted with a 1920 × 1080p resolution RGB web camera, equipped with a FULL HD glass lens (Figure 2B). Infrared and RGB images were acquired simultaneously in one shot for each tested leaf.

2.3. Sensor Calibration and Software Development

The AMG8833 module measures the temperature of an object which emits heat radiation. The temperature scale based on the Stefan–Boltzmann law describes the power radiated from an object in terms of its temperature as follows:
P = εAσT 4
where P is the total power radiated from an object (Wm−2), T is the temperature of the object (K), A represents the surface of the object (m2), σ is the Stefan–Boltzmann constant (Wm−2 K−4), and ε is the emissivity of the object. It takes values from 0 to <1 for objects which do not absorb all incident radiation (grey body), and therefore emit less total energy, and value equal to 1 for objects which absorb all incidents (black body; [38]). A simplified equation for approximating the temperature of a grey body is, according to Moghaddam et al. [38], the following:
Vout = k·(To4 − Ts4)
where Vout represent the output voltage of the sensor, To is the temperature of the surface of the object being measured, and Ts is the temperature of the sensor’s thermistor, which can be measured from the AMG8833 module itself. The variable k is an empirical constant representing the A, ε, σ parameters, as well as the electronic noise that may exist during the measurements. The value of k is estimated during the sensor calibration. According to Equation (2), the temperature of the surface of the object can be estimated from the following equation:
To = (Vout/k + Ts4) 1/4
Software was developed to record the temperature of the sensor’s thermistor (Ts) and the numerical temperature values from the 64 different pixels of the infrared image (To1–64), assigning them to the leaf area which every pixel represents. Finally, a thermal and RGB image (TRGB image) that combines the actual leaf image and the temperature of their different surface areas was produced. Measurements are not affected by light conditions. The output of the AMG8833 module was used in this experiment to calculate the temperature variation on the surface of the vine, chrysanthemum, and rose leaves, respectively (Figure 2C).

2.4. Fungal Mycelium TRGB Imaging In Vitro

The integrated imaging system was tested against fungal mycelium of Phoma spp., Alternaria alternata, and Fusarium oxysporum. All pathogenic fungi were growing on PDA agar plates for 7 or 9 days until all cultures covered the agar plate. In addition, fungi were grown on PDA plates amended with 0.2 mg/L Propiconazole fungicide, whereas PDA plates with no infections were used as control. Eight repetitions were performed for each treatment. At the end of the experiment TRGB images were recorded from all the treatments mentioned above, using the integrated imaging system. The system was placed at a fixed height 8 cm above the tested plate and recorded an area 8 × 8 cm. According to this schedule, each pixel represented a leaf area of 1 cm2.

2.5. TRGB Imaging of Infected Leaves

TRGB images from (i) Chrysanthemum leaves plugged with Colletotrichum spp. mycelia, (ii) rose plant leaves infected with Septoria spp. Conidia, and (iii) symptomatic vine plant leaves infected with P. viticola were recorded every day, following the same technique that is described above. During the shooting process, the leaf’s surface was placed at an angle of 90° and at a constant distance of 12 cm from the TRGB imaging system. There is no overlap of symptoms from different diseases in the samples used. Several healthy leaves from 6 different plants from the above plant species were detached and immediately infected in laboratory conditions with the above-mentioned diseases. In detail, chrysanthemum leaves were infected with mycelia plugs (4 mm diam.) of Septoria spp. Each plug of mycelium was placed at the center of each leaf and moved eight hours later. According to the Colletotrichum spp. treatment, rose leaf infection was achieved with 40 μL drops containing Colletotrichum spp. conidia, adjusted to 105 spores/mL. Non-inoculated chrysanthemum and rose leaves were kept as control. Six repetitions were performed for each treatment.
Healthy vine leaves were used as control. In all cases, TRGB images were recorded every day for a period of 4 and 12 days following the same technique that was described above. Podosphaera pannosa was isolated from leaves of diseased rose plants grown at the greenhouse of the University of Thessaly. Disease-free rose leaves were inoculated with 40 μL drops of conidial suspensions prepared from mildew colonies developed on leaf tissue in Petri dishes, as described by Suthaparan et al. [39]. All infected plant material remained in laboratory conditions at 24 °C, 80 Wm−2 radiation intensity (fluorescence lamps), 16 h photoperiod, and 85% air relative humidity. All TRGB images were captured at 24 °C.

2.6. Statistical Analysis

Data were analyzed using the Minitab statistical program. One-way analysis of variance (ANOVA) was applied in all experiments, and Fisher’s least significant difference (LSD) was used to detect and separate the mean treatment differences among treatments.

3. Results and Discussion

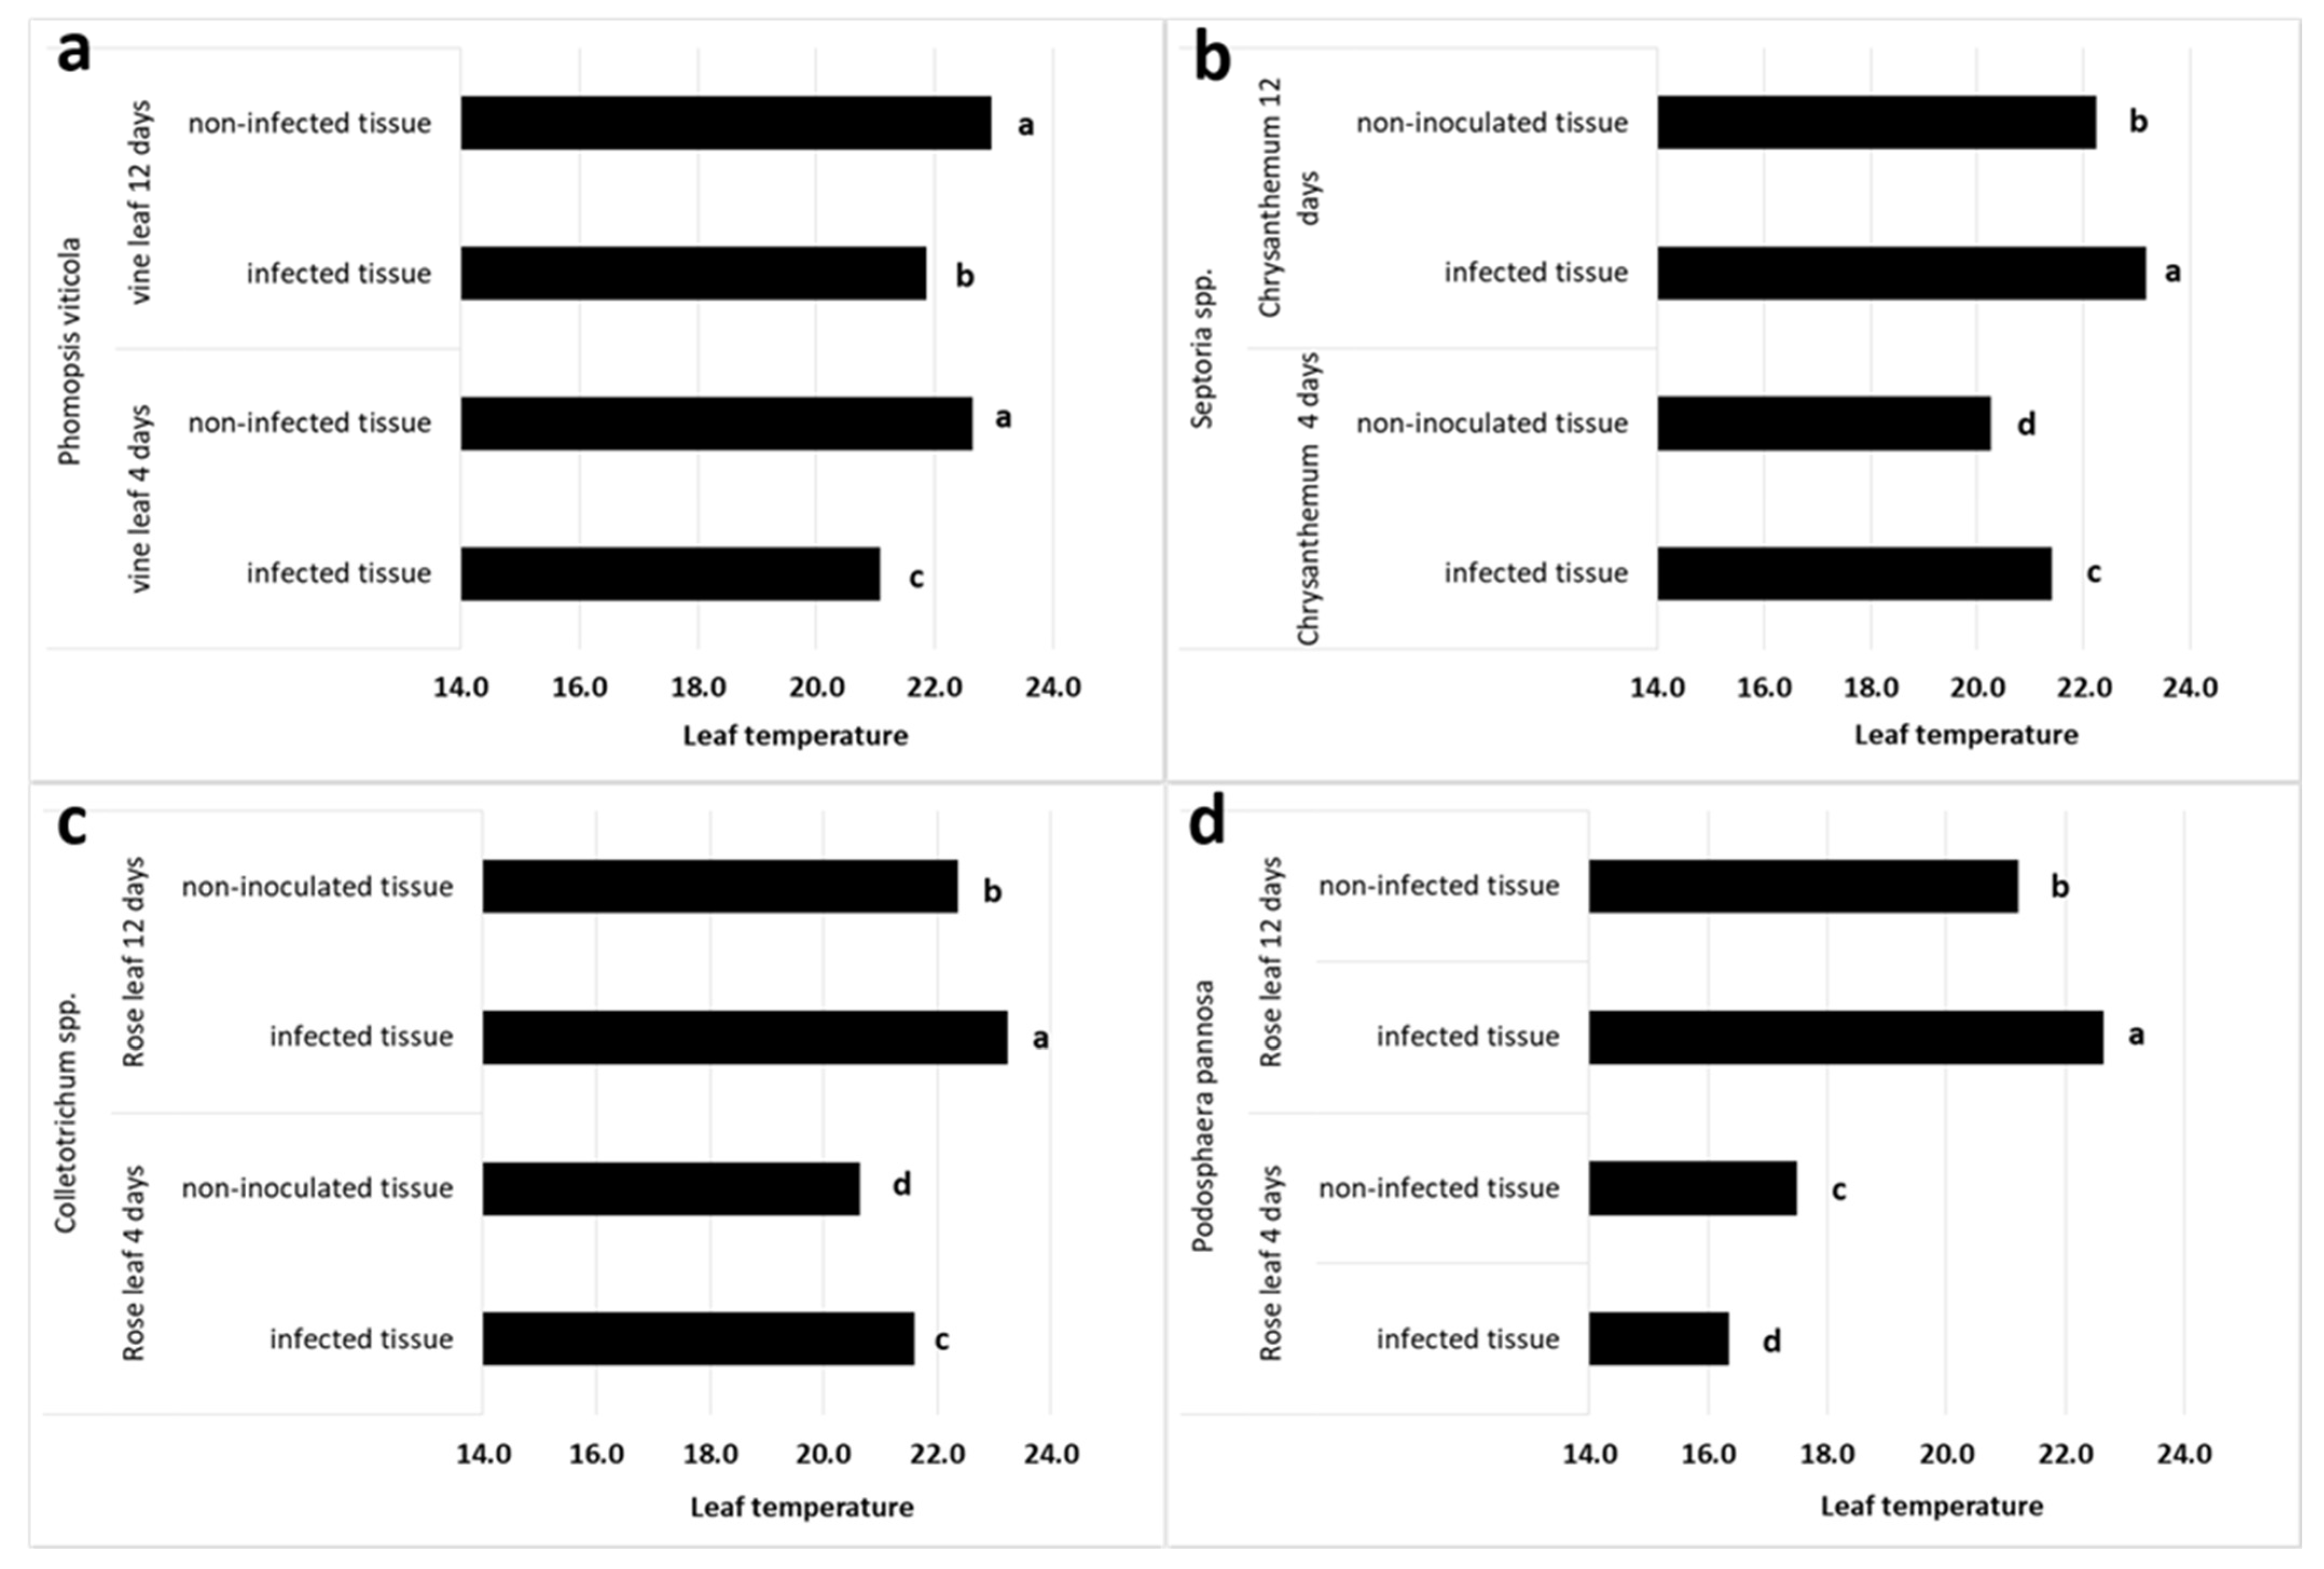
3.1. Fungal Mycelium TRGB Imaging In Vitro

Results show that temperature in plate areas where the mycelium of the above-mentioned microorganisms was grown was lower compared with PDA plates without microorganism culture (control plates) and with those treated with Propiconazole (Figure 3). However, there is no significant difference between the temperature of the control plates and those with PDA treated with Propiconazole. Specifically, on mycelium-covered plates, the temperature ranged from 22.2 to 23.2 °C. On plates where the mycelium was treated with Propiconazole, the temperature ranged from 23.9 to 24.2 °C, while on control plates, the temperature was 24.3 °C. These results showed that the active fungi mycelium is approximately 1.1 to 2.1 °C cooler than the non-active mycelium and the non-colonized PDA surface area (in this case the surface of the control plates). Similar conclusions are reported by Cordero et al. [30], who reported that the temperature difference between the fungus and its surroundings ranged from 0.5 to 5.0 °C, depending on the fungal specimens. The active mycelium maintains colder temperatures than its surroundings as well as than the non-active mycelium via evapotranspiration, which can be measured by collecting the condensed water droplets above molt biofilms.

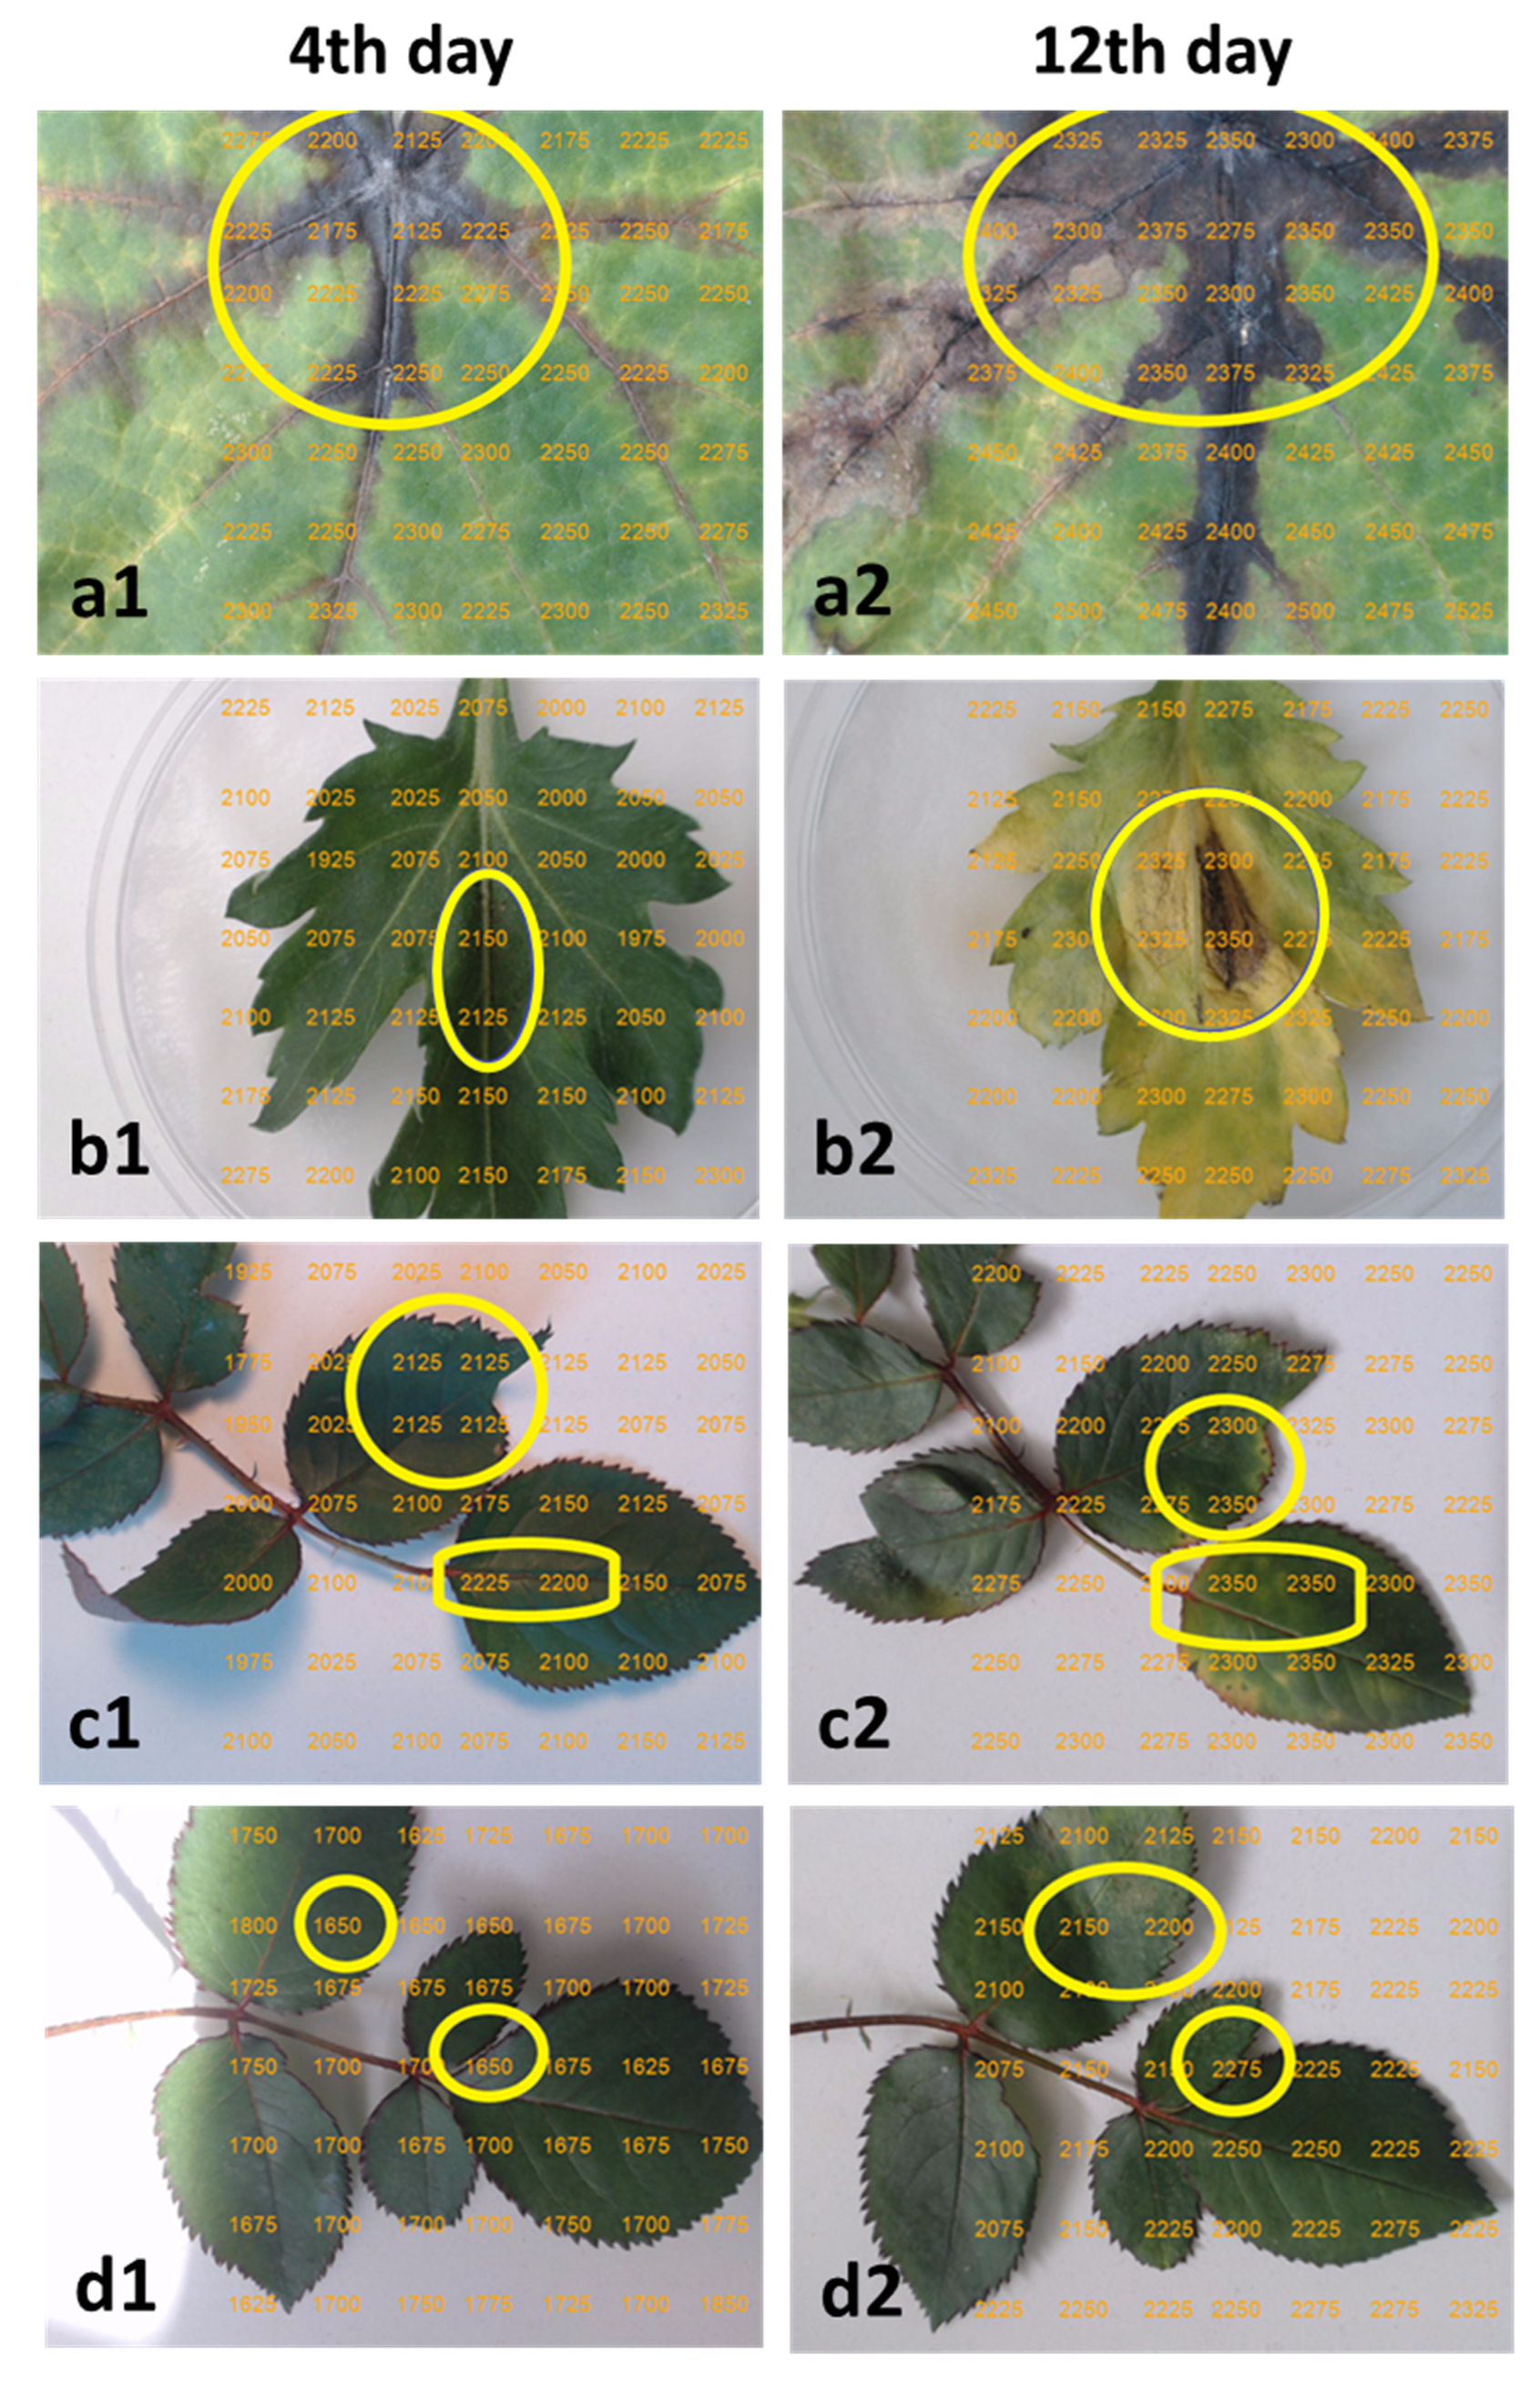
3.2. TRGB Imaging of Infected Leaves

Results showed that vine and rose plants leaf areas infected with P. viticola and P. pannosa, respectively, had a lower temperature four days after post-inoculation exposure compared with uninfected tissue (Figure 4a,d and Figure 5(a1,d1)). In contrast, chrysanthemum and rose plant leaf areas which were infected with Septoria spp. and inoculated with Colletotrichum spp., respectively, had higher temperatures four days after their infection compared with the uninfected tissue (Figure 4b,c and Figure 5(b1,c1)). In Figure 5, the yellow and blue circles indicate infected or inoculated leaf surface area, where the temperature is different (higher or lower) than areas of healthy tissue.
In detail, the average temperature of the infected tissue on vine leaves was 21.1 ± 0.3 °C and 21.9 ± 0.3 °C, four and twelve days, respectively, after infection, while the temperature of leaf surface areas of uninfected tissue was 22.6 ± 0.3 °C and 23 ± 0.3 °C, four and twelve days, respectively, after infection. The infected vine leaf tissue had a pre-symptomatic (four days after infection) decrease in temperature up to 1.6 ± 0.4 °C compared with uninfected tissue. Twelve days after infection, the temperature in the inoculated region of vine leaves remained about 1.1 ± 0.4 °C lower than the areas without infection.
The average temperature of infected areas of chrysanthemum leaves was 21.4 ± 0.2 °C and 23.2 ± 0.3 °C, four and twelve days, respectively, after their inoculation with Septoria ssp. mycelium. The temperature of the non-inoculated tissue was 20.3 ± 0.6 °C and 22.3 ± 0.6 °C, four and twelve days, respectively, after inoculation. As was mentioned above, in contrast to vine infected leaves, a pre-symptomatic increased temperature up to 1.1 ± 0.6 °C was measured on inoculated areas of chrysanthemum leaves, compared with non-inoculated tissue. Twelve days after inoculation, when the disease symptoms were visible with the naked eye (Figure 5(b2)), the temperature in the infected region of the chrysanthemum leaves was about 0.9 ± 0.6 °C higher than the uninfected areas.
The temperature alteration on rose leaf surfaces infected with Colletotrichum spp. followed a similar pattern to the temperature alteration of the chrysanthemum leaves infected with Septoria ssp. Specifically, the average temperature of the inoculated with Colletotrichum spp., conidia areas on rose leaves, was 21.6 ± 0.5 °C and 23.3 ± 0.3 °C, four and twelve days, respectively, after inoculation compared with the non-inoculated tissue. The temperature of the non-inoculated tissue was 20.6 ± 0.5 °C on day 4 and 22.4 ± 0.5 °C on day 12. Consequently, the temperature of the infected areas on rose plants leaves was increased by about 1.0 ± 0. 4 °C and 0.9 ± 0.3 °C after 4 and 12 days from their infection, respectively, compared with the uninfected areas of the leaves. Disease symptoms on rose leaves caused by Colletotrichum spp. infection were visible with the naked eye 12 days after inoculation (Figure 5(c2)). Although Zhu et al. [40] reported similar temperature variation between infected and uninfected areas on leaf surfaces (ranged in average from 0.4 to 2 °C). Lee et al. [41] measured lower temperatures in areas of cucumber leaves inoculated with C. orbiculare than in non-inoculated areas, seven days after the inoculation.
However, when rose plant leaves were infected with P. pannosa conidia, the average temperature values measured on the infected tissue were 1.1 ± 0.4 °C lower than those measured on the uninfected tissue after four days from the infection, but were 1.4 ± 0.7 °C higher than those of the uninfected tissue twelve days after the infection. When rose plant leaves were infected with P. pannosa conidia, the average temperature in the infected areas was approximately 16.4 ± 0.2 °C at day 4 and 22.6 ± 0.5 °C at day 12, whereas the temperature of the uninfected tissue was 17.5 ± 0.3 °C on day 4 and 21.2 ± 0.4 °C on day 12. According to the above results, powdery mildew development on rose plant leaves caused a sequence in temperature alteration resulting from the pathogen attack. In this work, TRGB images revealed a pre-symptomatic cooling of the areas infected with powdery mildew, followed by a temperature increase as tissue collapsed. Similar results were described by Lindenthal et al. [42], who found that cucumber leaf areas colonized by the obligate biotrophic pathogen Pseudoperonospora cubensis exhibited a pre-symptomatic decrease in leaf temperature up to 0.8 °C than uninfected tissue, due to abnormal stomata opening. The cooling of the infected leaf area caused by the loss of integrity of cell membranes resulted in an increased amount of apoplastic water in the infected tissue and finally, the cells’ death. As the infected tissue increased, the natural leaf cooling was diminished, leading finally to the increment of their temperature. In addition, Smith et al. [43] reported a similar temperature alteration in wheat plant leaves, which are susceptible to Puccinia striiformis. The decreased leaf temperature (by 0.2 to 1.08 °C) observed at an early stage of plant infection was caused by the epidermis rupturing and stomatal closure prevention. During a later stage of stripe rust development, the temperature of the infected leaves was significantly increased.
The maximum temperature difference (MTD) between infected and uninfected leaves of vine and rose plants (Table 1) followed a similar pattern to the mean temperature tissue difference (MTTD) of infected and uninfected tissue leaf on each single leaf. However, in the case of chrysanthemum leaves, MTD was 0.6 °C lower than the uninfected ones, only during the first four days after their infection. In contrast, during the same period, the infected tissues on the chrysanthemum leaves showed an increased temperature (MTTD) compared with the uninfected tissues, by 1.1 ± 0.6 °C (Table 1). Similar results were reported by Oerke et al. [24], who stated that while the MTD of infected cucumber leaves substantially increased with the appearance of chloroses, it was associated with a locally decreased temperature of the infected tissue. This can be explained by the fact that the gradual spread of the disease to the leaf tissue causes spatial heterogeneity of their temperature [24]. This is quantified by the maximum temperature difference within a leaf. Consequently, the stage of pathogenesis and the arrangement of chlorotic or necrotic areas on the leaf may affect leaf’s temperature pattern.
The above-mentioned results indicated also that leaf temperature evolution during the pre-symptomatic disease period until later, when symptoms are visible, is not the same default in all cases. Although many researchers reported an increase in the temperature of infected plants compared with the uninfected, Rosyara et al. [44] reported that wheat plants infected with Cochliobolus sativus had a decreased canopy temperature depression. This is caused by their reduced photosynthetic activity, since their active leaf area is less than that of the healthy plants. In their work, the different temperature progression (between the fourth and twelfth day after infection) that was observed in the leaves of rose plants infected with C. orbiculare or with P. pannosa indicates that this depends on the pathogen. This is probably due to the different manners in which pathogens affect plant physiology and plants’ water status [21,45]. However, not only the type of microorganism, but also even the host species variety can affect the evolution of leaf temperature between onset and visible appearance of disease [46]. Wang et al. [47] has shown that among twenty-five different wheat genotypes, the maximum temperature difference between uninfected plants and those infected with Zymoseptoria tritici was different. This probably should be attributed to the fact that different plant species and genotypes show different susceptibility and resistance reactions to infection caused by the same pathogen [48].
Using this system, it was estimated that the temperature of the active fungi mycelium is approximately 1.1 to 2.1 °C lower than the non-active mycelium and the non-colonized PDA surface area. The system was also able to detect areas in leaf surface of different temperatures. These leaf temperature alterations are correlated with infections from plant pathogens. However, the temperature level of the infected tissue in relation to the healthy tissue, four days after their infection, depends on the pathogen. Specific leaf areas of vine and rose plant leaves, where P. viticola and P. pannosa, respectively, were installed, had lower temperatures ranging from 1.05 to 1.5 °C, compared with the uninfected tissue. In contrast, during the same period of time after infection, leaf areas of chrysanthemum and rose plant leaves, infected with Septoria ssp. and Colletotrichum spp., respectively, showed higher temperatures ranging from 0.65 to 1 °C.

4. Conclusions

In this research, a low-cost imaging system which is based on the AMG8833 Grind-Eye thermal camera sensor has been developed. The system simultaneously records thermal and RGB images of a surface and produces a TRGB image showing the temperature alterations on this surface. Through TRGB images, the temperature of several spots on plates with fungi cultures and on leaf surfaces can be easily detected.
In all cases, the characteristics symptoms of the diseased plants were visible with the naked eye after twelve days from their infections. After this period, leaf tissue of chrysanthemum which was infected with Septoria ssp., and that of rose plants which was infected with Colletotrichum spp. and P. pannosa, had higher temperatures than the uninfected tissue, while the leaf tissue of vine infected with P. viticola remained cooler than the uninfected leaf tissue.
In our research, these preliminary observations which depend on pathogen temperature approach could become quite a successful tool in plant disease management. We believe that this advantage of infrared thermal imaging technology could help farmers to improve the early detection and successful fighting of plant diseases. Moreover, this approach, apart from detecting the disease on time, requires the application of knowledge in computer programming to generate a reliable platform where the diseases are analyzed in detail [49].
TRG imaging also revealed that the gradual spread of the disease to the leaf tissue causes spatial heterogeneity of their temperature. This leads to differentiation between maximum temperature difference (MTTD) between infected and uninfected leaves, and the mean temperature difference (MTTD) of infected and uninfected tissue on each leaf. We believe that this detection process marks the beginning of detecting and estimating the number of pathogens per plant on time in order to reduce its spread. Our future study will focus on how to detect those pathogens per plant promptly with this technology. Furthermore, we need to develop a machine learning technology to detect the diseases in plants automatically.
The ability to easily measure and display the leaf surface temperature using the system developed in this work can make it a useful tool to: (i) detect early plant infection (pre-symptomatic disease), (ii) distinguish active and non-active mycelium, and (iii) determine, in terms of temperature alterations, the stage of the disease development.

Author Contributions

This research is a product of the intellectual environment of all authors which have contributed in various degrees to the analytical methods used, to the research concept, and to the experiment design. I.V. and C.L. designed the study, developed the methodology, performed the analysis while A.P. with I.V. collected the data. I.V. and C.L. contributed towards writing the manuscript. All authors have read and agreed to the published version of the manuscript.

Funding

This research received no external funding.

Institutional Review Board Statement

Not applicable.

Informed Consent Statement

Not applicable.

Conflicts of Interest

The authors declare that they have no conflict of interest.

References

  1. Chaerle, L.; Van der Straeten, D. Imaging techniques and the early detection of plant stress. Trends Plant Sci. 2000, 5, 495–501. [Google Scholar] [CrossRef]
  2. Bauriegel, E.; Giebel, A.; Geyer, M.; Schmidt, U.; Herppich, W.B. Early detection of Fusarium infection in wheat using hyper-spectral imaging. Comput. Electron. Agric. 2011, 75, 304–312. [Google Scholar] [CrossRef]
  3. Lowe, A.; Harrison, N.; French, A.P. Hyperspectral image analysis techniques for the detection and classification of the early onset of plant disease and stress. Plant Methods 2017, 13, 80. [Google Scholar] [CrossRef]
  4. Takamatsu, S. Origin and evolution of the powdery mildews (Ascomycota 1660, Erysiphales). Mycoscience 2013, 54, 75–86. [Google Scholar] [CrossRef]
  5. Coyier, D.L. Control of Rose Powdery Mildew in the Greenhouse and Field. Plant Dis. 1983, 67, 919. [Google Scholar] [CrossRef]
  6. Linde, M.; Shishkoff, N. DISEASE | Powdery Mildew. Encycl. Rose Sci. 2003, 158–165. [Google Scholar] [CrossRef]
  7. Marchetti, M.A.; Melching, J.S.; Bromfield, K.R. The effects of temperature and dew period on germination and infection by urediospores of Phakopsora pachyrhizi. Phytopathology 1976, 66, 461–463. [Google Scholar] [CrossRef]
  8. Tomerlin, J.R.; Jones, A.L. Effect of temperature and relative humidity on the latent period of Venturia inaequalis in apple leaves. Phytopathology 1983, 73, 51–54. [Google Scholar] [CrossRef]
  9. Fraser, C.; Riley, S.; Anderson, R.M.; Ferguson, N.M. Factors that make an infectious disease outbreak controllable. Proc. Natl. Acad. Sci. USA 2004, 101, 6146–6151. [Google Scholar] [CrossRef] [Green Version]
  10. Roger, C.; Tivoli, B.; Huber, L. Effects of temperature and moisture on disease and fruit body development of Mycosphaerella pinodes on pea (Pisum sativum). Plant Pathol. 1999, 48, 1–9. [Google Scholar] [CrossRef]
  11. Bock, C.H.; Poole, G.H.; Parker, P.E.; Gottwald, T.R. Plant disease severity estimated visually, by digital photography and image analysis, and by hyperspectral imaging. Crit. Rev. Plant Sci. 2010, 29, 59–107. [Google Scholar] [CrossRef]
  12. Hansen, M.A.; Wick, R.L. Plant disease diagnosis: Present and future prospects. Adv. Plant Pathol. 1993, 10, 65–126. [Google Scholar]
  13. Nutter, F.W., Jr. Disease assessment terms and concepts. In Encyclopedia of Plant Pathology; Maloy, O.C., Murray, T.D., Eds.; John Wiley and Sons, Inc.: New York, NY, USA, 2001; pp. 312–323. [Google Scholar]
  14. Xu, H.; Zhu, S.; Ying, Y.; Jiang, H. Early detection of plant disease using infrared thermal imaging. Opt. Nat. Resour. Agric. Foods 2006, 6381, 638110. [Google Scholar] [CrossRef]
  15. Mahlein, A.-K. Plant Disease Detection by Imaging Sensors—Parallels and Specific Demands for Precision Agriculture and Plant Phenotyping. Plant Dis. 2016, 100, 241–251. [Google Scholar] [CrossRef] [Green Version]
  16. Mahlein, A.-K.; Oerke, E.-C.; Steiner, U.; Dehne, H.-W. Recent advances in sensing plant diseases for precision crop protection. Eur. J. Plant Pathol. 2012, 133, 197–209. [Google Scholar] [CrossRef]
  17. Yao, Z.; Lei, Y.; He, D. Early Visual Detection of Wheat Stripe Rust Using Visible/Near-Infrared Hyperspectral Imaging. Sensors 2019, 19, 952. [Google Scholar] [CrossRef] [PubMed] [Green Version]
  18. Nagasubramanian, K.; Jones, S.; Singh, A.K.; Sarkar, S.; Singh, A.; Ganapathysubramanian, B. Plant disease identification using explainable 3D deep learning on hyperspectral images. Plant Methods 2019, 15, 98. [Google Scholar] [CrossRef] [PubMed]
  19. Kwan, C. Methods and Challenges Using Multispectral and Hyperspectral Images for Practical Change Detection Applications. Information 2019, 10, 353. [Google Scholar] [CrossRef] [Green Version]
  20. Abildso, C.G.; Haas, V.; Daily, S.M.; Bias, T.K. Field Test of a Passive Infrared Camera for Measuring Trail-Based Physical Activity. Front. Public Health 2021, 9, 225. [Google Scholar] [CrossRef]
  21. Jones, H.G. Use of thermography for quantitative studies of spatial and temporal variation of stomatal conductance over leaf surfaces. Plant Cell Environ. 1999, 22, 1043–1055. [Google Scholar] [CrossRef] [Green Version]
  22. Jones, H.G. Application of thermal imaging and infrared sensing in plant physiology and ecophysiology. In Advances in Botanical Research; Academic Press: Cambridge, MA, USA, 2004; Volume 41, pp. 107–163. [Google Scholar]
  23. Belfiore, N.; Vinti, R.; Lovat, L.; Chitarra, W.; Tomasi, D.; de Bei, R.; Meggio, F.; Gaiotti, F. Infrared Thermography to Estimate Vine Water Status: Optimizing Canopy Measurements and Thermal Indices for the Varieties Merlot and Moscato in Northern Italy. Agronomy 2019, 9, 821. [Google Scholar] [CrossRef] [Green Version]
  24. Oerke, E.C.; Steiner, U.; Dehne, H.W.; Lindenthal, M. Thermal imaging of cucumber leaves affected by downy mildew and environmental conditions. J. Exp. Bot. 2006, 57, 2121–2132. [Google Scholar] [CrossRef] [PubMed]
  25. Mendgen, K.; Hahn, M.; Deising, H. Morphogenesis and mechanisms of penetration by plant pathogenic fungi. Annu. Rev. Phytopathol. 1996, 34, 364–386. [Google Scholar] [CrossRef] [PubMed] [Green Version]
  26. Fradin, E.F.; Thomma, B.P.H.J. Physiology and molecular aspects of Verticillium wilt diseases caused by V. dahliae and V. albo-atrum. Mol. Plant Pathol. 2006, 7, 71–86. [Google Scholar] [CrossRef] [PubMed]
  27. Wang, M.; Sun, Y.; Sun, G.; Liu, X.; Zhai, L.; Shen, Q.; Guo, S. Water balance altered in cucumber plants infected with Fusarium oxysporum f. sp. cucumerinum. Sci. Rep. 2015, 5, 7722. [Google Scholar] [CrossRef] [Green Version]
  28. Chaerle, L.; Hagenbeek, D.; De Bruyne, E.; Valcke, R.; Van Der Straeten, D. Thermal and Chlorophyll-Fluorescence Imaging Distinguish Plant-Pathogen Interactions at an Early Stage. Plant Cell Physiol. 2004, 45, 887–896. [Google Scholar] [CrossRef] [Green Version]
  29. Chaerle, L.; Leinonen, I.; Jones, H.G.; Van Der Straeten, D. Monitoring and screening plant populations with combined thermal and chlorophyll fluorescence imaging. J. Exp. Bot. 2006, 58, 773–784. [Google Scholar] [CrossRef] [Green Version]
  30. Cordero, R.J.; Mattoon, E.R.; Casadevall, A. Fungi are colder than their surroundings. BioRxiv 2020. [Google Scholar] [CrossRef]
  31. Lee, H.J.; Tucker, E.B.; Crain, R.C.; Lee, Y. Stomatal opening is induced in epidermal peels of Commelina communis L. by GTP analogs or pertussis toxin. Plant Physiol. 1993, 102, 95–100. [Google Scholar] [CrossRef] [Green Version]
  32. Pineda, M.; Barón, M.; Pérez-Bueno, M.L. Thermal Imaging for Plant Stress Detection and Phenotyping. Remote. Sens. 2020, 13, 68. [Google Scholar] [CrossRef]
  33. Li, L.; Zhang, Q.; Huang, D. A review of imaging techniques for plant phenotyping. Sensors 2014, 14, 20078–20111. [Google Scholar] [CrossRef]
  34. Chaerle, L.; Van der Straeten, D. Seeing is believing: Imaging techniques to monitor plant health. Biochim. Biophys. Acta 2001, 1519, 153–166. [Google Scholar] [CrossRef]
  35. Prashar, A.; Yildiz, J.; McNicol, J.W.; Bryan, G.J.; Jones, H.G. Infra-red thermography for high throughput field phenotyping in Solanum tuberosum. PLoS ONE 2013, 8, e65816. [Google Scholar] [CrossRef] [PubMed]
  36. Khanal, S.; Fulton, J.; Shearer, S. An overview of current and potential applications of thermal remote sensing in precision agriculture. Comput. Electron. Agric. 2017, 139, 22–32. [Google Scholar] [CrossRef]
  37. Haripriya, A.B.; Sunitha, K.A.; Mahima, B. Development of Low-cost Thermal Imaging System as a Preliminary Screening Instrument. Procedia Comput. Sci. 2020, 172, 283–288. [Google Scholar] [CrossRef]
  38. Moghaddam, S.; Lawler, J.; Currano, J.; Kim, J. Novel Method for Measurement of Total Hemispherical Emissivity. J. Heat Transf. 2007, 21, 128–133. [Google Scholar] [CrossRef] [Green Version]
  39. Suthaparan, A.; Stensvand, A.; Solhaug, K.A.; Torre, S.; Mortensen, L.M.; Gadoury, D.M.; Seem, R.C.; Gislerød, H.R. Suppression of Powdery Mildew (Podosphaera pannosa) in Greenhouse Roses by Brief Exposure to Supplemental UV-B radiation. Plant Dis. 2012, 96, 1653–1660. [Google Scholar] [CrossRef] [Green Version]
  40. Zhu, W.; Chen, H.; Ciechanowska, I.; Spaner, D. Application of infrared thermal imaging for the rapid diagnosis of crop disease. IFAC-PapersOnLine 2018, 51, 424–430. [Google Scholar] [CrossRef]
  41. Lee, J.H.; Oh, S.I.; Lee, A.K. Measurement and prediction of Cladosporium cucumerinum and Collectotrichum orbiculare using infrared thermography. In Proceedings of the Quantitative InfraRed Thermography Asia 2017, Daejeon, Korea, 2–6 July 2017. [Google Scholar] [CrossRef]
  42. Lindenthal, M.; Steiner, U.; Dehne, H.-W.; Oerke, E.-C. Effect of Downy Mildew Development on Transpiration of Cucumber Leaves Visualized by Digital Infrared Thermography. Phytopathology 2005, 95, 233–240. [Google Scholar] [CrossRef] [Green Version]
  43. Smith, R.C.G.; Heritage, A.D.; Stapper, M.; Barrs, H.D. Effect of stripe rust (Puccinia striiformis West.) and irrigation on the yield and foliage temperature of wheat. Field Crop. Res. 1986, 14, 39–51. [Google Scholar] [CrossRef]
  44. Rosyara, R.U.; Subedi, S.; Duveiller, E.; Sharma, R.C. The effect of spot blotch and heat stress on variation of canopy temperature depression, chlorophyll fluorescence and chlorophyll content of hexaploid wheat genotypes. Euphytica 2010, 174, 377–390. [Google Scholar] [CrossRef]
  45. Jones, H.G. Plant and Microclimate, 2nd ed.; Cambridge University Press: Cambridge, UK, 1992. [Google Scholar]
  46. Raza, S.E.A.; Prince, G.; Clarkson, J.P.; Rajpoot, N.M. Automatic Detection of Diseased Tomato Plants Using Thermal and Stereo Visible Light Images. PLoS ONE 2015, 10, e012. [Google Scholar] [CrossRef] [PubMed]
  47. Wang, Y.; Zia-Khan, S.; Owusu-Adu, S.; Miedaner, T.; Müller, J. Early Detection of Zymoseptoria tritici in Winter Wheat by Infrared Thermography. Agriculture 2019, 9, 139. [Google Scholar] [CrossRef] [Green Version]
  48. Ding, L.; Xu, H.; Yi, H.; Yang, L.; Kong, Z.; Zhang, L.; Xue, S.; Jia, H.; Ma, Z. Resistance to hemi-biotrophic F. graminearum infection is associated with coordinated and ordered expression of diverse defense signaling pathways. PLoS ONE 2011, 6, e19008. [Google Scholar] [CrossRef] [PubMed] [Green Version]
  49. Zaman, F.; Lee, S.; Rahim, M.K.A.; Khan, S. Smart Antennas and Intelligent Sensors Based Systems: Enabling Technologies and Applications. Wirel. Commun. Mob. Comput. 2019, 2019, 1–3. [Google Scholar] [CrossRef] [Green Version]
Figure 1. Signs and symptoms of plant disease development. Infographic: powdery mildew infection of rose. Where: stage 1, fungal spores attack; stage 2, the leaf may be asymptomatic or in the stage of beginning the on-set of symptoms; stage 3, the fungus produces the common sign of powdery mildew.
Agronomy 11 01682 g001
Figure 2. (A) The TRGB imaging system; (Β) Thermal Camera Sensor mounted on the web camera; (C) 64 individual infrared temperature readings.
Agronomy 11 01682 g002
Figure 3. Average temperature of control plates and different fungi mycelium grown on PDA media with and without Propiconazole fungicide. Horizontal bars indicate SD.
Agronomy 11 01682 g003
Figure 4. Infrared thermal imaging of vine leaves infected by Phomopsis viticola (a), chrysanthemum leaves inoculated with Septoria spp. (b), and rose plant leaves inoculated with Colletotrichum spp. (c) and with Podosphaera pannosa (d) after four and twelve days from infection or infection. The different letters above the figures indicate significant differences between treatments (p < 0.05).
Agronomy 11 01682 g004
Figure 5. TRGB images 4 and twelve 12 days after infection, infection or inoculation from: (a1,a2) vine leaves infected with Phomopsis viticola; (b1,b2) chrysanthemum leaves inoculated with Septoria ssp., mycelium; (c1,c2) rose leaves inoculated with Colletotrichum spp., conidia; (d1,d2) rose leaves infected with Podosphaera pannosa conidia.
Agronomy 11 01682 g005
Table 1. The maximum temperature difference (MTD) between infected and uninfected leaves and the mean temperature tissue difference (MTTD) between infected and uninfected tissue leaf on the same leaf. Negative numbers indicate that infected leaves or tissues had a lower temperature then the uninfected one.
4 Days12 Days
Tested PlantFoliar PathogenMTD (°C)MTTD (°C)MTD (°C)MTTD (°C)
VineP. viticola−0.5−1.6 ± 0.4−1.0−1.1 ± 0.4
ChrysanthemumSeptoria ssp.−0.61.1 ± 0.61.10.9 ± 0.6
RoseColletotrichum spp.0.81.0 ± 0.40.50.9 ± 0.3
RoseP. pannosa−1.5−1.1 ± 0.42.01.4 ± 0.7
Publisher’s Note: MDPI stays neutral with regard to jurisdictional claims in published maps and institutional affiliations.

