Article

Influence of Recycled Waste Compost on Soil Food Webs, Nutrient Cycling and Tree Growth in a Young Almond Orchard

by
Amanda K. Hodson
1,*,
Jordan M. Sayre
2,
Maria C. C. P. Lyra
3 and
Jorge L. Mazza Rodrigues
2
1
Department of Entomology and Nematology, University of California Davis, Davis, CA 95616, USA
2
Department of Land, Air, and Water Resources, University of California Davis, Davis, CA 95616, USA
3
Laboratory of Genomics, Agronomic Institute of Pernambuco-IPA, Recife 50761-000, Brazil
*
Author to whom correspondence should be addressed.
Agronomy 2021, 11(9), 1745; https://doi.org/10.3390/agronomy11091745
Submission received: 30 July 2021 / Revised: 25 August 2021 / Accepted: 26 August 2021 / Published: 30 August 2021

Abstract

:
Composting is an effective strategy to process agricultural and urban waste into forms that may be beneficial to crops. The objectives of this orchard field study were to characterize how a dairy manure compost and a food waste compost influenced: (1) soil nitrogen and carbon pools, (2) bacterial and nematode soil food webs and (3) tree growth and leaf N. The effects of composts were compared with fertilized and unfertilized control plots over two years in a newly planted almond orchard. Both dairy manure compost and food waste compost increased soil organic matter pools, as well as soil nitrate and ammonium at certain time points. Both composts also distinctly altered bacterial communities after application, specifically those groups with carbon degrading potential, and increased populations of bacterial feeding nematodes, although in different timeframes. Unique correlations were observed between nematode and bacterial groups within compost treatments that were not present in controls. Food waste compost increased trunk diameters compared to controls and had greater relative abundance of herbivorous root tip feeding nematodes. Results suggest that recycled waste composts contribute to biologically based nitrogen cycling and can increase tree growth, mainly within the first year after application.

1. Introduction

Soil health has been defined as “the capacity of the soil to function as a vital living ecosystem that supports plants, animals, and humans” [1]. It is determined by interactions between microbial communities, soil physical and chemical factors, and management decisions [2], encompassing biological attributes such as biodiversity, food web structure and ecosystem functioning [3]. Increasing soil organic carbon (SOC) serves as the foundation for building healthy soils [4]. As an important indicator of soil quality, SOC enhances crop productivity by improving water holding capacity, aggregation, nutrient transformation and microbial biomass [5]. While intensive agriculture depletes SOC, land management practices that lead to increases in SOC reverse this trend, enhancing productivity and environmental quality [6].
Composting can transform agricultural and municipal waste into a valuable soil amendment which increases SOC [7,8], while at the same time increasing soil nutrients and yields [9,10]. Both dairy manure [11] and food waste [12,13] have negative environmental effects, and composting offers one solution to recycle these wastes. For example, dairy manure compost applied at a rate of 105 Mg DM ha−1 increased SOC by 73% and supported corn yields similar to that of inorganic fertilizer [14]. In wheat, both municipal organic waste compost [9] and dairy manure compost [15] increased soil nutrient pools and yield. Recycled waste composts can increase SOC in almond production [16] and are applied by growers with the goals of increasing tree nutrition and beneficial soil biology [17].
Applying composts can increase microbial populations [18,19] and microbial diversity [20], which has sometimes been associated with increased nutrient use efficiency [21]. However, other studies have found slightly negative [22] or neutral [23] effects of compost on microbial diversity and activity. Terms such as high and low in this case are relative, though, since the minimum amount of biodiversity necessary to maintain plant health is often unknown [24]. Often it is not the raw number of species that is important, but rather the functions certain species perform [25], which in soil, includes organic matter decomposition and cycling nutrients [26]. Since many microbes do not grow well in the laboratory, their identity is only known through DNA sequencing, and directly linking natural populations to function requires a combination of genomic and culture-based approaches [27]. Although recent technological advances (such as lower costs of high throughput molecular sequencing) show promise, scientific understanding of how microbial diversity influences ecosystem functioning in agro ecosystems is still in its early stages [25,28].
Differences in microbial communities are reflected in bacterial and fungal-feeding nematodes, which respond rapidly to the abundance of their prey [29] and channel resources derived from bacterial and fungal decomposition [30]. For example, fungal-feeding nematodes proliferate with more processed resources [29,31,32], while increases in bacterial-feeders have been found with more readily decomposable resources such as compost feedstocks [31] and cover crops [33]. Nematodes have been proposed as particularly good indicators of soil health [34,35] because of their ubiquitous presence in soils, diverse number of functions that they provide, and their rapid response to changes in management. Previous studies have found that applying composted agricultural waste increased overall nematode biomass, as well as the abundance of bacterial-feeders [36], fungal-feeders and omnivores/predators [37]. However, one study has [38] observed no effect of composted waste on nematode communities.
To optimize outcomes for plant and soil health, greater understanding is needed about how management practices affect interrelationships between SOC, nutrient cycling and soil food webs [39]. The current study examined the effects of applying two recycled waste composts (incorporating either dairy manure or municipal food waste) in an almond orchard, comparing them to either a fertilized (N+) or unfertilized (N−) control over two years. The objectives were: (1) To determine the effects of composts on SOC and nitrogen (N) pools, (2) To characterize how composts influenced bacterial and nematode communities and their interrelationships, and (3) To determine if composts resulted in differences in plant growth and leaf nutrient content. We hypothesized that both composts would increase SOC and soil nutrient pools, with cascading effects on food webs and plant productivity. Expanding knowledge about the biological regulators of organic matter and nutrient dynamics could facilitate future management of food webs for increased soil fertility, which is particularly important in organic farming systems [39].

2. Materials and Methods

2.1. Orchard Establishment and Experimental Design

To characterize how soil communities responded to compost addition, an almond orchard was planted in March 2016 at the Armstrong Plant Pathology Research Station, University of California Davis, Davis, CA, USA. The soil was mapped as a Yolo silty clay loam [40] and contained 0.97% C and 0.1% N with a pH of 7.8. The experiment compared the effects of two commercially available composts. The first, termed food waste compost (FWC), incorporated municipal food scraps, yard clippings and agricultural waste. It had a C:N of 14 and was composed of 49.8% organic matter and 25% organic carbon with 1.8% N. The second compost included waste streams classified as agricultural, green waste and dairy manure, and will be referred to as dairy manure compost (DMC). This compost had a C:N of 10.8, and was composed of 28.5% organic matter and 14% organic carbon with 1.3% N.
The experiment had four main treatments: FWC, DMC, nitrogen fertilizer (N+) and a control without any organic or inorganic amendments (N−). All treatments were planted with container nursery stock of ‘Nonpareil‘ almonds on ‘Krymsky 86′ rootstock on a 2.7 * 4.9 m spacing. Each experimental unit consisted of two trees separated from other treatments by one pollinizer buffer tree (either the almond cultivar, ‘Monterey‘, on ‘Krymsky 86′ rootstock or ‘Wood colony‘ on ‘Krymsky 86′). There were six replicates of each treatment applied in a randomized complete block design, treating tree row as the block, so that within each of the six tree rows, each treatment was replicated once. Almond plantings were watered for approximately 20 h each week by drip irrigation, with each tree having two 7.6 L h−1 emitters.
Both composts were applied pre-planting with a front loader and spread evenly with shovels. Composts were applied at a rate of 112.09 metric tons dry weight ha−1 to an 8 m2 area comprising the berms of two tree rows. This rate was chosen to approximate the estimated N needed by the trees in their first year; assuming that only 10% of the total N from the compost mineralized [41], so that each tree received a total of 0.08 kg N. For the N fertilizer treatment, urea ammonium nitrate (UAN-32) was applied in year one at a rate of 88.7 mL N per tree or 91.9 kg N ha−1, spread out into six applications of 14.8 mL (½ oz) tree−1. Applications occurred three times in June, twice in July and once in October of 2016. In 2017, the total applied N in fertilizer treatments increased to 177.4 mL N tree−1, as recommended [42] with applications occurring three times in May and three times in June. Fertilizer was applied by injection into the irrigation lines, and separate lines were used for fertilizer, compost and control trees so that all treatments received equal amounts of water.

2.2. Soil Sampling and Plant Measurements

Soil was sampled with two 6.3 cm diameter cores at a depth of 0–25.4 cm, 30 cm from the trunk of each tree and composited for each plot replicate. Sampling occurred three times each year in May, July and October. Fresh soil samples were analyzed for mineral N contents using 2 M KCl extraction of 40 g soil followed by colorimetric determination of nitrate (NO3) and ammonium (NH4+) contents [43]. After soil was dried at 60 °C, and sieved to 2 mm, soil particle sizes were determined by laser diffraction on a Beckman-Coulter LS-230 Particle Size Analyzer [44]. Finely ground soil was analyzed for total N (%) and C (%) on a Europe Hydra 20/20 isotope ratio mass spectrometer at the University of California Davis Stable Isotope Facility. Labile soil carbon, represented as permanganate oxidizable carbon (POXC) was measured in October of each year on finely ground soil following Culman et al. [45]. Briefly, triplicate samples of 2.5 g soil were oxidised with 0.02 mol L−1 KMnO4 with 2 min shaking followed by 10 min incubation and non-reduced Mn7+ quantified by colorimetry.
Indicators of tree productivity included trunk diameter and leaf N. Trunk diameters were measured with a caliper at the beginning and end of each year, in May and October, two feet above the soil. Leaves were collected for N analysis three times each year in May, July and October. For each of the two trees in each plot, five young, fully mature leaves were collected so that 10 leaves were collected for each experimental replicate. Leaves were dried at 60 °C for one week, finely ground, and total N (%) and C (%) determined on a Europe Hydra 20/20 isotope ratio mass spectrometer at the University of California Davis Stable Isotope Facility.

2.3. Nematode Communities

Nematodes were extracted from 200 mL of field moist soil using a sieving and decanting technique followed by sugar centrifugation [46]. The total number of nematodes in each sample was counted and the first 200 encountered on a slide were identified. Most nematodes were identified to the genus level [47], although some were only identified to the family level, such as those in the families Qudsianematidae and Tylenchidae, as genera within these groups are difficult to distinguish. The abundance of nematode groups identified were used to calculate indices of ecosystem functioning. For example, the Enrichment Index (EI) indicates the activity of primary detrital consumers. [48], while the Channel Index provides information on whether decomposition is proceeding more through bacterial or fungal channels, and the Structure index increases with food web complexity [48]. Nematode metabolic footprints were also calculated to provide an estimate of the contribution of different functional guilds of nematodes to functions related to carbon and nutrient cycling based on their size-dependent metabolic activity [30]. Calculations of indices and metabolic footprints were completed using the online platform, NINJA: ‘Nematode INdicator Joint Analysis’ [49].

2.4. Phylogenetic and Taxonomic Analysis of Prokaryotic Communities

Soils for molecular analysis (which were only collected in July and October of each year) were transported to the laboratory on ice and immediately stored at −80 °C until DNA extraction. Total DNA was extracted from 0.25 g of soil per sample using the DNeasy PowerLyzer PowerSoil kit (Qiagen, Inc., Germantown, MD) following the manufacturer’s protocol. Gel electrophoresis was used to assess quality of DNA after each extraction. Yields were assessed with a Qubit 3 fluorometer (ThermoFisher, Waltham, MA, USA) and extractions producing >15.0 ng µL−1 DNA were used to construct 16S rRNA gene libraries.
Libraries were prepared using a standard 16S rRNA primer pair: 515-F (GTGCCAGCMGCCGCGGTAA) and 806-R (GGACTACHVGGGTWTCTAAT) targeting the gene’s V4 hypervariable region ([50]). PCR was performed in duplicate using Phusion Hot Start II High-Fidelity PCR Master Mix (Thermo Scientific Inc., Waltham, MA, USA). Reactions were conducted using a modified form of the manufacturer’s protocol, with 1 µL DNA template (15 ng µL−1), 1 µL of each primer (10 µMol), 10 µL master mix, and 7 µL water to reach a final volume of 20 µL reaction−1. Negative controls were used in each batch of PCRs, substituting 1 µL DNA template with 1 µL water and a unique reverse barcode to remove contaminating DNA following sequencing analysis. All reactions were conducted using the C1000 Touch Thermo Cycler from Bio-Rad Laboratories, Inc. (Hercules, CA, USA). PCR cycles included a 30s initial denaturation at 98 °C, followed by 27 cycles of denaturation at 98 °C for 10s, annealing at 50 °C for 30 s, extension at 72°C for 15 s, and a 7 min final extension at 72 °C before being held at 4°C. Following PCR, a 3 µL aliquot of each reaction was assessed on an agarose gel to ensure specific and successful amplification. Duplicate reactions were then mixed and assessed for concentration using the Qubit 3 fluorometer (ThermoFisher, Waltham, MA, USA). Next, 100 ng of each successful reaction was pooled and purified using the QIAGEN’s QIAquick PCR Purification Kit (Qiagen, Inc., Germantown, MD, USA) according to the manufacturer’s protocol. Completed libraries were then sequenced on the MiSeq PE250 system at the UC Davis DNA Technologies Core and processed using the Dada2 platform using conventional methods recently described [51].
Diversity was quantified using both taxonomic- and phylogenetic-based methods. Taxonomic alpha diversity was measured as exact sequence variants (ESV) [52] and taxonomic group richness and equitability (Shannon diversity) within individual communities. Taxonomic dissimilarity of different communities was measured as the Bray-Curtis distance among samples based on ESV and taxonomic group membership [53]. Bacterial soil functions were inferred from taxonomy using FAPROTAX [54] which uses established literature on cultured strains to synthesize a putative functional profile for the total community.

2.5. Statistics

The statistical program R v4.0.3 (R Core Team, 2021) was used to assess the effects of compost on soil, bacteria, nematode and plant variables. Treatment effects were analyzed using analysis of variance (ANOVA), with means separated by Tukey’s honestly significant difference (HSD) tests. Assumptions of homogeneity of variance and normality were assessed by Levene’s and Shapiro–Wilk tests, respectively, and data were either log or square root transformed as needed. In cases where assumptions could not be met even with transformation, differences between treatments were assessed by non-parametric Kruskal-Wallace tests followed by a post-hoc Dunn’s test. To measure changes in trunk diameter, which was taken for both trees in a plot, mixed effects analysis was performed using the R package lme4 [55] with treatment as a fixed effect and plot as a random effect. Relationships between trunk diameter and soil properties were examined for each timepoint using Pearson’s correlations. Since nematode and bacterial abundance was often non-normally distributed, Spearman’s rank correlations were used to determine the relationships between genera within each treatment.
For the Domains Bacteria and Archaea, the above analyses focused on the 20 most abundant taxa in the dataset. This assessment was verified using rank abundance curves where genera abundance was greatly diminished beyond the most represented taxa. All 797 genera were included, though, for non-metric multidimensional scaling (NMDS) analyses, which compared community composition between treatments. NMDS was conducted using the metaMDS function in the vegan package of R [56] and plotted using ggplot2 [57]. The vegan package was also used to calculate diversity indices (Shannon diversity, evenness and richness).

3. Results

3.1. Soil Variables

Compost treatments had higher total mineral soil N than controls throughout most of the experiment, but only influenced labile N pools within the first year (Table 1). Immediately after compost application in May of year one, FWC treated plots had higher NH4+-N than controls (p < 0.01) and a similar trend was observed for DMC (p = 0.06). Soon after it was applied through the irrigation system, fertilizer treatments had more than 3 times higher NO3-N and NH4+-N than controls in July (Table 1, p = 0.01). By October, though, the effects of the fertilizer had dissipated and DMC had increased NH4+-N and NO3-N to more than two times higher than controls or fertilizer treatments (p < 0.05). In the second year, the only effects seen in labile N pools were that fertilizer dramatically increased NO3-N compared to all other treatments soon after application in July (Table 1).
Composts application increased SOC measured at multiple timepoints (Table 1), often increasing total soil C by at least 50% (p < 0.05). Similar trends were seen in the more labile C pool, POXC. In year one, POXC levels were more than twice as high for FWC and DMC compared to controls (p < 0.01). Both composts also showed elevated POXC levels compared to fertilizer treatments (p < 0.01). By the end of the experiment, in October of year two, FWC and DMC continued to have higher POXC than either N− controls or fertilizer treatments (p < 0.01). Particle size analysis showed that soil had an average of 37.6% sand, 58.1% silt and 4.33% clay. In contrast to the trend for POXC, the percent clay content for FWC (3.77 ± 0.29) and DMC (3.60 ± 0.20) was lower than either controls (4.89 ± 0.18) or fertilizer treatments (p < 0.05; 5.06 ± 0.33).

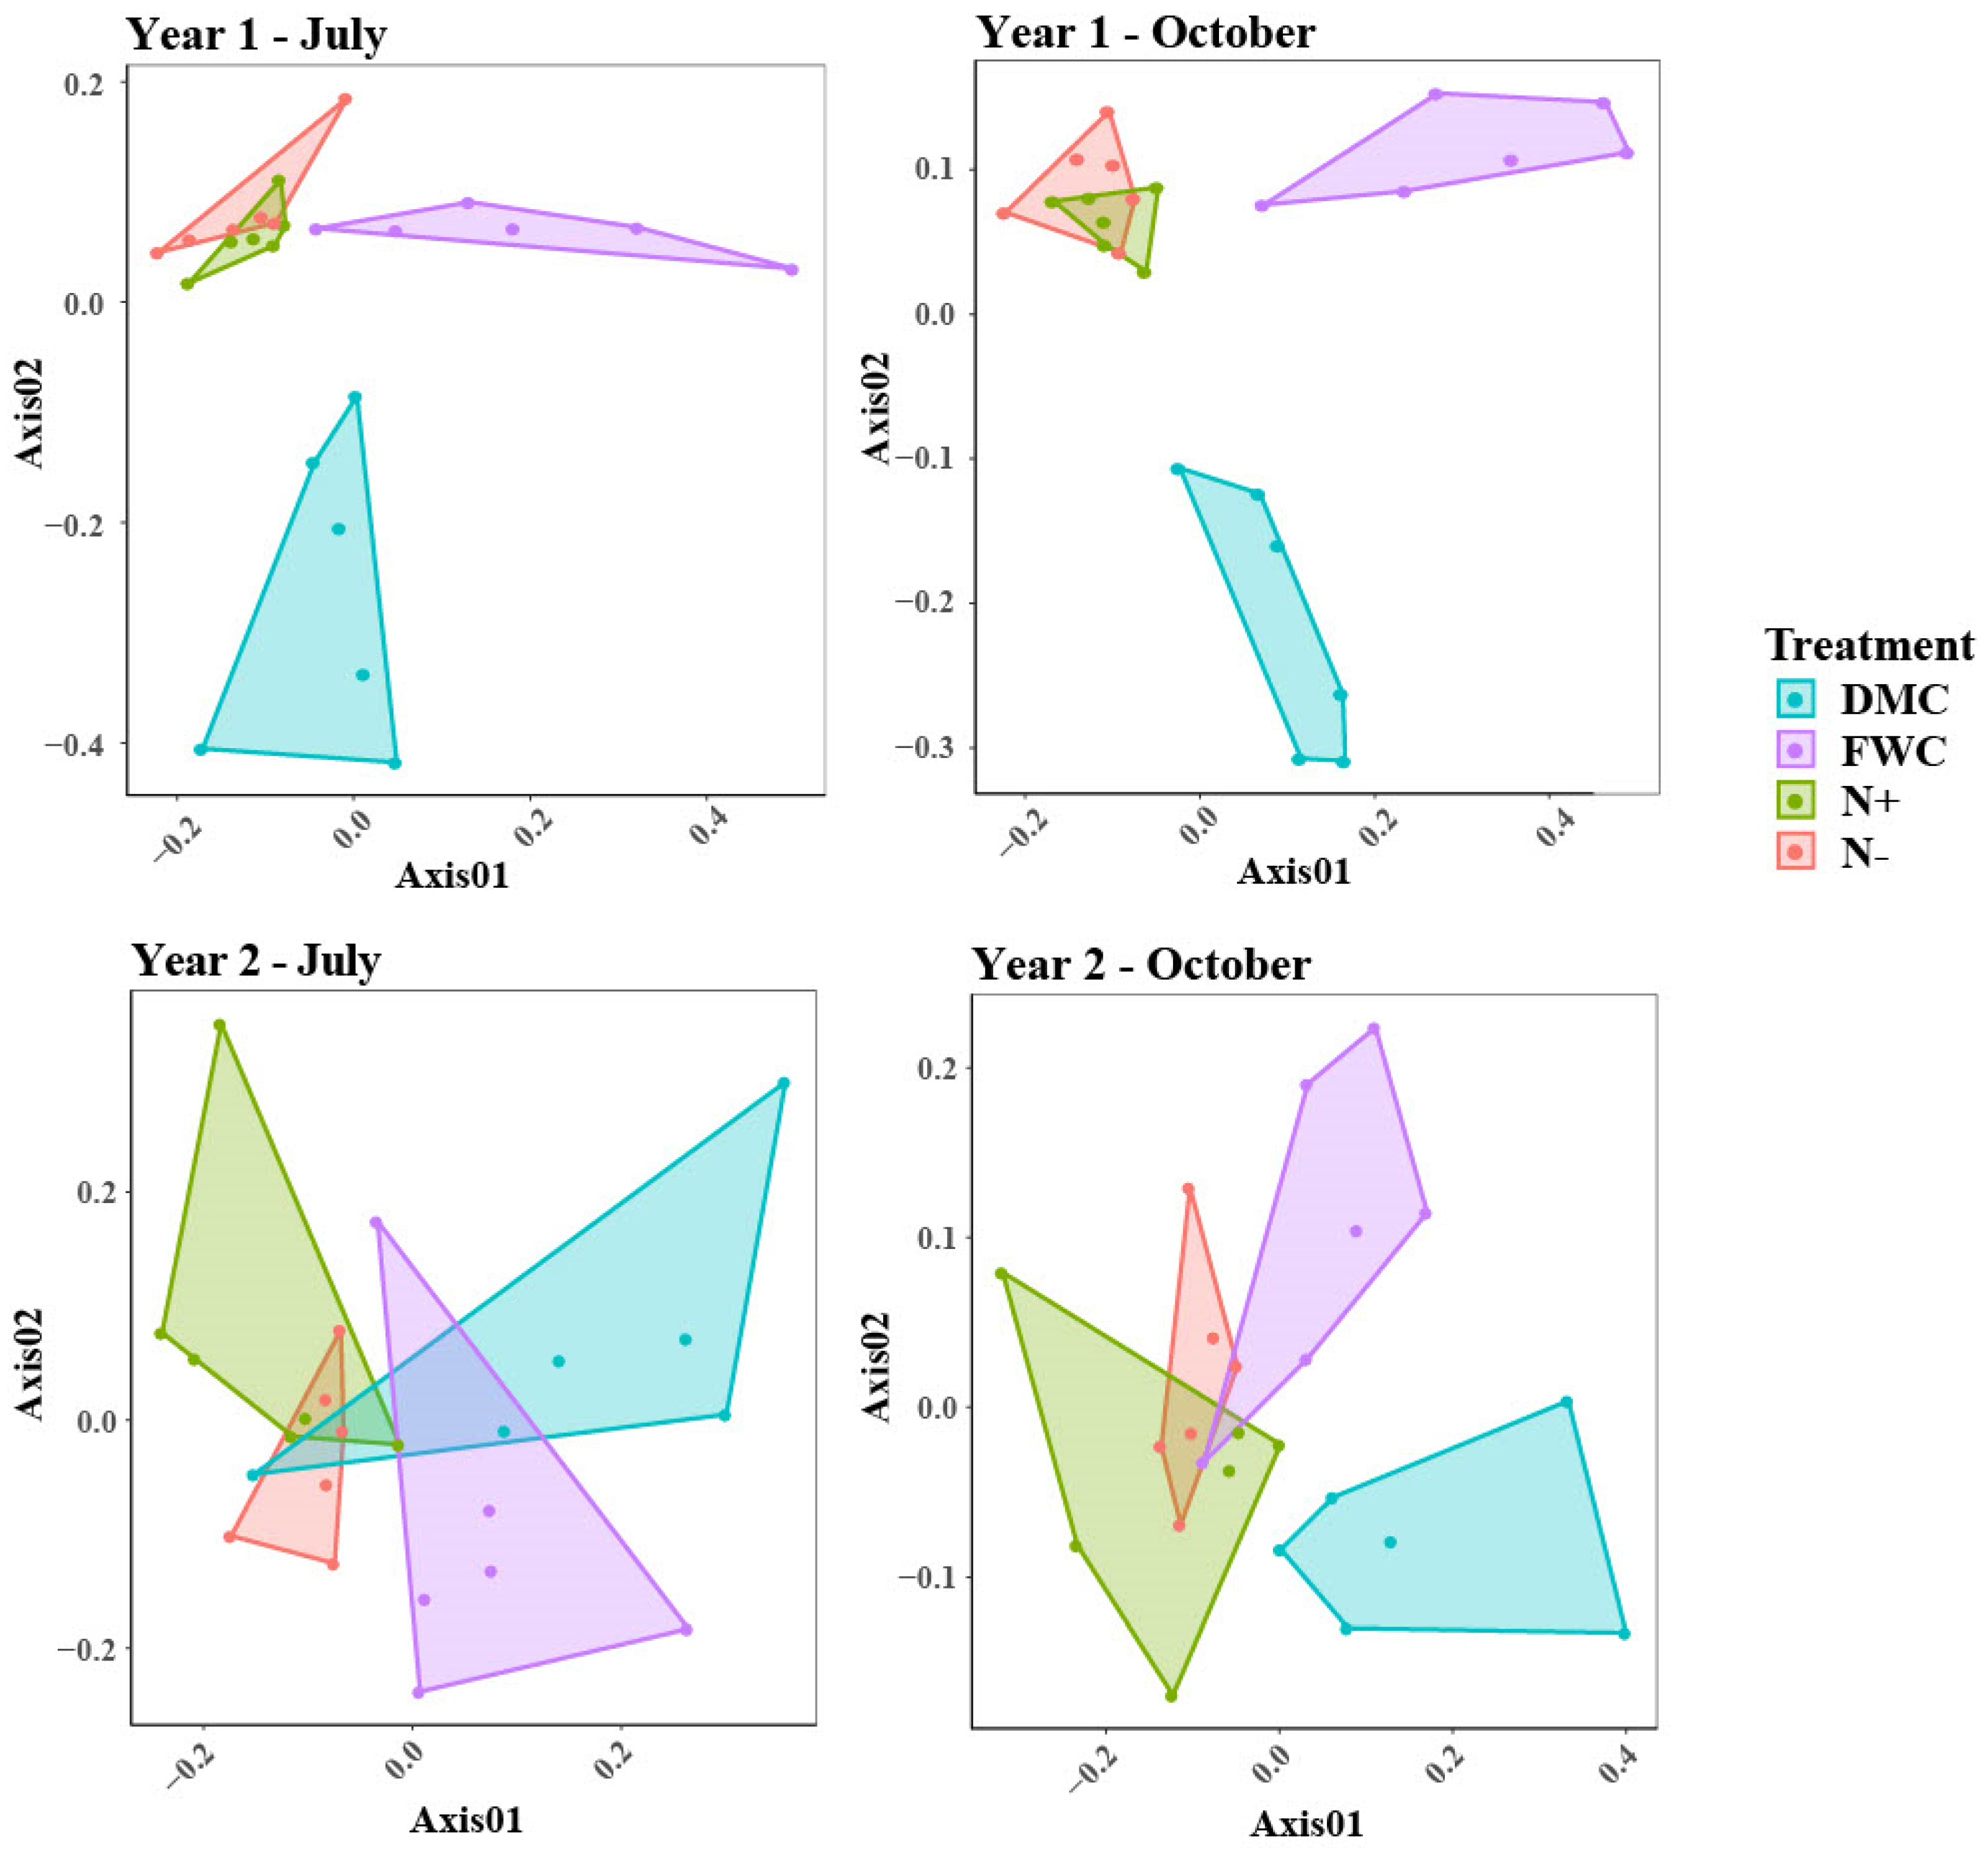
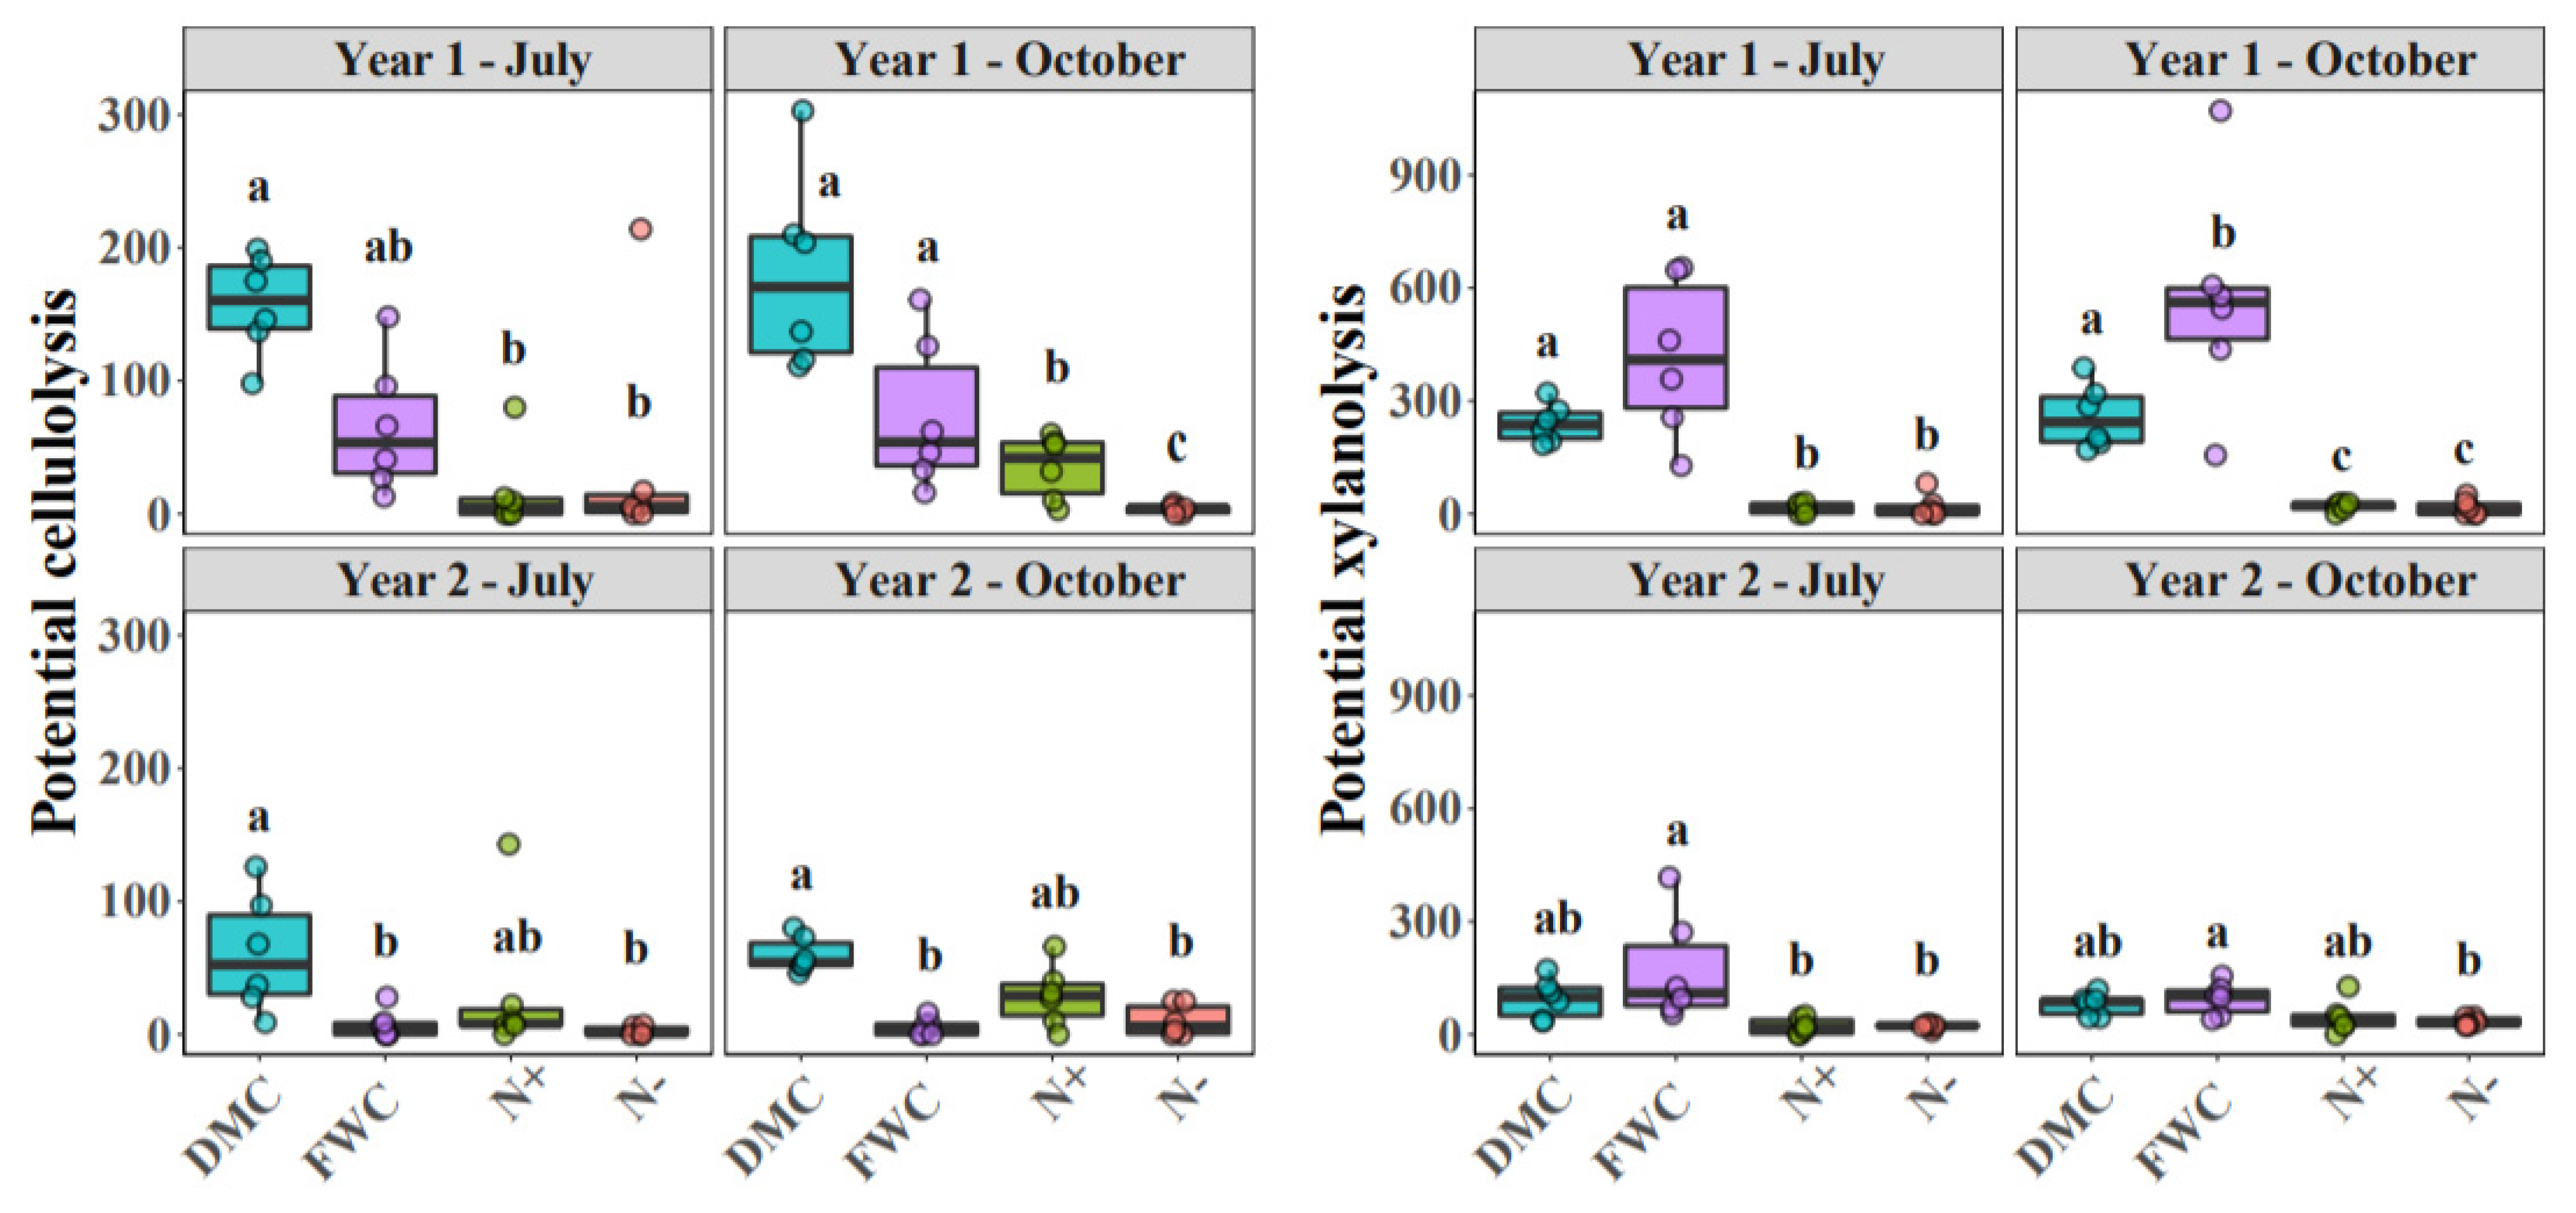
3.2. Bacterial and Archaeal Communities

Sequencing identified 797 bacterial and archaeal genera, whose community composition differed between treatments over time (Figure 1). Across all treatments, bacterial species richness (determined by exact sequence variants) and Shannon diversity generally decreased in year two compared to year one (Table 2, p < 0.01). While treatments did not influence species richness, both composts increased species evenness compared to fertilizer and control treatments (p < 0.05, Table 2) at certain time points. In July of year two, fertilizer treatments decreased Shannon diversity compared to DMC and FWC (p < 0.05). Non-metric multidimensional scaling analysis showed that in July and October of year one, FWC and DMC treatments hosted communities that were distinct, both from each other, and from the control and fertilizer treatments (Figure 1). These differences had largely disappeared by year two, but DMC again clustered slightly apart from other treatments by the end of the experiment. Differential abundance analysis showed that several taxa responded negatively to compost application (Tables S1 and S2) including Rubrobacter, Pseudarthrobacter and Solirubacter. Adding FWC increased the abundance of Lysinibacillus compared to either controls (p < 0.01) or nitrogen treatments (p < 0.01) in July of year one. Both composts increased Steroidobacter compared to nitrogen treatments in October of year two (p < 0.01).
When bacteria and archaea were separated into groups indicative of function, compost application showed a higher relative abundance of those with carbon degrading potential (Figure 2). Both organic treatments increased the relative abundance of bacteria with xylanolytic potential compared to control and fertilizer treatments in July and October of year one (p < 0.01). For bacteria with cellulolytic potential, only DMC caused increases, which were three times higher than N− controls in July of year one (p < 0.01) and 49 times higher than controls in October (p < 0.01). Effects were less pronounced in the second year, although FWC continued to have slightly higher xylanolytic potential than controls in July (p < 0.01) and October (p = 0.05) and DMC had higher cellulolytic potential than controls (p < 0.01). Some differences were also observed between the two sources of compost. FWC had higher abundance of bacteria with xylanolytic potential than DMC in October of year one (p = 0.02), but DMC had higher abundances of bacteria with cellulolytic potential (p < 0.01), a trend which continued into both timepoints of the second year (p = 0.02; p < 0.01).

3.3. Nematode Communities

Over the two years of the experiment, 15 groups of nematodes were identified (Table 3 and Table 4) including bacterial feeders, fungal feeders, plant root feeders, omnivores, and predators. Nematodes were very abundant, with an average of 1975.6 ± 108.5 individuals 200 mL−1 soil and 1.3 ± 0.1 mg estimated biomass. While some nematodes, such as Panagrolaimus and Aphelenchoides, were common throughout the experiment, others, such as the bacterial feeder, Prismatolaimus, were not detected in any samples until the fall of year one. After the initial disturbance of planting, the complexity of the nematode food web increased over time, with higher levels of the Structure Index (p < 0.01, F = 13.6), and Structure metabolic footprint (p = 0.02, F = 6.3) in the second year (data not shown).
Different groups of bacterial feeding nematodes responded to compost treatments over time (Table 3). FWC treated plots had greater relative abundances of Cephalobus compared to control or N plots (p < 0.01) after composts were incorporated in May of year one. DMC similarly increased Cephalobus compared to N treatments (p = 0.02), although these effects were observed before fertilizer treatments had been applied (Table 3). By the end of year one in October, Prismatolaimus made up a larger portion of the nematode community in DMC compared to N treatments (p = 0.03) although the abundance of these nematodes was generally low (under 6%). In May of year two, the total relative abundance of bacterial feeding nematodes was greater in DMC treatments (Table 4) compared to N+ treatments (p < 0.01).
In contrast to the effect seen for bacterial feeders, composts decreased the relative abundance of certain fungal feeding nematodes (Table 4). In spring of year two, both DMC and FWC treatments depressed the relative abundance of Aphelenchus compared to control and N treatments (p < 0.05). This contributed to lower abundance of fungal feeders, overall, in compost treatments compared to N or control treatments (p < 0.04). DMC continued to depress Aphelenchus abundance into the summer of year two compared to N treatments (p = 0.04, Table 5). However, no effects were seen on other nematode indicators such as the Channel index or nematode Fungal metabolic footprint (data not shown).
Herbivorous nematodes increased with both N and FWC treatments compared to controls, although these effects occurred in different timeframes (Table 3, Table 4). In July of year one, recently fertilized plots had a higher relative abundance of the plant parasitic nematode, Pratylenchus, than controls (Table 3; p < 0.01). However, compost treatments did not influence herbivorous nematodes until the following spring (Table 4), after which the relative abundance of herbivores was higher in FWC treatments compared to controls in both May (p = 0.03) and July (p = 0.03) of year two. This was particularly apparent for root tip feeding nematodes in the family Tylenchidae, which were more abundance with FWC than controls (p = 0.03).

3.4. Relationships between Microbes and Nematodes

When the relationship between bacterial and nematode groups were examined, some groups showed consistent trends across all treatments, while others showed relationships that were more treatment specific (Figure 3). For example, in all treatment categories, the bacterial genera Bacillus was positively associated with bacterial feeding nematodes such as Panagrolaimus, Rhabditis and Cephalobus, as well as the fungal feeder, Aphelenchoides (p < 0.05), but was negatively associated with the bacterial feeder, Acrobeloides (p < 0.05). In some cases, the addition of compost caused new relationships to become apparent (Figure 3). For example, Lysinbacillus showed a positive correlation with Panagrolaimus in FWC (rs = 0.41, p < 0.05) and DMC treatments (rs = 0.47, p < 0.05) but had no relationship to this nematode genus in N− control (rs = 0.10) or N+ treatments (rs = 0.11). Other positive correlations between microbes and nematodes unique to the compost treatments included MND1 and Acrobeloides, as well as MND1, Bryobacter and Psychroglaciecola positively associating with Primatolaimus, which was also associated with the archaea Candidatus Nitrososphaera (p < 0.05).

3.5. Plant Measurements

Almond trees increased in trunk diameter each year (Table 5, p < 0.01). However, slight differences in growth between the treatments were only observed in the first year (Table 5), with FWC treatments increasing trunk diameter by an average of 4.3 mm more than N− controls (p = 0.02). Increased growth in year one was positively associated with soil factors such as soil N (p = 0.02, R = 0.45) and POXC (p < 0.01, R = 0.57). Fertilizer increased leaf N contents compared to controls in October of year one (p = 0.01, Table 5). In July of year two, Fertilizer again increased leaf N compared to controls as well as FWC and DMC treatments (p < 0.01). The leaf N content of DMC treatments in July was also slightly higher than N− controls (p = 0.08). Leaf samples for October 2017 molded and were therefore not able to be analyzed. By the end of the experiment, cumulative growth for all trees was similar between treatments.

4. Discussion

In this study, compost influenced microbial and nematode communities as well as soil organic matter, nutrient pools and plant growth. Compost released N in plant available forms within the first year, but in contrast to fertilizer, it did not increase leaf N concentrations, perhaps because the timing of release was asynchronous with plant needs [10]. Compared to N− controls, soil NO3 and NH4+ concentrations were only elevated with composts immediately after application and in the fall of year one, while fertilizer showed more consistent effects each year during the period it was applied in May–July. These results are partially in line with others who have found that composted waste products can increase orchard tree growth and that while slight increases in leaf nutrient content are possible, they are not as great as that seen with fertilizer [58,59,60]. The observed increase in tree growth with FWC compared to controls may have been due to increased root production, since higher populations of root feeding nematodes were also present in these treatments. Both composts altered soil properties, increasing SOC pools and reducing clay content, which could have made it physically easier for roots to penetrate the soil, however; effects on growth were only seen with FWC. Compared to DMC, FWC had a higher total N content, as well as higher organic matter content, which may have contributed to differences in tree growth.
In tandem with its plant and soil effects, compost influenced microbial communities within the first year of application. NMDS results showed that both composts temporarily shifted bacteria and archaea into separate, distinct communities from fertilized or un-amended controls. In apples, composted poultry litter and yard waste has also been found to result in distinct bacterial communities [60]. Similar to Sharaf et al. [60], both composts in our study caused slightly higher Shannon diversity indices than fertilizer in year two, although this could be due to fertilizer suppressing microbes rather than compost elevating them [61]. While composts did not increase or decrease bacterial species richness compared to untreated controls, they did increase species evenness. Similar increases in bacterial evenness have been found with long term applications of manure and increased bacterial evenness has been shown to improve N cycling under stressful conditions, likely since many similar species are abundant enough to perform the same function [62].
Compost application especially increased those groups associated with carbon processing. Bacteria with presumptive cellulolytic and xylanolytic potential were more abundant with composts than fertilizer or untreated controls in the first year, suggesting that these groups were contributing to the observed community shifts. When the composts were compared to each other, FWC had higher abundance of bacteria with xylanolytic potential, while DMC had a higher abundance of bacteria with cellulolytic potential, perhaps due to differences in compost feedstocks. In another study [60], yard waste compost similarly increased bacterial groups implicated in generalized carbon cycling. Several of the specific taxa that increased with compost in this study are known to be associated with cycling nutrients. For example, Steroidobacter has been found to increase with organic amendment addition in soils with low initial SOC [63] and may be involved in nitrogen cycling under these conditions since it can only accept nitrates from a narrow range of compounds [64]. Species of Lysinibacillus have also been found to promote plant growth and enhance nutrient cycling [65,66,67]. Although they were not an explicit focus of this study, no known human pathogens were detected, which is a serious concerns for growers considering applying compost in almond orchards [17], however to confirm food safety, more targeted molecular approaches would likely be necessary.
Compost affected bacterial-feeding nematodes most strongly in the spring after application, with DMC increasing their relative abundance compared to untreated controls as well as fertilizer treatments. Since the rate of N mineralization from composts is likely to be slower than other organic amendments, with little N available in the first year, applications before the winter are sometimes recommended so that nutrients are available the following spring [68,69]. Although microbial communities were not measured at this time point, increased mineralization of nutrients from the compost may have stimulated bacterial growth, which could have provided food for the nematodes. Supporting this hypothesis is the observation that DMC plots had larger pools of NH4+-N the previous fall, although no differences in labile N were seen in spring of year two. Other studies have also observed increases in bacterial feeding nematodes with organic amendments, although effects vary with amendment composition [59,70]. It is surprising, though, that unlike microbial communities, compost did not induce large shifts in the species composition of nematodes. Herren et al. [38] also did not find changes in nematode community structure with compost addition, and suggested that recent tillage may disturbed the nematode community. Prior to planting with almonds, the field (which had been fallow for several years), was tilled, a practice known to decrease nematode community structure and alter the way soil food webs interact with organic amendments [71,72].
Relationships between nematode and bacterial/archaeal genera varied between treatments, suggesting that compost alters trophic dynamics between both groups. For example, the bacteria Lysinbacillus, had higher relative abundance with FWC than either N+ or N− controls. In correlations, Lysinbacillus was also associated with the bacterial feeding nematode, Panagrolaimus, but this relationship was only apparent within the compost treatments. It is known that bacteria can influence nematode survival and reproduction [73,74] and that nematodes can also alter microbial communities through their grazing [75,76], decreasing microbial biomass, but also increasing microbial activity [75]. Such predation can influence plant nutrient update [77,78], which may have contributed to the increased tree growth seen with the FWC treatment. Others have found that interactions between microbes and microbial feeding nematodes can vary with organic amendment application [70] as well as with their physical location in soil pores [79,80], so it is possible that by altering the composition of microaggregates in the soil, organic amendments influenced potential predator prey relationships. Since bacterial abundance was not directly quantified in this study, however; it is difficult to ascertain which of these mechanisms was the cause of the observed relationships.

5. Conclusions

In the current study, the two recycled waste composts increased SOC, but showed different effects on soil nitrogen pools and food webs. While DMC increased NH4+-N and NO3-N late in the first year and stimulated the activity of bacterial feeding nematodes, FWC was associated with more rapid increases in tree growth and populations of root feeding nematodes, as well as greater relative abundance of the bacteria, Lysinbacillus. Relationships between nematode and bacterial/archaeal genera varied between treatments, suggesting that compost can alter trophic interactions in the soil food web under field conditions, in contrast to previous studies that have usually used microcosms [75,76,77]. Compost applications influenced the soil food web, N cycling and tree growth mostly in the first year. In the second year, fertilizer showed greater effects than other treatments on tree growth and leaf N. Results suggest that while compost can contribute to biologically based nitrogen cycling and stimulate soil food webs, additional N inputs are likely needed to plant growth requirements.

Supplementary Materials

The following are available online at https://www.mdpi.com/article/10.3390/agronomy11091745/s1, Table S1: Differences in bacterial and archaeal (Candidatus Nitrososphaera) taxa between treatments compared to untreated controls based on ANOVA comparisons of relative abundance. Table S2: Differences in bacterial and archaeal (Candidatus Nitrososphaera) taxa between other treatments compared to the fertilizer treatment, based on ANOVA comparisons of relative abundance.

Author Contributions

Conceptualization, A.K.H. and J.M.S.; methodology, A.K.H., J.M.S. and M.C.C.P.L.; resources, J.L.M.R.; writing—original draft preparation, A.K.H.; writing—review and editing, J.M.S., J.L.M.R. and M.C.C.P.L. All authors have read and agreed to the published version of the manuscript.

Funding

This publication was supported by the U.S. Department of Agriculture’s (USDA) Agricultural Marketing Service through Grant 17-SCBGP-CA-0041. Its contents are solely the responsibility of the authors and do not necessarily represent the official views of the USDA. This work was also supported in part by California Safe Soils (a producer of food hydrolysate).

Institutional Review Board Statement

Not applicable.

Informed Consent Statement

Not applicable.

Data Availability Statement

Data available upon request.

Acknowledgments

Special thanks to Bryan Pellissier for assistance with site management and agronomic advice, Xuyun Yang for assistance with nematode extraction and identification, and Janina Milkereit, Danica Dito, Andrew Cicchetto, Kisna Prado and Malina Loeher for field and lab assistance.

Conflicts of Interest

The authors declare no conflict of interest.

References

  1. Stott, D.E. Recommended Soil Health Indicators and Associated Laboratory Procedures; Soil Health Technical Note No. 450-03; United States Department of Agriculture, Natural Resources Conservation Service: Washington, DC, USA, 2019. [Google Scholar]
  2. Van Bruggen, A.; Semenov, A. In search of biological indicators for soil health and disease suppression. Appl. Soil Ecol. 2000, 15, 13–24. [Google Scholar] [CrossRef]
  3. Pankhurst, C.; Doube, B.; Gupta, V. Biological Indicators of Soil Health; CAB Iternational: Wallingford, UK, 1997; Volume 17. [Google Scholar]
  4. Lal, R. Soil health and carbon management. Food Energy Secur. 2016, 5, 212–222. [Google Scholar] [CrossRef]
  5. Stevenson, F.J. Humus Chemistry: Genesis, Composition, Reactions; Wiley: New York, NY, USA, 1994. [Google Scholar]
  6. Lal, R. Soil carbon sequestration to mitigate climate change. Geoderma 2004, 123, 1–22. [Google Scholar] [CrossRef]
  7. Bernal, M.P.; Alburquerque, J.A.; Moral, R. Composting of animal manures and chemical criteria for compost maturity assessment. A review. Bioresour. Technol. 2009, 100, 5444–5453. [Google Scholar] [CrossRef] [PubMed]
  8. Scotti, R.; Pane, C.; Spaccini, R.; Palese, A.M.; Piccolo, A.; Celano, G.; Zaccardelli, M. On-farm compost: A useful tool to improve soil quality under intensive farming systems. Appl. Soil Ecol. 2016, 107, 13–23. [Google Scholar] [CrossRef]
  9. Duong, T.T.T.; Penfold, C.; Marschner, P. Amending soils of different texture with six compost types: Impact on soil nutrient availability, plant growth and nutrient uptake. Plant Soil 2012, 354, 197–209. [Google Scholar] [CrossRef]
  10. Evanylo, G.; Sherony, C.; Spargo, J.; Starner, D.; Brosius, M.; Haering, K. Soil and water environmental effects of fertilizer-, manure-, and compost-based fertility practices in an organic vegetable cropping system. Agric. Ecosyst. Environ. 2008, 127, 50–58. [Google Scholar] [CrossRef]
  11. Owen, J.J.; Silver, W.L. Greenhouse gas emissions from dairy manure management: A review of field-based studies. Glob. Change Biol. 2015, 21, 550–565. [Google Scholar] [CrossRef] [Green Version]
  12. Levis, J.W.; Barlaz, M.A.; Themelis, N.J.; Ulloa, P. Assessment of the state of food waste treatment in the United States and Canada. Waste Manag. 2010, 30, 1486–1494. [Google Scholar] [CrossRef]
  13. Adhikari, B.; Barrington, S.; Martinez, J. Urban food waste generation: Challenges and opportunities. Int. J. Environ. Waste Manag. Indersci. 2011, 3, 4–21. [Google Scholar] [CrossRef] [Green Version]
  14. Butler, T.J.; Han, K.J.; Muir, J.P.; Weindorf, D.C.; Lastly, L. Dairy manure compost effects on corn silage production and soil properties. Agron. J. 2008, 100, 1541–1545. [Google Scholar] [CrossRef]
  15. Butler, T.J.; Muir, J.P. Dairy manure compost improves soil and increases tall wheatgrass yield. Agron. J. 2006, 98, 1090–1096. [Google Scholar] [CrossRef] [Green Version]
  16. Lepsch, H.C.; Brown, P.H.; Peterson, C.A.; Gaudin, A.C.M.; Khalsa, S.D.S. Impact of organic matter amendments on soil and tree water status in a California orchard. Agric. Water Manag. 2019, 222, 204–212. [Google Scholar] [CrossRef]
  17. Khalsa, S.D.S.; Brown, P.H. Grower analysis of organic matter amendments in California orchards. J. Environ. Qual. 2017, 46, 649–658. [Google Scholar] [CrossRef]
  18. Lee, J.J.; Park, R.D.; Kim, Y.W.; Shim, J.H.; Chae, D.H.; Rim, Y.S.; Sohn, B.K.; Kim, T.H.; Kim, K.Y. Effect of food waste compost on microbial population, soil enzyme activity and lettuce growth. Bioresour. Technol. 2004, 93, 21–28. [Google Scholar] [CrossRef]
  19. Bernard, E.; Larkin, R.P.; Tavantzis, S.; Erich, M.S.; Alyokhin, A.; Sewell, G.; Lannan, A.; Gross, S.D. Compost, rapeseed rotation, and biocontrol agents significantly impact soil microbial communities in organic and conventional potato production systems. Appl. Soil Ecol. 2012, 52, 29–41. [Google Scholar] [CrossRef]
  20. Zhen, Z.; Liu, H.; Wang, N.; Guo, L.; Meng, J.; Ding, N.; Wu, G.; Jiang, G. Effects of manure compost application on soil microbial community diversity and soil microenvironments in a temperate cropland in China. PLoS ONE 2014, 9, e108555. [Google Scholar] [CrossRef]
  21. Wagg, C.; Bender, S.F.; Widmer, F.; van der Heijden, M.G.A. Soil biodiversity and soil community composition determine ecosystem multifunctionality. Proc. Natl. Acad. Sci. USA 2014, 111, 5266–5270. [Google Scholar] [CrossRef] [Green Version]
  22. Martínez-Blanco, J.; Lazcano, C.; Christensen, T.H.; Muñoz, P.; Rieradevall, J.; Møller, J.; Antón, A.; Boldrin, A. Compost benefits for agriculture evaluated by life cycle assessment. A review. Agron. Sustain. Dev. 2013, 33, 721–732. [Google Scholar] [CrossRef] [Green Version]
  23. Yang, W.; Guo, Y.; Wang, X.; Chen, C.; Hu, Y.; Cheng, L.; Gu, S.; Xu, X. Temporal variations of soil microbial community under compost addition in black soil of Northeast China. Appl. Soil Ecol. 2017, 121, 214–222. [Google Scholar] [CrossRef]
  24. O’Donnell, A.G.; Colvan, S.R. Biological Diversity and Function in Soils; Choice Reviews Online; Bardgett, R.D., Usher, M.B., Hopkins, D.W., Eds.; Cambridge University Press: Cambridge, UK, 2005; Volume 43, pp. 43–46. ISBN 0521609879. [Google Scholar]
  25. Van der Heijden, M.G.; Wagg, C. Soil microbial diversity and agro-ecosystem functioning. Plant Soil 2013, 363, 1–5. [Google Scholar] [CrossRef] [Green Version]
  26. Saccá, M.L.; Caracciolo, A.B.; Di Lenola, M.; Grenni, P. Soil biological communities and ecosystem resilience. In Soil Biological Communities and Ecosystem Resilience; Springer: Cham, Switzerland, 2017; pp. 9–24. [Google Scholar] [CrossRef]
  27. Marx, V. Microbiology: The return of culture. Nat. Methods 2016, 14, 37–40. [Google Scholar] [CrossRef]
  28. Eisenhauer, N.; Schielzeth, H.; Barnes, A.D.; Barry, K.E.; Bonn, A.; Brose, U.; Bruelheide, H.; Buchmann, N.; Buscot, F.; Ebeling, A.; et al. A multitrophic perspective on biodiversity-ecosystem functioning research. Adv. Ecol. Res. 2019, 61, 1–54. [Google Scholar] [CrossRef]
  29. Ruess, L.; Ferris, H. Decomposition pathways and successional changes. Nematol. Monogr. Perspect. 2004, 2, 547–556. [Google Scholar]
  30. Ferris, H. Form and function: Metabolic footprints of nematodes in the soil food web. Eur. J. Soil Biol. 2010, 46, 97–104. [Google Scholar] [CrossRef]
  31. Steel, H.; de la Peña, E.; Fonderie, P.; Willekens, K.; Borgonie, G.; Bert, W. Nematode succession during composting and the potential of the nematode community as an indicator of compost maturity. Pedobiologia 2010, 53, 181–190. [Google Scholar] [CrossRef]
  32. Ferris, H.; Matute, M.M. Structural and functional succession in the nematode fauna of a soil food web. Appl. Soil Ecol. 2003, 23, 93–110. [Google Scholar] [CrossRef]
  33. DuPont, S.T.; Culman, S.W.; Ferris, H.; Buckley, D.H.; Glover, J.D. No-tillage conversion of harvested perennial grassland to annual cropland reduces root biomass, decreases active carbon stocks, and impacts soil biota. Agric. Ecosyst. Environ. 2010, 137, 25–32. [Google Scholar] [CrossRef]
  34. Niles, R.K.; Wall Freckman, D. From the ground up: Nematode ecology in bioassessment and ecosystem health. Plant Nematode Interact. 2015, 65–85. [Google Scholar] [CrossRef]
  35. Kapp, C.; Storey, S.G.; Malan, A.P. Options for soil health measurement in vineyards and deciduous fruit orchards, with special reference to nematodes. S. Afr. J. Enol. Vitic. 2013, 34, 272–280. [Google Scholar] [CrossRef] [Green Version]
  36. Bulluck, L.R.; Barker, K.R.; Ristaino, J.B. Influences of organic and synthetic soil fertility amendments on nematode trophic groups and community dynamics under tomatoes. Appl. Soil Ecol. 2002, 21, 233–250. [Google Scholar] [CrossRef]
  37. Hu, C.; Qi, Y. Effect of compost and chemical fertilizer on soil nematode community in a Chinese maize field. Eur. J. Soil Biol. 2010, 46, 230–236. [Google Scholar] [CrossRef]
  38. Herren, G.L.; Habraken, J.; Waeyenberge, L.; Haegeman, A.; Viaene, N.; Cougnon, M.; Reheul, D.; Steel, H.; Bert, W. Effects of synthetic fertilizer and farm compost on soil nematode community in long-term crop rotation plots: A morphological and metabarcoding approach. PLoS ONE 2020, 15, e0230153. [Google Scholar] [CrossRef] [PubMed]
  39. Abbott, L.K.; Manning, D.A.C. Soil health and related ecosystem services in organic agriculture. Sustain. Agric. Res. 2015, 4, 116. [Google Scholar] [CrossRef]
  40. Soil Survey Staff, Natural Resources Conservation Service, United States Department of Agriculture. Web Soil Survey. Available online: https://casoilresource.lawr.ucdavis.edu/gmap (accessed on 21 February 2019).
  41. Dufour, R.; Brown, S.; Troxell, D. Nutrient Management Plan (590) for Organic Systems Western State Implementation Guide; United States Department, North Carolina Agricultural and Technical State University: Greensboro, NC, USA, 2014; pp. 72–89. [Google Scholar] [CrossRef]
  42. Meyer, R.D. Nitrogen on drip irrigated almonds. In Years of Discovery. A Compendium of Production and Environmental Research Projects 1972–2003; Almond Board of California: Modesto, CA, USA, 2004; pp. 284–285. [Google Scholar]
  43. Miranda, K.M.; Espey, M.G.; Wink, D.A. A rapid, simple spectrophotometric method for simultaneous detection of nitrate and nitrite. Nitric Oxide 2001, 5, 62–71. [Google Scholar] [CrossRef]
  44. Eshel, G.; Levy, G.J.; Mingelgrin, U.; Singer, M.J. Critical evaluation of the use of laser diffraction for particle-size distribution analysis. Soil Sci. Soc. Am. J. 2004, 68, 736–743. [Google Scholar] [CrossRef]
  45. Culman, S.W.; Snapp, S.S.; Freeman, M.A.; Schipanski, M.E.; Beniston, J.; Lal, R.; Drinkwater, L.E.; Franzluebbers, A.J.; Glover, J.D.; Grandy, A.S.; et al. Permanganate oxidizable carbon reflects a processed soil fraction that is sensitive to management. Soil Sci. Soc. Am. J. 2012, 76, 494. [Google Scholar] [CrossRef] [Green Version]
  46. Barker, K.R. Nematode extraction and bioassays. In An Advanced Treatise on Meloidogyne. Volume II: Methodology; Barker, K.R., Carter, C.C., Sasser, J.N., Eds.; Department of Plant Pathology, North Carolina State University: Raleigh, NC, USA, 1985; pp. 19–35. [Google Scholar]
  47. Bongers, T.; Ferris, H. Nematode community structure as a bioindicator for environmental monitoring. Trends Ecol. Evol. 1999, 14, 224–228. [Google Scholar] [CrossRef]
  48. Ferris, H.; Bongers, T.; De Goede, R.G.M. A framework for soil food web diagnostics: Extension of the nematode faunal analysis concept. Appl. Soil Ecol. 2001, 18, 13–29. [Google Scholar] [CrossRef]
  49. Sieriebriennikov, B.; Ferris, H.; de Goede, R.G.M. NINJA: An automated calculation system for nematode-based biological monitoring. Eur. J. Soil Biol. 2014, 61, 90–93. [Google Scholar] [CrossRef]
  50. Caporaso, J.G.; Lauber, C.L.; Walters, W.A.; Berg-Lyons, D.; Huntley, J.; Fierer, N.; Owens, S.M.; Betley, J.; Fraser, L.; Bauer, M.; et al. Ultra-high-throughput microbial community analysis on the Illumina HiSeq and MiSeq platforms. ISME J. 2012, 6, 1621–1624. [Google Scholar] [CrossRef] [PubMed] [Green Version]
  51. Parsons, L.S.; Sayre, J.; Ender, C.; Rodrigues, J.L.M.; Barberán, A. Soil microbial communities in restored and unrestored coastal dune ecosystems in California. Restor. Ecol. 2020, 28, S311–S321. [Google Scholar] [CrossRef] [Green Version]
  52. Callahan, B.J.; McMurdie, P.J.; Holmes, S.P. Exact sequence variants should replace operational taxonomic units in marker-gene data analysis. ISME J. 2017, 11, 2639–2643. [Google Scholar] [CrossRef] [PubMed] [Green Version]
  53. Magurran, A.E. Measuring Biological Diversity; Blackwell Science: Malden, MA, USA, 2004. [Google Scholar]
  54. Louca, S.; Wegener Parfrey, L.; Doebeli, M. Decoupling function and taxonomy in the global ocean microbiome. Science 2016, 353, 1272–1277. [Google Scholar] [CrossRef]
  55. Bates, D.; Mächler, M.; Bolker, B.M.; Walker, S.C. Fitting linear mixed-effects models using lme4. arXiv 2015, arXiv:1406.5823v1. [Google Scholar] [CrossRef]
  56. Oksanen, A.J.; Blanchet, F.G.; Friendly, M.; Kindt, R.; Legendre, P.; Mcglinn, D.; Minchin, P.R.; Hara, R.B.O.; Simpson, G.L.; Solymos, P.; et al. Vegan: Community Ecology Package. 2019. R Package Version 2.2-0. Available online: http://CRAN.Rproject.org/package=vegan (accessed on 21 August 2019).
  57. Wickham, H. Ggplot2. Wiley Interdiscip. Rev. Comput. Stat. 2011, 3, 180–185. [Google Scholar] [CrossRef]
  58. Mathews, C.R.; Bottrell, D.G.; Brown, M.W. A comparison of conventional and alternative understory management practices for apple production: Multi-trophic effects. Appl. Soil Ecol. 2002, 21, 221–231. [Google Scholar] [CrossRef]
  59. Forge, T.; Neilsen, G.; Neilsen, D.; Hogue, E.; Faubion, D. Composted dairy manure and alfalfa hay mulch affect soil ecology and early production of “Braeburn” apple on M.9 Rootstock. HortScience 2013, 48, 645–651. [Google Scholar] [CrossRef] [Green Version]
  60. Sharaf, H.; Thompson, A.A.; Williams, M.A.; Peck, G.M. Compost applications increase bacterial community diversity in the apple rhizosphere. Soil Sci. Soc. Am. J. 2021, 85, 1–17. [Google Scholar] [CrossRef]
  61. Lazcano, C.; Gómez-Brandón, M.; Revilla, P.; Domínguez, J. Short-term effects of organic and inorganic fertilizers on soil microbial community structure and function: A field study with sweet corn. Biol. Fertil. Soils 2013, 49, 723–733. [Google Scholar] [CrossRef]
  62. Wittebolle, L.; Marzorati, M.; Clement, L.; Balloi, A.; Daffonchio, D.; Heylen, K.; De Vos, P.; Verstraete, W.; Boon, N. Initial community evenness favours functionality under selective stress. Nature 2009, 458, 623–626. [Google Scholar] [CrossRef]
  63. Lian, T.; Jin, J.; Wang, G.; Tang, C.; Yu, Z.; Li, Y.; Liu, J.; Zhang, S.; Liu, X. The fate of soybean residue-carbon links to changes of bacterial community composition in Mollisols differing in soil organic carbon. Soil Biol. Biochem. 2017, 109, 50–58. [Google Scholar] [CrossRef]
  64. Fahrbach, M.; Kuever, J.; Remesch, M.; Huber, B.E.; Kämpfer, P.; Dott, W.; Hollender, J. Steroidobacter denitrificans gen. nov., sp. nov., a steroidal hormone-degrading gammaproteobacterium. Int. J. Syst. Evol. Microbiol. 2008, 58, 2215–2223. [Google Scholar] [CrossRef] [Green Version]
  65. Martínez, S.A.; Dussán, J. Lysinibacillus sphaericus plant growth promoter bacteria and lead phytoremediation enhancer with Canavalia ensiformis. Environ. Prog. Sustain. Energy 2018, 37, 276–282. [Google Scholar] [CrossRef]
  66. Aguirre-Monroy, A.M.; Santana-Martínez, J.C.; Dussán, J. Lysinibacillus sphaericus as a nutrient enhancer during fire-impacted soil replantation. Appl. Environ. Soil Sci. 2019, 2019, 3075153. [Google Scholar] [CrossRef] [Green Version]
  67. Naureen, Z.; Ur Rehman, N.; Hussain, H.; Hussain, J.; Gilani, S.A.; Al Housni, S.K.; Mabood, F.; Khan, A.L.; Farooq, S.; Abbas, G.; et al. Exploring the potentials of Lysinibacillus sphaericus ZA9 for plant growth promotion and biocontrol activities against phytopathogenic fungi. Front. Microbiol. 2017, 8, 1477. [Google Scholar] [CrossRef]
  68. Lazicki, P.; Geisseler, D.; Lloyd, M. Nitrogen mineralization from organic amendments is variable but predictable. J. Environ. Qual. 2020, 49, 483–495. [Google Scholar] [CrossRef]
  69. Horrocks, A.; Curtin, D.; Tregurtha, C.; Meenken, E. Municipal compost as a nutrient source for organic crop production in New Zealand. Agronomy 2016, 6, 35. [Google Scholar] [CrossRef] [Green Version]
  70. Milkereit, J.; Geisseler, D.; Lazicki, P.; Settles, M.L.; Durbin-Johnson, B.P.; Hodson, A. Interactions between nitrogen availability, bacterial communities, and nematode indicators of soil food web function in response to organic amendments. Appl. Soil Ecol. 2021, 157, 103767. [Google Scholar] [CrossRef]
  71. Ito, T.; Araki, M.; Komatsuzaki, M.; Kaneko, N.; Ohta, H. Soil nematode community structure affected by tillage systems and cover crop managements in organic soybean production. Appl. Soil Ecol. 2015, 86, 137–147. [Google Scholar] [CrossRef] [Green Version]
  72. Treonis, A.M.; Austin, E.E.; Buyer, J.S.; Maul, J.E.; Spicer, L.; Zasada, I.A. Effects of organic amendment and tillage on soil microorganisms and microfauna. Appl. Soil Ecol. 2010, 46, 103–110. [Google Scholar] [CrossRef]
  73. Liu, T.; Yu, L.; Xu, J.; Yan, X.; Li, H.; Whalen, J.K.; Hu, F. Bacterial traits and quality contribute to the diet choice and survival of bacterial-feeding nematodes. Soil Biol. Biochem. 2017, 115, 467–474. [Google Scholar] [CrossRef]
  74. Venette, R.C.; Ferris, H. Influence of bacterial type and density on population growth of bacterial-feeding nematodes. Soil Biol. Biochem. 1998, 30, 949–960. [Google Scholar] [CrossRef]
  75. Djigal, D.; Brauman, A.; Diop, T.A.; Chotte, J.L.; Villenave, C. Influence of bacterial-feeding nematodes (Cephalobidae) on soil microbial communities during maize growth. Soil Biol. Biochem. 2004, 36, 323–331. [Google Scholar] [CrossRef]
  76. Xiao, H.F.; Li, G.; Li, D.M.; Hu, F.; Li, H.X. Effect of different bacterial-feeding nematode species on soil bacterial numbers, activity, and community composition. Pedosphere 2014, 24, 116–124. [Google Scholar] [CrossRef]
  77. Gebremikael, M.T.; Steel, H.; Buchan, D.; Bert, W.; De Neve, S. Nematodes enhance plant growth and nutrient uptake under C and N-rich conditions. Sci. Rep. 2016, 6, 32862. [Google Scholar] [CrossRef] [PubMed]
  78. Griffiths, B.S. Microbial-feeding nematodes and protozoa in soil: Their effectson microbial activity and nitrogen mineralization in decomposition hotspots and the rhizosphere. Plant Soil 1994, 164, 25–33. [Google Scholar] [CrossRef]
  79. Wang, S.; Li, T.; Zheng, Z. Response of soil aggregate-associated microbial and nematode communities to tea plantation age. Catena 2018, 171, 475–484. [Google Scholar] [CrossRef]
  80. Blanc, C.; Sy, M.; Djigal, D.; Brauman, A.; Normand, P.; Villenave, C. Nutrition on bacteria by bacterial-feeding nematodes and consequences on the structure of soil bacterial community. Eur. J. Soil Biol. 2006, 42, 70–78. [Google Scholar] [CrossRef]
Figure 1. Non-metric multidimensional scaling analysis (NMDS) of 797 bacterial and archaeal genera isolated from almond orchard soil in two years following compost amendment application. DMC = Dairy manure compost, FWC= Food waste compost, N+ = nitrogen fertilizer, N− unamended control.
Agronomy 11 01745 g001
Figure 2. The relative abundance of bacteria with presumptive cellulolytic and xylanolytic potential from almond orchard soil in two years following compost amendment application. N = nitrogen fertilizer, C = control, DMC = Dairy manure compost, FWC = food waste compost. Letters denote statistical differences of p < 0.05 determined by either post hoc Tukey’s honestly significant difference (HSD) test.
Agronomy 11 01745 g002
Figure 3. Heat map of Spearman rank correlation coefficients between nematode and bacterial and archaeal genera collected from almond orchard soil in 2016 and 2017 where treatments applied were either DMC = Dairy manure compost, FWC = Food waste compost, N+ = nitrogen fertilizer, or N− = unamended control. Only those relationships statistically significant at the p < 0.05 level are shown. Darker colors indicated stronger correlations, with blue indicating positive correlations and red negative.
Agronomy 11 01745 g003
Table 1. Average soil properties ± standard error of measurement (SEM) from an almond orchard receiving different organic amendments. Letters denote statistical differences of p < 0.05 determined by either post hoc Tukey’s honestly significant difference (HSD) test or Dunn’s test, for non-normally distributed data. DMC = Dairy manure compost, FWC = Food waste compost, N+ = nitrogen fertilizer, N− = unamended control. POXC = permanganate oxidizable carbon.
NH4+ N (µg/g) NO3 N (µg/g) %N %C POXC (mg/kg)
May 2016
DMC6.49±1.93abd40.52±3.85 0.12±0.01 1.25±0.2
FWC10.45±1.51d39±4.41 0.14±0.03 1.57±0.4
N+1.31±0.36ac37.19±6.07 0.16±0.02 1.69±0.27
N−1.79±0.63a37.22±10.5 0.11±0.01 1.1±0.12
July 2016
DMC2.86±0.39ab15.28±3.15ab0.17±0.02a1.64±0.17a
FWC2.97±0.53ab4.87±2.38a0.18±0.03a2.08±0.45a
N+8.04±2.5b22.19±1.34b0.1±0b0.94±0.02b
N−2.09±0.25a6.45±2.45a0.1±0.01b0.99±0.05b
October 2016
DMC2.69±0.39b39.38±11.87a0.19±0.02a1.7±0.17a700.63±43.96b
FWC1.52±0.64ac24.93±6.34ac0.21±0.03a2.17±0.33a855.34±104.51b
N+0.58±0.06a5.28±0.73b0.11±0.01b1.05±0.1b263.45±33.42a
N−0.73±0.23a12.55±5.59bc0.1±0b0.97±0.03b291.77±33.15a
May 2017
DMC0.48±0.23 3.98±1.06 0.17±0.03a1.56±0.25ac
FWC0.75±0.26 3.55±1.48 0.35±0.07a3.9±0.8a
N+0.26±0.12 1.88±0.54 0.1±0b0.96±0.03bc
N−0.2±0.1 2.68±0.41 0.1±0b0.9±0.02bc
July 2017
DMC1.18±0.54 3.38±1.78a0.18±0.02a1.72±0.22a
FWC0.46±0.4 4.71±2.76a0.17±0.03a1.82±0.33a
N+12.23±7.94 43.4±12.77b0.11±0b0.96±0.04b
N−0.26±0.17 3±3.44a0.1±0b0.93±0.03b
October 2017
DMC0.76±0.32 4.74±2.35 0.15±0a1.32±0.05a551.01±43.71b
FWC0.49±0.14 3±1.25 0.14±0.01a1.35±0.11a600.92±61.12b
N+1.03±0.7 2.92±0.97 0.11±0.01b0.99±0.08b377.45±17.88a
N−0.27±0.24 2.81±0.64 0.1±0b0.9±0.02b281.56±45.21a
Table 2. Average bacterial and archaeal species richness, evenness and Shannon Diversity indices ± standard error of measurement (SEM) from an almond orchard receiving different organic amendments. Letters denote statistical differences of p < 0.05 determined by either post hoc Tukey’s honestly significant difference (HSD) test or Dunn’s test, for non-normally distributed data. DMC = Dairy manure compost, FWC = Food waste compost, N+ = nitrogen fertilizer, N− = unamended control. Categories with 0 values indicate SEM under 0.01.
RichnessEvennessShannon Diversity
July 2016
DMC1071.00±64.640.87±0.016.07±0.08
FWC1067.33±25.810.88±0.006.14±0.03
N+998.00±82.250.87±0.015.96±0.11
N−1011.00±68.660.87±0.005.99±0.05
October 2016
DMC944.67±38.310.88±0.00 a6.06±0.05
FWC881.33±61.410.89±0.00 a5.99±0.07
N+1009.33±25.920.87±0.00 b6.01±0.03
N−1044.00±52.560.87±0.00 b6.02±0.06
July 2017
DMC781.33±65.280.89±0.01 a5.94±0.08 a
FWC789.67±55.180.90±0.00 a5.97±0.05 a
N+659.67±55.710.87±0.00 b5.65±0.08 b
N−779.00±45.290.87±0.00 b5.79± 0.05 ab
October 2017
DMC798.17±38.120.89±0.00 a5.94±0.04
FWC716.00±68.840.88±0.00 ab5.77±0.10
N+739.00±66.230.87±0.00 b5.71±0.09
N−772.50±53.370.86±0.01 b5.72±0.08
Table 3. The average relative abundance of individual nematode groups in year one from an almond orchard receiving different organic amendments. Letters denote statistical differences of p < 0.05 determined by Tukey’s honestly significant difference (HSD) test. DMC = Dairy manure compost, FWC = Food waste compost, N+ = nitrogen fertilizer, and N− = unamended control. For trophic groupings of nematodes bact. = bacterial feeders, fung. = fungal feeders, omn. = omnivores, pred. = predators, and herb. = root herbivores. Categories with 0 values indicate relative abundances under 0.01 (1%).
May 2016
Nematode taxaDMCFWCN+N−
Panagrolaimusbact.0.400.480.360.39
Mesorhabditisbact.0.120.090.050.08
Cephalobusbact. 0.06 ab 0.10 b 0.01 c 0.02 a
Acrobeloidesbact.0.070.000.080.07
Acrobelesbact.0.000.000.000.00
Prismatolaimusbact.0.010.000.020.00
Aphelenchoidesfung.0.120.150.160.17
Aphelenchusfung.0.090.060.120.09
Discolaimuspred.0.000.000.000.00
Qudsianematidaeomn.0.010.000.040.02
Mesodorylaimusomn.0.000.000.000.00
Tylenchidaeherb.0.110.090.140.15
Pratylenchusherb.0.020.010.020.00
Total bacterial feeders0.650.680.520.57
Total fungal feeders0.210.220.280.26
Total herbivores0.130.100.160.15
Total omnivores0.010.000.040.02
July 2016
Nematode taxaDMCFWCN+N−
Panagrolaimusbact. 0.090.140.120.15
Mesorhabditisbact.0.220.190.180.23
Acrobeloidesbact. 0.100.100.110.10
Acrobelesbact.0.010.010.000.00
Prismatolaimusbact. 0.000.000.000.00
Aphelenchoidesfung. 0.220.190.180.18
Aphelenchusfung. 0.120.110.100.14
Discolaimuspred. 0.000.000.000.00
Qudsianematidaeomn. 0.010.010.020.02
Mesodorylaimusomn. 0.010.000.000.00
Tylenchidaeherb. 0.190.220.220.17
Pratylenchusherb. 0.03 ab 0.03 ab 0.07 b 0.00 a
Total bacterial feeders0.480.430.400.43
Total fungal feeders0.280.300.290.37
Total herbivores0.220.250.290.17
Total omnivores0.020.010.020.02
October 2016
Nematode taxDMCFWCN+N−
Panagrolaimusbact. 0.100.110.140.11
Mesorhabditisbact.0.110.090.110.09
Acrobeloidesbact. 0.070.090.080.08
Acrobelesbact.0.090.020.000.00
Prismatolaimusbact. 0.05 a 0.04 ab 0.01 b 0.04 ab
Aphelenchoidesfung. 0.100.120.100.13
Aphelenchusfung. 0.070.070.100.07
Discolaimuspred. 0.000.000.010.00
Qudsianematidaeomn. 0.000.000.000.00
Mesodorylaimusomn.0.030.020.030.04
Tylenchidaeherb. 0.370.440.400.42
Pratylenchusherb. 0.010.010.030.02
Total bacterial feeders0.410.340.340.32
Total fungal feeders0.170.190.200.19
Total herbivores0.380.450.430.44
Total omnivores0.030.020.030.04
Table 4. The average relative abundance of individual nematode groups in year two from an almond orchard receiving different organic amendments. Letters denote statistical differences of p < 0.05 determined by post hoc Tukey’s honestly significant difference (HSD) test. DMC = Dairy manure compost, FWC = Food waste compost, N+ = nitrogen fertilizer, and N− = unamended control. For trophic groupings of nematodes bact. = bacterial feeders, fung. = fungal feeders, pred. = predators, omn. = omnivores, and herb. = root herbivores. Categories with 0 values indicate relative abundances under 0.01 (1%).
May 2017
Nematode taxaDMCFWCN+N−
Panagrolaimusbact.0.010.000.010.01
Mesorhabditisbact.0.010.020.020.01
Cephalobusbact.0.000.000.000.01
Eucephalobusbact.0.000.000.000
Acrobeloidesbact.0.220.160.110.2
Acrobelesbact.0.000.030.000
Prismatolaimusbact.0.230.180.140.16
Aphelenchoidesfung.0.120.120.090.11
Aphelenchusfung. 0.07 b 0.07 b 0.20 a 0.2 a
Discolaimuspred.0.000.000.010.00
Qudsianematidaeomn.0.030.050.110.08
Dorylaimusomn.0.000.010.010.01
Tylenchidaeherb.0.290.330.280.2
Meloidogyneherb.0.010.030.010.00
Total bacterial feeders 0.48 a 0.38 ab 0.28 b 0.39 ab
Total fungal feeders 0.19 b 0.19 b 0.30 a 0.31 a
Total herbivores 0.16 ab 0.19 b 0.15 ab0.1 a
Total omnivores 0.030.060.120.09
July 2017
Nematode taxaDMCFWCN+N−
Panagrolaimusbact.0.020.010.060.06
Mesorhabditisbact.0.010.010.010.01
Eucephalobusbact.0.010.000.020.01
Acrobeloidesbact.0.250.130.190.17
Prismatolaimusbact.0.090.130.030.10
Aphelenchoidesbact.0.010.010.030.03
Aphelenchusfung. 0.13 a 0.16 ab 0.30 b 0.29 ab
Qudsianematidaeomn.0.010.020.010.02
Dorylaimusomn.0.010.020.010.03
Tylenchidaeherb. 0.46 ab 0.49 b 0.33 ab 0.27 a
Total bacterial feeders 0.380.290.310.34
Total fungal feeders 0.13 b 0.18 ab 0.33 c 0.32 a
Total herbivores 0.23 ab 0.25 b 0.17 ab 0.14 a
Total omnivores 0.020.040.030.05
October 2017
Nematode taxaDMCFWCN+N−
Panagrolaimusbact.0.140.150.090.13
Mesorhabditisbact.0.090.100.110.06
Cephalobusbact.0.170.140.180.15
Prismatolaimusbact.0.080.110.060.15
Aphelenchoidesfung.0.160.150.150.22
Aphelenchusfung.0.000.010.010.01
Microdorylaimusomn.0.010.010.020.00
Tylenchidaeherb.0.340.330.310.25
Paratylenchusherb.0.000.000.000.01
Tylenchorhynchusherb.0.000.000.010.01
Pratylenchusherb.0.000.010.050.01
Total bacterial feeders 0.480.490.440.49
Total fungal feeders 0.160.160.160.23
Total herbivores 0.170.180.220.15
Total omnivores 0.010.010.020.00
Table 5. Average leaf nutrients, trunk diameter and growth ± standard error of measurement (SEM) from an almond orchard receiving different organic amendments. Letters denote statistical differences of p < 0.05 determined by either post hoc Tukey’s honestly significant difference (HSD) test or Dunn’s test, for non-normally distributed data. DMC = Dairy manure compost, FWC = Food waste compost, N+ = nitrogen fertilizer, N− = unamended control.
% N% CTrunk Diameter (mm)Diameter Increase (mm)
May 2016
DMC3.14±0.0944.16±0.209.40±0.46
FWC3.11±0.1543.85±0.619.70±0.22
N+2.97±0.1744.29±0.1310.22±0.23
N−3.09±0.0344.02±0.1410.16±0.26
July 2016
DMC2.92±0.1543.85±0.23
FWC3.08±0.2143.80±0.17
N+3.07±0.1343.97±0.18
N−2.82±0.1343.62±0.17
October 2016
DMC3.22± 0.06 ab45.22±0.4723.69±0.4114.30± 0.57 ab
FWC3.24± 0.14 ab44.98±0.3825.34±1.1915.64±1.15 a
N+3.46±0.19 a45.11±0.2122.61±0.6812.39± 0.70 ab
N−2.86±0.10 b44.14±0.1621.48±1.0511.32±0.88 b
May 2017
DMC2.66±0.0946.07±0.17
FWC2.51±0.0845.54±0.27
N+2.47±0.0545.23±0.48
N−2.58±0.0846.00±0.36
July 2017
DMC2.33±0.07 b45.96±0.26
FWC2.19±0.05 b45.76±0.42
N+2.84±0.06 a45.41±0.27
N−2.11±0.08 b45.28±0.27
October 2017
DMC 47.05±2.1037.65±1.98
FWC 48.56±2.2238.86±2.29
N+ 48.27±3.4838.05±3.53
N− 42.68±2.0132.52±2.02
Publisher’s Note: MDPI stays neutral with regard to jurisdictional claims in published maps and institutional affiliations.

