Abstract
The use of slow-growing Seashore paspalum dwarf varieties is an effective way to reduce mowing frequency. Here, the differences in metabolism and hormone levels between Seashore paspalum dwarf mutant T51 and WT were investigated. Finally, the genes associated with the dwarf phenotype were screened in combination with our previous studies. At the metabolic level, 236 differential metabolites were identified. Further screening of hormone-related differential metabolites found that ABA and SA of T51 were increased significantly, while IAA and its intermediate metabolite indolepyruvate of T51 were decreased significantly. Endogenous hormone content assay showed that there was no difference in GA and BR content between T51 and WT; However, the IAA content of T51 was significantly reduced compared with WT. The results of exogenous hormone treatment showed that the sensitivity of T51 to exogenous hormones was IAA > GA > BR. TAA1, YUCCA, and NIT were down-regulated at both the transcriptional and protein levels; CYP79B2 and CYP79B3 were down-regulated at the protein level but had no difference at the transcriptional level. In conclusion, we propose that the down-regulated expression of TAA1, YUCCA, NIT, CYP79B2, and CYP79B3 leads to the decrease of IAA content, which is one of the important reasons for the dwarf phenotype of T51; TAA1, YUCCA, and NIT are important candidate genes related to T51 dwarf.
1. Introduction
Seashore paspalum (Paspalum vaginatum Swartz) is one of the most widely used warm-season turfgrasses in tropical and subtropical climates [1,2]. Because of its fast growth rate [3], Seashore paspalum requires frequent fertilization and mowing, resulting in high establishment and maintenance costs [4]. One strategy to reduce upkeep costs would be to use a dwarf variety of Seashore paspalum. Dwarf mutants can have lower upkeep costs due to their reduced vegetative growth, which necessitates less frequent mowing and fewer nutrients [5]. Therefore, the cultivation of Seashore paspalum dwarf varieties can not only bring a lot of convenience to production but also reduce the pollution of fertilizer to the environment.
Plant hormones play an important role in regulating plant morphogenesis, growth, development, and differentiation [6]. There are many reasons for plant dwarfing, and one of the important mechanisms of plant dwarfing is the obstruction of plant hormone metabolism and signal transduction pathway [7]. Plant hormone-related dwarfing is usually related to gibberellin (GAs), auxin (IAA), and brassinosteroid (BR) [8]. In rice and wheat, GA is one of the key factors affecting plant height [9,10,11]. Multiple studies have identified a number of dwarf mutants associated with BR biosynthesis and signaling pathways [12,13,14]. In addition, IAA is also a major determinant of plant growth, regulating plant growth by activating cell elongation [15].
The biosynthesis of IAA is mainly divided into two pathways: the Trp-dependent pathway and the Trp-independent pathway [16]. At present, the research on the tryptophan-independent pathway is not in-depth, but the tryptophan-dependent pathway is fully understood. The tryptophan-dependent pathway can be further divided into four branches due to the difference in intermediate products: tryptamine (TAM) pathway, indole-3-acetoaldoxime (IAOx) pathway, indole-3-acetamide (IAM) pathway and indole-3-pyruvic acid (IPyA). CYP79B2 and CYP79B3 proteins are important catalytic enzymes of the IAOx pathway, so the IAOx pathway is also known as the CYP79B pathway [17]. In the IAM pathway, the synthetic precursor of IAA, tryptophan, is finally converted into IAA through the continuous catalysis of tryptophan monooxygenase (IAA M) and amidohydrolase (AMI1) [18]. In the IPyA pathway, tryptophan is finally converted to IAA through the sequential catalysis of tryptophan aminotransferase (TAA1) and flavin monooxygenase (YUC) [19]. In the TAM pathway, tryptophan is converted into hydroxytryptamine (HTAM) catalyzed by tryptophan decarboxylase (TDC) and flavin monooxygenase (YUC), and HTAM is finally converted into IAA after a series of changes [20].
The research on the mechanism of plant dwarfing mainly focuses on crops such as rice [21,22], wheat [23,24], maize [25,26], soybean [27,28] and cotton [29,30]. At present, the dwarfing mechanism of lawn grass, such as Zoysia matrella [31] and Kentucky Bluegrass [32], has been studied. However, there is no relevant report on the dwarfing mechanism of seashore paspalum. In previous studies, we have sequenced the transcriptome and proteome of T51 and WT and proved that the dwarf phenotype of T51 is closely related to the phenylpropane pathway, especially the lignin synthesis pathway [33]. However, the changes in metabolic level and hormone level of mutant T51 are still unknown, and they also play an important role in plant dwarf phenotype. In this study, we performed non-targeted metabolomic studies and hormone level studies on T51 and WT and further analyzed the dwarfing mechanism of T51 based on the previous transcriptome and proteome data, which laid a foundation for further research on the dwarfing mechanism of T51.
2. Materials and Methods
2.1. Plant Material
The test materials were seashore paspalum dwarf mutant T51 and its wild-type (Sea Spray), both of which were self-bred in our laboratory. T51 was obtained by chemical mutagenesis using Sea Spray [33]. After several years of field experiments, it was found that the dwarfing characteristics of T51 remained stable, so T51 was used as a test material for this study.
This study was conducted in June 2020 in the Nanjing Agricultural University turf grass germplasm resource garden located in Nanjing, Jiangsu Province, China. Each experimental material was set up with 6 replicates. The stolons of T51 and WT were planted in 11 cm diameter and 21 cm deep containers. The soil mixture was a 1:1:1 ratio of sand, soil, and perlite. Seashore paspalum plants were watered and fertilized as needed [33]. After stable growth of plant material (50 days), fresh leaves were collected for metabolomic analysis and endogenous hormone determination. Six replicates were set for each sample in the metabolome analysis, and three replicates were set for each sample in the endogenous hormone assay.
2.2. Metabolome Analysis
2.2.1. Metabolites Extraction
The metabolite extraction of WT and T51 refers to the method of Vasilev, N. [34] and has been improved as follows: Accurately weigh 200 mg (±1%) of T51 and WT fresh leaves in 2 mL Eppendorf tube, and add 0.6 mL 2-chlorophenylalanine (4 ppm) methanol (−20 °C), vortex for 30 s. Add 100 mg glass beads, put them into the tissue grinder, and grind for 60 s at 55 Hz. Ultrasonic for 15 min at room temperature with a BQS-30D ultrasonic cleaner (BAOBO, Hangzhou, Zhejiang, China). M1324R refrigerated centrifuge (RWD, Shenzhen, Guangzhou, China) was centrifuged at 12,000× g rpm at 4 °C for 10 min, took 300 μL supernatant and filter through 0.22 μm membrane, and added the filtrate into the detection bottle. Take 20 µL from each T51 and WT sample to the quality control (QC) samples. Use the rest of the T51 and WT samples for LC-MS detection.
2.2.2. Chromatographic Conditions
Experiments were performed using a Vanquish liquid chromatograph (Thermo Scientific, Waltham, MA, USA). Chromatographic separation was used with an ACQUITY UPLC® HSS T3 (150 × 2.1 mm, 1.8 µm, Waters, Milford, MA, USA) column maintained at 40 ℃. The temperature of the autosampler was 8 °C. Gradient elution of analytes was carried out with 0.1% formic acid in water (C) and 0.1% formic acid in acetonitrile (D) or 5 mM ammonium formate in water (A) and acetonitrile (B) at a flow rate of 0.25 mL/min. Injection of 2 μL of each sample was done after equilibration. An increasing linear gradient of solvent B (v/v) was used as follows: 0~1 min, 2% B/D; 1~9 min, 2~50% B/D; 9~12 min, 50~98% B/D; 12~13.5 min, 98% B/D; 13.5~14 min, 98~2% B/D; 14~20 min, 2% Dpositive model (14~17 min, 2% B-negative model).
2.2.3. Mass Spectrum Conditions
Experiments were performed using a QE-HF-X mass spectrometer (Thermo Scientific, Waltham, MA, USA). The ESI-MSn experiments were used with the spray voltage of 3.5 kV and −2.5 kV in positive and negative modes, respectively. Sheath gas and auxiliary gas were set at 30 and 10 arbitrary units, respectively. The capillary temperature was 325 ℃. The analyzer scanned over a mass range of m/z 81-1000 for a full scan at a mass resolution of 60,000. Data-dependent acquisition (DDA) MS/MS experiments were performed with an HCD scan. The normalized collision energy was 30 eV. Dynamic exclusion was implemented to remove some unnecessary information in MS/MS spectra.
2.2.4. Pretreatment of Metabolome Data
The obtained raw data were converted to mzXML format by proteowizard [35] (v3.0.8789). The XML Cryptographic Message Syntax (XCMS) [36] was used for peak identification, peak filtration, and peak alignment, with the following main parameters: bw = 2, PPM = 15, peakwidth = C (5,30), mzwid = 0.015, mzdiff = 0.01, and method = centrwave. Normalizemets was used to standardize the data to obtain more reliable and intuitive results. In total, 30,149 precursor molecules were acquired in the positive ion mode, and 20,012 in the negative ion mode and the data were exported to excel for subsequent analysis.
2.2.5. Data Analysis
Simca-p + was used for multivariate statistical analysis of standardized data [37], including principal component analysis (PCA), partial least squares discriminant analysis (PLS-DA), and orthogonal partial least squares discriminant analysis (OPLS-DA). The p-value of Student’s t-test and the value of variable importance in the projection (VIP) of the first principal component of the OPLS-DA model was used to screen differential metabolites. The screening criteria of relevant differential metabolites were p-value ≤ 0.05 and VIP ≥ 1. Pathway enrichment analysis was performed using KEGG (Kyoto encyclopedia of genes and genomes) of the differential metabolites to obtain the metabolic pathway enrichment results.
2.3. Determination of Endogenous Hormone content
2.3.1. Extraction of Plant Hormones
Accurately weigh about 0.2 g of fresh leaves at the top of mutant T51 and WT plants, add 10 times the volume of acetonitrile solution; After the samples were extracted overnight at 4 °C, centrifuge at 12,000× g for 5 min with an M1324R refrigerated centrifuge (RWD, Shenzhen, Guangzhou, China), and take the supernatant; adding 5 times the volume of acetonitrile solution to the precipitation, then extracting twice, and combining the obtained supernatant; The supernatant was passed through a C18 solid-phase extraction column (Thermo Scientific, Waltham, MA, USA), vigorously shaken for 30 s, and centrifuged at 10,000× g for 5 min with an M1324R refrigerated centrifuge (RWD, Shenzhen, Guangzhou, China), and the supernatant was taken; The supernatant was concentrated to dryness by vacuum centrifugation with a CV600 refrigerated vacuum concentrator (jiaimu, Beijing, China), reconstituted with 200 μL of methanol, passed through a 0.22 μm filter membrane, and placed in a −20 °C refrigerator for testing.
2.3.2. Liquid Phase Condition
Experiments were performed using a Vanquish liquid chromatograph (Thermo Scientific, Waltham, MA, USA). The liquid phase conditions for this experiment are as follows: Chromatographic column, Poroshell 120 SB-C18 reversed-phase column (2.1 × 150, 2.7 um, Agilent, Santa Clara, CA, USA); column temperature: 30 °C; mobile phase: A (organic phase): B (inorganic phase) = (methanol: formic acid = 999:1): (water: formic acid = 999:1); Injection volume: 2 µL; Elution gradient (Table 1):

Table 1.
Gradient Parameters of HPLC.
2.3.3. Mass Spectrometry Parameters
Experiments were performed using a Triple TOF 5600 mass spectrometer (AB Sciex, Concord, ON, Canada). The mass spectrometry parameters of this experiment are as follows: Ionization mode, ESI positive and negative ion modes are monitored separately; Scan type, MRM; Gas curtain gas, 15 psi; Spray voltage, +4500 v, −4000 v; Atomizing gas pressure, 65 psi; Auxiliary gas pressure, 70 psi; Atomization temperature, 400 °C.
The calculation method of hormone content in the sample is as follows: hormone content (ng/g) = detection concentration (ng/mL) × dilution volume (mL)/weighing mass (g).
2.4. Sensitivity Study of Exogenous Hormones
Exogenous hormones were sprayed on May 20th, 2022. Before the experiment, the height of mutant T51 and WT plants was trimmed to 3.0 cm, and then the mutant T51 plants were sprayed with GA3, BR, and IAA, respectively. Plants were treated once every 5 days (i.e., May 25, May 30, June 4, and June 9) for a total of 5 treatments. According to the previous preliminary test results, the concentration of GA3 was 100 mg/L, the concentration of BR was 0.5 mg/L, and the concentration of IAA was 30 mg/L, and distilled water was sprayed as a control, which was represented by T51 (CK0). WT plants were sprayed with distilled water as a control, denoted by WT (CK). The exogenous hormone solution was fully and uniformly sprayed on the entire surface of T51 and WT plants. Three replicates were set up for each treatment, and all potted plants were randomly placed. Plant heights of mutant T51 and WT were determined on June 15.
2.5. Screening of Differential Genes of the Hormone Biosynthetic Pathway
The differentially expressed genes between T51 and WT were obtained by RNA-seq transcriptome, and then these differentially expressed genes were annotated into the KEGG database [33]. On the KEGG pathway map, the up-regulated differential genes and down-regulated differential genes were marked with red and blue, respectively. Finally, the differentially expressed genes involved in the hormone biosynthesis pathway were screened.
2.6. Screening of Differential Proteins of the Hormone Biosynthetic Pathway
The differentially expressed proteins between T51 and WT were obtained by iTRAQ proteomics, and then these differentially expressed proteins were annotated into the KEGG database [33]. On the KEGG pathway map, the up-regulated differential proteins and down-regulated differential proteins were marked with red and blue, respectively. Finally, the differentially expressed proteins involved in the hormone biosynthesis pathway were screened.
3. Results
3.1. Examination of Metabolomics Data
3.1.1. Results of LC-MS/MS
The base peak chromatograms of T51 and WT under positive and negative ion modes are shown in Figure S1a,b. There are some differences in the overall profile of the two varieties, indicating that there are differences in metabolic components between the two varieties.
3.1.2. Quality Control (QC) and Quality Assurance (QA)
In order to obtain reliable and high-quality metabolomics data, QC is usually required. In positive ion mode and negative ion mode, the two samples are densely distributed, indicating that the data are reproducible and reliable (Figure S2a,c). On the basis of QC, QA is usually carried out to delete characteristic peaks with poor repeatability in QC samples. The relative standard deviation (RSD) of the potential characteristic peak in the QC sample is not more than 30%. In positive ion mode, the proportion of the characteristic peaks with RSD < 30% can reach 82.3% (Figure S2b), and in negative ion mode, the proportion of the characteristic peaks with RSD < 30% can reach 84.4% (Figure S2d), which indicates that the obtained data are good.
3.2. Multivariate Data Analysis
3.2.1. Principal Component Analysis (PCA)
PCA was performed on T51 and WT samples. In positive ion mode (Figure 1a), among the three principal components, the contribution was 32.8% for principal component 1 (PC1), 15.3% for principal component 2 (PC2), and R2X = 0.582 for the model in the x-axis direction. In negative ion mode (Figure 1b), of the two principal components, the contribution was 46.1% for principal component 1 (PC1), 11.8% for principal component 2 (PC2), and R2X = 0.579 for the x-axis direction model. R2X is the interpretability of the model. R2X higher than 0.5 indicated that this PCA model had good fitting performance in positive mode and negative ion mode. In addition, it can be seen from the PCA score plot that WT and T51 are clearly differentiated into two groups, indicating a significant difference between mutant T51 and WT.
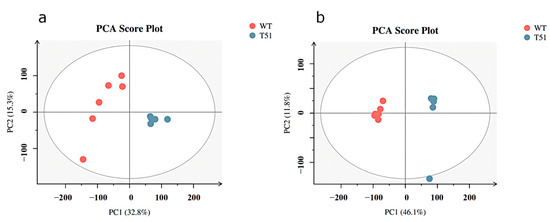
Figure 1.
PCA scores plot between WT and T51 in positive and negative ion modes. Note: (a) positive ion mode; (b) negative ion mode.
3.2.2. Partial Least Squares-Discriminant Analysis (PLS-DA)
The obtained mass spectrum data were analyzed by PLS-DA. In positive ion mode, the model quality parameters are two principal components, and the cumulative prediction rate of the model Q2 = 0.955, R2X = 0.47, R2Y = 0.994 (Figure 2a). In negative ion mode, the model quality parameters are two principal components, and the cumulative prediction rate of the model is Q2 = 0.987, R2X = 0.557, and R2Y = 1 (Figure 2c). The model validities were demonstrated by permutation tests on the corresponding PLS-DA models. All blue Q2 points from left to right in the figure are lower than the rightmost original blue Q2 point (Figure 2b,d), indicating that the evaluation model is reliable and effective.
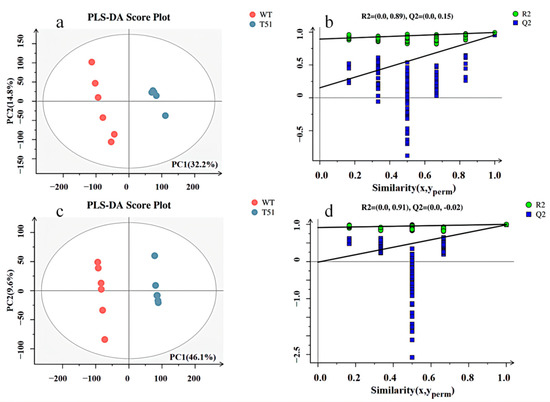
Figure 2.
PLS-DA scores and permutation test plots scores between T51 and WT in positive and negative ion modes. Note: (a) PLS-DA scores in positive ion mode; (c) PLS-DA scores of negative ion mode; (b) permutation test plots scores of positive ion mode; (d) permutation test plots scores of negative ion mode.
3.3. Screening and Identification of Differential Metabolites
Through the screening of metabolites, different metabolites were found. In positive ion mode, a total of 8031 metabolites were screened, of which 1061 were upregulated and 6970 were downregulated (Figure S3). In negative ion mode, a total of 8137 metabolites were screened, of which 3427 were upregulated and 4710 were downregulated (Figure S3). Finally, 236 significantly differential metabolites were identified (Table S1), of which 55 were up-regulated (22.88%), and 181 were down-regulated (77.12%).
3.4. Differential Metabolite Pathway Analysis
The pathway enrichment analysis of differential metabolites was further carried out through the KEGG database. The differential metabolites were distributed in 75 metabolic pathways, and there were three metabolic pathways with FDR < 0.05, namely: ABC transporters, 20 differential metabolites were enriched in this metabolic pathway; galactose metabolism, ten differential metabolites were enriched in this metabolic pathway; plant hormone signal transduction, three differential metabolites were enriched in this metabolic pathway (Table 2). In addition, purine metabolism, starch and sucrose metabolism, phenylalanine metabolism, and flavonoid biosynthesis are also enriched with more differential metabolites (Table 2).
Table 2.
KEGG enrichment pathway of differential metabolites.
3.5. Analysis of Key Metabolites Associated with Dwarfing
KEGG enrichment analysis of the ABC transporters pathway and galactose metabolism pathway showed that the relative contents of fructose, mannose, glucose, and sucrose in T51 were significantly down-regulated (Table 3). These results showed that the accumulation of photosynthetic products in the mutant T51 was significantly reduced from the metabolic level. Three differential metabolites were enriched in the plant hormone signal transduction pathway, namely 3-Indoleacetic acid (IAA), salicylic acid (SA), and abscisic acid (ABA). Compared with WT, the relative contents of ABA and SA were significantly increased in mutant T51, while the relative contents of IAA were significantly decreased (Table 3). This indicated that the decrease of IAA content might be one of the important reasons for the dwarfing of T51. The tryptophan metabolic pathway was annotated to 4 differential metabolites, among which indolepyruvate, a metabolic intermediate in the process of IAA biosynthesis, was down-regulated in mutant T51 (Table 3). This suggests that the IAA-dependent tryptophan biosynthesis pathway of T51 has changed, resulting in a decrease in the content of IAA in T51. In addition, the enrichment analysis of the phenylpropane biosynthesis pathway found that ferulic acid, sinapyl alcohol, and coniferyl alcohol were associated with lignin biosynthesis (Table 3). These results indicated from the metabolic level that the lignin-specific pathway of mutant T51 also changed at the metabolic level.
Table 3.
Differential metabolites related to dwarf phenotype.
3.6. Changes of Endogenous Hormone Content
Metabolome studies found that GA and BR were not detected in mutant T51. Therefore, in order to specifically understand the roles of GA, BR, and IAA in mutant T51, the contents of four major endogenous hormones GA3, BR, IAA, and ABA in the leaves of mutant T51 and WT were determined in this study. The results showed that the contents of GA3 and BR in T51 and WT were not significantly different, indicating that GA and BR may not play a major role in the formation of mutant T51. In contrast, the content of ABA in the mutant T51 was significantly increased; the content of IAA was significantly decreased, which was 60.3% of WT (Figure 3). Therefore, the reduced IAA content may be responsible for the dwarfing of the mutant T51.
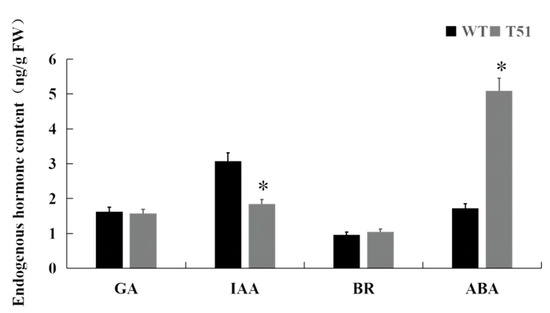
Figure 3.
Endogenous hormone content of T51 and WT. Note: ‘*’ indicates the significant difference in Duncan’s multiple comparisons when p < 0.05.
3.7. Response of Mutant T51 to Exogenous Hormones
In order to further determine whether the dwarf phenotype of mutant T51 is related to the decrease of IAA content and whether mutant T51 responds to GA and BR, exogenous GA, BR, and IAA were sprayed on mutant T51 (Figure 4). Compared with the mutant T51 plants sprayed with distilled water, the plant height of the mutant T51 sprayed with BR did not change significantly; the plant height of the mutant T51 sprayed with GA increased significantly but did not return to the phenotype of WT; The mutant T51 was most sensitive to exogenous IAA, but the plant height of T51 treated with exogenous IAA did not return to the WT phenotype (Table 4). These results indicated that exogenous IAA had the greatest effect on the plant height of mutant T51 plants.
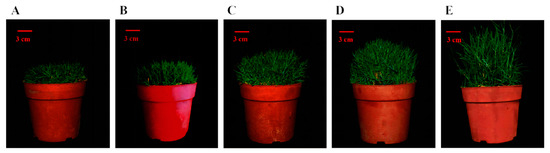
Figure 4.
Effect of exogenous hormones on T51 plant height. Note: (A). T51 plants sprayed with distilled water; (B). T51 plants sprayed with brassinosteroid; (C). T51 plants sprayed with Gibberellin; (D). T51 plants sprayed with indole-3-acetic acid; (E). WT plants sprayed with distilled water.
Table 4.
Effects of exogenous hormone application on mutant T51 plant height.
3.8. Key Genes of IAA Biosynthesis Pathway
The tryptophan metabolic pathway is the pathway of IAA biosynthesis. KEGG Pathway enrichment analysis showed that a total of 10 differentially expressed genes were involved in the IAA biosynthesis pathway (Figure S4, Table S2). The IAA biosynthesis pathway of mutant T51 was further studied at the protein level, and the results showed that there were five differentially expressed proteins in this pathway, namely YUCCA, TAA1, nitrilase, CYP79B2, and CYP79B3, all of which were down-regulated in mutant T51 (Figure S5, Table 5). TAA1, YUCCA, and nitrilase were down-regulated at both the transcriptional and protein levels, which may be candidate genes for dwarfing mutant T51 (Table 5).
Table 5.
Relationship between differentially expressed proteins of tryptophan metabolic pathway and their corresponding genes.
4. Discussion
According to the response of plant dwarf mutants to exogenous hormones, they can be divided into hormone-deficient and hormone-insensitive types [38]. The content of endogenous active hormones in the defective dwarf mutants was obviously reduced or existed in trace amounts, and the dwarfing traits of the mutants could be recovered after exogenous application of the corresponding hormones [39,40]. The endogenous active hormone content of hormone-insensitive dwarf mutants was not significantly different or significantly higher than that of wild type, and the plant height was not restored after exogenous application of the corresponding active hormone [41]. The metabolome results showed that the relative content of IAA in T51 was significantly decreased (Table 3). The measurement results of endogenous hormones also showed that there was no significant difference in the content of GA3 and BR between T51 and WT, while the content of IAA in T51 showed a significant decrease (Figure 3). These results suggest that the dwarfing of T51 has little to do with GA and BR but may be closely related to the reduction of IAA content. T51 was sprayed with exogenous IAA, GA, and BR, and the results showed that exogenous IAA had the greatest effect on the plant height of T51 plants, but the T51 plants did not fully recover to the growth state of WT plants (Figure 4, Table 4), which indicated that the reduction of IAA content was one of the important reasons for the dwarfing of T51 plants.
IAA regulates plant growth mainly through biosynthesis and transportation [42,43,44,45,46]. The research results of Arabidopsis thaliana mutants showed that the mutation of a single YUC gene (YUC1, YUC2, YUC4, and YUC6) did not lead to obvious developmental defects, while double mutants yuc1yuc4, yuc2yuc6, triple and quadruple mutants of four YUC genes all showed the phenotype of plant height reduction [47,48]. The SAV3 gene of Arabidopsis thaliana encodes the TAA1 protein, and sav3 mutant plants in the shade cannot elongate petioles and stems, and the IAA content is reduced by 40% [49]. Rice OsTAA1 gene deletion mutant plants showed an extremely dwarfed phenotype, and their auxin content was significantly reduced [50]. Arabidopsis thaliana double mutant cyp79b2 cyp79b3 plants are dwarfed, and the content of IAA in vivo is significantly reduced [51]. Nitrilase (NIT) can catalyze the conversion of indole-3-acetonitrile (IAN) to IAA [52]. There are four genes encoding NIT enzymes in Arabidopsis thaliana, namely NIT1, NIT2, NIT3, and NIT4 [53]. Compared with wild type, Arabidopsis thaliana nit1-3 mutant plants had decreased total IAA content but no change in episomal IAA concentration [52]. This study found that TAA1, YUCCA, and NIT in the IAA biosynthesis pathway were down-regulated at both the transcriptional and protein levels, and CYP79B2 and CYP79B3 were down-regulated at the protein level but had no difference at the transcriptional level (Table 5). These results indicate that the post-transcriptional regulation of TAA1, YUCCA, and NIT genes is not related to gene expression, while the expression of CYP79B2 and CYP79B3 is affected by post-transcriptional regulation. The down-regulated expressions of the differential proteins YUCCA, AA1, NIT, CYP79B2, and CYP79B3 are the reasons for the significant decrease of IAA content in T51 plants, which indicates that the dwarfing phenotype of T51 is closely related to IAA biosynthesis, and TAA1, YUCCA, and NIT may be the key candidate genes for T51 dwarfing (Figure 5).

Figure 5.
The changes of genes and metabolites in IAA biosynthesis pathway. Note: The red box indicates that the gene is down-regulated at both the transcription and protein levels; the yellow box indicates that the gene has no difference in the transcription level, but the expression is down-regulated at the protein level; the blue dashed box indicates that the differential metabolites are down-regulated.
The effect of salicylic acid (SA) on plant growth is mainly involved in plant disease resistance and stress resistance [54]. The effects of abscisic acid (ABA) on plants are mainly concentrated on stress resistance such as drought resistance, low-temperature resistance, and salt tolerance [55]. However, the main physiological effect of ABA is to inhibit the growth of plant cells, so the content of ABA has a potential link with the dwarf phenotype of plants [56]. There are also relevant studies to prove that there is an interaction between IAA and GA [57,58]. Metabonomics results showed that the contents of SA and ABA were also significantly different between T51 and WT, which indicated that ABA might have a potential effect on the dwarfing of T51.
The products of photosynthesis are the material basis for plant growth and development. Therefore, the photosynthetic capacity of plants is closely related to their growth rate [59]. Soluble sugar is one of the important components of plant saccharides, mainly including monosaccharides (such as glucose and fructose) and disaccharides (such as sucrose) [60]. Compared with WT plants, the relative contents of fructose, mannose, glucose, and sucrose in T51 were significantly down-regulated (Table 3), indicating that T51 had a low accumulation of photosynthetic products, which might be an important reason for the slow growth rate of T51. In addition, previous transcriptome and proteome studies showed that the dwarfing phenotype of T51 was closely related to the lignin-specific pathway [33]. There were three differential metabolites related to lignin metabolism, namely ferulic acid, sinapine, and coniferyl alcohol (Table 3), suggesting that the lignin-specific pathways of mutant T51 also changed at the metabolic level, which was consistent with previous findings.
5. Conclusions
In summary, our findings suggest that the reduced endogenous IAA content is one of the important reasons for the dwarf mutation in T51. The down-regulation of key proteins in the IAA biosynthesis pathway, including YUCCA, TAA1, NIT, CYP79B2, and CYP79B3 resulted in the decrease in IAA content. YUCCA, TAA1, and NIT are down-regulated at both transcriptional and protein levels, which are key candidate genes for dwarfing phenotype of T51. The present findings provide useful information on understanding T51 dwarfism, which may be helpful for the development of valuable new dwarf plant mutants in the future.
Supplementary Materials
The following supporting information can be downloaded at: https://www.mdpi.com/article/10.3390/agronomy12102254/s1, Figure S1: Base peak chromatogram in positive and negative ion modes of WT and T51, Figure S2: QC and QA scores plot in positive and negative ion modes of WT and T51, Figure S3: Metabolite statistics in T51 and WT, Figure S4: Differentially expressed genes in IAA biosynthesis pathway, Figure S5: Differentially expressed proteins of tryptophan pathway; Table S1: Statistical table of differential metabolites, Table S2: genes related to tryptophan metabolism and their expression patterns.
Author Contributions
Y.Z. and Z.Y. designed the study. Y.Z. performed the experiment and wrote the manuscript. J.L. and J.Y. collected the samples, Y.Z. analyzed the data. Y.Z. edited the manuscript draft. All authors have read and agreed to the published version of the manuscript.
Funding
This research was funded by “A survey on Chinese southern grassland forage germplasm resources (2017FY100600)” and “Innovation and promotion of forestry science and technology of Jiangsu Province (LYKJ [2021] 29)”.
Data Availability Statement
Not applicable.
Acknowledgments
The plant materials were provided by Jun Liu; Non-targeted Metabonomics were completed by Wuhan Gene Create Biological Engineering Co., Ltd.; Endogenous hormone content was detected by Nanjing Innvattion Biotechnology Co., LTD.
Conflicts of Interest
The authors declare no conflict of interest.
References
- Cyril, J.; Powell, G.; Duncan, R.; Baird, W. Changes in membrane polar lipid fatty acids of seashore paspalum in response to low temperature exposure. Crop Sci. 2002, 42, 2031–2037. [Google Scholar] [CrossRef]
- Lee, G.; Carrow, R.N.; Duncan, R.R. Salinity tolerance of selected seashore paspalums and bermudagrasses: Root and verdure responses and criteria. HortScience 2004, 39, 1143–1147. [Google Scholar] [CrossRef]
- Wang, M.; Chen, Z.; Barkley, N.; Newman, M.; Kim, W.; Raymer, P.; Pederson, G. Characterization of seashore paspalum (Paspalum vaginatum Swartz) germplasm by transferred SSRs from wheat, maize and sorghum. Genet. Resour. Crop Evol. 2006, 53, 779–791. [Google Scholar] [CrossRef]
- Kim, K.; Beard, J. Comparative turfgrass evapotranspiration rates and associated plant morphological characteristics. Crop Sci. 1988, 28, 328–331. [Google Scholar] [CrossRef]
- Chen, J.; Thammina, C.; Li, W.; Yu, H.; Yer, H.; El-Tanbouly, R.; Marron, M.; Katin-Grazzini, L.; Chen, Y.; Inguagiato, J. Isolation of prostrate turfgrass mutants via screening of dwarf phenotype and characterization of a perennial ryegrass prostrate mutant. Hortic. Res. 2016, 3, 16003. [Google Scholar] [CrossRef] [PubMed][Green Version]
- Wolters, H.; Jürgens, G. Survival of the flexible: Hormonal growth control and adaptation in plant development. Nat. Rev. Genet. 2009, 10, 305–317. [Google Scholar] [CrossRef]
- Deng, B.; Wang, X.; Long, X.; Fang, R.; Zhou, S.; Zhang, J.; Peng, X.; An, Z.; Huang, W.; Tang, W. Plant Hormone Metabolome and Transcriptome Analysis of Dwarf and Wild-type Banana. J. Plant Growth Regul. 2021, 41, 2386–2405. [Google Scholar] [CrossRef]
- Xing, M.; Su, H.; Liu, X.; Yang, L.; Zhang, Y.; Wang, Y.; Fang, Z.; Lv, H. Morphological, transcriptomics and phytohormone analysis shed light on the development of a novel dwarf mutant of cabbage (Brassica oleracea). Plant Sci. 2020, 290, 110283. [Google Scholar] [CrossRef]
- Hedden, P.; Thomas, S.G. Gibberellin biosynthesis and its regulation. Biochem. J. 2012, 444, 11–25. [Google Scholar] [CrossRef]
- Sasaki, A.; Ashikari, M.; Ueguchi-Tanaka, M.; Itoh, H.; Nishimura, A.; Swapan, D.; Ishiyama, K.; Saito, T.; Kobayashi, M.; Khush, G.S. A mutant gibberellin-synthesis gene in rice. Nature 2002, 416, 701–702. [Google Scholar] [CrossRef]
- Peng, J.; Richards, D.E.; Hartley, N.M.; Murphy, G.P.; Devos, K.M.; Flintham, J.E.; Beales, J.; Fish, L.J.; Worland, A.J.; Pelica, F. ‘Green revolution’genes encode mutant gibberellin response modulators. Nature 1999, 400, 256–261. [Google Scholar] [CrossRef]
- Zhao, B.; Lv, M.; Feng, Z.; Campbell, T.; Liscum, E.; Li, J. TWISTED DWARF 1 associates with BRASSINOSTEROID-INSENSITIVE 1 to regulate early events of the brassinosteroid signaling pathway. Mol. Plant 2016, 9, 582–592. [Google Scholar] [CrossRef]
- Bai, M.-Y.; Zhang, L.-Y.; Gampala, S.S.; Zhu, S.-W.; Song, W.-Y.; Chong, K.; Wang, Z.-Y. Functions of OsBZR1 and 14-3-3 proteins in brassinosteroid signaling in rice. Proc. Natl. Acad. Sci USA 2007, 104, 13839–13844. [Google Scholar] [CrossRef]
- Azpiroz, R.; Wu, Y.; LoCascio, J.C.; Feldmann, K.A. An Arabidopsis brassinosteroid-dependent mutant is blocked in cell elongation. Plant Cell. 1998, 10, 219–230. [Google Scholar] [CrossRef] [PubMed]
- Ma, Y.; Xue, H.; Zhang, L.; Zhang, F.; Ou, C.; Wang, F.; Zhang, Z. Involvement of auxin and brassinosteroid in dwarfism of autotetraploid apple (Malus × domestica). Sci. Rep. 2016, 6, 1–14. [Google Scholar] [CrossRef]
- Mano, Y.; Nemoto, K. The pathway of auxin biosynthesis in plants. J. Exp. Bot. 2012, 63, 2853–2872. [Google Scholar] [CrossRef]
- Strader, L.C.; Bartel, B. A new path to auxin. Nat. Chem. Biol. 2008, 4, 337–339. [Google Scholar] [CrossRef] [PubMed]
- Pollmann, S.; Neu, D.; Lehmann, T.; Berkowitz, O.; Schäfer, T.; Weiler, E.W. Subcellular localization and tissue specific expression of amidase 1 from Arabidopsis thaliana. Planta 2006, 224, 1241–1253. [Google Scholar] [CrossRef] [PubMed]
- Won, C.; Shen, X.; Mashiguchi, K.; Zheng, Z.; Dai, X.; Cheng, Y.; Kasahara, H.; Kamiya, Y.; Chory, J.; Zhao, Y. Conversion of tryptophan to indole-3-acetic acid by TRYPTOPHAN AMINOTRANSFERASES OF ARABIDOPSIS and YUCCAs in Arabidopsis. Proc. Natl. Acad. Sci. USA 2011, 108, 18518–18523. [Google Scholar] [CrossRef]
- Zhao, Y.; Christensen, S.K.; Fankhauser, C.; Cashman, J.R.; Cohen, J.D.; Weigel, D.; Chory, J. A role for flavin monooxygenase-like enzymes in auxin biosynthesis. Science 2001, 291, 306–309. [Google Scholar] [CrossRef] [PubMed]
- Ueguchi-Tanaka, M.; Fujisawa, Y.; Kobayashi, M.; Ashikari, M.; Iwasaki, Y.; Kitano, H.; Matsuoka, M. Rice dwarf mutant d1, which is defective in the α subunit of the heterotrimeric G protein, affects gibberellin signal transduction. Proc. Natl. Acad. Sci. USA 2000, 97, 11638–11643. [Google Scholar] [CrossRef]
- Zhang, J.; Liu, X.; Li, S.; Cheng, Z.; Li, C. The rice semi-dwarf mutant sd37, caused by a mutation in CYP96B4, plays an important role in the fine-tuning of plant growth. PLoS ONE 2014, 9, e88068. [Google Scholar] [CrossRef]
- Agarwal, P.; Balyan, H.; Gupta, P. Identification of modifiers of the plant height in wheat using an induced dwarf mutant controlled by RhtB4c allele. Physiol. Mol. Biol. Plants 2020, 26, 2283–2289. [Google Scholar] [CrossRef]
- Xu, T.; Bian, N.; Wen, M.; Xiao, J.; Yuan, C.; Cao, A.; Zhang, S.; Wang, X.; Wang, H. Characterization of a common wheat (Triticum aestivum L.) high-tillering dwarf mutant. Theor. Appl. Genet. 2017, 130, 483–494. [Google Scholar] [CrossRef] [PubMed]
- Li, C.; Tang, J.; Hu, Z.; Wang, J.; Yu, T.; Yi, H.; Cao, M. A novel maize dwarf mutant generated by Ty1-copia LTR-retrotransposon insertion in Brachytic2 after spaceflight. Plant Cell Rep. 2020, 39, 393–408. [Google Scholar] [CrossRef]
- Cassani, E.; Bertolini, E.; Cerino Badone, F.; Landoni, M.; Gavina, D.; Sirizzotti, A.; Pilu, R. Characterization of the first dominant dwarf maize mutant carrying a single amino acid insertion in the VHYNP domain of the dwarf8 gene. Mol. Breed. 2009, 24, 375–385. [Google Scholar] [CrossRef]
- Cheng, Q.; Dong, L.; Su, T.; Li, T.; Gan, Z.; Nan, H.; Lu, S.; Fang, C.; Kong, L.; Li, H. CRISPR/Cas9-mediated targeted mutagenesis of GmLHY genes alters plant height and internode length in soybean. BMC Plant Biol. 2019, 19, 1–11. [Google Scholar] [CrossRef]
- Hwang, W.J.; Kim, M.Y.; Kang, Y.J.; Shim, S.; Stacey, M.G.; Stacey, G.; Lee, S.-H. Genome-wide analysis of mutations in a dwarf soybean mutant induced by fast neutron bombardment. Euphytica 2015, 203, 399–408. [Google Scholar] [CrossRef]
- Wu, C.; Zhou, B.; Zhang, T. Isolation and characterization of a sterile-dwarf mutant in Asian cotton (Gossypium arboreum L.). J. Genet. Genom. 2009, 36, 343–353. [Google Scholar] [CrossRef]
- Ma, C.; Rehman, A.; Li, H.G.; Zhao, Z.B.; Sun, G.; Du, X.M. Mapping of dwarfing QTL of Ari1327, a semi-dwarf mutant of upland cotton. BMC Plant Biol. 2022, 22, 1–14. [Google Scholar] [CrossRef]
- Lin, T.; Zhou, R.; Bi, B.; Song, L.; Chai, M.; Wang, Q.; Song, G. Analysis of a radiation-induced dwarf mutant of a warm-season turf grass reveals potential mechanisms involved in the dwarfing mutant. Sci. Rep. 2020, 10, 1–14. [Google Scholar] [CrossRef]
- Gan, L.; Di, R.; Chao, Y.; Han, L.; Chen, X.; Wu, C.; Yin, S. De novo transcriptome analysis for Kentucky Bluegrass dwarf mutants induced by space mutation. PLoS ONE 2016, 11, e0151768. [Google Scholar]
- Zhang, Y.; Liu, J.; Yu, J.; Zhang, H.; Yang, Z. Relationship between the Phenylpropanoid Pathway and Dwarfism of Paspalum seashore Based on RNA-Seq and iTRAQ. Int. J. Mol. Sci. 2021, 22, 9568. [Google Scholar] [CrossRef]
- Vasilev, N.; Boccard, J.; Lang, G.; Grömping, U.; Fischer, R.; Goepfert, S.; Rudaz, S.; Schillberg, S. Structured plant metabolomics for the simultaneous exploration of multiple factors. Sci. Rep. 2016, 6, 1–15. [Google Scholar] [CrossRef]
- Holman, J.D.; Tabb, D.L.; Mallick, P. Employing ProteoWizard to convert raw mass spectrometry data. Curr. Protoc. Bioinf. 2014, 46, 13–24. [Google Scholar] [CrossRef]
- Huan, T.; Forsberg, E.M.; Rinehart, D.; Johnson, C.H.; Ivanisevic, J.; Benton, H.P.; Fang, M.; Aisporna, A.; Hilmers, B.; Poole, F.L. Systems biology guided by XCMS Online metabolomics. Nat. Methods 2017, 14, 461–462. [Google Scholar] [CrossRef]
- Ward, J.L.; Harris, C.; Lewis, J.; Beale, M.H. Assessment of 1H NMR spectroscopy and multivariate analysis as a technique for metabolite fingerprinting of Arabidopsis thaliana. Phytochemistry 2003, 62, 949–957. [Google Scholar] [CrossRef]
- Orozco-Arroyo, G.; Paolo, D.; Ezquer, I.; Colombo, L. Networks controlling seed size in Arabidopsis. Plant Reprod. 2015, 28, 17–32. [Google Scholar] [CrossRef]
- Chen, J.; Xie, J.; Duan, Y.; Hu, H.; Hu, Y.; Li, W. Genome-wide identification and expression profiling reveal tissue-specific expression and differentially-regulated genes involved in gibberellin metabolism between Williams banana and its dwarf mutant. BMC Plant Biol. 2016, 16, 1–18. [Google Scholar] [CrossRef]
- Yu, D.; Qanmber, G.; Lu, L.; Wang, L.; Li, J.; Yang, Z.; Liu, Z.; Li, Y.; Chen, Q.; Mendu, V. Genome-wide analysis of cotton GH3 subfamily II reveals functional divergence in fiber development, hormone response and plant architecture. BMC Plant Biol. 2018, 18, 1–18. [Google Scholar] [CrossRef]
- Gan, L.; Su, H.; Yan, M.; Han, L.; Yin, S. Differential expression of gibberellin-related genes in wild type and dwarf mutant of Poa pratensis implied their roles in regulating plant height. Crop Sci. 2021, 61, 3023–3034. [Google Scholar] [CrossRef]
- Teale, W.D.; Paponov, I.A.; Palme, K. Auxin in action: Signalling, transport and the control of plant growth and development. Nat. Rev. Mol. Cell Biol. 2006, 7, 847–859. [Google Scholar] [CrossRef]
- Vanstraelen, M.; Benková, E. Hormonal interactions in the regulation of plant development. Annu. Rev. Cell Dev. Biol. 2012, 28, 463–487. [Google Scholar] [CrossRef]
- Abbas, M.; Alabadí, D.; Blázquez, M.A. Differential growth at the apical hook: All roads lead to auxin. Front Plant Sci. 2013, 4, 441. [Google Scholar] [CrossRef]
- Adamowski, M.; Friml, J. PIN-dependent auxin transport: Action, regulation, and evolution. Plant Cell. 2015, 27, 20–32. [Google Scholar] [CrossRef]
- Zhou, J.-J.; Luo, J. The PIN-FORMED auxin efflux carriers in plants. Int. J. Mol. Sci. 2018, 19, 2759. [Google Scholar] [CrossRef]
- Cheng, Y.; Dai, X.; Zhao, Y. Auxin biosynthesis by the YUCCA flavin monooxygenases controls the formation of floral organs and vascular tissues in Arabidopsis. Genes Dev. 2006, 20, 1790–1799. [Google Scholar] [CrossRef]
- Cheng, Y.; Dai, X.; Zhao, Y. Auxin synthesized by the YUCCA flavin monooxygenases is essential for embryogenesis and leaf formation in Arabidopsis. Plant Cell. 2007, 19, 2430–2439. [Google Scholar] [CrossRef]
- Tao, Y.; Ferrer, J.-L.; Ljung, K.; Pojer, F.; Hong, F.; Long, J.A.; Li, L.; Moreno, J.E.; Bowman, M.E.; Ivans, L.J. Rapid synthesis of auxin via a new tryptophan-dependent pathway is required for shade avoidance in plants. Cell 2008, 133, 164–176. [Google Scholar] [CrossRef]
- Zhang, T.; Li, R.; Xing, J.; Yan, L.; Wang, R.; Zhao, Y. The YUCCA-auxin-WOX11 module controls crown root development in rice. Front Plant Sci. 2018, 9, 523. [Google Scholar] [CrossRef]
- Zhao, Y.; Hull, A.K.; Gupta, N.R.; Goss, K.A.; Alonso, J.; Ecker, J.R.; Normanly, J.; Chory, J.; Celenza, J.L. Trp-dependent auxin biosynthesis in Arabidopsis: Involvement of cytochrome P450s CYP79B2 and CYP79B3. Genes Dev. 2002, 16, 3100–3112. [Google Scholar] [CrossRef]
- Lehmann, T.; Janowitz, T.; Sánchez-Parra, B.; Alonso, M.-M.P.; Trompetter, I.; Piotrowski, M.; Pollmann, S. Arabidopsis NITRILASE 1 contributes to the regulation of root growth and development through modulation of auxin biosynthesis in seedlings. Front Plant Sci. 2017, 8, 36. [Google Scholar] [CrossRef] [PubMed]
- Bartel, B.; Fink, G.R. Differential regulation of an auxin-producing nitrilase gene family in Arabidopsis thaliana. Proc. Natl. Acad. Sci. USA 1994, 91, 6649–6653. [Google Scholar] [CrossRef]
- Horváth, E.; Szalai, G.; Janda, T. Induction of abiotic stress tolerance by salicylic acid signaling. J. Plant Growth Regul. 2007, 26, 290–300. [Google Scholar] [CrossRef]
- Du, H.; Wang, N.; Cui, F.; Li, X.; Xiao, J.; Xiong, L. Characterization of the β-carotene hydroxylase gene DSM2 conferring drought and oxidative stress resistance by increasing xanthophylls and abscisic acid synthesis in rice. Plant Physiol. 2010, 154, 1304–1318. [Google Scholar] [CrossRef]
- Zheng, X.; Zhang, H.; Xiao, Y.; Wang, C.; Tian, Y. Deletion in the promoter of PcPIN-L affects the polar auxin transport in dwarf pear (Pyrus communis L.). Sci. Rep. 2019, 9, 1–12. [Google Scholar]
- Willige, B.C.; Isono, E.; Richter, R.; Zourelidou, M.; Schwechheimer, C. Gibberellin Regulates PIN-FORMED Abundance and Is Required for Auxin Transport–Dependent Growth and Development in Arabidopsis thaliana. Plant Cell. 2011, 23, 2184–2195. [Google Scholar] [CrossRef]
- Baba, A.I.; Valkai, I.; Labhane, N.M.; Koczka, L.; Andrási, N.; Klement, É.; Darula, Z.; Medzihradszky, K.F.; Szabados, L.; Fehér, A. CRK5 protein kinase contributes to the progression of embryogenesis of Arabidopsis thaliana. Int. J. Mol. Sci. 2019, 20, 6120. [Google Scholar] [CrossRef] [PubMed]
- Richards, R. Selectable traits to increase crop photosynthesis and yield of grain crops. J. Exp. Bot. 2000, 51 (Suppl. 1), 447–458. [Google Scholar] [CrossRef]
- Saddhe, A.A.; Manuka, R.; Penna, S. Plant sugars: Homeostasis and transport under abiotic stress in plants. Physiol. Plant. 2021, 171, 739–755. [Google Scholar] [CrossRef] [PubMed]


Publisher’s Note: MDPI stays neutral with regard to jurisdictional claims in published maps and institutional affiliations. |
© 2022 by the authors. Licensee MDPI, Basel, Switzerland. This article is an open access article distributed under the terms and conditions of the Creative Commons Attribution (CC BY) license (https://creativecommons.org/licenses/by/4.0/).