Abstract
The intense and successive use of mechanization in modern cropping systems has increased soil compaction under no-till areas. In this study, we aimed to assess the performance of a fixed shank coupled with a seeder for the mitigation of soil compaction induced by machinery traffic as an efficient alternative to replacing the chiseling and subsoiling operations in no-till areas. We evaluated a long-term experiment conducted in clay loam (Rhodic Haplustox) soil in southern Brazil. The experiment was conducted under a randomized block design, whose treatments consisted of three wheel-traffic intensities: 0 wheel-traffic (0 WT), 14 wheel-traffic (14 WT), and 28 wheel-traffic (28 WT), combined with four soil tillage mechanical interventions under a no-till field: no-till (NT), no-till with a fixed shank (NT + FS), soil chiseling (SC), and soil subsoiling (SS). The soil physical attributes evaluated were the soil penetration resistance (SPR), macroporosity (MaP), microporosity (MiP), total porosity (TP), bulk density (BD), field-saturated hydraulic conductivity (Kfs), S index, and plant-available water capacity (PAWC). In addition, three critical soil physical functions were evaluated by using a soil physical quality index (SPQI). The results showed that SPR was sensitive to soil compaction and captured differences among the mechanical intervention methods. Machinery traffic caused soil compaction, increasing SPR and reducing PAWC. Soil chiseling and subsoiling promoted lower BD, a higher TP, MaP, Kfs, and higher S index at the 0.05–0.15 m soil layer. Based on the SPQI, no changes were detected in the soil physical functions between NT and NT + FS. On the other hand, SC and SS enhanced soil physical functioning by 10%. We concluded that a 15-cm deep fixed shank could not mitigate the soil compaction induced by machinery traffic at the seeder operation. Therefore, this method is less effective in improving the soil’s physical environment than chiseling and subsoiling operations. Finally, we encourage monitoring the persistence of these benefits on the soil over the subsequent crop seasons and in years with an intense water deficit along with the crop cycle.
1. Introduction
No-till (NT) is one of the most important soil conservation practices adopted in Brazil [1] and worldwide [2] due to its benefits in reducing soil erosion [3,4], increasing soil carbon stock [5], and improving soil biological diversity [6]. In Brazil, the state of Paraná pioneered the NT adoption in the late 1970s [1]. However, despite NT advantages, some factors have restricted the sustainability of this cropping system from a long-term perspective. In recent decades, the machinery traffic of larger and heavy machines [7,8,9] carried out under wet soil conditions has been indicated as an important cause of soil compaction in no-till areas [9,10,11,12]. In addition, other factors such as the absence of crop rotation [13,14] have contributed to the soil degradation processes under NT, resulting in compaction, potentiating the erosion process, and inducing crop yield loss [15]. However, there are some management strategies (mechanical, biological, and chemical) that can be applied to minimize these problems [16].
Soil mechanical intervention has been considered an alternative for breaking compacted layers, improving the development of crop root systems, and increasing the soil’s physical quality [17]. In more than 70% of the experimental studies, mitigating soil compaction is the main objective of using occasional tillage, which includes soil chiseling and subsoiling [18]. A single strip of soil is mobilized during chiseling and subsoiling operations, keeping at least 30% of the soil surface covered by crop residues. It can be considered a conservation tillage strategy and can increase soybean yield with a better effect on subsoiling due to the greater depth of mechanical intervention and the greater capacity of this operation to break compacted layers compared to chiseling [19]. However, previous studies in Brazil indicated that the temporary action of these operations is around one year, e.g., [20,21,22,23]. Vizioli et al. [24] observed that soil chiseling every three years under no-till had detrimental effects on crop yield compared to NT, but the mean values were not statistically significant.
The NT technique is based on the localized seeding furrow using disruptive mechanisms to transpose the surface straw and perform the deposition of fertilizers and seeds [25,26]. Some studies have shown that mechanical intervention in the sowing line can locally improve the soil’s physical quality as a result of the action of the sowing discs [27]. However, this effect improves physical soil conditions only at the surface soil layers [28,29] and remains for a short period after seeding [30]. As shown by Nunes et al. [31], coupling fixed shanks to the seeders to a higher action depth can be an alternative for breaking compacted soil layers in no-till. This practice has been more frequent in the Brazilian clay soils, presenting the advantage that coupling shanks into the seeders breaks compacted layers in the sowing line along with the seeding, minimizing additional machine traffic operations in the field [32]. Although this practice is well disseminated and adopted by Brazilian farmers [33,34], only a few studies investigated its effects on the soil’s physical properties and the development of plants [33] but without properly investigating crop yields. Furthermore, no studies have compared the effects of a fixed shank in a seeder with mechanical intervention in the pre-sowing of crops by using soil mechanical operations such as chiseling and subsoiling.
Field-scale studies are essential to determine the best management to be adopted to mitigate soil compaction, monitoring the soil’s physical attributes and crop response. Physical indicators of soil quality can capture the physical degradation of the soil [35]. Peixoto et al. [19] found that the most sensitive soil physical attributes in response to soil tillage, regardless of depth, are macroporosity, microporosity, bulk density, S index, aeration capacity, field capacity, and soil penetration resistance. The latter is an indicator highly correlated with soybean yield, followed by aeration capacity, macroporosity, field capacity, and S index. Indices that integrate indicators to infer key soil physical functions have been proposed to evaluate the physical quality of soils in Brazil [35]. It was verified that the soil physical quality index (SPQI) approach could detect and rank changes in key soil physical functions induced by sugarcane cultivation in central-south and northeast regions [35,36]. Santos et al. [37] used the SPQI to assess the impact of agriculture expansion in the MATOPIBA region, in northeastern Brazil.
In this context, we hypothesized that coupling a fixed shank to a seeder would improve the soil’s physical quality and that its effect would be equivalent to the use of soil chiseling and soil subsoiling, regardless of the degree of soil compactness. To prove our hypothesis, we simulated successive heavier machine traffic conditions and compared the coupling of a fixed shank-seeder with chiseling and subsoiling soil mechanical intervention practices used in crop pre-sowing. Thus, this study evaluates whether using a fixed shank coupled with a seeder can mitigate soil compaction induced by machinery traffic, becoming an efficient alternative to replace the chiseling and subsoiling operations in no-till areas.
2. Materials and Methods
2.1. Experimental Site and Management
The experimental site used for this study belongs to the ABC Foundation, located in Ponta Grossa, State of Paraná, southern Brazil (25°01′42.87″ S, 50°15′07.18″ W, 890 m above sea level). The climate is mesothermal humid subtropical (Cfb), according to Koppen’s classification [38]. The soil has a clay loam texture (518; 103 and 379 g kg−1 of clay, silt, and sand, respectively), and is classified as a Rhodic Haplustox according to the US Soil Taxonomy [39].
The experiment was carried out under a randomized block experimental design, with split plots and plots arranged in bands, with 3 blocks and 12 treatment levels, totaling 36 experimental plots. In each one of the plots, two repetitions were performed. The size of the plots was 6 m × 8 m (48 m2). The main treatments consisted of three variations in wheel-traffic: 0 wheel-traffic (0 WT), 14 wheel-traffic (14 WT), and 28 wheel-traffic (28 WT), and four mechanical interventions: no-till (NT)—seeder equipped without a fixed shank opener (without intervention); no-till with a fixed shank (NT + FS); soil chiseling (SC); and soil subsoiling (SS). The shank opener of a seeder used for maize (Zea mays L.) sowing worked at a depth up to 0.15 m; the soil chiseling shank worked at a depth up to 0.25 m; and the shank of soil subsoiling worked at a depth up to 0.40 m.
The experiment was installed in 2013 in an agricultural production area cultivated under NT over ten past years (Figure 1). In 2013, 2014, and 2015, wheel traffic was carried out to simulate different intensities of machinery traffic. In 2018, mechanical interventions were conducted (soil chiseling and soil subsoiling). In the agricultural year 2018–2019, maize was cultivated, and the treatments of a no-till seeder without a fixed shank opener and a no-till seeder equipped with a fixed shank were applied. Soil sampling was carried out after the maize crop harvest, in 2019.
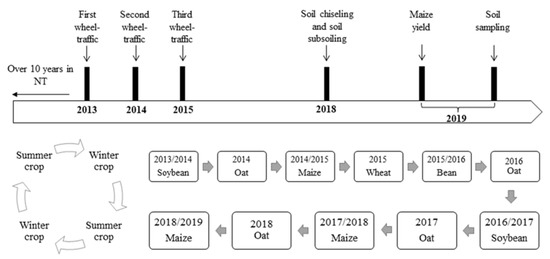
Figure 1.
Chronology of the experimental site and management in the experimental area, highlighting the field traffic events, soil mechanical interventions, soil sampling, and the crop cultivation sequence.
The crop production system in the region is characterized by a rotation including summer and winter crops, as shown in Figure 1. Table 1 presents the yield of the crops after the experiment implementation. The crop yield after the last traffic levels in the experiment can be observed after 2015 (wheat crop). All yields correspond to the period before the soil mechanical interventions.

Table 1.
Crop yields (kg ha−1) in the experimental area before soil mechanical interventions.
The wheel traffic was carried out in three stages for three consecutive years: the first on 26 November 2013, with 6 wheel-traffic and 12 wheel-traffic to the treatment 14 WT and 28 WT, respectively; the second on 17 July 2014, with 4 wheel-traffic and 8 wheel-traffic to the treatment 14 WT and 28 WT, respectively. Finally, on 16 June 2015, the last traffic levels in the experiment were carried out, with 4 wheel traffic and 8 wheel traffic to the treatment 14 WT and 28 WT, respectively, totaling treatments: 0 WT, 14 WT, and 28 WT. The precipitation accumulated 15 days before each stage of wheel traffic was 34.2, 4.4, and 59 mm.
The traffic was carried out with a Massey Ferguson 7350 Dyna 6-7350 tractor, with a Goodyear 12.4-26 radial front tire (Power Torque) with a width of 0.44 m and a Goodyear 24.5-32 radial rear tire (Dyna Torque III) with a width of 0.60 m. The load per pass is 0.70 kg cm−2, totaling 0, 9.8, and 19.6 kg cm−2 in the 0 WT, 14 WT, and 28 WT treatments, respectively. During the study, machinery traffic in the experimental area was restricted to the period of crop sowing. Soil chiseling and soil subsoiling were carried out on 21 June 2018, in pre-sowing of the winter crop (black oat, cultivar Embrapa 29), with an accumulated precipitation of 51.2 mm, 15 days before the soil mechanical intervention.
Table 2 shows the soil chemical attributes determined at the beginning of the experiment (2013), and at 24 (2015) and 48 months (2017) after. During this period, limestone was not applied, and fertilization management was conducted according to technical recommendations for each crop. The maize cultivated in the 2018/2019 summer crop was the hybrid Agroceres AG9025 PRO3, which received basic fertilization of 32 kg ha−1 of the formula 13-31-00 with 1.5% zinc, and the cover fertilization of 320 kg ha−1 of the NPK formula 45-00-00 and 150 kg ha−1 of the NPK formula 00-00-58. The fertilization was the same in all treatments.
Table 2.
The soil chemical characterization (0–0.20 m) of the experimental area performed in 2013, 2015, and 2017.
Figure 2 shows the precipitation that occurred 10 days before maize sowing and during crop development. The accumulated precipitation 10 days before maize sowing was 24.8 mm. The accumulated precipitation during the crop development was 240, 17.6, 216.20, 88.20, and 158.60 mm in October, November, December, January, and February, respectively. Meteorological data were obtained from the Agrometeorological Station of the Experimental Field of ABC Foundation in Ponta Grossa, Paraná.
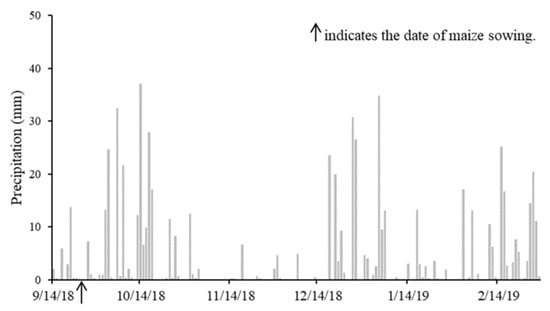
Figure 2.
Daily rainfall data (mm) observed 10 days before maize sowing and during crop development. Ponta Grossa—PR.
The maize was manually harvested in March 2019, in an area of 9.6 m2, with four rows of 6.0 m and a spacing of 0.40 m.
2.2. Soil Sampling and Analysis
The measurements of soil penetration resistance (SPR) were carried out up to 0.4 m deep using an electronic field penetrometer (Falker, model PenetroLOG PLG1020). At the time of SPR determination, the mean gravimetric soil water content values (g g−1, %), with respective standard deviation, were 21.44 ± 0.19 for 0 WT, 21.95 ± 0.17 for 14 WT, and 21.95 ± 0.66 for 28 WT, and 21.72 ± 0.13 for NT, 21.58 ± 0.33 for NT + FS, 21.71 ± 0.41 for SC, and 22.17 ± 0.68 for SS.
The field-saturated hydraulic conductivity (Kfs) was measured at a depth of 0.05–0.15 m using the ‘simplified falling-head’ method [40]. Infiltration time was measured using a ring infiltrometer of 0.20 m diameter inserted 0.05 m into the soil. A pre-established volume of water (0.5 L) was added to the soil surface. The α parameter utilized to calculate Kfs was 12 [41] due to the soil-defined structure and infiltration time of less than 5 min.
Undisturbed soil samples (cylinders of 0.05 × 0.05 m) were collected at a depth of 0.05–0.15 m and used for soil physical analyses. These samples were saturated by capillary raising for 48 h. Then, the samples were weighed. The soil water content was determined at nine matric potentials: for −3, −6, −10, −30, and −50 kPa in a pF laboratory station, (ecoTec); Richard’s extractor for −100 and −300 kPa and a WP4-T Dewpoint Potential Meter was used for −1000 and −1500 kPa. The permanent wilting point (PWP) of the plants was calculated according to Campbell [42]. The soil water retention curve was fitted by the van Genuchten model [43] to determine the S index, which was obtained according to Dexter [44].
The total porosity (TP, m3 m−3), soil macroporosity (MaP, m3 m−3), soil microporosity (MiP, m3 m−3), and bulk density (BD) were calculated following the methodology described by Teixeira et al. [45]. In addition, we calculated some Reynolds’s indexes [46]: the soil aeration capacity (SAC), which ranges from 0 to 1: (SAC = 1 − (θFC/TP)) where θFC is the volumetric water content at the field capacity and is usually considered as the water content at the matric potential of −10 kPa [47]. Plant available water (PAWC (m3 m−3)) was calculated as the difference between the field capacity (FC), assumed to be the water content at −10 kPa, and the plant permanent wilting point (PWP) of plants (−1500 kPa) (PAWC = FC−10kPa − PWP).
2.3. Soil Physical Quality Index Development
The effects of wheel traffic and mechanical intervention on soil physical quality were assessed by an overall soil physical quality index (SPQI) for the 0.05–0.15 m layer, adapted from Cherubin et al. [35]. Three steps are necessary for developing the SPQI: (i) the selection of indicators, (ii) the interpretation of selected indicators, and (iii) the integration of indicators into the SPQI. In the first step, appropriate soil physical indicators were selected to monitor three critical soil physical functions: f(i) support to plant growth, f(ii) water fluxes, and f(iii) soil aeration capacity. Then, based on published literature and the authors’ experience, we selected six indicators from our dataset to compose the minimum dataset, these being f(i)—BD and SPR, f(ii)—PAWC and Kfs, and f(iii)—SAC and MaP.
In the second step, the indicators were transformed into dimensionless values ranging from 0 to 1. The indicators were ranked based on linear scoring curves. The highest value of each indicator was considered detrimental or beneficial according to its relationship with the respective soil’s physical functions. For “more is better” indicators (e.g., Kfs, PAWC, and MaP), the highest observed value received a score of 1. For “less is better” indicators (e.g., BD and SPR), the lowest observed value received a score of 1. For “optimum” indicators, such as SAC, a threshold value (SAC = 0.33) was used to score the maximum value (score = 1), while values above and below 0.33 had their scores reduced linearly.
In the third step, the transformed values were combined into an index by multiplying the scores of each indicator by the function weight (Equation (1)):
where SPQI is the soil physical quality index, f(scores) is the score obtained for each function, and W is the weight of each function, as exemplified in Table 3.
SPQI = Ʃf(scores)W,
Table 3.
An example of the framework applied to develop the Soil Physical Quality Index (SPQI) for assessing the effects of wheel traffic and soil mechanical intervention in a Rhodic Ferralsol.
2.4. Statistical Analysis
The effect of the treatments was evaluated through analysis of variance (ANOVA). When a significant effect was observed, treatment means were compared by the Duncan test (p < 0.10). The presence of outliers in the dataset was verified by the Grubbs test only for the Kfs, proceeding with outliers’ removal, which resulted in the normality of residues for the ANOVA in all studied variables. All analyses were performed using the R software [48].
3. Results
3.1. Field Measurements of Soil Penetration Resistance
Machinery traffic induced increments on soil penetration resistance (Figure 3a). In this study, significant changes (p ≤ 0.01) were detected under wheel traffic in the 0.05 to 0.10 m soil layer for the 14 and 28 WT compared to the treatment 0 WT, with average values of 1404.03 kPa, 1682.98 kPa, and 1619.69 kPa to treatments 0 WT, 14 WT, and 28 WT, respectively. At other depths, no significant SPR differences were found for additional traffic levels.
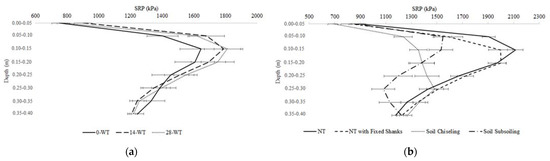
Figure 3.
Soil penetration resistance (SRP, kPa). (a) Values for wheel traffic (WT); (b) Mechanical interventions up to a depth of 0.40 m. (Bars were calculated using standard error). WT: wheel traffic. NT: no-till. NT + FS: no-till with fixed shank. SC: Soil chiseling. SSS: Soil subsoiling.
Mechanical intervention induced the reduction in soil penetration resistance (Figure 3b) from the 0.05 to 0.10 m soil layer 11 months after the soil mechanical intervention. This layer demonstrated significant differences (p ≤ 0.1), with higher SPR values for NT and lower values for SC. There was no significant statistical difference for SPR values between NT + FS and SS in this layer, differing from NT and SC. However, this effect was not observed at the surface layer (0.00–0.05 m), for which there were no significant differences in the SPR values.
In the layer from 0.10 to 0.15 m, there were no significant differences between the NT and NT + FS. Both differed from SC and SS (p ≤ 0.01), which did not present significant differences between them and presented reduced SPR values compared to NT and NT + FS. This result was repeated for layers from 0.15 to 0.20 (p ≤ 0.001) and 0.20 to 0.25 m (p ≤ 0.1) (Figure 3a). In a depth of 0.25–0.30 m, there was a significant difference (p ≤ 0.1) for the SPR values in the SS, which differed from other treatments. There were no significant differences among the treatments in the deeper layers (0.30–0.40 m).
3.2. Soil Physical Measurements at the 0.05 to 0.15 m Soil Layer
Most soil physical indicators were not sensitive to the impacts of the wheel traffic (Table 4). However, SPR and PAWC were exceptions. For the PAWC, machinery traffic reduced the values by 18% compared to the absence of traffic (0 WT), regardless of intensity (14 or 28 WT). The 0 WT also showed statistical differences, with reduced SPR values near 11% (average of 1525.09 kPa) compared with 14 and 28 WT (average values of ~1700 kPa).
Table 4.
Physical indicators of the wheel traffic at a depth of 0.05–0.15 m.
Despite the tendency to reduce Kfs with the increase in wheel traffic (38.29, 41.12, and 48.23 cm h−1 for the 28, 14, and 0 WT), no significant differences were observed for this attribute. The coefficient of variation for Kfs ranged from 59.59 to 80.08%. High CV values for Kfs were verified in other studies [40,41,42,43,44,45,46,47,48,49]. Cavalieri et al. [14] found a coefficient of variation of Kfs between 60 and 90%.
The soil mechanical interventions (SC and SS treatments) resulted in significant reductions (p ≤ 0.05) in BD compared to the control treatment (NT), with BD mean values of 1.30 g cm−3 in the NT and 1.22 and 1.24 g cm−3 in SS and SC, respectively (Table 5). No significant differences were found by the Duncan test between SC and NT + FS. The reduction in BD increases soil porosity; thus, the SC and SS treatments provided an increase in TP (p ≤ 0.05) when compared to NT and NT + FS due to changes in the MaP (p ≤ 0.05), with no change in MiP (p = 0.196). Average values of 0.10 m3 m−3 for MaP were observed for NT, while for SS, the MaP average value was 0.15 m3 m−3 (Table 5).
Table 5.
Physical indicators for the soil mechanical interventions at a depth of 0.05–0.15 m.
A greater MaP in SC and SS was reflected in Kfs, with significant differences verified for Kfs (p ≤ 0.10) and higher values in SC and SS treatments. However, these were equal and did not differ from NT + FS. The NT had the lowest mean value of Kfs (26.18 cm h−1), statistically equal to NT + FS and SC. The values of coefficients of variation ranged from 50.76 to 66.71%. For the SAC, significant differences were verified, with greater aeration capacity for the SS and lower for the NT + FS.
There were no differences among treatments for PAWC (p = 0.114), corroborating with the MiP (p = 0.196). The PAWC is retained in the soil MiP and was not influenced by mechanical interventions. The S index was significant at p ≤ 0.001, significantly higher on SC and SS compared to NT and NT + FS. The SC and SS treatments showed higher mean values of the S index (0.039) compared to NT and NT + FS (0.035) (Table 5). The SPR showed significant differences in the F-test (p = 0.005). The Duncan test indicated that the mean of the SC (1295.77 kPa) differed from the SS mean (1539.16 kPa) and both differed from the NT and NT + FS means (2009.15 and 1791.86 kPa, respectively). NT and NT + FS were statistically equal regarding the mean SPR values (Table 5).
3.3. Soil Physical Function and Soil Physical Quality Index (SPQI)
For the plant growth physical function, there was a significant effect on the interaction treatment between the wheel traffic and mechanical interventions (Table 6). The wheel-traffic treatment effect was observed only for the SC, with a higher value for 0 WT compared to 14 and 28 WT (p ≤ 0.05). The 14 WT and 28 WT treatments significantly reduced plant growth scores (0.80 and 0.79, respectively) compared to 0 WT (0.88). A significant effect was observed for mechanical interventions in all-wheel traffic. In the 0 WT treatment, SC had the highest index (0.88), differing from SS (0.79), which had the second highest index and differed from NT and NT + FS (0.66 and 0.71, respectively. For 14 WT, SC and SS did not show significant differences, while NT was statistically equal to NT + FS (p ≤ 0.001). The significance level (p-value) was lower for the 28 WT treatments (p ≤ 0.05), where SC and SS showed no difference and only SC differed from NT and NT + FS.
Table 6.
Soil physical functions and soil physical quality index (SPQI) for the wheel-traffic and mechanical interventions for depth of 0.05–0.15 m.
For the function “water fluxes”, a higher water flux score was found for 0 WT compared to 28 WT (p ≤ 0.10), and further reduced by 22.22% in 28 WT (0.42) concerning the maximum performance (0.54) in 0 WT. The function related to soil aeration capacity indicates no differences among 0 WT, 14 WT, and 28 WT (0.52, 0.58, and 0.70, respectively). Overall, the IQFS showed that the traffic level intensification did not decrease the soil’s capacity to perform its specific physical functions.
For mechanical interventions, NT + FS presented SPQI similar to NT. A higher SPQI was observed for SC and SS, with a significance level of 1%. SC and SS scores for NT and NT + FS were reduced (from 0.65 to 0.56 and 0.55, respectively). The water fluxes function (p ≤ 0.10) presented a similar result, with a reduction in SC and SS scores for NT and NT + FS (from 0.54 and 0.53 to 0.43, respectively). For soil aeration capacity, the SS was significantly higher than NT and NT + FS, which did not differ from SC (p ≤ 0.10).
3.4. Maize Yield
Despite the trend of increasing maize yield with the reduction in traffic levels, there was no statistical difference in maize yield (Figure 4). The maize yield was reduced by 7.3% in 28 WT (12.18 ton ha−1) concerning the maximum maize yield (13.14 ton ha−1) in 0 WT (Figure 4a). Furthermore, there was no significant difference in maize yield in response to mechanical interventions.
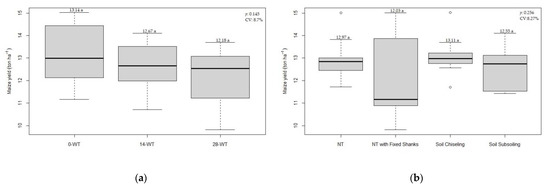
Figure 4.
Maize yield for the (a) wheel traffic and (b) mechanical interventions. Mean values followed by the same letter do not differ according to the Duncan test (p < 0.10).
The highest average yield found in mechanical interventions was in the SC treatment (13.11 ton ha−1), followed by NT (12.97 ton ha−1) and SS (12.55 ton ha−1). On the contrary, the lowest average yield was observed in NT + FS (12.03 ton ha−1) (Figure 4b), but all results are above the yield average in the state of Paraná (9.708 ton ha−1) and the region of Campos Gerais (10.6 ton ha−1) [50].
4. Discussion
4.1. Field Measurements of Soil Penetration Resistance
By evaluating the SPR in the 0.0–0.40 m soil layer in Rhodic Haplustox subjected to wheel-traffic and mechanical interventions, we observed that neither treatment promoted significant SPR changes at the superficial soil layer (average 0–0.05 m) (Figure 3). This fact was probably due to the more significant accumulation of organic matter in the first centimeters of the soil, associated with the greater presence of roots [51] and wetting-drying cycles at the soil surface [52]. In the no-till crop system, it is common to increase the SPR values at subsurface soil layers, between 0.07 to 0.20 m depth [31,32,33], as found in this study. Generally, the 0.05 to 0.20 m soil layer presents the most significant compaction problems under no-till [14,53,54]. Compaction reduces soil porosity, increases soil penetration resistance, and prevents roots from exploring deeper soil layers. As a result, it reduces the efficiency of using fertilizers and water, increasing the risk of runoff and erosion; consequently, it increases water pollution, affecting the yield of crops [10]. The increase in SPR in subsurface soil layers occurred for sites without wheel traffic (0 WT) and 14 and 28 WT treatments. However, SPR values increased at 14 and 28 WT, indicating that the traffic of machines affects more pronouncedly the compaction of subsurface layers [54].
Mechanical intervention is considered a strategy to break up compacted soil layers [17,18,19]. Soil chiseling and soil subsoiling were efficient in reducing the SPR in the subsurface when compared to no-till with a fixed shank and to the system without soil mobilization (no-till). Nunes et al. [22] found similar results at the 0.07 to 0.20 m soil layer after soil chiseling, and the SPR was reduced. The SPR is a soil attribute that is relatively easy to measure in the field and provides instantaneous information at the assessment time. Therefore, this rapid assessment allows us to diagnose which layers were most affected by the management. In addition, it is a sensitive indicator of soil compaction [53,55,56,57]. Soil compaction is the primary justification for mechanical intervention in NT. Diagnosing and monitoring soil compaction methods should be improved to assist in decision-making [18]. When soil compaction is verified, the affected soil layer must be identified and analyzed so that the correct type of mechanical intervention can be carried out. This verification in crop production areas must be conducted using field methodologies, such as soil penetration resistance measurements.
The study of the other soil physical attributes was carried out at the 0.05 and 0.15 m soil layers because it shows the influence of the treatments on the SPR. This layer presents intense root growth, and thus, the soil’s physical limitations could affect plant development [58,59].
4.2. Effects of Machinery Traffic on Soil Physical Quality
In general, the traffic intensity did not provide significant differences for the physical attributes studied but significantly changed the PAWC and SPR. Soil moisture conditions and the initial compaction state at the time of machinery operations govern the impact of physical changes during machinery traffic [8]. Castioni et al. [60] verified that soil with a lower initial bulk density is the most susceptible to compaction upon mechanized operations. In this study, the bulk density was similar among the wheel-traffic treatments, suggesting that these values were already high (compacted) enough to limit the additional compaction caused by further machine traffic levels (14 and 28 WT).
However, the traffic increase promoted soil compaction, as evidenced by the SPR. The SPR observed in the 0.05–0.15 m layer was lower when there was no additional traffic and was also sensitive for evaluating different effects between SC and SS in the 0.05 to 0.15 m layer, which was not observed for the other physical attributes, demonstrating the capacity of discrimination for different mechanical interventions of this soil physical attribute. In addition, the traffic increase reduced the soil’s physical quality, evidenced by the physical functions of plant growth and the water flux function due to soil chiseling. This demonstrates that increased machinery traffic may have affected soil porosity and, consequently, the soil water processes and the water supply for plants. Sattolo et al. [9] reported that machinery traffic masked the potential gains of crop diversification on the soil physical quality as the soil compaction induced by a higher frequency of machine operations required the management of a more diverse crop sequence. The compaction causes crop physiological and morphological disturbances, leading to reduced crop yield [15,61].
4.3. Effects of Mechanical Intervention on Soil Physical Quality
The soil chiseling and soil subsoiling provided a reduction in soil bulk density and an increase in total porosity and macroporosity when compared with NT and NT + FS. In addition, the S index indicated a better structural quality. The highest SPQI scores were observed for the soil chiseling and soil subsoiling, suggesting that the soil under this mechanical intervention is physically functioning at 65% of its total capacity. Based on SPQI, the no-till and no-till with fixed shank decrease the performance of soil physical functions to 56% (no-till) and 55% (no-till with fixed shank) of its total capacity. Studies have shown that the use of shanks coupled with the seeder improved the soil physical quality in the row position compared to the inter-row under no-till [34] at surface depths under NT but did not alleviate soil compaction at the 0.10−0.20 m depth [28]. Regarding the soil surface, a more significant amount of organic matter and roots in NT ensures that this layer is not usually compacted. In our research, we evaluated the physical quality of the soil without comparing rows and inter-row; we assessed the most affected layer by machine traffic (0.05–0.15 m), inferring that a 15-cm deep fixed shank cannot mitigate the soil compaction induced by machinery traffic in the seeder. Therefore, it has been proven to be less effective in improving the physical environment of the soil than chiseling and subsoiling tillage operations.
Soil chiseling was similar to the no-till with a fixed shank for bulk density, field-saturated hydraulic conductivity, microporosity, and soil aeration capacity in the 0.05 to 0.15 m soil layer. The seeder equipped with a fixed shank opener demonstrated a small but lower effect than soil subsoiling. Soil subsoiling presented a more significant aeration capacity function, with soil operating at 66% of its capacity and soil chiseling at 60%. Soil disturbance increases the total soil porosity, with a higher effect on macropores responsible for soil aeration. Nunes et al. [33] verified that using a seeder equipped with fixed shank openers up to 0.17 m depth increased soil macroporosity and total porosity and decreased soil bulk density and soil penetration resistance in the layer between 0.07 and 0.17 m. Using shanks coupled with the seeder to reach deeper soil depths under NT [31] could provide an initially localized soil decompaction that favors rapid root development. However, few works evaluate the use of a seeder equipped with fixed shanks in Brazil, evaluating the physical quality of the soil with a physical index compared with soil chiseling and subsoiling. We recommend conducting further research to analyze this information and reach further conclusions.
The highest index (0.88) for plant growth function was found for the soil chiseling in 0 wheel traffic. Cavalcanti et al. [36] also found a score of 0.88 for the plant growth function in areas with mechanical intervention. Mechanical intervention induces immediate benefits, such as changes in pore size distribution and reductions in SPR, favoring plant growth. Reduction in wheel-traffic favors water fluxes (Table 6), and soil chiseling and subsoiling favor this soil function. Mechanical intervention in sugarcane cultivation in the Atlantic Forest biome in northeastern Brazil also provided an increase in the physical functioning of the soil from 67% (area without mechanical intervention) to 72%, with soil tillage with a disk harrow at 0.20 m depth which represents the conventional management [36]. However, the action period of mechanical interventions is questioned. Cherubin et al. [35] verified that the SPQI was sensitive to identifying that soil tillage operations improve soil capacity to perform its physical functions, even though it had short-term effects. In this study, physical attribute evaluations were performed 11 months after soil chiseling and subsoiling, and their effects are still under observation. In their meta-analysis, Peixoto et al. [18] verified that the occasional tillage improved soil physical attributes with persistence, generally greater than 24 months. After a mechanical intervention, the soil may be more susceptible to compaction, as there may be a reduction in soil density and an increase in macroporosity [60]. In this sense, machine-controlled traffic after a mechanical intervention can also be a strategy as well as management aimed at reducing compaction in association with biological chiselings with plants, such as the forage radish (Raphanus sativus) which promotes a significant increase in soil organic carbon storage [62].
We verified that up to 0.15 m, SC significantly reduced the SPR concerning the other treatments, especially when compared to no-till. This practice is even more efficient in mitigating soil compaction when compared to subsoiling in this soil layer. This fact is due to the depth at which the shank of soil chiseling worked, 0.25 m. The shank of SS works up to 0.40 m, with a more significant effect in deeper layers [18]. In deeper layers, significantly below 0.20 m, soil subsoiling resulted in lower SPR values (Figure 3). It is important to emphasize that in the 0.05 to 0.10 m soil layer, soil subsoiling did not change the SPR compared to no-till with fixed shank. These results show that soil subsoiling is a recommended practice to mitigate compaction in deeper layers of soil, with a more negligible effect on the subsurface when compared to soil chiseling. No-till had the highest SPR values, demonstrating that no-till only, without any intervention, results in a greater resistance to root growth [54]. Hence, it is crucial to evaluate the layer with physical restriction and the depth of shank action to choose the most suitable mechanical intervention.
The soil physical quality index (SPQI) and the soil physical functions approach were able to detect changes in treatments and the S index. Some authors observed lower S index values in soils with higher density, indicating a reduction in their physical quality associated with compaction [27]. The S index can be correlated with the degree of soil compaction [63]. Microporosity was not affected by treatments because it is a more stable soil attribute, as micropores are mainly present in soil microaggregates less altered by the action of roots and soil tillage.
4.4. Maize Yield Responses to Soil Compaction and Decompaction
Despite the reduction observed in the PAWC and the increase in the SPR with the increase in traffic levels, which affects the growth of roots, the upper part of a plant (leaf, stem), and the development and yield of crops [64], maize yield was not affected in this study, despite the trend of increasing maize yield with the reduction in traffic levels. Indeed, the adequate amount and distribution of rainfall (Figure 2) observed at all stages of development of the maize crop promoted water availability for the crop and did not limit plant development, especially in its critical stages [8,61]. Thus, even reducing PAWC and increasing SPR, the crop yield was not harmed, as the rains were sufficient to contribute to the water storage, favoring plant water and obtaining nutrients [65,66]. However, in years of low rainfall, a water deficit can probably occur with effects on crop yield in soil with a lower PAWC [67,68].
The mechanical intervention also did not affect maize yield, a result similar to that observed by Nunes et al. [22] who also did not verify significant changes in maize yield after soil chiseling intervention. Ren et al. [69], when evaluating the biomass production of maize crops, also did not find significant differences comparing different intensities of soil tillage (strip tillage and intensive tillage). However, they did observe a tendency towards an increase in maize biomass with strip tillage combined with the cultivation of mustard (Sinapis alba L.) cultivated before maize. Blanco-Canqui and Wortmann [70] report that occasional mechanical intervention in a no-till system does not affect crop yields in 80% of cases evaluated on a global scale. In Brazil, some authors found an increase in maize yield [51], but others did not find positive effects on yield with the mechanical intervention [71]. This difference is because crops have different factors that limit production, and each can respond differently to stresses [15]. Peixoto et al. [18], in their meta-analysis, concluded that occasional tillage did not affect crop yields, although we observed that crop yields increased in regions under water restriction and soils with low water retention capacity and availability. The soil penetration resistance becomes the dominant stress for growing roots under dry conditions [15] because the SPR increases as the soil retains less moisture [72], a condition that was not verified during the maize development (Figure 2). We believe conducting similar studies with information on crop yield in years of hydric restrictions is relevant.
5. Conclusions
Mechanical intervention should be used with the correct diagnosis of soil compaction, and the type of mechanical intervention should be selected according to the soil layer most affected. For example, the coupling of a fixed shank seeder could be used when surface soil layers are affected by compaction. When subsurface layers are most affected, soil chiseling and subsoiling are recommended. The SPR allowed us to diagnose which layers were most affected by the soil management and is a soil attribute that is relatively easy to measure in the field, providing instantaneous information at the assessment time.
In this study, coupling of the fixed shank to a seeder does not improve the soil’s physical quality, and its effect is different from the use of soil chiseling and soil subsoiling operations because additional machine traffic shows the effects of compaction in the subsurface soil layer (0.05 to 0.15 m). Adequate water availability over the maize crop development cycle affected the crop yield response to treatments, with no effect on grain yield. We encourage monitoring the persistence of these benefits on the soil over the subsequent crop seasons and in years with intense water deficit along with the crop cycle.
Author Contributions
Conceptualization, F.P.P., E.G.K., R.K.B., and E.A.A.B.; methodology, F.P.P., E.G.K., R.K.B., E.A.A.B., and M.R.C., software, R.K.B. and A.L.d.P.; validation, N.F.B.G. and E.A.A.B.; formal analysis R.K.B. and A.L.d.P.; investigation, E.A.A.B., M.R.C., and N.F.B.G.; resources, N.F.B.G.; data curation, R.K.B.; writing—original draft preparation, R.K.B., E.A.A.B., and A.L.d.P.; writing—review and editing, R.K.B., E.A.A.B., A.L.d.P., and M.R.C.; visualization, R.K.B. and A.L.d.P.; supervision, N.F.B.G. and E.A.A.B.; project administration, F.P.P.; and funding acquisition, F.P.P., N.F.B.G. and E.A.A.B. All authors have read and agreed to the published version of the manuscript.
Funding
This study was financed in part by the Coordenação de Aperfeiçoamento de Pessoal de Nível Superior—Brazil (CAPES)—Finance Code 001.
Data Availability Statement
Not applicable.
Acknowledgments
The authors would like to thank the ABC Foundation for the great interest and concession of their area, for allowing this work could be carried out, and to its employees for their assistance with field operation. We also thank the Academic Writing Center (Centro de Escrita Acadêmica/CEA—https://www2.uepg.br/escrita-academica/ (accessed on 10 September 2022)) of the State University of Ponta Grossa (Universidade Estadual de Ponta Grossa/UEPG) for assistance with English language proofreading and developmental editing.
Conflicts of Interest
The authors declare no conflict of interest.
References
- Fuentes-Llanillo, R.; Telles, T.S.; Junior, D.S.; de Melo, T.R.; Friedrich, T.; Kassam, A. Expansion of no-tillage practice in conservation agriculture in Brazil. Soil Tillage Res. 2021, 208, 104877. [Google Scholar] [CrossRef]
- Kassam, A.; Friedrich, T.; Derpsch, R. Global spread of conservation agriculture. Int. J. Environ. Stud. 2019, 76, 29–51. [Google Scholar] [CrossRef]
- Schick, J.; Bertol, I.; Barbosa, F.T.; Miquelluti, D.J.; Cogo, N.P. Water erosion in a long-term soil management experiment with a Humic Cambisol. Rev. Bras. Ciência Solo 2017, 41, 1–13. [Google Scholar] [CrossRef]
- Merten, G.H.; Araújo, A.G.; Biscaia, R.C.M.; Barbosa, G.M.C.; Conte, O. No-till surface runoff and soil losses in southern Brazil. Soil Tillage Res. 2015, 152, 85–93. [Google Scholar] [CrossRef]
- Nicoloso, R.S.; Rice, C.W. Intensification of no-till agricultural systems: An opportunity for carbon sequestration. Soil Sci. Soc. Am. J. 2021, 85, 1395–1409. [Google Scholar] [CrossRef]
- Li, Y.; Song, D.; Liang, S.; Dang, P.; Qin, X.; Liao, Y.; Siddique, K.H.M. Effect of no-tillage on soil bacterial and fungal community diversity: A meta-analysis. Soil Tillage Res. 2020, 204, 104721. [Google Scholar] [CrossRef]
- Keller, T.; Sandin, M.; Colombi, T.; Horn, R.; Or, D. Historical increase in agricultural machinery weights enhanced soil stress levels and adversely affected soil functioning. Soil Tillage Res. 2019, 194, 104293. [Google Scholar] [CrossRef]
- Shah, A.N.; Tanveer, M.; Shahzad, B.; Yang, G.; Fahad, S.; Ali, S.; Bukhari, M.A.; Tung, S.A.; Hafeez, A.; Souliyanonh, B. Soil compaction effects on soil health and crop productivity: An overview. Environ. Sci. Pollut. Res. 2017, 24, 10056–10067. [Google Scholar] [CrossRef]
- Sattolo, T.M.S.; Pereira, L.M.; Otto, R.; Francisco, E.; Duarte, A.P.; Kappes, C.; Prochnow, L.I.; Cherubin, M.R. Effects of land use, tillage management, and crop diversification on soil physical quality in Cerrado agricultural systems. Soil Sci. Soc. Am. J. 2021, 85, 1799–1813. [Google Scholar] [CrossRef]
- Bluett, C.; Tullberg, J.N.; McPhee, J.E.; Antille, D.L. Soil and Tillage Research: Why still focus on soil compaction? Soil Tillage Res. 2019, 194, 104282. [Google Scholar] [CrossRef]
- Lima, R.P.; Silva, A.P.; Giarola, N.F.B.; Silva, A.R.; Rolim, M.M.; Keller, T. Impact of initial bulk density and matric suction on compressive properties of two Oxisols under no-till. Soil Tillage Res. 2018, 175, 168–177. [Google Scholar] [CrossRef]
- Lima, R.P.; Keller, T.; Giarola, N.F.B.; Tormena, C.A.; Silva, A.R.; Rolim, M.M. Measurements and simulations of compaction effects on the least limiting water range of a no-till Oxisol. Soil Res. 2019, 58, 62–72. [Google Scholar] [CrossRef]
- Tormena, C.A.; Araújo, M.A.; Fidalski, J.; Imhoff, S.; Silva, A.P. Quantificação da resistência tênsil e da friabilidade de um Latossolo Vermelho distroférrico sob plantio direto. Rev. Bras. Ciência Solo 2008, 32, 943–952. [Google Scholar] [CrossRef]
- Cavalieri, K.M.V.; Silva, A.P.; Tormena, C.A.; Leão, T.P.; Dexter, A.R.; Håkansson, I. Long-term effects of no-tillage on dynamic soil physical properties in a Rhodic Ferrasol in Paraná, Brazil. Soil Tillage Res. 2009, 103, 158–164. [Google Scholar] [CrossRef]
- Colombi, T.; Keller, T. Developing strategies to recover crop productivity after soil compaction—A plant eco-physiological perspective. Soil Tillage Res. 2019, 191, 156–161. [Google Scholar] [CrossRef]
- Pott, L.P.; Amado, T.J.C.; Leal, O.A.; Ciampitti, I.A. Mitigation of soil compaction for boosting crop productivity at varying yield environments in southern Brazil. Eur. J. Soil Sci. 2019, 71, 1157–1172. [Google Scholar] [CrossRef]
- Fernández-Ugalde, O.; Virto, I.; Bescansa, P.; Imaz, M.J.; Enrique, A.; Karlen, D.L. No-tillage improvement of soil physical quality in calcareous, degradation-prone, semiarid soils. Soil Tillage Res. 2009, 106, 29–35. [Google Scholar] [CrossRef]
- Peixoto, D.S.; da Silva, L.D.C.M.; de Melo, L.B.B.; Azevedo, R.P.; Araújo, B.C.L.; de Carvalho, T.S.; Moreira, S.G.; Curi, N.; Silva, B.M. Occasional tillage in no-tillage systems: A global meta-analysis. Sci. Total Environ. 2020, 745, 140887. [Google Scholar] [CrossRef]
- Peixoto, D.S.; Silva, B.M.; Godinho Silva, S.H.; Karlen, D.L.; Moreira, S.G.; Pereira da Silva, A.A.; Resende, Á.V.; Norton, L.D.; Curi, N. Diagnosing, Ameliorating, and Monitoring Soil Compaction in No Till Brazilian Soils. Agrosystems Geosci. Environ. 2019, 2, 1–14. [Google Scholar] [CrossRef]
- Tavares-Filho, J.; Fonseca, I.C.B.; Ribon, A.A.; Barbosa, G.M.C. Efeito da escarificação na condutividade hidráulica saturada de um Latossolo Vermelho sob plantio direto. Cienc. Rural 2006, 36, 996–999. [Google Scholar] [CrossRef][Green Version]
- Vieira, M.L.; Klein, V.A. Propriedades físico-hídricas de um Latossolo Vermelho submetido a diferentes sistemas de manejo. Rev. Bras. Ciênc. Solo 2007, 31, 1271–1280. [Google Scholar] [CrossRef]
- Nunes, M.R.; Pauletto, E.A.; Denardin, J.E.; Faganello, A.; Pinto, L.F.S.; Scheunemann, T. Persistência dos efeitos da escarificação sobre a compactação de Nitossolo sob plantio direto em região subtropical úmida. Pesqui. Agropecu. Bras. 2014, 49, 531–539. [Google Scholar] [CrossRef]
- Silva, S.G.C.; Silva, Á.P.D.; Giarola, N.F.B.; Tormena, C.A.; Sá, J.C.D.M. Temporary effect of chiseling on the compaction of a Rhodic Hapludox under no-tillage. Rev. Bras. Ciênc. Solo 2012, 36, 547–555. [Google Scholar] [CrossRef]
- Vizioli, B.; Cavalieri-Polizeli, K.M.V.; Tormena, C.A.; Barth, G. Effects of long-term tillage systems on soil physical quality and crop yield in a Brazilian Ferralsol. Soil Tillage Res. 2021, 209, 104935. [Google Scholar] [CrossRef]
- Mahl, D.; Furlani, C.E.A.; Gamero, C.A. Efficiency of pneumatic and horizontal perforated disk meter mechanism in corn no-tillage seeders in soil with different mobilizations reports. Eng. Agric. 2008, 28, 535–542. [Google Scholar] [CrossRef]
- Brandelero, E.M.; Araujo, A.G.; Ralisch, R. Mobilização do solo e profundidade de semeadura por diferentes mecanismos para o manejo do sulco de semeadura em uma semeadora direta. Eng. Agric. 2014, 34, 263–272. [Google Scholar] [CrossRef]
- Tormena, C.A.; Silva, Á.P.; Imhoff, S.D.C.; Dexter, A.R. Quantification of the soil physical quality of a tropical Oxisol using the s index. Sci. Agric. 2008, 65, 56–60. [Google Scholar] [CrossRef]
- Moreira, W.H.; Tormena, C.A.; Lima, R.P.; Anghinoni, G.; Imhoff, S. The influence of sowing furrow opening and wetting and drying cycles on soil physical quality under no-tillage in Southern Brazil. Soil Tillage Res. 2020, 204, 104711. [Google Scholar] [CrossRef]
- Ferreira, C.J.B.; Tormena, C.A.; Moreira, W.H.; Zotarelli, L.; Betioli Junior, E.; Anghinoni, G. Sampling position under no-tillage system affects the results of soil physical properties. Rev. Bras. Ciênc. Solo 2016, 40, 1–12. [Google Scholar] [CrossRef]
- Anghinoni, G.; Tormena, C.A.; Lal, R.; Moreira, W.H.; Júnior, E.B.; Ferreira, C.J.B. Within cropping season changes in soil physical properties under no-till in Southern Brazil. Soil Tillage Res. 2017, 166, 108–112. [Google Scholar] [CrossRef]
- Nunes, M.R.; Denardin, J.E.; Faganello, A.; Pauletto, E.A.; Pinto, L.F.S. Efeito de semeadora com haste sulcadora para ação profunda em solo manejado com plantio direto. Rev. Bras. Cienc. Solo 2014, 38, 627–638. [Google Scholar] [CrossRef]
- Santos, A.P.; Volpato, C.E.S.; Tourino, M.C.C. Desempenho de três semeadoras-adubadoras de plantio direto para a cultura do milho. Ciênc. Agrotecnol. 2008, 32, 540–546. [Google Scholar] [CrossRef]
- Nunes, M.R.; Denardin, J.E.; Pauletto, E.A.; Faganello, A.; Pinto, L.F.S. Mitigation of clayey soil compaction managed under no-tillage. Soil Tillage Res. 2015, 148, 119–126. [Google Scholar] [CrossRef]
- Blum, J.; Giarola, N.F.B.; Silva, Á.P.; Guedes Filho, O.; Silva, S.G.C.; Eberhardt, D.N.; Araújo, S.R. Assessment of soil physical attributes at sowing row and inter-row under no-till system. Rev. Cienc. Agron. 2014, 45, 888–895. [Google Scholar] [CrossRef]
- Cherubin, M.R.; Karlen, D.L.; Franco, A.L.C.; Tormena, C.A.; Cerri, C.E.P.; Davies, C.A.; Cerri, C.C. Soil physical quality response to sugarcane expansion in Brazil. Geoderma 2016, 267, 156–168. [Google Scholar] [CrossRef]
- Cavalcanti, R.Q.; Rolim, M.M.; Lima, R.P.; Tavares, U.E.; Pedrosa, E.M.R.; Cherubin, M.R. Soil physical changes induced by sugarcane cultivation in the Atlantic Forest biome, northeastern Brazil. Geoderma 2020, 370, 114353. [Google Scholar] [CrossRef]
- Santos, R.S.; Wiesmeier, M.; Cherubin, M.R.; Oliveira, D.M.S.; Locatelli, J.L.; Holzschuh, M.; Cerri, C.E.P. Consequences of land-use change in Brazil’s new agricultural frontier: A soil physical health assessment. Geoderma 2021, 400, 115149. [Google Scholar] [CrossRef]
- Alvares, C.A.; Stape, J.L.; Sentelhas, P.C.; Gonçalves, J.L.M.; Sparovek, G. Köppen’s climate classification map for Brazil. Meteorol. Z. 2013, 22, 711–728. [Google Scholar] [CrossRef]
- Soil Survey Staff. Keys to Soil Taxonomy, 12th ed.; USDA-Natural Resources Conservation Service: Washington, DC, USA, 2014. [Google Scholar]
- Bagarello, V.; Iovino, M.; Elrick, D. A simplified falling-head technique for rapid determination of field-saturated hydraulic conductivity. Soil Sci. Soc. Am. J. 2004, 68, 66–73. [Google Scholar] [CrossRef]
- Elrick, D.E.; Reynolds, W.D. Methods for analyzing constant-head well permeameter data. Soil Sci. Plant Nutr. 1992, 56, 320–323. [Google Scholar] [CrossRef]
- Campbell, G.S. Determining the -15 Bar (Permanent Wilt) Water Content of Soils with the WP4. Decagon Devices Application Note. 2006. Available online: http://ictinternational.com/content/uploads/2015/02/Determining-15Bar-PermanentWilt-WaterContentofSoilswiththeWP4.pdf (accessed on 10 September 2022).
- Van Genuchten, M.T. A Closed-form Equation for Predicting the Hydraulic Conductivity of Unsaturated Soils. Soil Sci. Soc. Am. J. 1980, 44, 892–898. [Google Scholar] [CrossRef]
- Dexter, A. Soil physical quality: Part I. Theory, effects of soil texture, density, and organic matter, and effects on root growth. Geoderma 2004, 120, 201–214. [Google Scholar] [CrossRef]
- Teixeira, P.C.; Donagemma, G.K.; Fontana, A.; Teixeira, W.G. Manual de Métodos de Análise de Solo, 3rd ed.; Embrapa Solos: Brasília, DF, Brazil, 2017. [Google Scholar]
- Reynolds, W.D.; Bowman, B.T.; Drury, C.F.; Tan, C.S.; Lu, X. Indicators of good soil physical quality: Density and storage parameters. Geoderma 2002, 110, 131–146. [Google Scholar] [CrossRef]
- Lima, R.P.; Silva, A.R.; Silva, A.P.; Leão, T.P.; Mosaddeghi, M.R. Soilphysics: An R package for calculating soil water availability to plants by different soil physical indices. Comput. Electron. Agric. 2016, 120, 63–71. [Google Scholar] [CrossRef]
- R Core Team. R: A Language and Environment for Statistical Computing; R Core Team: Vienna, Austria, 2020. [Google Scholar]
- Bagarello, V.; Sgroi, A. Using the simplified falling head technique to detect temporal changes in field-saturated hydraulic conductivity at the surface of a sandy loam soil. Soil Tillage Res. 2007, 94, 283–294. [Google Scholar] [CrossRef]
- Secretaria de Agricultura e Abastecimento do Estado do Paraná. Dep. Econ. Rural—DERAL/Div. Estatísticas Básicas-DEB. Available online: http://www.agricultura.pr.gov.br/deral/safras (accessed on 20 September 2020).
- Peixoto, D.S.; Silva, B.M.; Oliveira, G.C.; Moreira, S.G.; Silva, F.; Curi, N. A soil compaction diagnosis method for occasional tillage recommendation under continuous no tillage system in Brazil. Soil Tillage Res. 2019, 194, 104307. [Google Scholar] [CrossRef]
- Park, E.J.; Smucker, A.J.M. Saturated Hydraulic Conductivity and Porosity within Macroaggregates Modified by Tillage. Soil Sci. Soc. Am. J. 2005, 69, 38–45. [Google Scholar] [CrossRef]
- Vazquez, L.; Myhre, D.L.; Hanlon, E.A.; Gallaher, R.N. Soil penetrometer resistance and bulk density relationships after long-term no tillage. Commun. Soil Sci. Plant Anal. 1991, 22, 2101–2117. [Google Scholar] [CrossRef]
- Moraes, M.T.; Debiasi, H.; Franchini, J.C.; Mastroberti, A.A.; Levien, R.; Leitner, D.; Schnepf, A. Soil compaction impacts soybean root growth in an Oxisol from subtropical Brazil. Soil Tillage Res. 2020, 200, 104611. [Google Scholar] [CrossRef]
- Batey, T.; McKenzie, D.C. Soil compaction: Identification directly in the field. Soil Use Manag. 2006, 22, 123–131. [Google Scholar] [CrossRef]
- Genro Junior, S.A.; Reinert, D.J.; Reichert, J.M. Variabilidade temporal da resistência à penetração de um latossolo argiloso sob semeadura direta com rotação de culturas. Rev. Bras. Ciênc. Solo 2004, 28, 477–484. [Google Scholar] [CrossRef]
- Silva, S.R.; Barros, N.F.; Costa, L.M. Atributos físicos de dois Latossolos afetados pela compactação do solo. Rev. Bras. Eng. Agric. Ambient. 2006, 10, 842–847. [Google Scholar] [CrossRef]
- Bécel, C.; Vercambre, G.; Pagès, L. Soil penetration resistance, a suitable soil property to account for variations in root elongation and branching. Plant Soil 2012, 353, 169–180. [Google Scholar] [CrossRef]
- Nosalewicz, A.; Lipiec, J. The effect of compacted soil layers on vertical root distribution and water uptake by wheat. Plant Soil 2014, 375, 229–240. [Google Scholar] [CrossRef]
- Castioni, G.A.; de Lima, R.P.; Cherubin, M.R.; Bordonal, R.O.; Rolim, M.M.; Carvalho, J.L. Machinery traffic in sugarcane straw removal operation: Stress transmitted and soil compaction. Soil Tillage Res. 2021, 213, 105122. [Google Scholar] [CrossRef]
- Sadras, V.O.; O’Leary, G.J.; Roget, D.K. Crop responses to compacted soil: Capture and efficiency in the use of water and radiation. Field Crop. Res. 2005, 91, 131–148. [Google Scholar] [CrossRef]
- Inagaki, T.M.; Sá, J.C.M.; Tormena, C.A.; Dranski, A.; Muchalak, A.; Briedis, C.; Ferreira, A.O.; Giarola, N.F.B.; da Silva, Á.P. Mechanical and biological chiseling impacts on soil organic C stocks, root growth, and crop yield in a long-term no-till system. Soil Tillage Res. 2021, 211, 104993. [Google Scholar] [CrossRef]
- Naderi-Boldaji, M.; Keller, T. Degree of soil compactness is highly correlated with the soil physical quality index S. Soil Tillage Res. 2016, 159, 41–46. [Google Scholar] [CrossRef]
- Sivarajan, S.; Maharlooei, M.; Bajwa, S.G.; Nowatzki, J. Impact of soil compaction due to wheel traffic on corn and soybean growth, development and yield. Soil Tillage Res. 2018, 175, 234–243. [Google Scholar] [CrossRef]
- Akinci, I.; Cakir, E.; Topakci, M.; Canakci, M.; Inan, O. The effect of subsoiling on soil resistance and cotton yield. Soil Tillage Res. 2004, 77, 203–210. [Google Scholar] [CrossRef]
- Galambošová, J.; Macák, M.; Rataj, V.; Antille, D.L.; Godwin, R.J.; Chamen, W.C.T.; Žitňák, M.; Vitázková, B.; Ďuďák, J.; Chlpík, J. Field Evaluation of Controlled Traffic Farming in Central Europe Using Commercially Available Machinery. Am. Soc. Agric. Biol. Eng. 2017, 60, 657–669. [Google Scholar] [CrossRef]
- Arshad, M.A.; Franzluebbers, A.J.; Azooz, R.H. Components of surface soil structure under conventional and no-tillage in northwestern Canada. Soil Tillage Res. 1999, 53, 41–47. [Google Scholar] [CrossRef]
- Edreira, J.I.R.; Guilpart, N.; Sadras, V.; Cassman, K.G.; van Ittersum, M.K.; Schils, R.L.M.; Grassini, P. Water productivity of rainfed maize and wheat: A local to global perspective. Agric. For. Meteorol. 2018, 259, 364–373. [Google Scholar] [CrossRef]
- Ren, L.; Nest, T.V.; Ruysschaert, G.; D’Hose, T.; Cornelis, W.M. Short-term effects of cover crops and tillage methods on soil physical properties and maize growth in a sandy loam soil. Soil Tillage Res. 2019, 192, 76–86. [Google Scholar] [CrossRef]
- Blanco-Canqui, H.; Wortmann, C.S. Does occasional tillage undo the ecosystem services gained with no-till? A review. Soil Tillage Res. 2020, 198, 104534. [Google Scholar] [CrossRef]
- Fidalski, J.; Yagi, R.; Tormena, C.A. Revolvimento ocasional e calagem em latossolo muito argiloso em sistema plantio direto consolidado. Rev. Bras. Ciênc. Solo 2015, 39, 1483–1489. [Google Scholar] [CrossRef]
- Blainski, É.; Tormena, C.; Fidalski, J.; Guimarães, R.M.L. Quantificação da degradação física do solo por meio da curva de resistência do solo à penetração. Rev. Bras. Ciênc. Solo 2008, 32, 975–983. [Google Scholar] [CrossRef]


Publisher’s Note: MDPI stays neutral with regard to jurisdictional claims in published maps and institutional affiliations. |
© 2022 by the authors. Licensee MDPI, Basel, Switzerland. This article is an open access article distributed under the terms and conditions of the Creative Commons Attribution (CC BY) license (https://creativecommons.org/licenses/by/4.0/).