Article

Variation Characteristics of Glucosinolate Contents in Leaf Mustard (Brassica juncea)

1
College of Horticulture, Hunan Agricultural University, Changsha 410128, China
2
Engineering Research Center for Horticultural Crop Germplasm Creation and New Variety Breeding, Ministry of Education, Changsha 410218, China
3
Key Laboratory for Vegetable Biology of Hunan Province, Changsha 410128, China
*
Authors to whom correspondence should be addressed.
Agronomy 2022, 12(10), 2287; https://doi.org/10.3390/agronomy12102287
Submission received: 5 September 2022 / Revised: 15 September 2022 / Accepted: 21 September 2022 / Published: 23 September 2022
(This article belongs to the Special Issue Breeding Innovations in Crop for Resilient Cropping Systems)

Abstract

:
Mustard, which belongs to the family Brassicaceae, is an annual or biennial herb and is considered as one of the most important native vegetables in China. Glucosinolates are important secondary metabolites containing sulfur and nitrogen in plants, which form a network with other metabolic pathways that play important roles in plant growth, development, and interaction with the environment. We studied varied phenotypic and glucosinolate contents of 60 mustard resources collected from various areas of China. The results showed both agronomic traits and glucosinolates varied greatly among mustard resources. We detected nine glucosinolates in mustard resources and the contents of total glucosinolates ranged from 1.2023 to 30.7310 μmol/g. Through the correlation analysis, we preliminarily found a significant negative correlation between leaf color and glucosinolate contents but needed further validation. For mustard resource JC 18-56, we analyzed the glucosinolate contents in different organs of different growth stages. The results indicated a significant difference among organs in both glucosinolates concentration and composition. The contents of glucosinolatess in alabastrums at bolting stage were highest, up to 140.1257 μmol/g dry weight (DW). We found that the main glucosinolates in roots were 4-methoxyglucobrassicin, while in other organs the glucosinolates were sinigrin. The contents of glucosinolatess in different organs of mustard were as follows: alabastrums > seeds > flowers > siliques > leaves > flower stems > stems > roots. This study provides important references for the selection and cultivation of high-quality mustard varieties.

1. Introduction

Mustard (Brassica juncea) is a major crop in both ancient and modern worlds. It is mainly used as an oilseed, but is also used as a vegetable, spice, and medicine. The history of mustard utilization and domestication can be traced back to 6000~7000 years ago [1]. China owns the world’s richest resources of mustard, with more than 1000 varieties spread over the country [2]. Significant genetic and phenotypic variations exist in mustard, especially in relation to seeds, leaves, stems and roots, leading to the evolution of oilseed mustard (B. juncea var. oleifera), leaf mustard (B. juncea var. multiceps), stem mustard (B. juncea var. tsatsai), stalk mustard (B. juncea var. utilis), root mustard (B. juncea var. megarrhiza) and seed mustard (B. juncea var. gracilis) throughout its long history of domestication [1,3]. Previous studies showed that mustard had superior tolerance to adverse environments such as drought, high temperature and low fertility, suggesting that it might be better adapted to harsh environments [1].
Glucosinolates are distinctive secondary metabolites of Brassicaceae family, also a class of plant compounds that regulate plant-insect interactions [4,5]. Based on their amino acid precursors, glucosinolates are divided into three main groups: aliphatic (derived from Ile, Val, Ala, Leu and Met), indole (derived from Trp), and aromatic (derived from Tyr or Phe) glucosinolates. The biosynthesis of glucosinolates follows three independent steps: side-chain elongation (n = 1–6) of selected precursor amino acid; formation of the core glucosinolates structure; and secondary modifications of the side chain of core glucosinolates [5]. Glucosinolates, once known as mustard oil glucosides, influence the distinctive flavour and aroma of cruciferous vegetables, are involved in plant defence and growth, auxin homeostasis and have long been a part of human life and agriculture [6,7,8]. However, from an agricultural and healthy perspective, glucosinolates can also be harmful. For example, large levels of aliphatic glucosinolates in seeds, such as progoitrin, have been shown to be anti-nutritive, which can lower the quality of Brassica crops’ protein-rich seed meal [9,10,11]. Glucosinolates are linked to the pungency and flavor of various crucifer plants. Also, the glucosinolates and their hydrolysis products are the sources of the pungent or pungent flavour of condiments (horseradish or mustard) and of the characteristic flavour of those plants whose leaves (cabbage, Brussels sprouts), buds (cauliflower, broccoli), stems (kohlrabi) or roots (turnip, radish) are consumed by humans [12,13]. For example, sinigrin, the primary aliphatic glucosinolate in several Brassica crops, gives the edible portions and seed oils their distinctive pungent flavor [11,14].
Glucosinolates are found in members of the cruciferous family, including broccoli, cabbage and mustard. They’re also found in sixteen other plant families [8,15]. Different plant species have been found to have varying amounts of glucosinolates. In the young leaves of 82 different kinds of B. rapa, fourteen different glucosinolates have been found [16]. Twelve glucosinolates were detected in B.napus whereas sixteen different glucosinolates were reported from 116 accessions of turnip greens [17]. Additionally, about eleven distinct glucosinolates are found in B. juncea, with aliphatic glucosinolates accounting for more than 90% of the total [18].
Mustard is widely cultivated in China and is an important characteristic processed vegetable in Hunan Province. The flavor formation of mustard is closely related to the types and contents of glucosinolates. In our study, sixty leafy mustard resources were used to explore the difference of phenotype and glucosinolates content. In order to preliminarily explore the physiological and biochemical mechanism of glucosinolates’ synthesis and transport in mustard, the resource JC 18-56, which is one of the most famous processed vegetables in China, is used to determine the difference of glucosinolates in different development stages and organs. This study has important reference significance for the selection and cultivation of high-quality mustard varieties.

2. Materials and Methods

2.1. Plant Materials

A total of sixty leafy mustard resources were collected from different areas of China, including Beijing, Hunan, Fujian and Guangxi (Table 1). Seeds were planted in 50-well trays, and when they grew to four leaves, they were transplanted to glass greenhouse of Hunan Agricultural University with a spacing of 45 × 45 cm between plants and rows. During the growth process, morphological indexes of each resource were measured, including 18 qualitative traits and 12 quantitative traits. The leaves of each resource were sampled when the plants reached harvest stage. At the same time, the mustard resource JC 18-56 was used as the experimental material. The samples were collected, including different organs of the whole seedlings, roots, stems, leaves, flower stems, alabastrums, flowers, flower stems, siliques, and seeds from different stages in its life cycle (Table 2). All samples were collected in triplicate of biological replicates. After that, the samples were freeze-dried after flash freezing in liquid nitrogen, then ground them into powder and stored in −20 °C refrigerator until tested.

2.2. Morphological and Phenotypic Characterization

According to the Chinese national standards ‘Specification for description of Mustard Germplasm Resources for Leaves and Mosses (Seeds)’ (Table 3), we systemically characterized the morphological and phenotypic traits of all sixty leafy mustard germplasms. The indicators included eighteen qualitative traits (cotyledon and hypocotyl color, blade profile, phylliform, leaf apical shape, leaf margin tooth, leaf cleft, leaf surface, leaf luster, plant shape, leaf color, leaf wax powder, leaf bristles, petiole color, petiole cross section shape, leaf nodules, moss drawing, flower stem color) and twelve quantitative traits (cotyledon length and width, groove depth, plant height and width, rosette number, leaf length and width, petiole width, main moss height and thick, moss per plant). All traits were observed or measured in an individual plant of each resource.

2.3. Extraction of Glucosinolates

The extraction and detection methods of the glucosinolates were based on Mao’s [19] method with minor modifications. We extracted glucosinolates of mustard by external standard method.
Standard curve making: The concentration of sinigrin was diluted by gradient to prepare 0.0625 μmol/mL, 0.125 μmol/mL, 0.25 μmol/mL, 0.5 μmol/mL, 1 μmol/mL standard solution, 50 μL of each concentration were used for extraction and detected by HPLC. The retention times were qualitative, the peak areas were quantitative, and the standard curve was drawn (Figure 1).
Glucosinolates extracting: approximately 0.2 g dried mustard samples were weighed for glucosinolate extraction. The samples were extracted by 70% (v/v) methanol (4 mL), extracted for 20 min in a water bath at 75 °C (with intermittent mixing) and then removed to cool. Next adding 2 mL barium acetate solution (0.4 mol/L). After centrifugation for 10 min at 4000× g r/min, the supernatants were severally collected into a new 15 mL centrifugal tube. Then adding 3 mL of 70% methanol (v/v) to the remaining precipitate, mixing well. The samples were extracted in a water bath at 75 °C for 15 min (with intermittent mixing) and then removed to cool. After adding 0.5 mL of barium acetate (0.4 mol/L), the samples were centrifuged at 4000× g r/min for 10 min. Similarly, the supernatants were absorbed into the previous centrifuge tube, and the extracts were finally added to 10 mL with 70% methanol (v/v). The extracts were placed on ice until filtered. Separation of total glucosinolates was accomplished by adsorption on DEAE Sephadex A25 ion exchange resin. About 9 mL extracts of each sample were added to DEAE Sephadex A25 column to filtrate, respectively. Then 1 mL sodium acetate solutions (0.02 mol/L) and 900 μL of sulfatases (0.5 mg/mL) were added to the column successively. After the liquids run out, the columns were sealed with sealing films, and incubated at 37 °C for 16 h. The glucosinolates were eluted with 2 mL ultrapure water and filtered by 0.22 μm membrane for HPLC analysis.

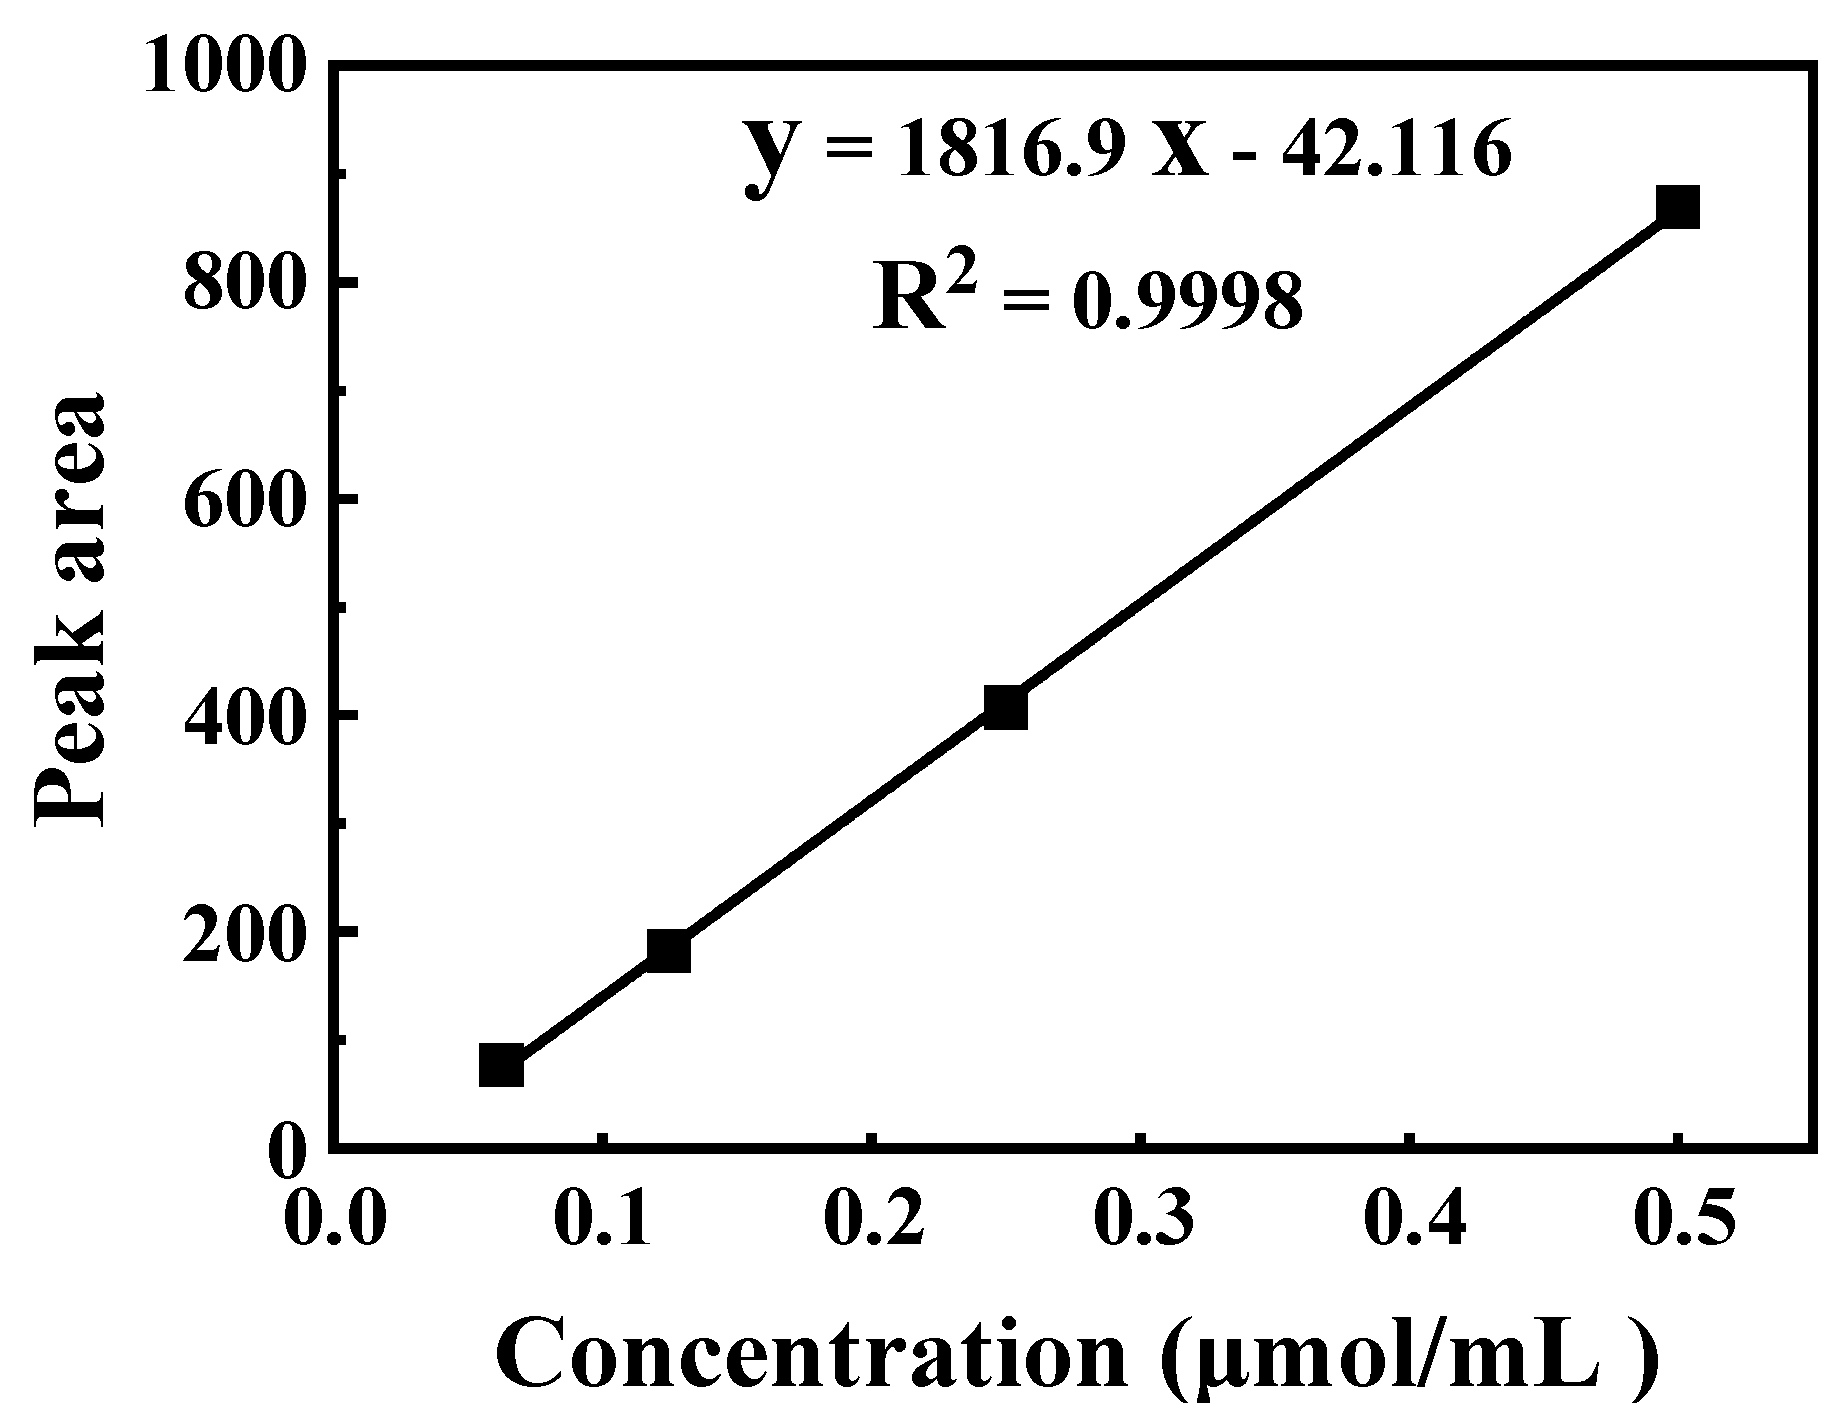
2.4. Quantification of Glucosinolate by HPLC

HPLC was performed on XAqua C18 column (100 mm × 2.1 mm, Waters, MA, USA) with the column temperature of 30 °C. The UV detector wavelength was set at 229 nm and the sample injection volume was 40 μL. The mobile phases consisted of deionized water (A) and chromatographic methanol (B) at the flow rate of 1 mL/min. The compositions and content of the glucosinolates were determined according to retention times and peak areas.

2.5. Statistical Analysis

All data were processed by Microsoft Excel 2020. Figures were conducted by Origin 2021 software (OriginLab Corporation, Venice, FL, USA). The phenotypic character data were analysed by determining the mean, minimum (min), maximum (max), range (R), standard deviation (S.D.), average deviation (A.D.) and coefficient of variation (CV%). Cluster analysis was performed by different Euclidean distances. The relationships among traits and glucosinolate contents were determined by Pearson’s correlation analysis at p < 0.05 and p < 0.01, using SPSS statistical software (version 22 for Windows, SPPS Inc., Chicago, IL, USA).

3. Results

3.1. Morphological and Phenotypic Characterization of 60 Mustard Resources

Among all the quantitative traits in 60 mustard resources were analyzed (Table 4), the CV values ranged from 11.24% to 43.45%, with an average of 25.74%. The plant height contributed the highest variation coefficient (43.45%), suggesting that the presence or absence of plant height is a crucial feature for specific mustard resources, which was also confirmed by cluster analysis, followed by petiole width (40.41%), rosette number (39.80%), moss per plant (37.20%). Besides, the cotyledon length and width contributed the lowest variation coefficient (11.24~12.02%), which were little variation between individuals.
The analysis of qualitative traits (Table 5) in 60 mustard resources showed that the CV values ranged from 13.78% to 193.33%, with an average of 56.79%. The variation indexes of leaf tumor (193.33%), leaf bristles (180.00%) and leaf luster (136.67%) were all greater than 1, showing very strong variation among populations, and the blade profile (13.78%), leaf shape (15.76%) contributed the lowest variation coefficient.

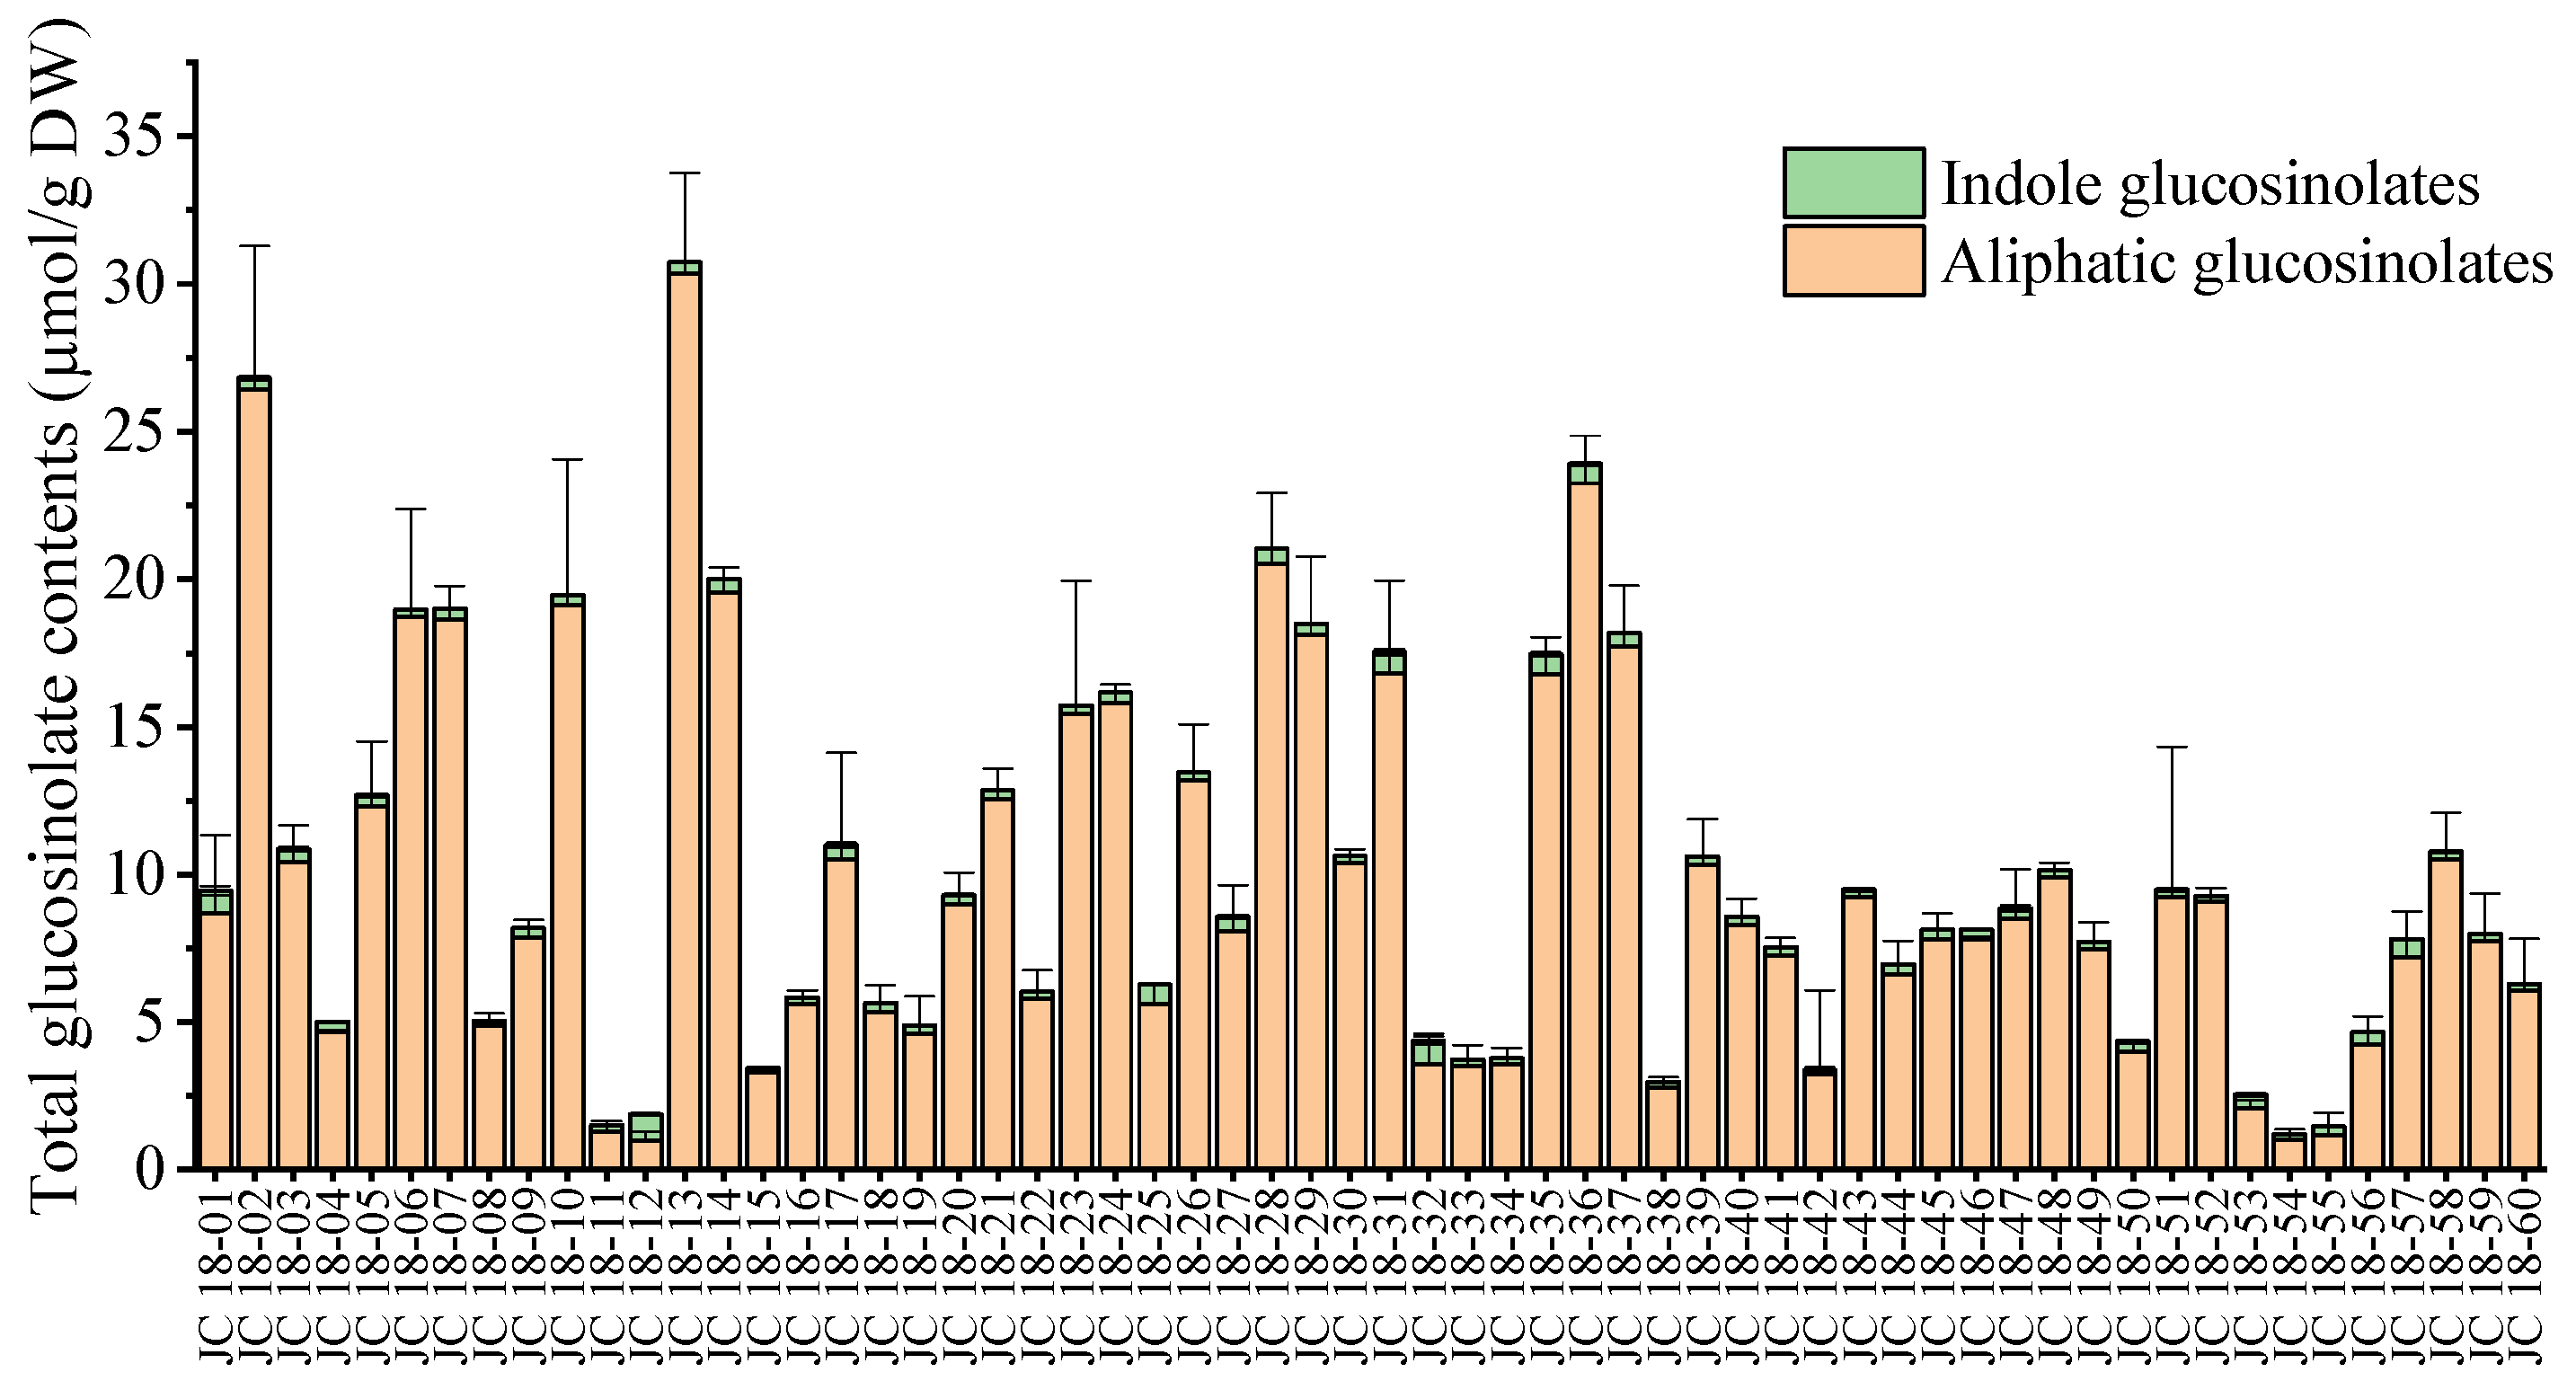
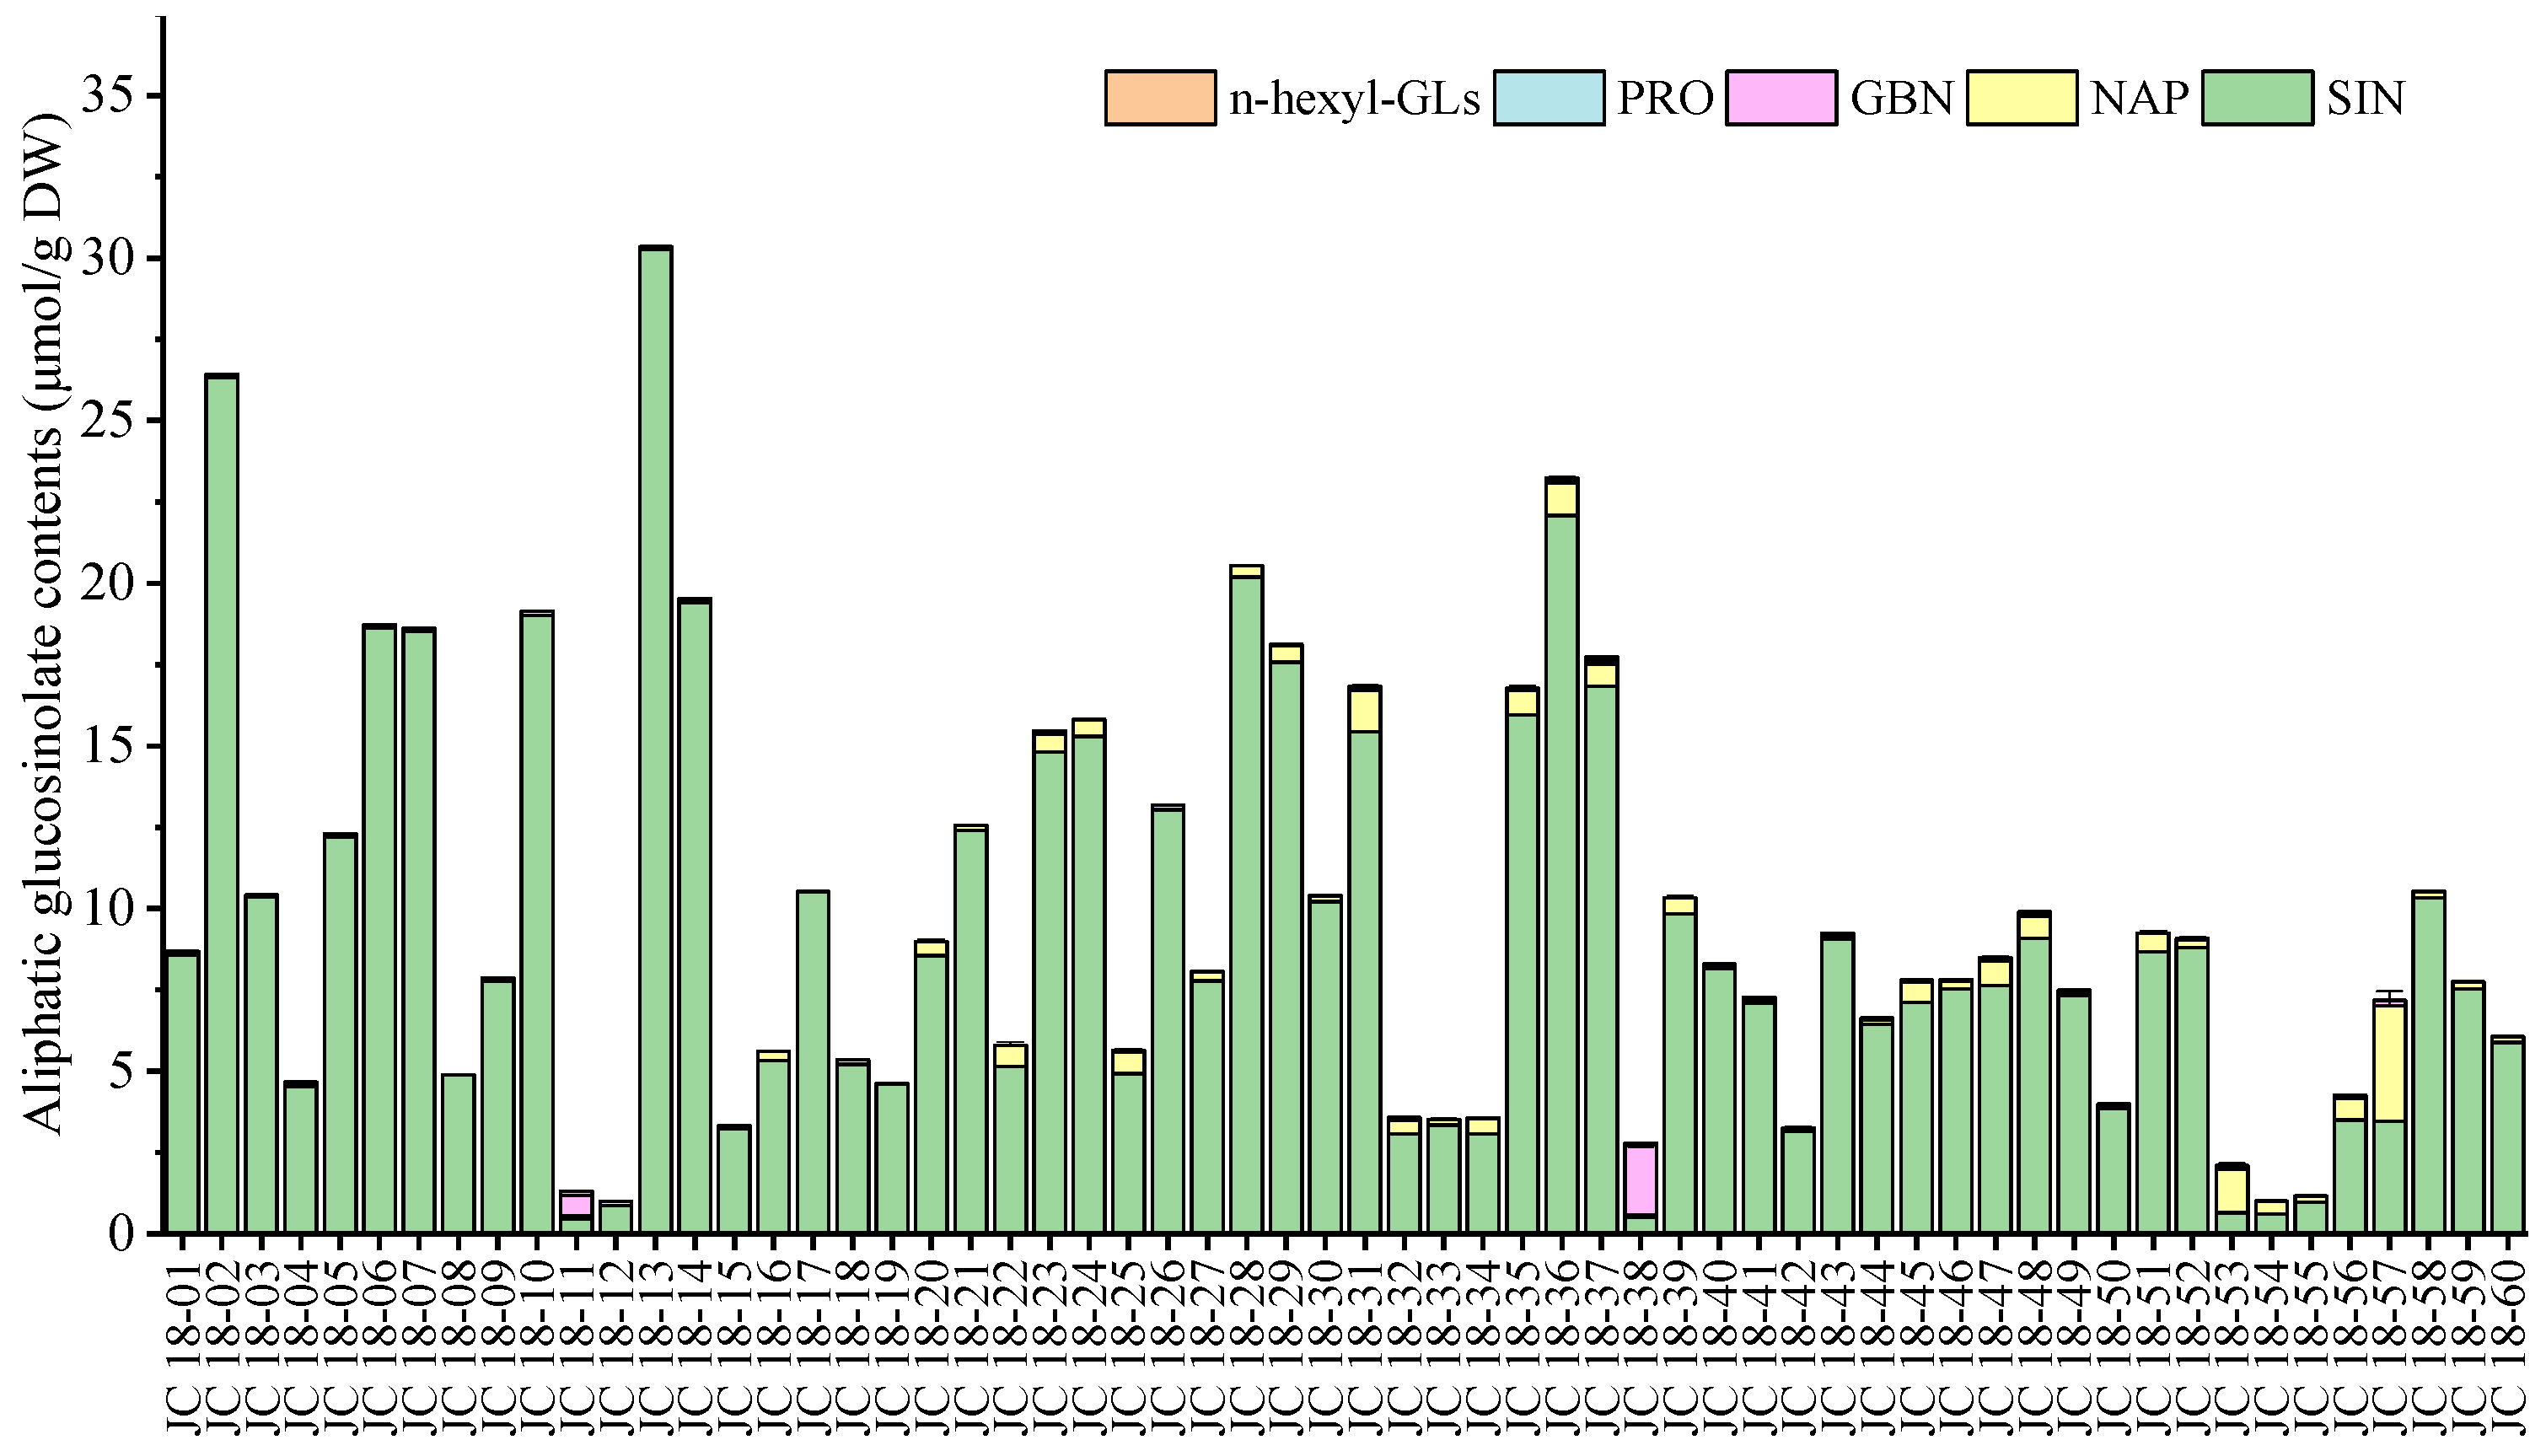
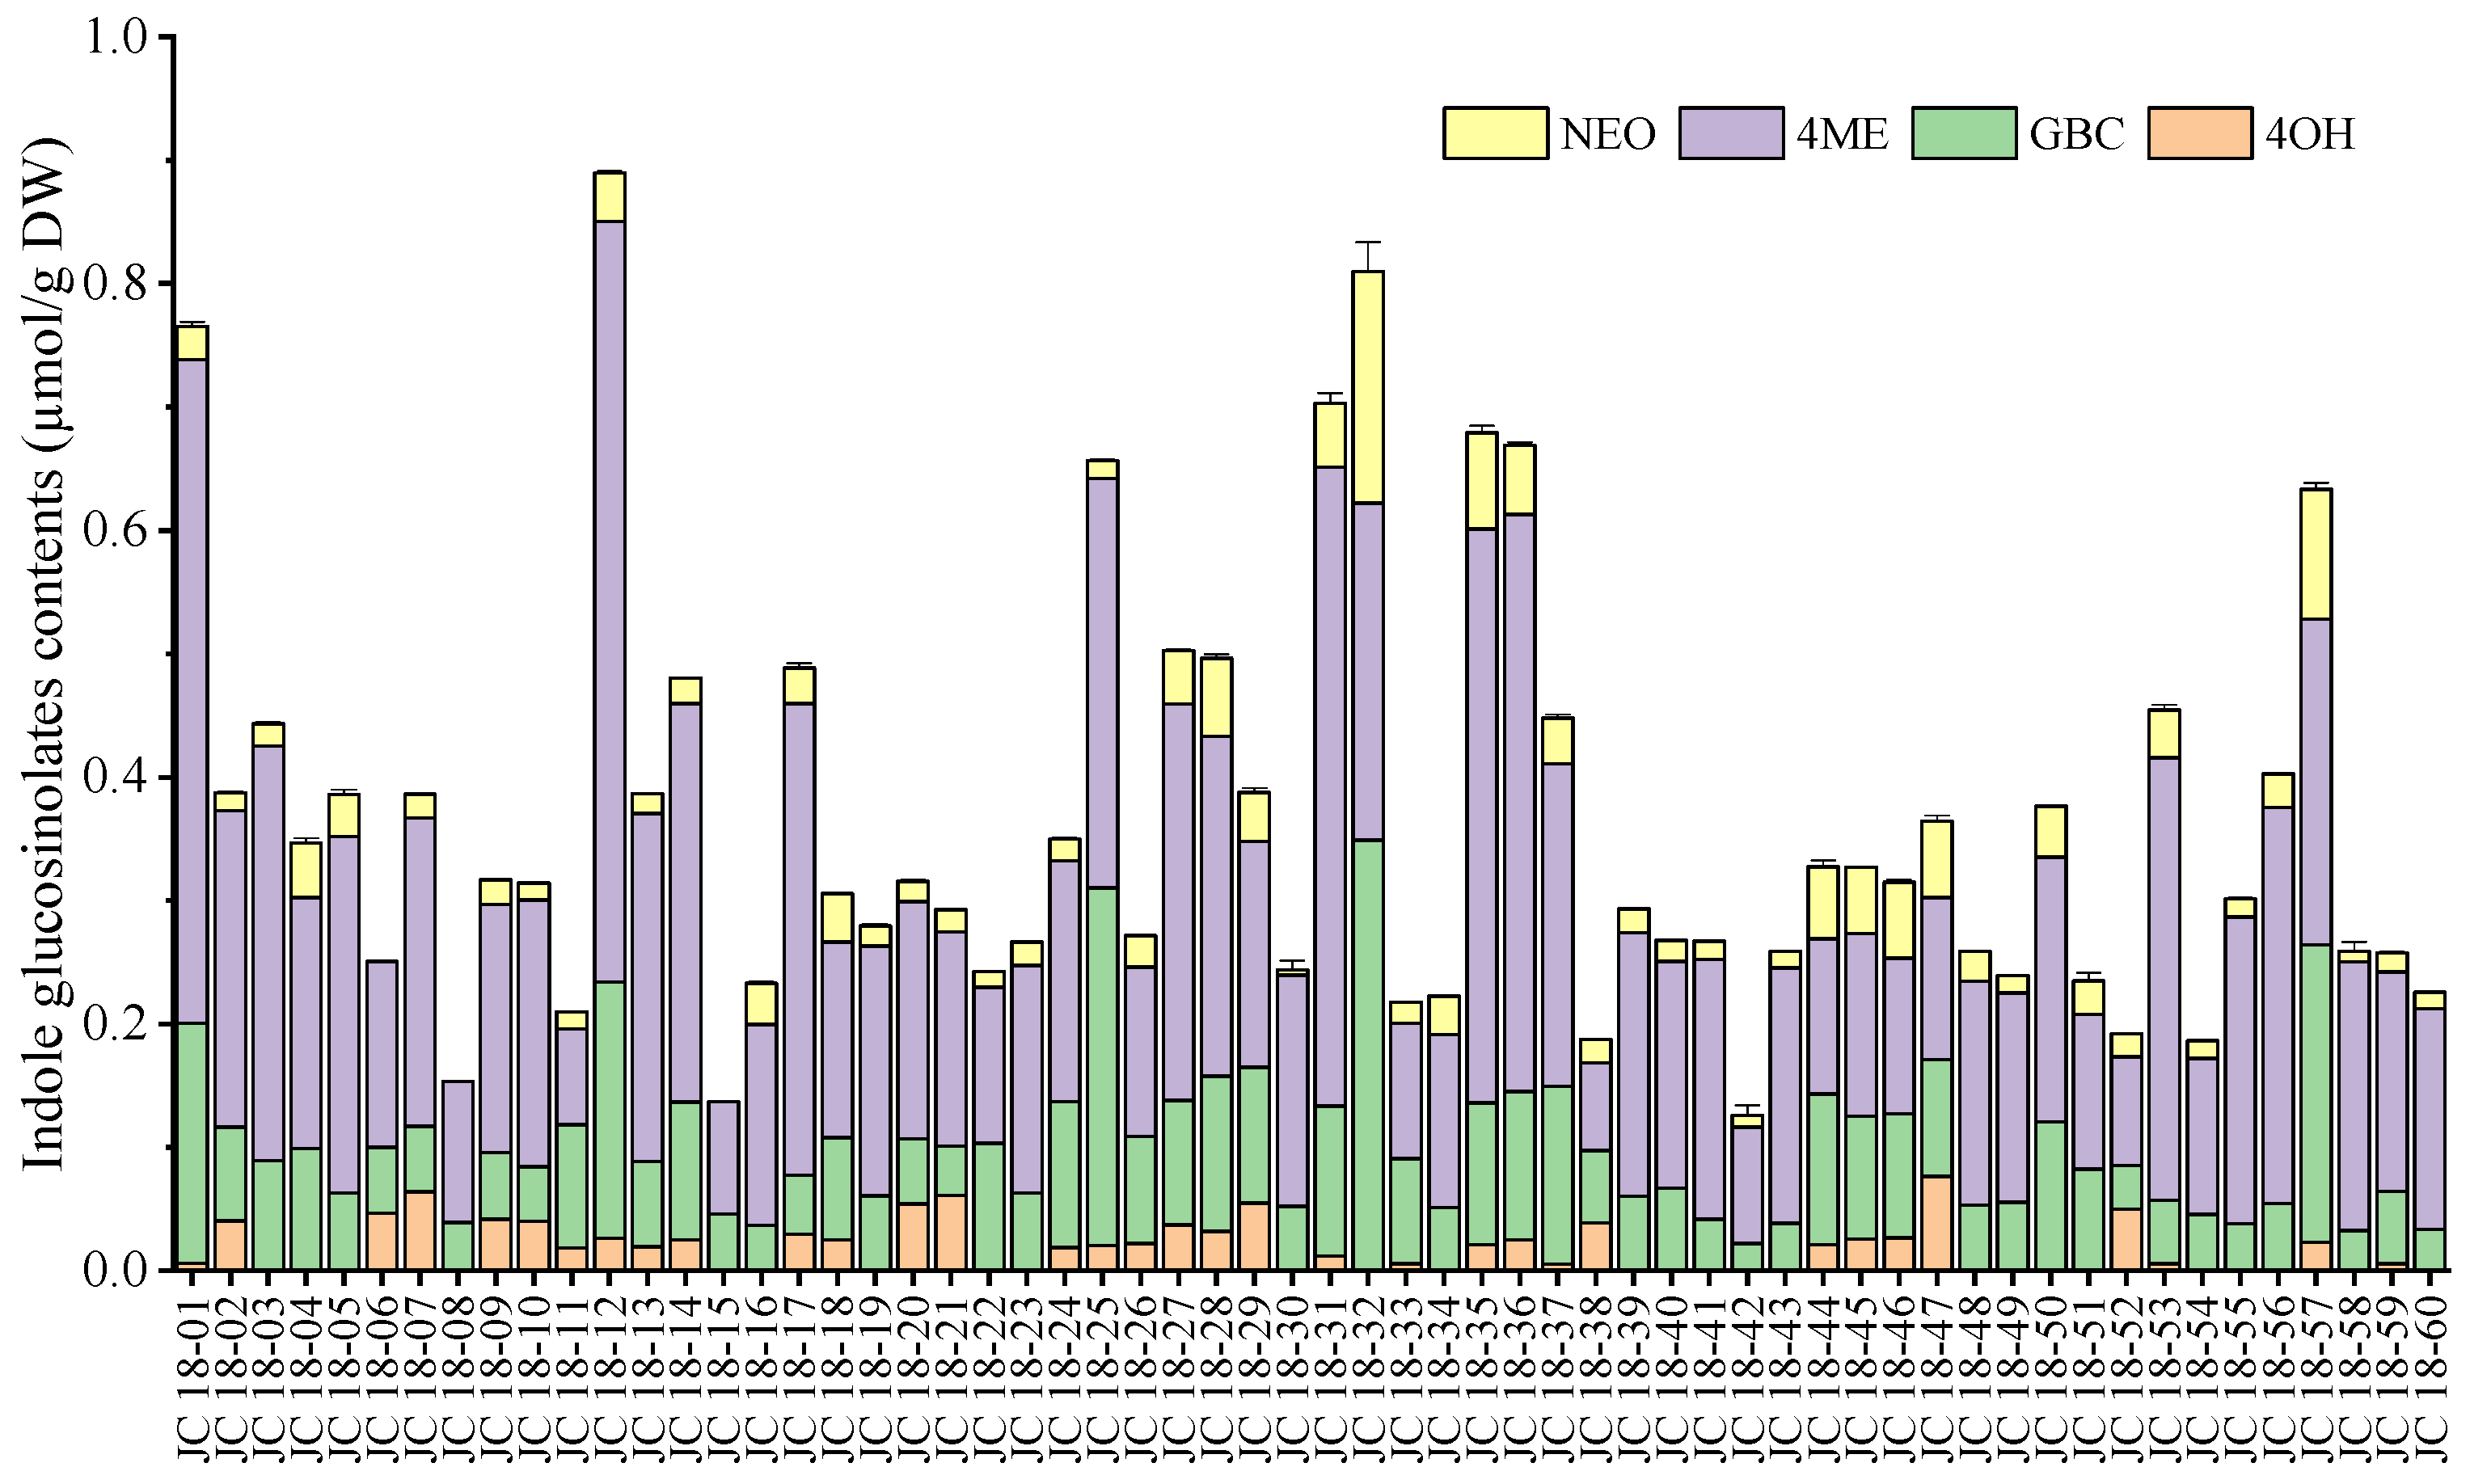
3.2. Evaluation of Glucosinolate Compounds in Leaves Based on 60 Mustard Resources

In this study, the leaves of 60 mustard genotypes were characterized, and nine glucosinolate compounds were detected in the mature mustard leaves (Figure 2). We found that the total glucosinolates in leaves ranged from 1.2023 to 30.7310 µmol/g DW, with an average of 10.1074 μmol/g DW, the standard deviation was 6.5620 and the coefficient of variation was 50.83%. Moreover, the highest (JC 18-13) content was about 25 times higher than the lowest (JC 18-54).
Of these nine glucosinolates, five belonged to aliphatic glucosinolates (Figure 3), namely, progoitrin, sinigrin, n-hexyl-GLs, gluconapin, glucobrassicanapin; and four belonged to indole glucosinolates (Figure 4), namely, 4-hydroxyglucobrassicin, glucobrassicin, neoglucobrassicin, 4-methoxyglucobrassicin. The total aliphatic glucosinolates ranged from 0.9950 to 30.3443 µmol/g DW, mainly sinigrin, which accounted for 17.92~100.00% of total aliphatic glucosinolates. However, the n-hexyl-GLs was only detected in JC 18-11 and 37, and we only detected one glucosinolate sinigrin in JC 18-08, 17, 19.
The total indole glucosinolates ranged from 0.1258 µmol/g DW to 0.8896 µmol/g DW, mainly 4-methoxyglucobrassicin, which accounted for 33.72~84.05% of total indole glucosinolates. According to the results, almost 1/3 of the genotypes did not contain the compounds 4-hydroxyglucobrassici, and the neoglucobrassicin was not detected in JC 18-06, 08, 15.

3.3. Cluster Analysis

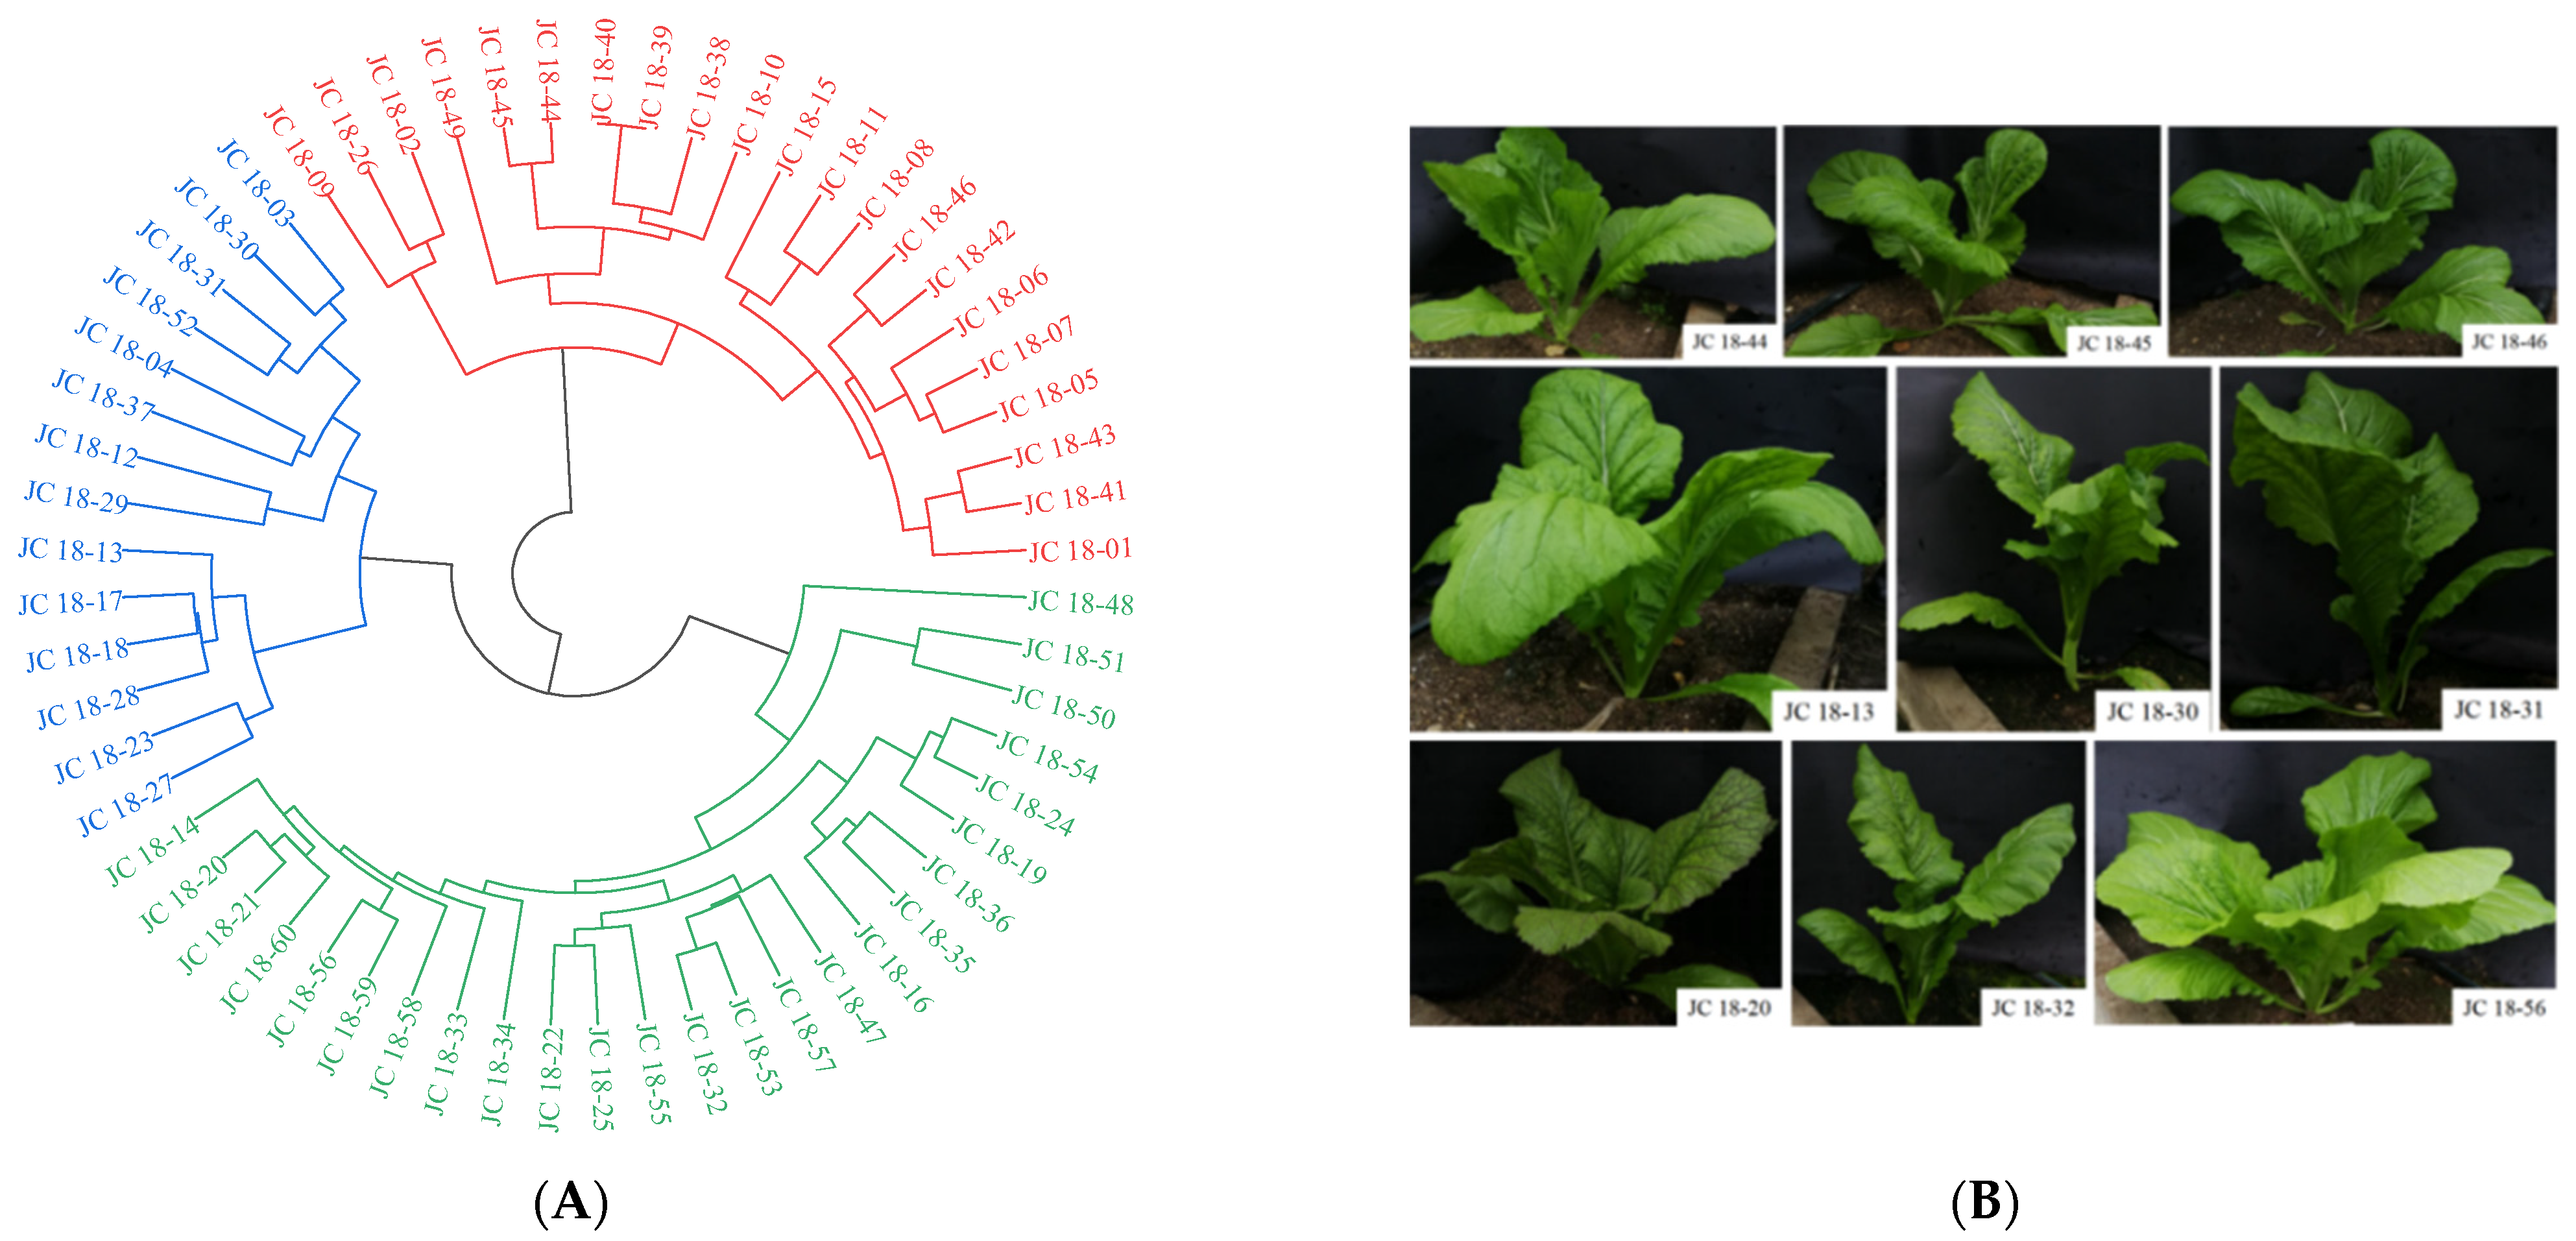
3.3.1. Cluster Analysis of 60 Mustard Resources Based on Phenotypic Characterization

Based on the analysis of phenotypic traits, the 60 mustard resources were classified into three groups (Figure 5). Group I (red) consisted of 21 resources, which were mainly characterized by high plant height, large plant width, broad elliptic leaf shape, full cleft, spreading plant type, green petiole color and flower stem color. There were 14 resources in group II (blue), which were mainly characterized by medium plants, small plant width, broad elliptic leaf shape, full cleft, semi-erect plants, light green petiole color and flower stem color. Lastly, there were 25 resources in group III (green), which were mainly characterized by short plants, large plant width, wide petiole, elliptic leaf shape, no cleft, semi-erect plant type, green petiole and flower stem color. The resources in Beijing were distributed in group I and group II, and mainly in group I, Hunan were mainly distributed in group II and group III, and Fujian were mainly distributed in group I and group III, while Guangxi were mainly distributed in group III.

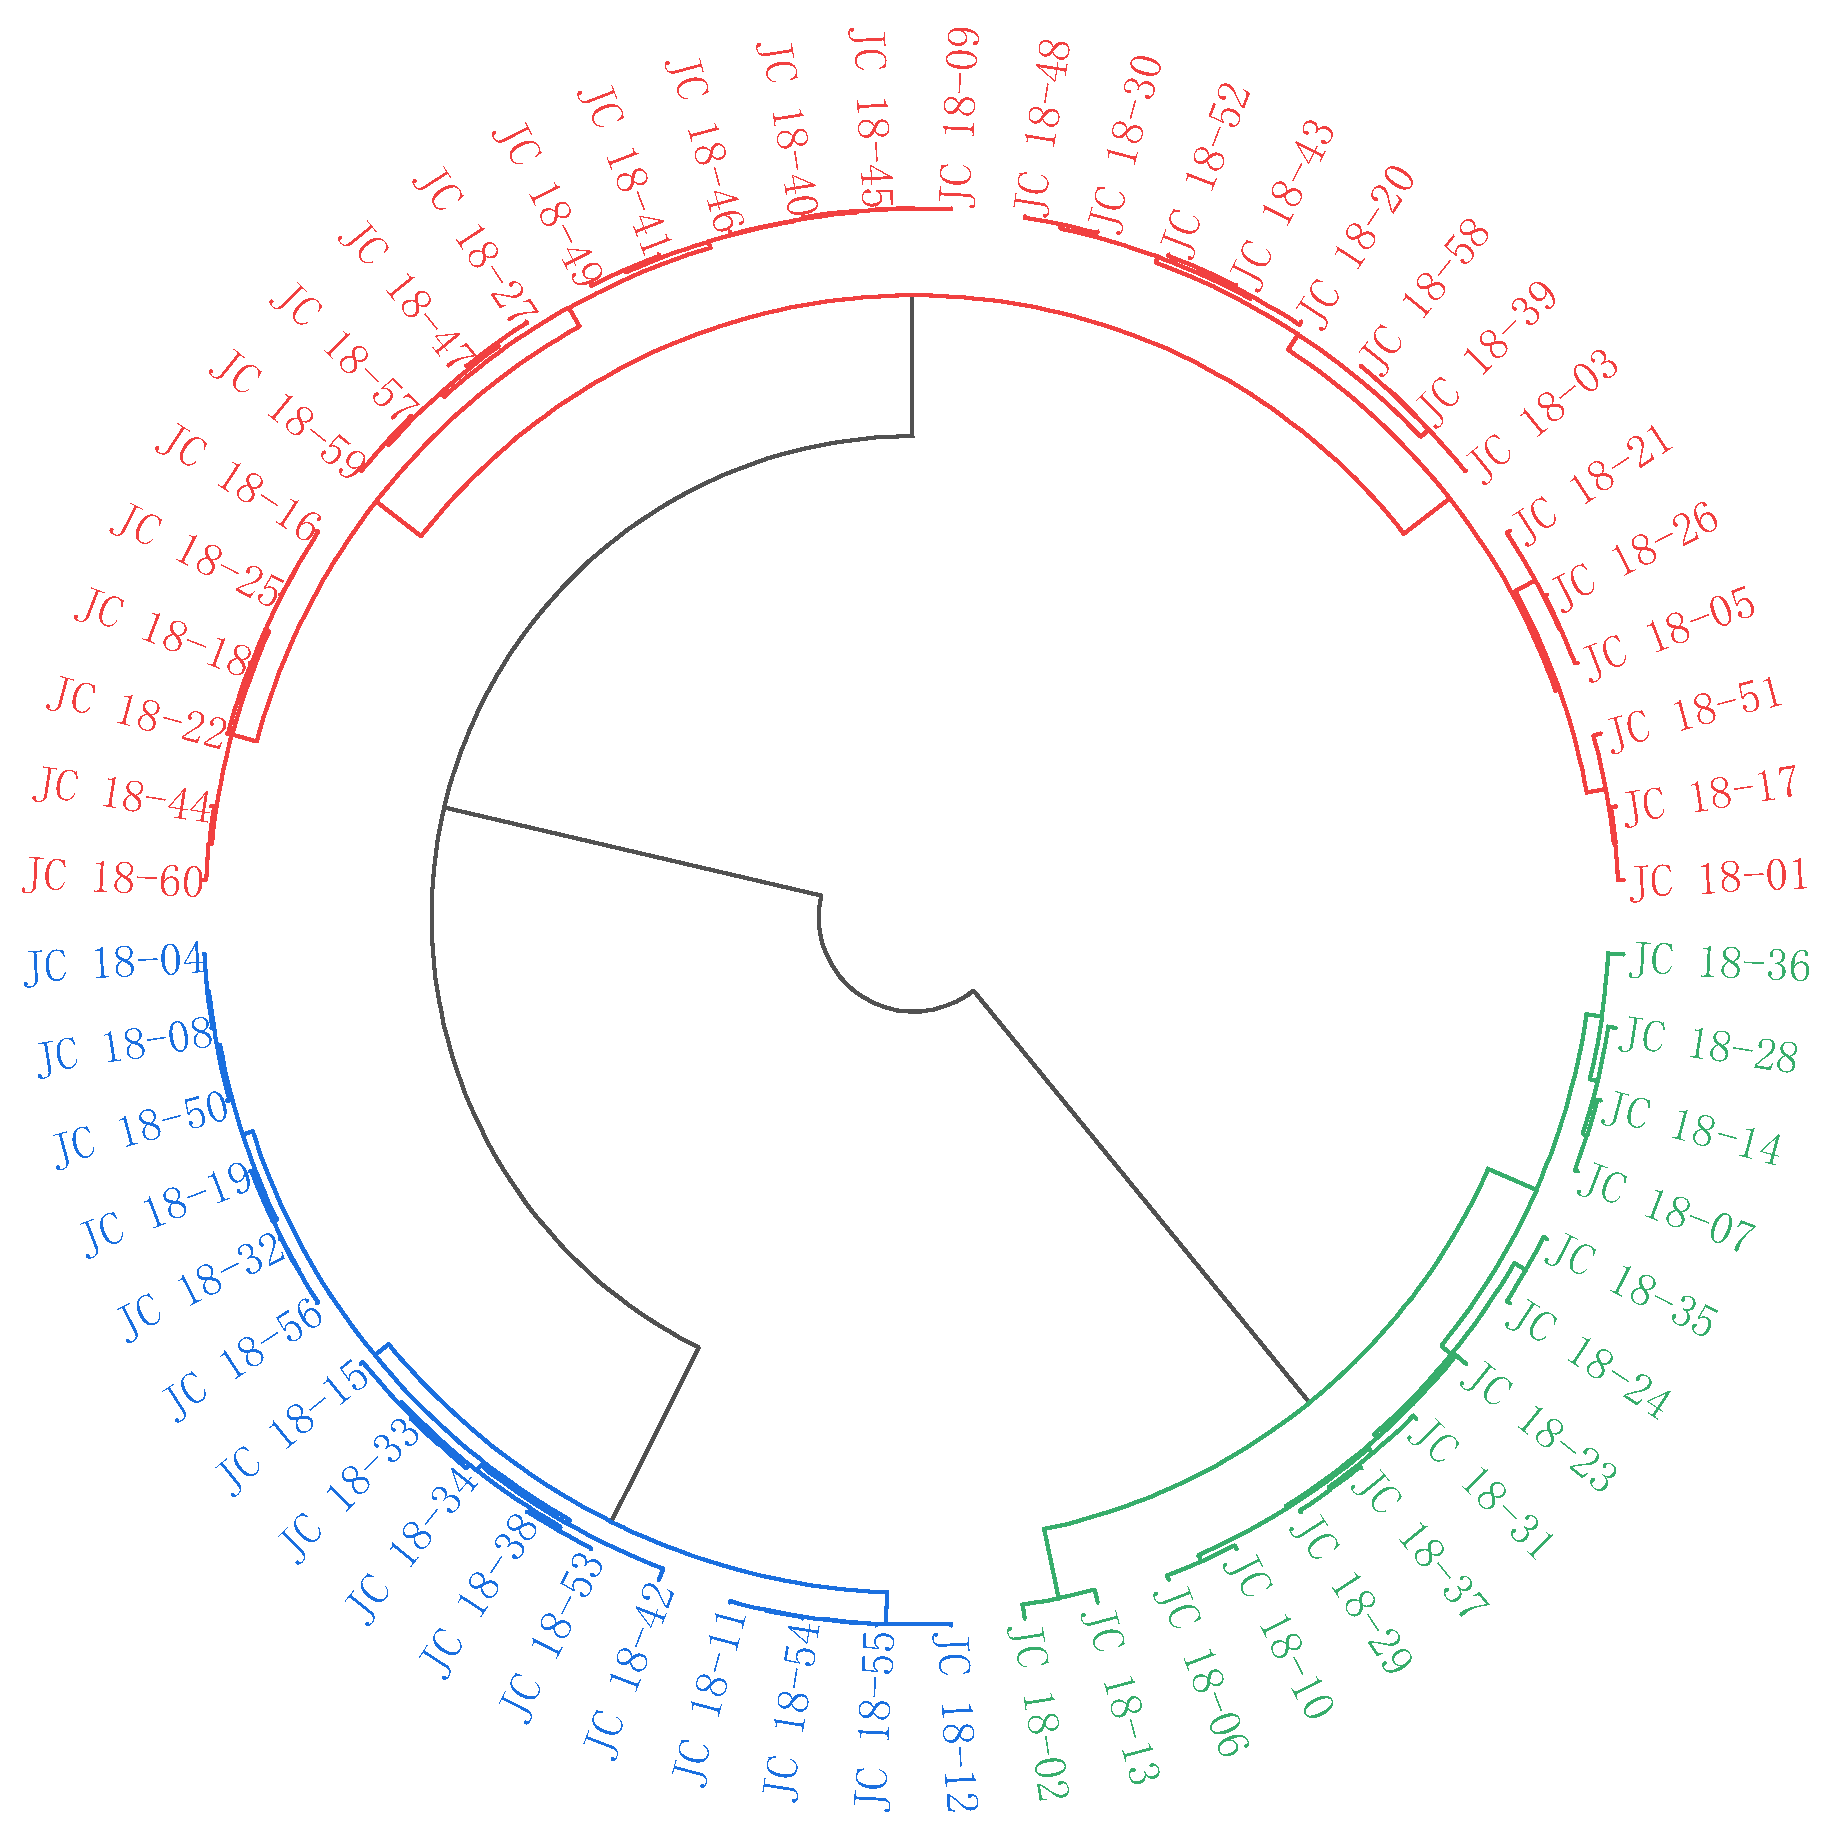
3.3.2. Cluster Analysis of 60 Mustard Resources Based on Glucosinolate Contents

According to the glucosinolate contents, the 60 mustard resources were also classified into three groups (Figure 6) by the same methods. Group I (blue) consisted of 16 resources, which glucosinolate contents ranged from 1.2023 µmol/g DW to 5.0448 µmol/g DW, belonging to the low glucosinolate contents group. Group II (red) was consisted of 30 resources, which glucosinolate contents ranged from 5.6509 µmol/g DW to 13.4535 µmol/g DW, belonging to the medium glucosinolate contents group. Finally, there were 14 resources in group III (green), which glucosinolate contents ranged from 15.7306 µmol/g DW to 30.7310 µmol/g DW, belonging to the high glucosinolate contents group. The resources in Beijing and Hunan were distributed in group II and group III, and Fujian were mainly distributed in group I and group II, while Guangxi were mainly distributed in group II.
There was no obvious linear correlation between the glucosinolate contents and any of the morphological traits, despite the fact that the 60 mustard resources could be divided into three distinct groups based on either phenotypic traits or glucosinolate contents. It encouraged us to look into other intrinsic factors that might affect glucosinolate accumulation in mustard resources.

3.4. Correlation Analysis of Agronomic Characters and Glucosinolate Contents in 60 Mustard Resources

From the correlation based on the Pearson test, we analyzed the correlation between quality traits, quantitative traits and glucosinolate contents separately (Table 6 and Table 7). In our studies, we found strong correlations between various quality traits and various quantitative traits of mustard resources, but less correlation between various agronomic traits and glucosinolate contents. At present, only a significant negative correlation was found between leaf color and glucosinolate contents. The lighter the leaf color, the higher the glucosinolate contents. However, this conclusion still needed to be further verified because our resource samples were too few.

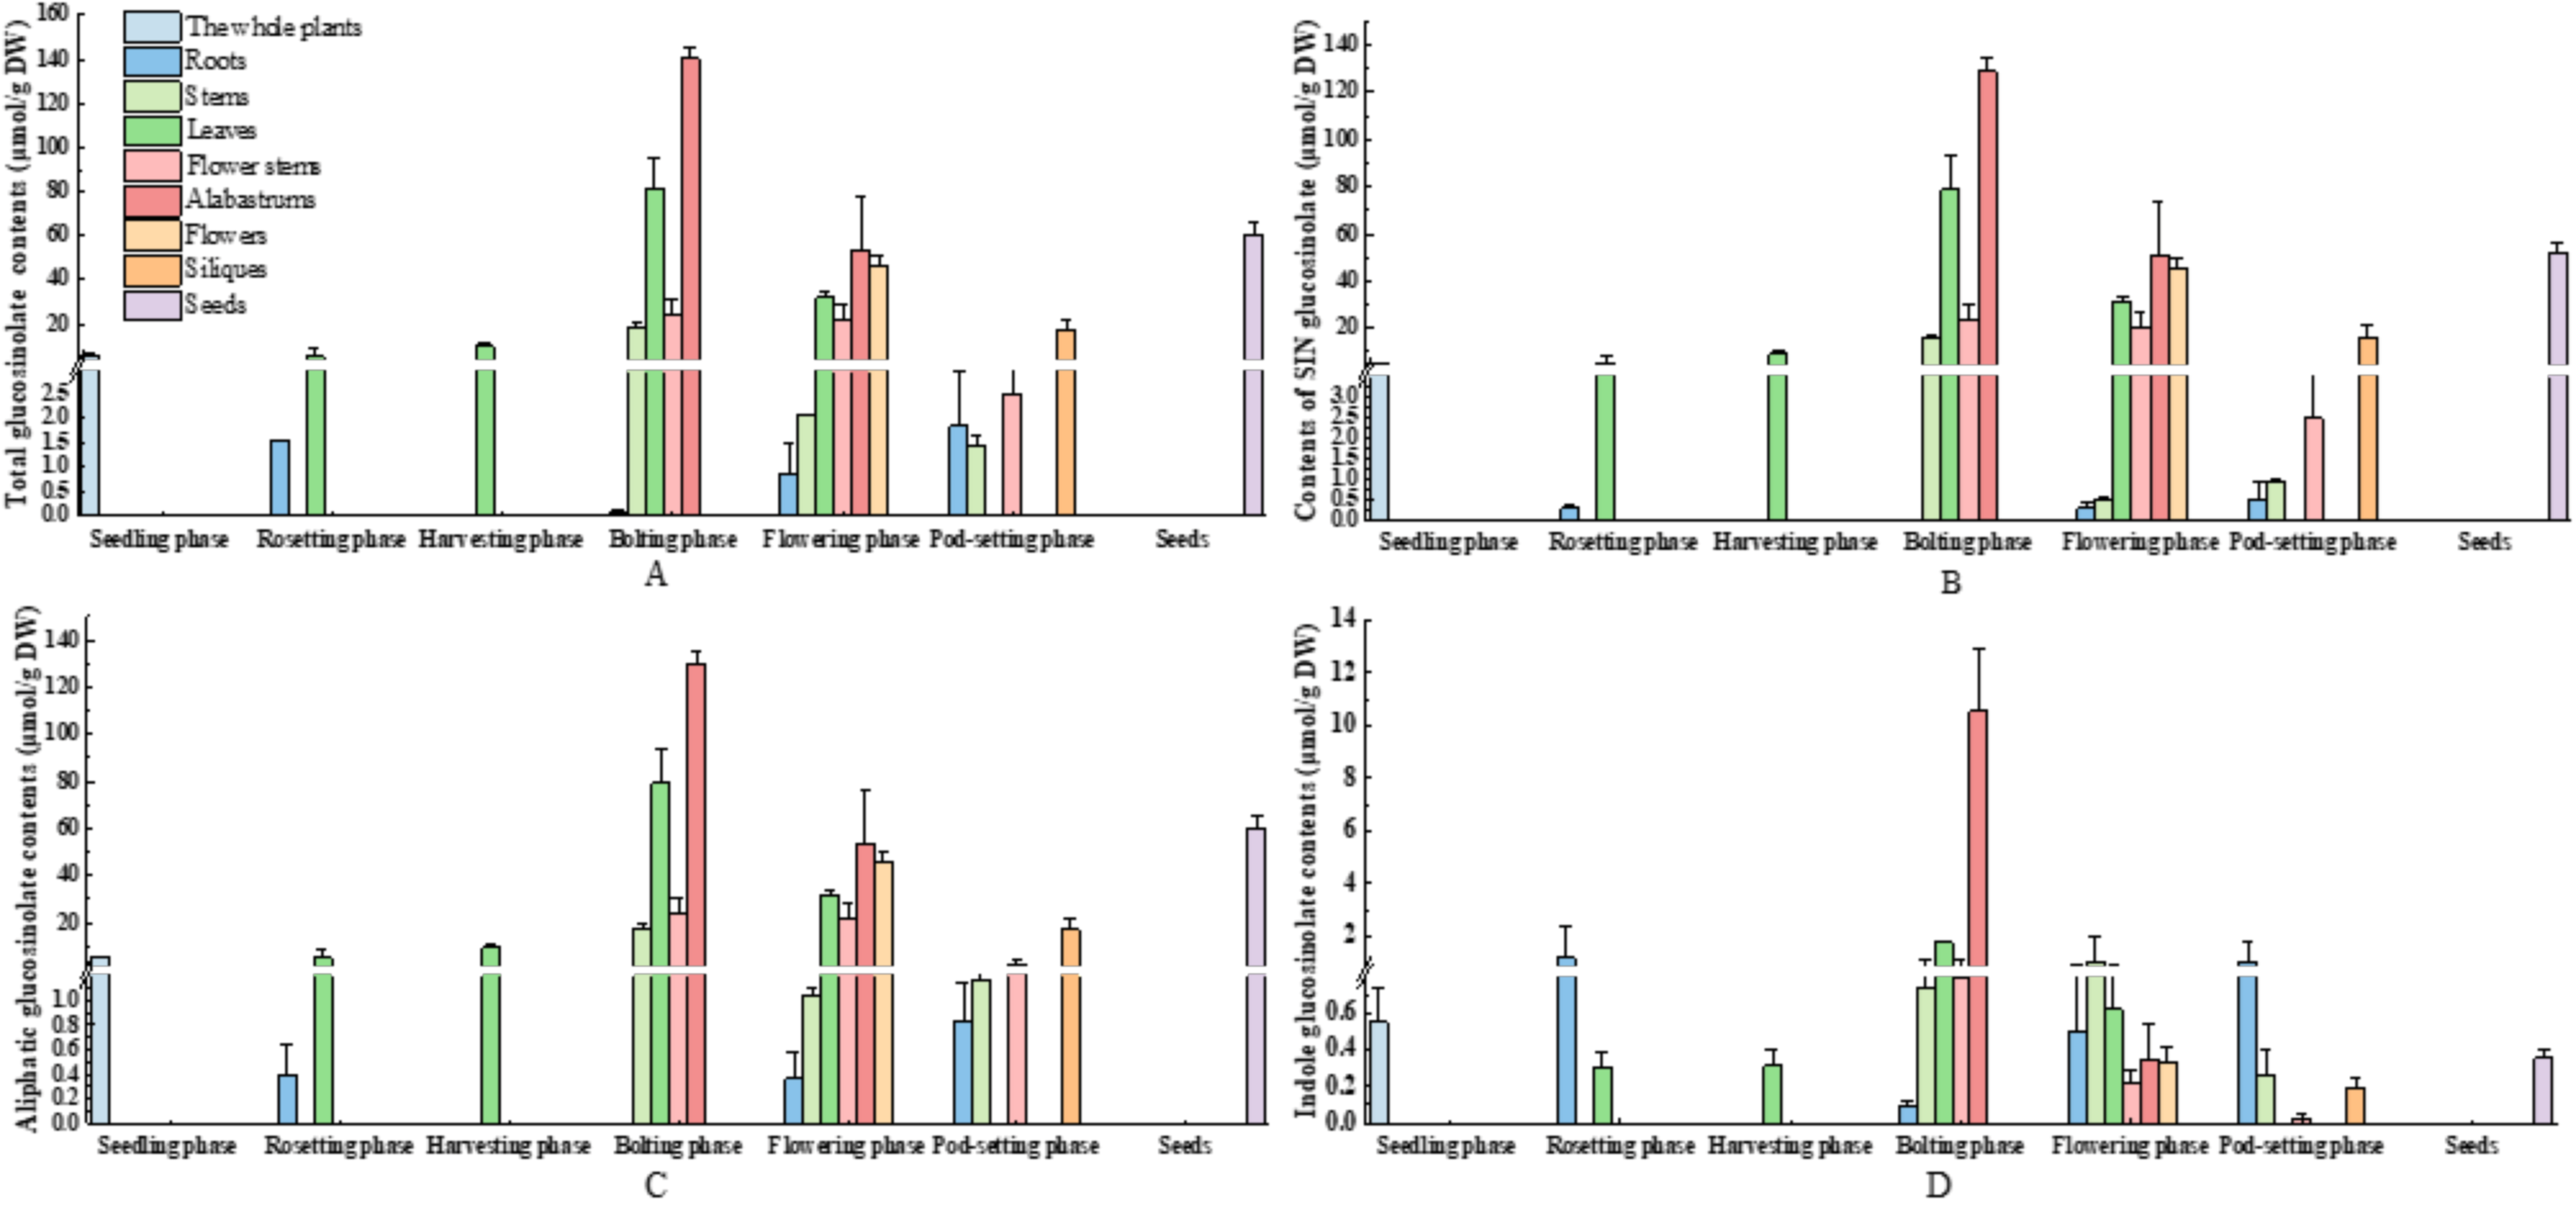
3.5. Diversity Distribution of Glucosinolate in Various Parts and Developmental Stages of Mustard Resource JC 18-56

3.5.1. Evaluation of Glucosinolates in Various Parts of Mustard Resource JC 18-56

To better visualize the relationship of plants development and glucosinolates accumulation, we investigated the glucosinolate contents in different parts during the whole life cycle of the mustard resource JC 18-56. There were nine glucosinolates that were detected in various parts and developmental stages of mustard samples. The types were same to the glucosinolates in mustard resources, but the contents of glucosinolatess had huge difference. The individual glucosinolates in the various parts were shown in Figure 7.
We detected five glucosinolates in the whole seedings and siliques, six glucosinolates in roots, leaves and flowers, seven glucosinolates in stems and flower stems, eight glucosinolates in seeds, nine glucosinolates in alabastrums. However, glucobrassicanapin was only detected in alabastrums at flowering stage and seeds, n-hexyl-GLs was only detected in alabastrums at bolting stage and siliques, 4-Hydroxyglucobrassicin was only detected in stems at bolting stage, flower stems at flowering stage and seeds. Gluconapin was not detected in the whole seedings, roots at rosetting stage, leaves in rosetting stage and flowering stage, flower stems at pod-setting stage. Progoitrin was not detected in leaves at rosetting stage, stems and flower stems at pod-setting stage. Glucobrassicin was not detected in siliques and flower stems at pod-setting stage. Neoglucobrassicin was not detected in siliques and leaves at rosetting stage. The contents of glucosonolate were 5.7383 μmol/g DW in the whole seedings, 46.2135 μmol/g DW in flowers, 17.2570 μmol/g DW in siliques, and 60.7076 μmol/g DW in seeds. Moreover, the glucosinolate contents ranged from 0.0918 to 1.8623 μmol/g DW in roots, 1.4208 to 18.4280 μmol/g DW in stems, 5.5554 to 80.8772 μmol/g DW in leaves, 2.4954 to 24.7891 μmol/g DW in flower stems and 53.6155 to 140.1257 μmol/g DW in alabastrums.
The main glucosinolates detected in the roots of mustard resource JC 18-56 were 4-Methoxyglucobrassicin, which could account for 35.06%~100.00% of the total glucosinolates. At the same time, the roots at bolting stage were only detected 4-Methoxyglucobrassicin. While the main glucosinolates in leaves, stems, flower stems, alabastrums, flowers, siliques and seeds were sinigrin, with the highest contents could account for 98.88% of the total glucosinolates. The total glucosinolates contents of roots showed a decreased trend firstly and then increased during development, which reached the maximum in pod-setting stage. But the result in leaves was opposite to the roots. In leaves, the total glucosinolates contents were increased firstly and then decreased in mustard’ life cycle, which reached the maximum at the bolting stage. Besides, the total glucosinolate contents in the stems, flower stems and alabastrums showed a decreased trend during development. They all had the highest contents in the bolting stage. Meanwhile, the glucosinolate contents in the alabastrums of the bolting stage were the maximum in the whole growing period of mustard resource JC 18-56.

3.5.2. Evaluation of Glucosinolates in Different Stages of Mustard Resource JC 18-56

The glucosinolate contents in the different phases of mustard ranged from 0.0918 to 140.1257 µmol/g DW (Figure 8). We detected five glucosinolates in rosetting stage but did not detect gluconapin, glucobrassicanapin, n-hexyl-GLs and 4-Hydroxyglucobrassicin. The glucosinolate contents in the rosetting stage ranged from 1.5735 to 5.5554 µmol/g DW. Six glucosinolates were detected in harvesting stage without glucobrassicanapin, n-hexyl-GLs and 4-Hydroxyglucobrassicin. The glucosinolate contents in the harvesting stage ranged from 0 to 9.6270 µmol/g DW. The trends of glucosinolate contents in rosetting stage and harvesting stage were that: leaves > roots. There were eight glucosinolates in bolting stage and flowering stage, but glucobrassicanapin was not detected in bolting stage and n-hexyl-GLs was not detected in flowering stage. The glucosinolate contents in the bolting stage ranged from 0.0918 to 140.1257 µmol/g DW, and the trend of contents was that: alabastrums > leaves > flower stems > stems > roots. In flowering stage, the glucosinolate contents ranged from 0.8639 to 53.6155 µmol/g DW, and the trend of contents was that of: alabastrums > flowers > leaves > flower stems > stems > roots. We detected seven glucosinolates in the pod-setting stage but did not detect glucobrassicanapin and 4-Hydroxyglucobrassicin. The glucosinolate contents ranged from 1.4208 to 17.2570 µmol/g DW, and the trend of contents was that of: siliques > flower stems > stems > roots.

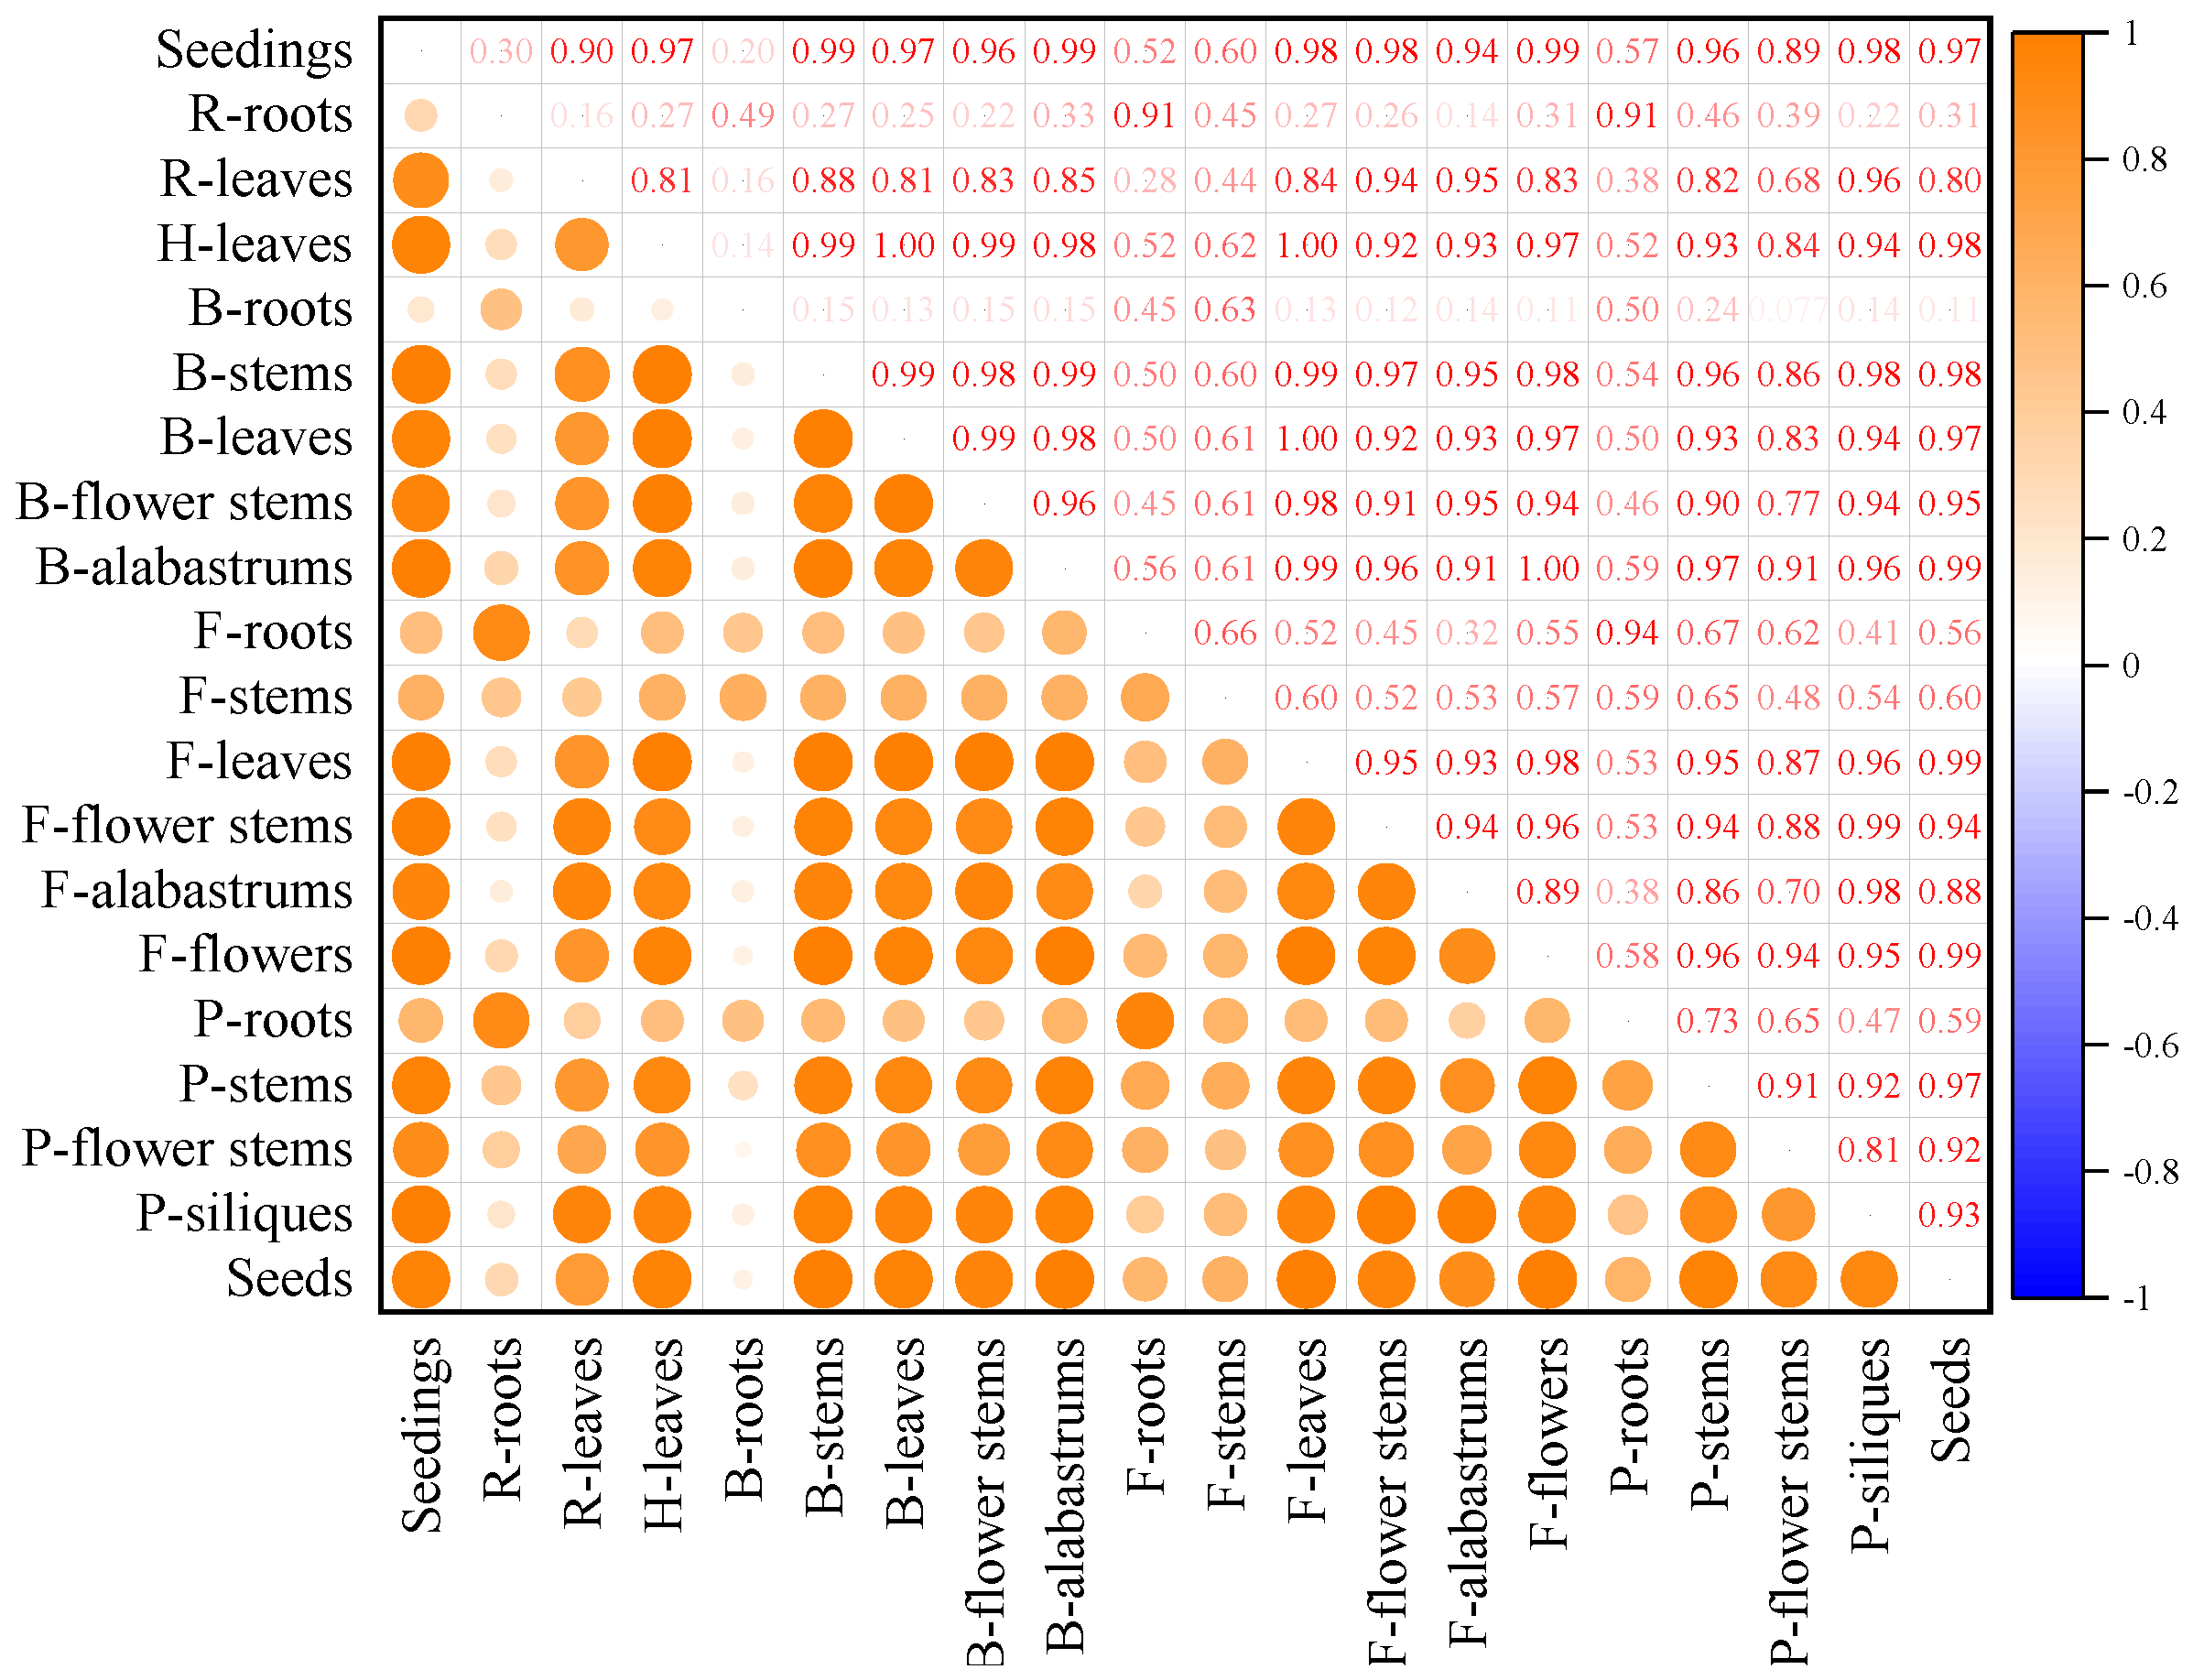
3.6. Correlation between Different Tissues in the Whole Growth Period of Mustard Resource JC 18-56

Correlation analysis of the different organs at different stages in the whole growth period of mustard (Figure 9) found that the correlation coefficient was above 0.9 between seedlings and leaves in the rosetting and harvesting stages; stems, leaves, flower stems and alabastrums in the bolting stage; leaves, flower stems, alabastrums and flowers in the flowering stage, stems; and siliques in the pod-setting stage and seeds (p < 0.01). Furthermore, there was a significant positive correlation against roots from the rosetting stage to the pod-setting stage and stems at the flowering stage (p < 0.01). Meanwhile, there was a significant positive correlation between roots at the rosetting stage and stems at the pod-setting stage (p < 0.05). There was no correlation between root, which were in the rosetting and bolting stage, and stems, alabastrums, flowers, siliques and seeds. However, the correlation against roots and other parts was established only from the flowering stage, but there was no correlation between roots and alabastrums at the flowering stage, while there was extremely significant positive correlation between roots at the podding stage and other parts (p < 0.01), but only with leaves at the rosetting stage and alabastrums at the flowering stage (p < 0.05). Likewise, there was a significant positive correlation between stems and other parts, except that the stems at bolting stage were significantly correlated with roots at the rosetting stage and at the bolting stage, and there was no significant correlation between stems at the pod-setting stage and roots at the bolting stage. There was no significant correlation between leaves at the rosetting stage and roots at the rosetting stage and the bolting stage, but significant correlation between leaves at the harvesting stage and stems, leaves, flower stems, alabastrums at the bolting stage, and leaves, flowers at flowering stage, siliques and seeds at the pod-setting stage (p < 0.01). Of the above correlation coefficients, the absolute value of the correlation coefficient between leaves at the harvesting stage and leaves at the bolting stage was the largest (1.000 **).

4. Discussion

We found substantial variations between the agronomic traits of mustard resources in our study. It was possible that the genotype of various resources and environmental factors contributed to the phenotypic variations of various mustard resources as well as the amount and composition of glucosinolates.
The composition of glucosinolates produced by different plant species varies considerably and even between different ecotypes within a single species [20,21]. In turnip, pakchoi, Chinese kale [22], and purple blooming Chinese cabbage, the main individual glucosinolate was gluconapin, while glucoraphanin in flowering Chinese cabbage, and glucobrassicin and neoglucobrassicin in Chinese cabbage [23]. Glucoraphanin was the most common glucosinolate in broccoli [24]. However, a large number of experimental results showed that more than 90% of glucosinolates in mustard were aliphatic glucosinolates, with sinigrin being the most major element [23,25,26,27,28], which matched the findings of this study. Li [27] detected seven glucosinolates from mustard, including two aliphatic glucosinolates, sinigrin and gluconapin, and four indole glucosinolates, 4-methoxyglucobrassicin, 4-hydroxyglucobrassicin, glucobrassicin and neoglucobrassicin, as well as one aromatic glucosinolate, gluconasturtiin. In this experiment, nine glucosinolates were discovered. Apart from the two aliphatic glucosinolates discovered by Li [27], three other aliphatic glucosinolates were detected: progoitrin, n-hexyl-GLs, and glucobrassicanapin. However, no aromatic glucosinolates were found, which might be related to the plant materials, the extraction technology, and the environmental conditions of the plant growth.
Even within a single plant, glucosinolate concentration might vary from organs, cultivation methods and growing conditions. Dormant and germinating seeds exhibited the largest concentration (2.5~3.3 percent by dry weight) in the model plant Arabidopsis thaliana, followed by inflorescences, siliques, leaves, and roots [29]. Three cultivars of Chinese kale were discovered to have very significant changes in compositions and contents between two organs. Bolting stems had much higher glucosinolate concentration than leaves, with 3~4.5 folds for aliphatic glucosinolates, 2~4 folds for indole glucosinolates, and 2.5~5.5 folds for total glucosinolates [23]. In this study, glucosinolates in nine parts at seven stages of mustard growth period were detected, and we found nine glucosinolates: progoitrin, sinigrin, n-hexyl-GLs, gluconapin, glucobrassicanapin, glucobrassicin, neoglucobrassicin, 4-hydroxyglucobrassicin and 4-methoxyglucobrassicin. There were five, six, eight, eight and seven glucosinolates in the rosetting stage, harvesting stage, bolting stage, flowering stage and pod-setting stage, respectively. Similarly, the diversities also existed in glucosinolates content among different organs, where five, six, seven, six, seven, nine, six, five, eight glucosinolates were detected in whole plants, roots, stems, leaves, flower stems, alabastrums, flowers, siliques and mature seeds, respectively. The sorts of glucosinolate detected in alabastrums were the most abundant, furthermore, the glucosinolate contents reached the maximum in the whole growth period of mustard at the bolting stage. The main glucosinolates detected in the roots of mustard were 4-methoxyglucobrassicin, while in other parts of mustard were sinigrin. The results were consistent with Bhandari [26]. The contents of glucosinolates in different parts of mustard were roughly as follows: alabastrums > seeds > flowers > siliques > leaves > flower stems > stems > roots. In addition, Brown [29] found that glucosinolate contents were relatively high in young leaves and reproductive organs (e.g., seeds, flowers, siliques and developing inflorescences) and low in roots and leaves at later stages of development [30]. In contrast, in Kim’s [31] study on Chinese cabbage, the total glucosinolate contents by site were: seeds > flowers > young leaves > stems > roots > old leaves. There were some differences among different crops. Previous studies had shown that, although present ubiquitously in all tissues during plant development, the biosynthesis and accumulation of particular glucosinolates in specific tissues was known to be influenced by various environmental stimuli [5].
The distribution and accumulation of glucosinolates in different tissues of plants were influenced by the synthesis and transport of glucosinolates. According to several studies, the change in glucosinolate contents among plant organs was connected to each organ’s ability to synthesize and store glucosinolates [32]. The glucosinolate distribution patterns and concentrations in roots and shoots were also diverse due to the distinct regulatory mechanisms of glucosinolate production and turnover [26,33]. Chen’s [32] study found that turnip roots had a higher ability to synthesize and store glucosinolates than stems and inflorescences of purple cai-tai and choysum. In addition, previous research about the dynamics of glucosinolates in A. thaliana during plant development or in adult rosettes at various times of day indicated turnover processes was related with de novo biosynthesis [29,34,35,36]. For example, during the transformations from seeds to seedlings and seedlings to adult rosette, the relative and absolute levels of glucosinolates altered dramatically [29,36]. Furthermore, some methionine-derived glucosinolates were only found in seeds and seedlings in A. thaliana Col-0, but not in vegetative rosette tissue of young plants, indicating glucosinolates could transport in seedlings [29,34,36]. Moreover, through genetic and functional studies of the model plant Arabidopsis thaliana, most of the genes and key transcriptional regulators of glucosinolate biosynthesis pathway were identified [5,37]. Tian [38] argued that glucosinolates collected in rape seeds were mostly generated in leaves. The glucosinolate contents in seeds were substantially associated with the glucosinolate contents in leaves, stems and other tissues, which was similar to our findings. In these experiments, we analyzed the correlation between different parts of mustard in different growth stages. The results indicated that there was a strong correlation between stems, leaves, flower stems, alabastrums, flowers, siliques, and seeds. However, after the flowering stage, the connection between roots and other parts was established, and the correlation between leaves at the harvesting stage and leaves at the bolting stage was completely positive (1.000 **).
Hypotheses could be proposed based on previous studies, glucosinolates in mustard were mainly synthesized in leaves, alabastrums and roots, that synthesized in leaves were transported to alabastrums, flowers, siliques and seeds through stems and flower stems, and which synthesized in alabastrums were transported to flowers, siliques, and seeds, nevertheless, that synthesized in roots were not transported to other parts until after anthesis. Finally, all the glucosinolates were accumulated in seeds. However, this hypothesis was only based on the correlation analysis of glucosinolate contents in different organs and the basis of previous studies but did not explain the specific synthesis and transport mechanism from the molecular mechanism, which had some limitations and was still worthy of further exploration.

5. Conclusions

In conclusion, our studies showed that both the agronomic traits and glucosinolate contents varied widely among different mustard resources. We detected a total of nine glucosinolates in mustard. They were five aliphatic glucosinolates (progoitrin, sinigrin, n-hexyl-GLs, gluconapin, glucobrassicanapin) and four indole glucosinolates (neoglucobrassicin, glucobrassicin, 4-hydroxyglucobrassicin, 4-methoxyglucobrassicin). According to the cluster analyses, there was no clear correlation between the phenotypic traits and glucosinolate contents of mustard resources. Additionally, using correlation analysis, we preliminary discovered a significant negative correlation between leaf color and glucosinolate contents. However, this finding required to be confirmed. The contents of glucosinolates in different organs varied greatly in different growth stages of mustard resource JC 18-56. The main glucosinolates detected in roots were 4-methoxyglucobrassicin, while in other parts they were sinigrin. Meanwhile, we found that the alabastrums at the bolting stage had the most abundant types and contents of glucosinolates. The contents of glucosinolates in different organs of mustard resource JC 18-56 were as follows: alabastrums > seeds > flowers > siliques > leaves > flower stems > stems > roots.

Author Contributions

Conceptualization, K.H. and Q.W. (Qiuyun Wu); methodology, S.M., H.H. and Q.W. (Qi Wu); validation and formal analysis, H.H., Q.W. (Qi Wu), J.W. and S.M.; investigation, F.W. and P.W.; resources, K.H. and Q.W. (Qiuyun Wu); writing—original draft preparation, H.H.; writing—review and editing, H.H., Y.T., K.H. and Q.W. (Qiuyun Wu); visualization, Y.T. and J.W.; supervision, K.H. and Q.W. (Qiuyun Wu); funding acquisition, K.H., Q.W. (Qiuyun Wu) and J.W. All authors have read and agreed to the published version of the manuscript.

Funding

This research was funded by The National Key Research and Development Program of China (2020YFD1000300), National Natural Science Foundation of China (No. 32072568, 32072585, 31902023), the Natural Science Foundation of Hunan province (No. 2021JJ30324, 2021JJ30345), The National Key Research and Development Program of Hunan Province (2021NK2006) and Agricultural Science and Technology Innovation Program of CAAS (CAAS-XTCX2019025).

Institutional Review Board Statement

Not applicable.

Informed Consent Statement

Informed consent was obtained from all subjects involved in the study.

Data Availability Statement

The datasets generated for this study are available on request to the corresponding author.

Conflicts of Interest

The authors declare no conflict of interest.

References

  1. Wu, X.M.; Chen, B.Y.; Lu, G.Y.; Wang, H.Z.; Xu, K.; Gao, G.Z.; Song, Y.C. Genetic diversity in oil and vegetable mustard (Brassica juncea) landraces revealed by SRAP markers. Genet. Resour. Crop Evol. 2009, 56, 1011–1022. [Google Scholar] [CrossRef]
  2. Sun, X.Q.; Qu, Y.Q.; Li, M.M.; Song, X.L.; Hang, Y.Y. Genetic diversity, genetic structure and migration routes of wild Brassica juncea in China assessed by SSR markers. Genet. Resour. Crop Evol. 2018, 65, 1581–1590. [Google Scholar] [CrossRef]
  3. Yang, Y.G.; Liu, N.C.; Chen, X.Q.; Chen, C.L.; Zhou, G.F.; Liao, K.L. A study on classification of mustard. Acta Hortic. Sin. 1989, 1, 114–121. [Google Scholar]
  4. Hopkins, R.J.; Dam, N.V.; Loon, J.V. Role of glucosinolates in insect-plant relationships and multitrophic interactions. Annu. Rev. EntoMogy 2009, 54, 57–83. [Google Scholar] [CrossRef] [PubMed]
  5. Augustine, R.; Bisht, N.C. Biotic elicitors and mechanical damage modulate glucosinolate accumulation by coordinated interplay of glucosinolate biosynthesis regulators in polyploid Brassica juncea. Phytochemistry 2015, 117, 43–50. [Google Scholar] [CrossRef] [PubMed]
  6. Kliebenstein, D.J.; Kroymann, J.; Mitchell-Olds, T. The glucosinolate-myrosinase system in an ecological and evolutionary context. Curr. Opin. Plant Biol. 2005, 8, 264–271. [Google Scholar] [CrossRef]
  7. Yan, X.F.; Chen, S.X. Regulation of plant glucosinolate metabolism. Planta 2007, 226, 1343–1352. [Google Scholar] [CrossRef] [PubMed]
  8. Chhajed, S.; Mostafa, I.; He, Y.; Abou–Hashem, M.; El–Domiaty, M.; Chen, S.X. Glucosinolate biosynthesis and the Glucosinolate–Myrosinase system in plant defense. Agronomy 2020, 10, 1786. [Google Scholar] [CrossRef]
  9. Augustine, R.; Mukhopadhyay, A.; Bisht, N.C. Targeted silencing of BjMYB28 transcription factor gene directs development of low glucosinolate lines in oilseed Brassica juncea. Plant Biotechnol. J. 2013, 11, 855–866. [Google Scholar] [CrossRef]
  10. Fahey, J.W.; Zalcmann, A.T.; Talalay, P. The chemical diversity and distribution of glucosinolates and isothiocyanates among plants. Phytochemistry 2001, 56, 5–51. [Google Scholar] [CrossRef]
  11. Nambiar, D.M.; Kumari, J.; Augustine, R.; Kumar, P.; Bajpai, P.K.; Bisht, N.C. GTR1 and GTR2 transporters differentially regulate tissue–specific glucosinolate contents and defence responses in the oilseed crop Brassica juncea. Plant Cell Environ. 2021, 44, 2729–2743. [Google Scholar] [CrossRef] [PubMed]
  12. McGregor, D.I.; Mullin, W.J.; Fenwick, G.R. Analytical methodology for determining glucosinolate composition and content. J. Assoc. Anal. Chem. 1983, 66, 825–849. [Google Scholar] [CrossRef]
  13. Antonious, G.F.; Bomford, M.; Vincelli, P. Screening Brassica species for glucosinolate content. J. Environ. Sci. Health Part B 2009, 44, 311–316. [Google Scholar] [CrossRef]
  14. Cools, K.; Terry, L.A. The effect of processing on the glucosinolate profile in mustard seed. Food Chem. 2018, 252, 343–348. [Google Scholar] [CrossRef] [PubMed]
  15. Edger, P.P.; Hall, J.C.; Harkess, A.; Tang, M.; Coombs, J.; Mohammadin, S.; Schranz, M.E.; Xiong, Z.; Leebens–Mack, J.; Meyers, B.C.; et al. Brassicales phylogeny inferred from 72 plastid genes: A reanalysis of the phylogenetic localization of two paleopolyploid events and origin of novel chemical defenses. Am. J. Bot. 2018, 105, 463–469. [Google Scholar] [CrossRef]
  16. Padilla, G.; Cartea, M.E.; Velasco, P.; Haro, A.D.; Orda’s, A. Variation of glucosinolates in vegetable crops of Brassica rapa. Phytochemistry 2007, 68, 536–545. [Google Scholar] [CrossRef]
  17. Yang, B.; Quiros, C.F. Survey of glucosinolate variation in leaves of Brassica rapa crops. Genet. Resour. Crop. Evol. 2010, 57, 1079–1089. [Google Scholar] [CrossRef]
  18. Sodhi, Y.S.; Mukhopadhyay, A.; Arumugam, N.; Verma, J.K.; Gupta, V.; Pental, D.; Pradhan, A.K. Genetic analysis of total glucosinolate in crosses involving a high glucosinolate Indian variety and a low glucosinolate line of Brassica juncea. Plant Breed. 2010, 121, 508–511. [Google Scholar] [CrossRef]
  19. Mao, S.X.; Wang, J.W.; Wu, Q.; Liang, M.T.; Yuan, Y.M.; Wu, T.; Liu, M.Y.; Wu, Q.Y.; Huang, K. Effect of selenium-sulfur interaction on the anabolism of sulforaphane in broccoli. Phytochemistry 2020, 179, 112499. [Google Scholar] [CrossRef]
  20. Bednarek, P.; Piślewska-Bednarek, M.; Ver Loren van Themaat, E.; Maddula, R.K.; Svatoš, A.; Schulze-Lefert, P. Conservation and clade–specific diversification of pathogen-inducible tryptophan and indole glucosinolate metabolism in Arabidopsis thaliana relatives. New Phytol. 2011, 192, 713–726. [Google Scholar] [CrossRef]
  21. Simon, M.; Tamara, G. Regulation of glucosinolate biosynthesis. J. Exp. Bot. 2020, 72, 70–91. [Google Scholar]
  22. Sun, B.; Liu, N.; Zhao, Y.T.; Yan, H.Z.; Wang, Q.M. Variation of glucosinolates in three edible parts of Chinese kale (Brassica alboglabra Bailey) varieties. Food Chem. 2011, 124, 941–947. [Google Scholar] [CrossRef]
  23. Chen, X.J. Investigation of Glucosinolates and Their Effect Factors in Chinese Brassica Vegetables; Zhejiang University: Hangzhou, China, 2006. [Google Scholar]
  24. Li, Z.S.; Zheng, S.N.; Liu, Y.M.; Fang, Z.Y.; Yang, L.M.; Zhuang, M.; Zhang, Y.Y.; Lv, H.H.; Wang, Y.; Xu, D.H. Characterization of glucosinolates in 80 broccoli genotypes and different organs using UHPLC-Triple-TOF-MS method. Food Chem. 2021, 334, 127519. [Google Scholar] [CrossRef] [PubMed]
  25. Li, P.W. Glucosinolate and Their Relationship between Leaves and Seeds in Brassica napus; Huazhong Agricultural University: Wuhan, China, 2007. [Google Scholar]
  26. Bhandari, S.R.; Jo, J.S.; Lee, J.G. Comparison of glucosinolate profiles in different tissues of nine Brassica Crops. Molecules 2015, 20, 15827–15841. [Google Scholar] [CrossRef] [PubMed]
  27. Li, Y. Study on Insect Resistance with Glucosinolate Accumulation and Changes in Glucosinolate Concentrations after Feeding by Pests in Brassicaceae and Characterization of Glucosinolate Biosynthetic Genes in Brassica nigra and Brassica juncea; Zhejiang A&F University: Zhejiang, China, 2019. [Google Scholar]
  28. Sun, B.; Tian, Y.X.; Chen, Q.; Zhang, Y.; Luo, Y.; Wang, Y.; Li, M.Y.; Gong, R.G.; Wang, X.R.; Zhang, F.; et al. Variations in the glucosinolates of the individual edible parts of three stem mustards (Brassica juncea). R. Soc. Open Sci. 2019, 6, 182054. [Google Scholar] [CrossRef]
  29. Brown, P.D.; Tokuhisa, J.G.; Reichelt, M.; Gershenzon, J. Variation of glucosinolate accumulation among different organs and developmental stages of Arabidopsis thaliana. Phytochemistry 2003, 62, 471–481. [Google Scholar] [CrossRef]
  30. Jeon, B.W.; Oh, M.H.; Kim, E.O.; Kim, H.S.; Chae, W.B. Different vegetative growth stages of Kimchi cabbage (Brassica rapa L.) exhibit specific glucosinolate composition and content. Hortic. Environ. Biotechnol. 2018, 59, 355–362. [Google Scholar] [CrossRef]
  31. Kim, Y.B.; Li, X.H.; Kim, S.J.; Kim, H.H.; Lee, J.; Kim, H.R.; Park, S.U. MYB transcription factors regulate glucosinolate biosynthesis in different organs of Chinese cabbage (Brassica rapa ssp.pekinensis). Molecules 2013, 18, 8682–8695. [Google Scholar] [CrossRef]
  32. Chen, X.J.; Zhu, Z.J.; Gerendas, J.; Zimmermann, N. Glucosinolates in Chinese Brassica campestris vegetables: Chinese cabbage, purple cai-tai, choysum, pakchoi, and turnip. HortScience 2008, 43, 571–574. [Google Scholar] [CrossRef]
  33. Dam, N.M.V.; Tytgat, T.O.G.; Kirkegaard, J.A. Root and shoot glucosinolates: A comparison of their diversity, function and interactions in natural and managed ecosystems. Phytochem. Rev. 2009, 8, 171–186. [Google Scholar]
  34. Petersen, B.L.; Chen, S.X.; Hansen, C.H.; Olsen, C.E.; Halkier, B.A. Composition and content of glucosinolates in developing Arabidopsis thaliana. Planta 2002, 214, 562–571. [Google Scholar] [CrossRef] [PubMed]
  35. Huseby, S.; Koprivova, A.; Lee, B.R.; Saha, S.; Mithen, R.; Wold, A.B.; Bengtsson, G.B.; Kopriva, S. Diurnal and light regulation of sulphur assimilation and glucosinolate biosynthesis in Arabidopsis. J. Exp. Bot. 2013, 64, 1039–1048. [Google Scholar] [CrossRef] [PubMed]
  36. Jeschke, V.; Weber, K.; Moore, S.S.; Burow, M. Coordination of glucosinolate biosynthesis and turnover under different nutrient conditions. Front. Plant Sci. 2019, 10, 1560. [Google Scholar] [CrossRef] [PubMed] [Green Version]
  37. Sønderby, I.E.; Geu-Flores, F.; Halkier, B.A. Biosynthesis of glucosinolates-gene discovery and beyond. Trends Plant Sci. 2010, 15, 283–290. [Google Scholar] [CrossRef]
  38. Tian, Z.T. Genetic Study of Glucosinolate in Rapeseed by Associative Transcriptomics; Chinese Academy of Agricultural Sciences: Beijing, China, 2018. [Google Scholar]
Figure 1. The concentration of sinigrin was diluted by gradient and determined by HPLC. Calculation formula: D1 = relative influence factor *X/m. (D1: contents of glucosinolates in dried mustard; Unit: μmol/g DW; X:X value in the standard curve; m: quality of mustard samples).
Agronomy 12 02287 g001
Figure 2. Variation of total glucosinolate contents in different mustard resources’ leaves.
Agronomy 12 02287 g002
Figure 3. Variation of aliphatic glucosinolate contents in different mustard resources’ leaves. The aliphatic glucosinolates are progoitrin (PRO), sinigrin (SIN), n-hexyl-GLs, glucobrassicanapin (GBN), gluconapin (NAP), respectively.
Agronomy 12 02287 g003
Figure 4. Variation of indole glucosinolate contents in different mustard resources’ leaves. The indole glucosinolates are 4-Hydroxyglucobrassicin (4OH), glucobrassicin (GBC), 4-Methoxyglucobrassicin (4ME), neoglucobrassicin (NEO), respectively.
Agronomy 12 02287 g004
Figure 5. (A) cluster analysis of mustard resources based on the different performances of 30 agronomic traits. The distance matrix was grouped using the unweighted pair-group method with arithmetic mean after the Euclidean distance coefficients among the columns of the data matrix were calculated. The tested materials were clustered into three groups at the genetic distance of 56.7; and (B) morphological characteristics of some mustard resources.
Agronomy 12 02287 g005
Figure 6. Cluster analysis of mustard resources based on glucosinolate contents. Used the same method as above, 60 mustard resources were divided into three groups at the Euclidean distance of 90.0. (Blue: group I; red: Group II; green: group III).
Agronomy 12 02287 g006
Figure 7. Differential distribution of glucosinolates among different periods in the same part in mustard JC 18-56. The sinigrin glucosinolate contents (A), total glucosinolate contents (B), aliphatic glucosinolate contents (C), indole glucosinolate contents (D) of the seedling phase, rosetting phase, harvesting phase, bolting phase, flowering phase, pod-setting phase in the whole plant, root, leaf, stem, flower stem, alabastrum, flower, silique, and seed tissues.
Agronomy 12 02287 g007
Figure 8. Differential distribution of glucosinolates among different parts in the same period in mustard JC 18-56: the total glucosinolate contents (A); sinigrin glucosinolate contents (B); aliphatic glucosinolate contents (C); and indole glucosinolate contents (D) of the whole plant, root, leaf, stem, flower stem, alabastrum, flower, silique, and seed tissues in the seedling stage, rosetting phase, harvesting phase, bolting phase, flowering phase, and pod-setting phase.
Agronomy 12 02287 g008
Figure 9. Correlation analysis of different parts in different growth stages of mustard resource JC 18-56. (R: rosetting phase; H: harvesting phase; B: bolting phase; F: flowering phase; P: pod−setting phase). The orange color in the graph represents positive correlation, and the blue color represents negative correlation. The color is darker, the correlation is stronger.
Agronomy 12 02287 g009
Table 1. The origin of all 60 leafy mustard resources.
GermplasmsOriginGermplasmsOriginGermplasmsOriginGermplasmsOrigin
JC 18-01BeijingJC 18-16HunanJC 18-31FujianJC 18-46Fujian
JC 18-02BeijingJC 18-17HunanJC 18-32FujianJC 18-47Fujian
JC 18-03BeijingJC 18-18HunanJC 18-33FujianJC 18-48Fujian
JC 18-04BeijingJC 18-19HunanJC 18-34FujianJC 18-49Fujian
JC 18-05BeijingJC 18-20HunanJC 18-35FujianJC 18-50Fujian
JC 18-06BeijingJC 18-21HunanJC 18-36FujianJC 18-51Fujian
JC 18-07BeijingJC 18-22HunanJC 18-37FujianJC 18-52Fujian
JC 18-08BeijingJC 18-23HunanJC 18-38FujianJC 18-53Fujian
JC 18-09HunanJC 18-24HunanJC 18-39FujianJC 18-54Fujian
JC 18-10HunanJC 18-25HunanJC 18-40FujianJC 18-55Fujian
JC 18-11HunanJC 18-26HunanJC 18-41FujianJC 18-56Hunan
JC 18-12HunanJC 18-27HunanJC 18-42FujianJC 18-57Guangxi
JC 18-13HunanJC 18-28HunanJC 18-43FujianJC 18-58Guangxi
JC 18-14HunanJC 18-29HunanJC 18-44FujianJC 18-59Guangxi
JC 18-15HunanJC 18-30HunanJC 18-45FujianJC 18-60Guangxi
Table 2. Sampling information for leaf mustard JC 18-56 during the whole growth periods.
StagesSamples
Seedling phaseThe whole seedlings
Rosetting phaseRoots, leaves
Harvesting phaseRoots, leaves
Bolting phaseRoots, stems, leaves, flower stems, alabastrums
Flowering phaseRoots, stems, leaves, flower stems, alabastrums, flowers
Pod-setting phaseRoots, stems, flower stems, siliques
Seed maturity phaseSeeds
Table 3. The national standard for assigning a value for quantitative traits.
Quantitative TraitsValues Assigned
(Based on the National Standard)
Cotyledon colorflavovirens = 1; light green = 2; green = 3; bottle green = 4
Hypocotyl colorwhite green = 1; flavovirens = 2; light green = 3; green = 4;
light purple = 5
Blade profilemottle-leaf = 1; plate leaf = 2
Phylliformobovate = 5; broadly obovate = 6; long obovate = 7; elliptical = 8; broadly elliptic = 9; long ova = l0; fan-shaped = 11; lanceolate = 12;
oblanceolate = 13
Leaf apical shapepointed = 1; blunt = 2; circle = 3; wide circle = 4
Leaf margin toothentire = 1; undulate = 2; serrulate = 3; serrate = 4; doubly serrate = 5
Leaf cleftno crack = 0; shallow crack = 1; drastic crack = 2; through shake = 3
Leaf surfacesmoothness = 1; slightly wrinkled = 2; wrinkled = 3; many wrinkles = 4
Leaf bristlesrno = 0; yes = 1
Leaf wax powderno = 0; yes = 1
Leaf lusterno = 0; yes = 1
Leaf colorflavovirens = 1; light green = 2; green = 3; bottle green = 4; purple = 5; purple green = 6
Petiole colorwhite = 0; white green = 1; light green = 2; green = 3
Petiole cross section shapewide flat = 1; wide thick = 2; medium round = 3; narrow circle = 4
Leaf nodulesno = 0; yes = 1
Moss drawingvery early = 1; early = 2; mediun = 3; late = 4; very late = 5
Flower stem colorflavovirens = 1; pale green = 2; green = 3
Plant shapeupright = 1; half upright = 2; plantlet spreading = 3; collapsed = 4
Table 4. Analysis on quantitative characters of 60 mustard resources.
CharactersMaximumMinimumMeanRS.D.A.D.CV%
Cotyledon length (mm)19.9810.9015.209.082.121.7111.24
Cotyledon width (mm)24.7212.5217.4912.202.612.1012.02
Groove depth (mm)4.941.823.223.120.690.5918.28
Plant height (mm)176.0038.0090.37138.0043.3839.2643.45
Plant width (mm)125.0038.0071.5787.0016.0512.2817.16
Rosette number19.000.007.8719.004.103.1339.80
Leaf length (mm)95.0030.0050.8965.0010.708.2016.10
Leaf width (mm)36.0012.0021.9324.005.314.2719.46
Petiole width (mm)7.000.602.306.401.220.9340.41
Main moss height (mm)176.0030.00125.07146.0037.4229.0423.22
Main moss thick (mm)11.500.503.1911.001.570.9730.56
Moss per plant23.000.008.3323.004.173.1037.20
R: range; S.D.: standard deviation; A.D.: average deviation; CV%: the coefficient of variation.
Table 5. Analysis on qualitative characters of 60 mustard resources.
CharactersMax./(%)Min./(%)MeanRS.D.A.D.CV%
Cotyledon color4/(11.67%)1/(11.67%)2.6530.830.6925.97
Hypocotyl color5/(43.33%)1/(55.00%)3.2541.971.9560.00
Blade profile2/(15.00%)1/(85.00%)1.8510.360.2613.78
Phylliform13/(6.67%)5/(11.67%)8.4581.861.3315.76
Leaf apical shape4/(18.33%)1/(5.00%)2.4830.850.7429.69
Leaf margin tooth5/(13.33%)1/(13.33%)2.8241.311.1942.33
Leaf cleft3/(35.00%)0/(31.67%)1.4031.251.1582.38
Leaf surface4/(28.33%)1/(3.33%)1.8730.690.4926.31
Leaf luster1/(68.33)0/(31.67%)0.3210.470.43136.67
Plant shape4/(28.33%)1/(16.67%)2.2531.040.8839.26
Leaf color6/(8.33%)1/(6.67%)3.0351.050.5618.35
Leaf wax powder1/(11.67%)0/(88.33%)0.8810.320.2123.33
Leaf bristles1/(90.00%)0/(10.00%)0.1010.300.18180.00
Petiole color3/(8.33%)0/(35.00%)1.9530.960.7739.40
Petiole cross section shape4/(26.67%)1/(30.00%)2.4531.181.0643.20
Leaf nodules1/(96.67%)0/(3.33%)0.0310.180.06193.33
Moss drawing5/(10.00%)1/(20.00%)3.1541.241.0031.59
Flower stem color3/(5.00%)1/(61.67%)2.5720.590.5320.82
Max./(%): the maximum value and the percentage of the maximum value in the group; Min./(%): the minimum value and the percentage of the minimum value in the group; R: range; S.D.: standard deviation; A.D.: average deviation; CV%: the coefficient of variation.
Table 6. Correlation between quantitative traits and glucosinolate contents in 60 mustard resources.
Cotyledon LengthCotyledon WidthGroove DepthPlant HeightPlant WidthRosette
Number
Glucosinolate contents0.036−0.0450.019−0.0380.144−0.097
Leaf lengthLeaf widthPetiole widthMain moss heightMain moss thickMoss per plant
Glucosinolate contents0.2000.0180.189−0.2290.2540.127
Table 7. Correlation between quality traits and glucosinolate contents in 60 mustard resources.
Cotyledon ColorHypocotyl ColorBlade ProfilePhylliformLeaf
Apical Shape
Leaf Margin Tooth
Glucosinolate contents−0.123−0.047−0.0010.1540.079−0.134
Leaf cleftLeaf surfaceLeaf lusterPlant shapeLeaf colorLeaf wax
powder
Glucosinolate contents0.0260.003−0.0630.192−0.328 *0.088
Leaf
bristles
Petiole colorPetiole cross section shapeLeaf nodulesMoss drawingFlower stem color
Glucosinolate contents0.121−0.017−0.0580.135−0.029−0.162
* indicate significance at 0.05 probability levels.
Publisher’s Note: MDPI stays neutral with regard to jurisdictional claims in published maps and institutional affiliations.

