Article

Comprehensive Assessment of the Influence of Applying Two Kinds of Chicken-Manure-Processed Organic Fertilizers on Soil Properties, Mineralization of Nitrogen, and Yields of Three Crops

1
Department of Soil and Environmental Sciences, National Chung Hsing University, Taichung 40227, Taiwan
2
Innovation and Development Center of Sustainable Agriculture, National Chung Hsing University, Taichung 40227, Taiwan
*
Author to whom correspondence should be addressed.
Agronomy 2022, 12(10), 2355; https://doi.org/10.3390/agronomy12102355
Submission received: 23 August 2022 / Revised: 22 September 2022 / Accepted: 26 September 2022 / Published: 29 September 2022
(This article belongs to the Special Issue Applied Research and Extension in Agronomic Soil Fertility)

Abstract

:
(1) Background: Excessive use of chemical fertilizers accelerates soil acidification and increases greenhouse gas emissions. In this context, the farmland application of organic fertilizers not only reuses agricultural waste but also improves soil quality. (2) Methods: Two organic fertilizers made from chicken manure—G508 and G509—were field applied, implementing once or twice (denoted by X1 and X2, respectively) the recommended amount of nitrogen for three crops. In addition, an incubation experiment was conducted to assess the mineralization of the organic fertilizers. (3) Results: G508 did not undergo a composting process and, thus, had a higher content of nitrogen compared to G509. Therefore, although the soil properties improved under G509, the total mineral nitrogen released was lower than G508. Compared to chemical fertilizer treatment, the application of G508 and G509 increased the soil’s pH value, concentrations of organic matter, available phosphorus, and exchangeable concentrations of potassium, calcium, and magnesium. In addition, the crop yield under G508X2 treatment was even higher than that under chemical fertilizer treatment. (4) Conclusions: Although G508 and G509 were both processed using chicken manure, they exhibited different nutrient-release behaviors during mineralization and also had different influences on the soil properties and growth of the three crops.

1. Introduction

1.1. Characteristics of Organic Fertilizer

The application of organic fertilizers has been shown to enhance the soil quality [1]. In conventional cultivation, the content of soil organic matter (OM) is depleted by the long-term application of chemical fertilizers. Soil OM is helpful in promoting the formation of soil aggregates, which increases soil porosity, saturated hydraulic conductivity, and available water content, while also decreasing its bulk density [2,3]. Moreover, soil treated with manure has been demonstrated to increase its water-holding capacity (WHC) as well as decrease its bulk density [4]. Furthermore, soil aggregate stability has been observed to increase significantly in the case of its treatment with turkey manure-processed organic fertilizer compared to chemical fertilizer treatment [5]. Moreover, excessive application of chemical fertilizers has been found to result in soil acidification, increased emission of greenhouse gases, and possibly eutrophication as a result of the erosion of nutrients into surrounding rivers or lakes [6,7]. In contrast, crops grown using organic fertilizer-amended soil have produced yields that are similar to chemical fertilizers, although nutrient release of organic fertilizer was slower [8,9,10]. Even through each kind of organic fertilizer has its own nutrient-releasing behavior after soil application; however, relative to chemical fertilizer treatment, the application of chicken-manure-processed organic fertilizer can significantly increase the content of organic carbon, available nitrogen (N), available phosphorus (P), and exchangeable potassium (K) in soil [11,12,13]. Moreover, the results of a four-year field experiment conducted by Tewolde et al. [7] also demonstrated that the application of chicken-manure-processed organic fertilizers alleviated the acidification of soil compared to chemical fertilizer treatment. However, the soil’s electrical conductivity (EC) increased significantly on being amended by different manures in another field study [14]. Although the soil application of chicken-manure-processed organic fertilizer was reported to increase P and K content in wheat and corn, there was no significant difference between the yields when compared with chemical fertilizer treatment [12].

1.2. Mineralization of Organic Fertilizer

Mineralization is a microorganism-dominated process that transforms nutrients from their organic into their inorganic forms, which can then be absorbed by crops. Cassity-Duffey [15] conducted a 99-day mineralization experiment during which 47 kinds of organic fertilizers were applied to soil. The results showed that organic fertilizers with a high carbon (C) to N ratio (C/N ratio) released lower inorganic N content. Manures of chicken, cattle, and sheep were applied to the soil [16], after which a maximum concentration of ammonium-N (NH4+-N) was noted on the 20th day after application and then decreased from the 30th day onward, possibly due to volatilization, nitrification, or immobilization. A 16-week incubation experiment was conducted by Rasouli-Sadaghiani and Dikinya [17], where sludge and manures of chicken, sheep, and cattle were applied to soil at 3% dose. The maximum concentration of nitrate-N (NO3-N) in the soil was observed in the 2nd week after applying the above materials; however, the concentrations of NO3-N decreased as a result of immobilization. Rothé et al. [18] also demonstrated that soil amended with chicken-manure-processed compost could raise the concentration of inorganic N in the soil and, in turn, the concentration of N in the crop.
The transformation of N is determined by the soil’s pH. At pH 7.5, the transformation of NH4+ to NO3 has been observed to be rapid, thus minimizing the volatilization of NH3 [19]. The suitable pH range for nitrification is between 6.6 and 8.0; therefore, the rate of nitrification decreased when the soil’s pH was less than 6.0, and nitrification did not occur when the soil’s pH decreased to less than 4.5 [20]. Soils with pH values of 5.4, 7.6, and 9.9, respectively, were used by Cui et al. [21] to study the mineralization of N. The experimental results showed that the concentrations of NH4+-N and NO3-N released by acidic soil were quite low. For neutral soil, NH4+-N was released in the beginning and then decreased after 40 days; moreover, the concentration of NO3-N increased from the 50th day. In alkaline soil, a maximum concentration of NO3-N was determined on the 20th day. The results of this study are consistent with those observed by Bergamasco et al. [22], who found a higher concentration of NO3-N in soil with neutral pH; however, the concentration could not be detected when the soil’s pH was less than 4.5. Since organic acids are released during the mineralization of organic fertilizers, the soil’s pH is also affected by the type and amount of organic fertilizer applied. A decrease in the soil’s pH after the application of organic fertilizers and sludges has been reported by previous studies [23,24]. Furthermore, besides its pH, the application of manures [25] and organic fertilizers [23] also increases the soil’s EC.

1.3. Impact of Organic Fertilizer on the Environment

The soil application of organic fertilizers might have negative influences on the environment resulting from heavy metals, microorganisms, and other pollutants if applied improperly. Since chicken-manure-processed organic fertilizers might have high copper (Cu) and zinc (Zn) content, there are two regulations used in Taiwan for managing heavy metals in fertilizers during land application. The limitations to Cu and Zn content in chicken-manure-processed organic fertilizer, as announced by the Agriculture and Food Agency of Agriculture of Council (AFA of COA) of Taiwan, are 100 and 500 mg kg−1, respectively. Additionally, for croplands, the control standards of Cu and Zn announced by the Environmental Protection Administration (EPA) of Taiwan are 200 and 600 mg kg−1, respectively. A high content of Cu is harmful for germination and may even cause the death of seedlings [26,27,28]. Furthermore, the yield and growth hormone were also observed to be reduced under high Zn concentrations. Moreover, a high content of Zn inhibits root growth and, therefore, the uptake of nutrients [29,30,31].
Manures of poultry and livestock contain coliform bacteria, which are responsible for food poisoning. Therefore, according to the AFA of the COA in Taiwan, a heating process is necessary to process manures into organic fertilizers. Many previous studies have reported that heating at 55 °C for 2 h could decrease the coliform bacteria to less than 1000 MPN g−1 [32,33,34]. In addition to heating, Chang et al. [35] used gaseous ozone to treat chicken manure to find that the number of coliform bacteria was not detectable under 50.05 mg L−1 treatment. Flies are another problem involved in the utilization of chicken manure. With suitable water content and temperature, fly eggs might hatch in such manure [36].

1.4. Objectives

The present study used two chicken-manure-processed commercial organic fertilizers—G508 and G509—permitted for use by the AFA of the COA of Taiwan with registration numbers 0280009 and 1053001, respectively. The materials used to process these two organic fertilizers are not accessible by the public as they are a commercial secret. However, G508 was produced using a mixture of chicken manure (≥50%), husk, and saw dust, which is then granulated and heated at 70 °C for at least 30 min, according to the regulations for G508. Similar materials as G508 were used to produce G509, with the only difference being that a composting process was conducted instead of heating. It remains to be seen whether or not composting has a great influence on the composition of organic fertilizer and therefore the nutrient-releasing behavior during mineralization; however, as far as we know, few studies have been conducted to compare the difference in mineralization between composted and non-composted chicken-manure-processed organic fertilizers. A field experiment and an incubation experiment were therefore conducted in this study. The objectives included assessing (1) the difference in nutrient-releasing behavior of two kinds of chicken-manure-processed organic fertilizers, and (2) the influence of different treatments on the soil properties and yields of three crops.

2. Materials and Methods

2.1. Field Experiment and Analysis

Field experiments were conducted from February 2021 to June 2021 in a cropland having two separate blocks—block A and block B—with a total area of 0.26 ha, located in Chunghua County in Central Taiwan. Surface soil samples—0–20 cm—before and after the field experiment were collected. Three soil samples collected in the same treatment were mixed to form a composite sample, which was then air dried, ground, and passed through 10-, 80-, or 100-mesh stainless sieves according to the properties analyzed. The pH [37], EC [38], OM [39], wet aggregate stability (WAS) [40], available N [41], and exchangeable cation [42] were analyzed. Furthermore, the available P was analyzed depending on the soil’s pH value. The Olsen method [43] and the Bray No.1 method [44] were used to extract the available P in alkaline and acidic soils, respectively. Furthermore, the total and available concentrations of Cu and Zn in the soil were analyzed using the aqua regia method [45] and the 0.05 M EDTA method [46], respectively. All the extractants and digestants were filtered through Whatman No. 42 filter paper and quantitated. The Ca, Mg, Cu, and Zn concentrations in the extractants or the filtered digestants were determined by employing an atomic absorption spectrophotometer (AAS; Z-2000, HITACHI, Tokyo, Japan). Meanwhile, the K concentration in the filtered digestants was determined using a flame photometer (FA; M410, Sherwood, Cambridge, UK). The water content [47], pH [37], EC [38], and OM [39] of G508 and G509 were also determined. The two organic fertilizers were digested with sulfuric acid and hydrogen peroxide, after which the total concentrations of N, P2O5, K2O, CaO, and MgO were determined using the method outlined above. The concentrations of heavy metals in the digestants were determined by inductively coupled plasma optical emission spectroscopy (ICP-OES, Perkin Elmer Avio 200, Waltham, MA, USA). Moreover, the most probable number (MPN) of coliform bacteria was estimated by the Soil Survey and Testing Center of Nation Chung University, in accordance with Loncarevic et al. [48]. Irrigation waters were collected at different inlets and filtered through Whatman filter paper. The pH and EC as well as the concentrations of K, Ca, and Mg were determined using the methods outlined above.
The following six treatments were tested with four replications each: (1) CK (control): no amendment; (2) CF: chemical fertilizer at the recommended dose (RD) of nitrogen (N); (3) G508X1: G508 at the RD of N; (4) G508X2: G508 at two times the RD of N; (5) G509X1: G509 at the RD of N; (6) G509X2: G509 at two times the RD of N. In accordance with the recommendation of the AFA of the COA of Taiwan, the RDs of N for cabbage, Chinese cabbage, and water spinach are 300, 225 kg, and 150 kg ha−1, respectively. Chemical and organic fertilizers were applied on 20th February 2021 as the base fertilizer, while no top-dressing fertilizer was applied. The seedlings of cabbage (Brassica oleracea L. var. capitate) and Chinese cabbage (Brassica pekinensis Rupr) were planted on 25 February 2021 in block A with the same density of 1.44 × 10³ seedlings/ha. The seeds of water spinach (Ipomoea aquatica Forssk), bought from Known-You Seed Co., LTD., were sown on 25 February 2021 in block B with a density of 2.7 × 10⁶ seeds/ha.

2.2. Crop Harvest and Analysis

The mature crops of cabbage, Chinese cabbage, and water spinach were harvested after growing them for 72, 65, and 71 days, respectively. Three heads of cabbage or Chinese cabbage and thirty water spinach were harvested from each replicate of each treatment, and their fresh weights were determined. The shoot height of water spinach and the shoot height and diameter of cabbage and Chinese cabbage were also determined. Crop tissues were washed with both tap water and deionized water (DI water) and then oven dried at 65 °C for one week. After determining their dry weight, the crop tissues were ground with a grinder and then digested with sulfuric acid and hydrogen peroxide. The concentrations of N, P, K, Ca, Mg, Cu, and Zn in the digestants were determined using the method outlined above.

2.3. Incubation Experiment

A 120-day incubation experiment was performed in the growth chamber (temperature 28 ± 1 °C, humidity 60%, lighting 12 h) to assess the mineralization of N for G508 and G509. Soil samples collected from the surface layer (0–20 cm) of block A were air dried, ground, and passed through a 10-mesh stainless sieve. Except in the case of CF, the same treatments as the field experiment and RD of cabbage were used for three replications each. Briefly, homogenized mixture of 100 g air-dried soil and corresponding amount of organic fertilizer were added into a 150 mL beaker. Parafilm was used to seal the open end of each beaker, on which 30–40 small holes were poked for aeration, while DI water was added every week by weighting in order to maintain the soil water content at 50–70% of WHC during the incubation experiment. Three beakers for each treatment were taken out of the growth chamber every 10 days (coded as D0, D10, D20, etc. up to D120) to document their pH, EC, and 2 M KCl-extractable N content [41]—NH4+-N and NO3-N.

2.4. Statistical Analysis

The statistical analysis in this study was conducted using the Statistic Analysis System (SAS) v9.4 software. A one-way analysis of variance (ANOVA) was performed using the generalized linear model (GLM) across all treatments. Duncan’s New Multiple Range Test was also used to identify significant differences between the means and the statistical significance, denoted by p < 0.05.

3. Results and Discussion

3.1. Basic Properties of Soil, Organic Fertilizer, and Irrigation Water

The soils in the two blocks had significantly different characteristics (Table A1). The pH, EC, WAS, and OM of the soil in block A were 6.7–7.5, 0.1–0.3 dS m−1, 27–45%, and 0.9–1.4%, respectively. The available or exchangeable concentrations of N, P, K, Ca, and Mg were in the levels of 4.6–12.5, 7.0–14.1, 120–190, 1483–1811, and 389–424 mg kg−1, respectively. Furthermore, the total concentrations of Cu and Zn were 40–51 and 136–170 mg kg−1, respectively. The soil in block A also had low concentrations of OM, while its available P content was insufficient for the growth of most crops. In contrast, the soil in block B was more acidic than that in block A, while its EC, WAS, and OM were at the levels of 0.1–0.4 dS m−1, 42–51%, and 3.2–4.0%, respectively. The available or exchangeable concentrations of N, P, K, Ca, and Mg in the soil of block B were in the ranges of 6.6–11.9, 7.4–44.0, 126–205, 1747–2160, and 451–500 mg kg−1, respectively. The total concentrations of Cu and Zn were in the ranges of 113–141 and 259–345 mg kg−1, respectively—higher than that in block A.
Table 1 depicts the basic characteristics of the two organic fertilizers used in this study, where it is evident that G508 has a higher content of OM and total N than G509. However, its total contents of P2O5, K2O, CaO, MgO, and Zn are lower than G509. Moreover, the irrigation water in the different inlets had similar pH values; however, the irrigation water in inlets 1 and 5 had higher EC values than the others (Table A1). Meanwhile, the irrigation water in inlets 5 and 7 had higher concentrations of K and Ca than the other inlets. This phenomenon affected the EC and exchangeable cation of the soil in inlets 1 and 5, as explained in the following paragraphs.

3.2. Influence on Soil Properties

Relative to CF, the application of G508 and G509 significantly increased the soil pH (p < 0.05). However, no significant difference was observed among the organic fertilizer treatments (Figure 1). The soil’s pH under amendments by G508X2, G509X1, and G509X2 was higher than G508X1, although there was no statistical difference in general. Soil pH has a close relationship with the availability of nutrients, the activity of microorganisms, and the growth of roots. Both the organic fertilizers analyzed in this study were more alkaline than the soil tested in blocks A and B. The experimental results of this study are consistent with Wan et al. [49], who demonstrated that amendments caused by the use of organic fertilizers can decrease the acidity of soil. Although G509 had a higher pH than G508, it did not increase significantly with an increase in the amount of fertilizer applied under the G509 treatment. This phenomenon revealed that the influence on soil pH was still determined by the characteristics of the organic fertilizer applied.
The EC of the soil that grew cabbage under the G509X1 and G509X2 treatments increased significantly—2.07 and 2.05 times higher than CF, respectively. However, it decreased and increased by 47% compared to the CF under the G508X1 and G508X2 treatments, respectively, without any statistical difference (Figure 1). Relative to CF, the EC of the soil growing Chinese cabbage decreased by 37–57% under the organic fertilizer treatments. Furthermore, compared to the CF, the EC of the soil that grew water spinach increased and significantly increased (p < 0.05) by 11–96% under the G508 and G509 treatments. The soil’s EC has a close relationship with the soluble content of its salts. However, high EC has a negative influence on soil-water potential as well as the crop’s uptake of nutrients. The application of organic fertilizers has been shown to increase EC in the soil [23]. Because of the different fertilizers applied based on the N’s RD, the same amount of N was applied in the treatments with G508X1 and G509X1, while a higher amount of G509 was applied as a result of the lower N content of G509 compared to G508 (Table 1). Significantly higher amounts of K, Ca, and Mg were thus added to the G509 treatments. Therefore, in general, the soil had a higher EC than under the G508 treatments. Some of the soil EC values under CF, G508, and G509X1 went beyond the threshold of saline soil. Since the EC of the irrigation water of inlet 5 (0.81 dS m−1) was higher than the other inlets, and even though no amendment was applied to the soil that grew cabbage under the CK treatment, a higher EC was determined after the field experiment compared to other treatments (Figure 1). This phenomenon was unavoidable in this field experiment because the irrigation water could only be drawn from a surrounding channel.
Relative to CF, there was no significant influence of the different treatments on WAS after the field experiment (Figure A1). Notably, Tisdall and Oades [50] reported that there is a close relationship between WAS and soil OM content. Although the application of organic fertilizers has been demonstrated to enhance WAS [4,5], enabling the formation of a large aggregation requires a long period of time. Since only 70- to 120-day field experiments were carried out in this study, no significant influence was observed on the WAS under the G508 and G509 treatments. Moreover, the air-drying process before the analysis could also decrease WAS [51], although this viewpoint has not been supported by Arshad et al. [52].
Relative to CF, the soil OM increased and significantly increased (p < 0.05) under treatments by G508 and G509 (Figure 2). Compared to CF, the OM content of the soil that grew cabbage, Chinese cabbage, and water spinach increased by 18–59%, 30–60%, and 9–20%, respectively. Soil OM plays an important role in promoting the physical, chemical, and biological properties of soil [3,53,54]. In general, the G509 treatments exhibited a better enhancing effect on the soil OM than the G508 treatments—possibly resulting from the higher amount of G509 applied compared to G508. Moreover, since the initial OM content of the soil that grew water spinach was higher, its increasing range was lower compared to the other two crops. Moreover, during composting, different materials were added to adjust the C/N ratio in the soil to reach suitable levels for the growth of microorganisms. While most of the labile fractions in G509 were degraded during composting, most of the composition in G508 was primarily in the labile fraction. This is the reason that the soil OM under the G509 treatments was higher compared to the G508 treatments.
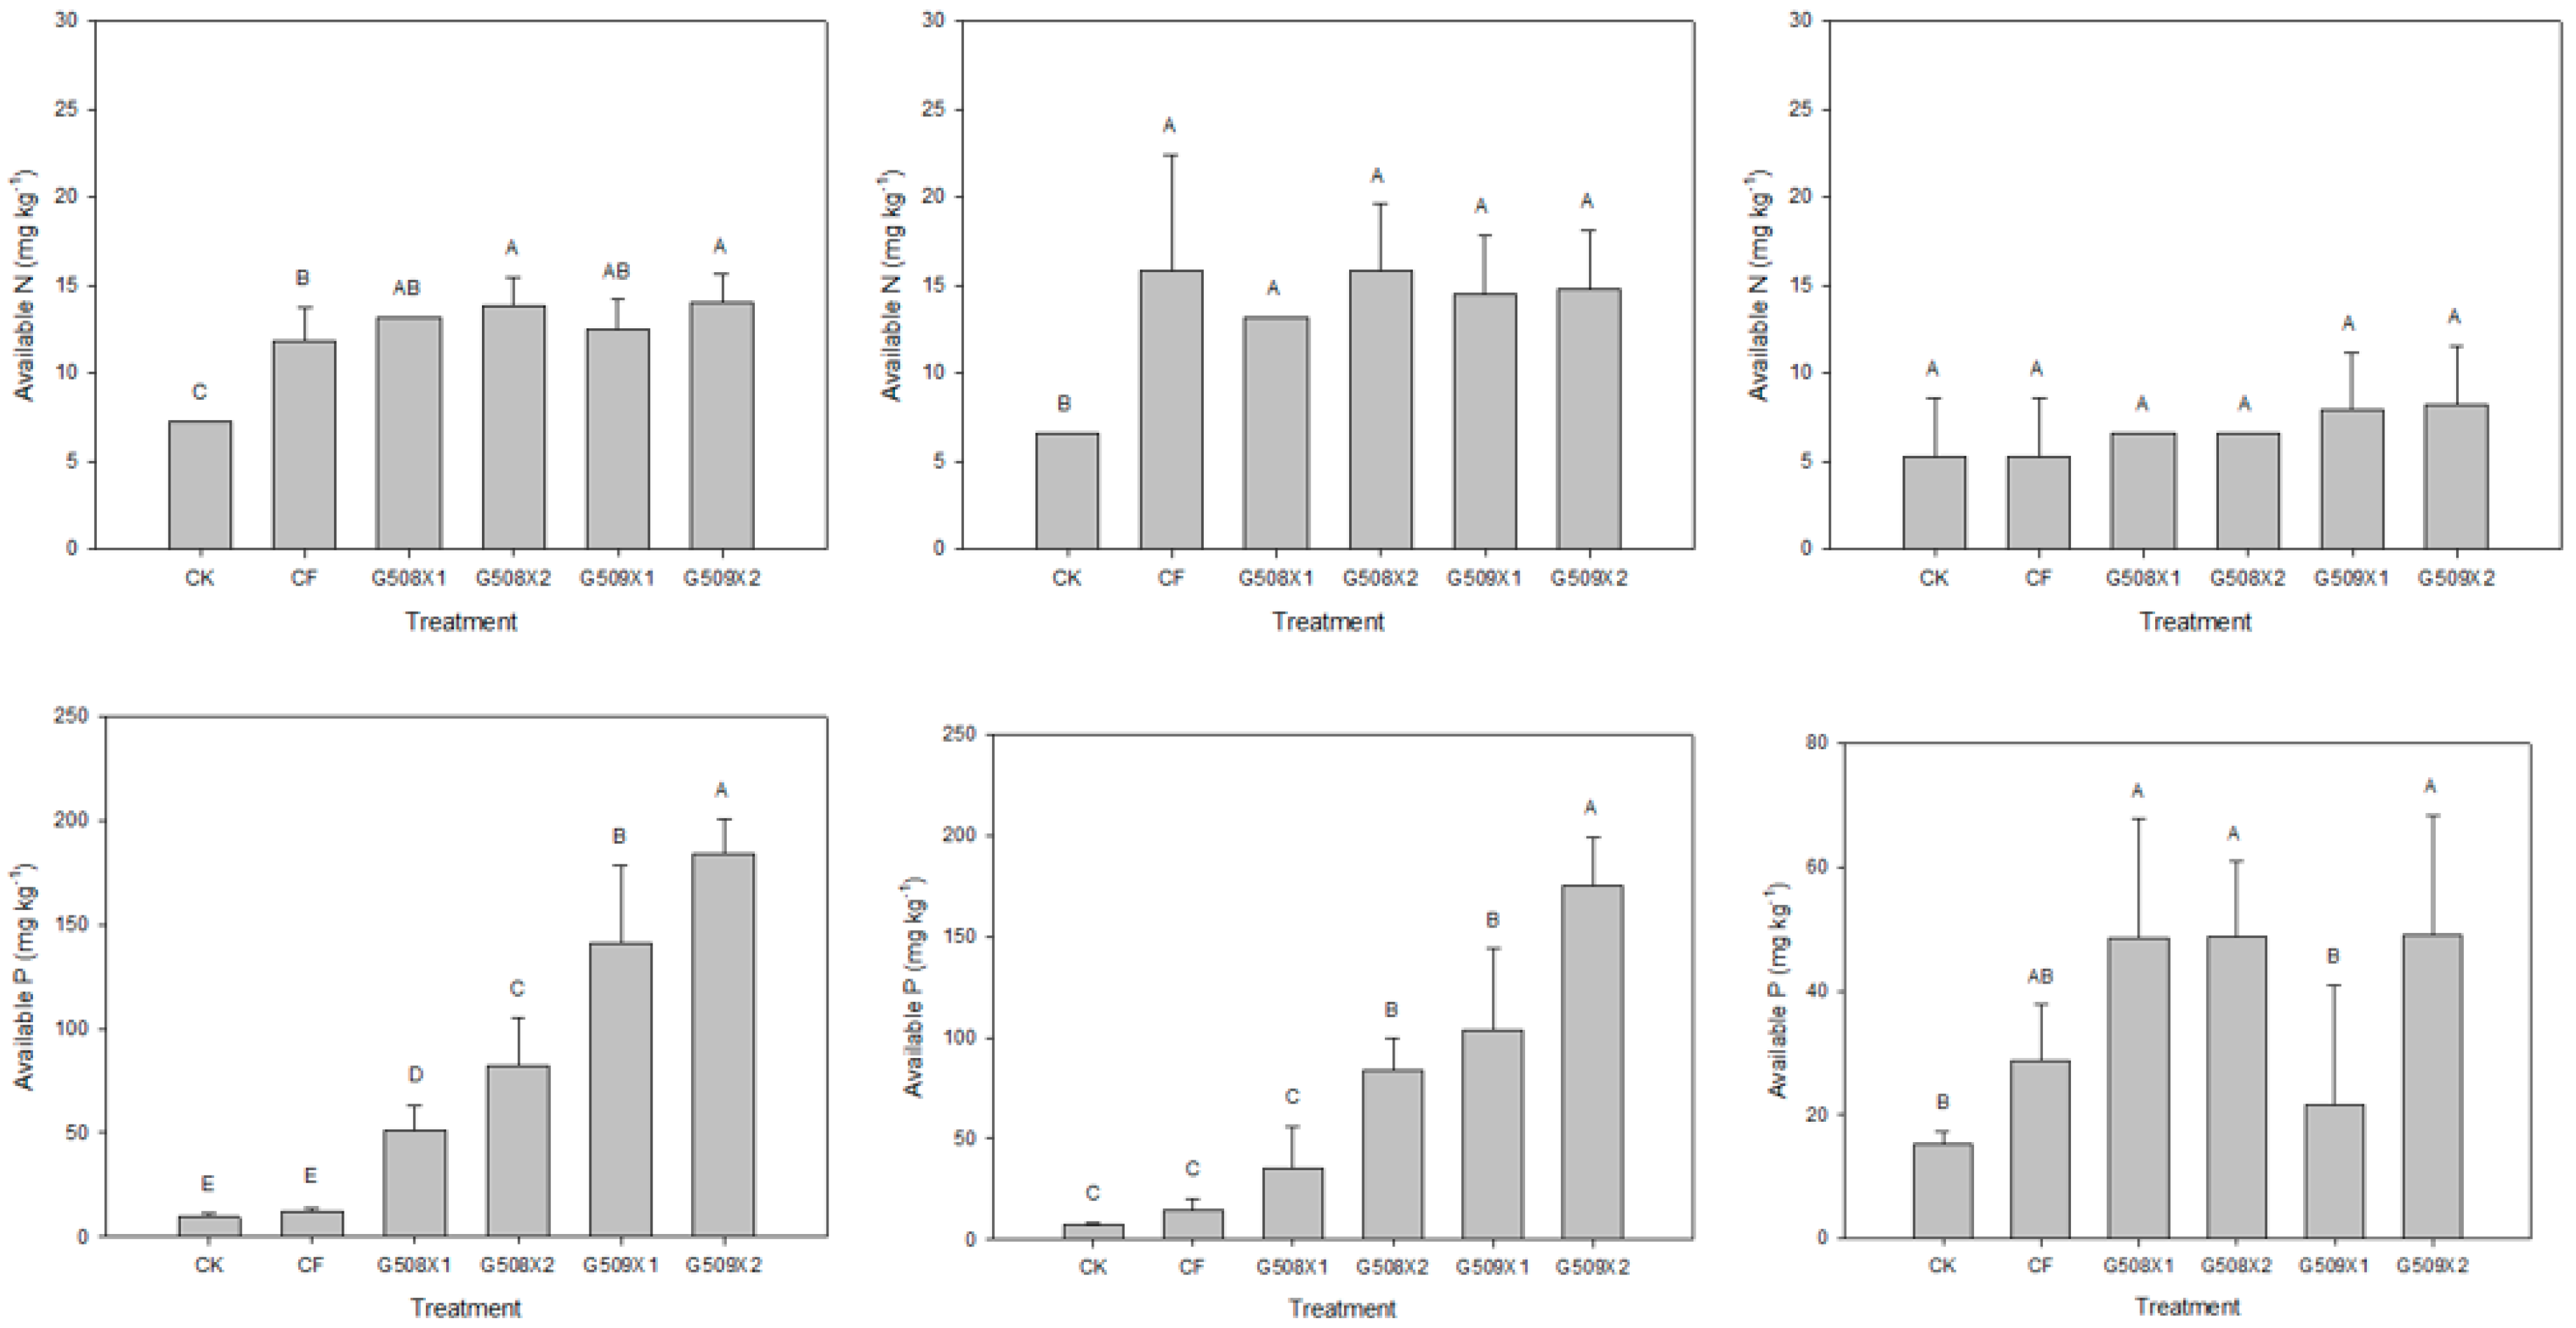
Relative to CF, amendments by G508 and G509 increased the concentration of the soil’s available N, although most of the differences were not significant (Figure 3). Compared to CF, the available N content of the soil that grew cabbage, Chinese cabbage, and water spinach increased by 6–18%, 6–18%, and 25–56%, respectively. Although highland crops prefer NO3-N [55,56], most of the 2 M KCl-extractable N was in the form of NH4+-N. Ammonium-N can transform into NO3-N through nitrification, subsequently leaching out of the soil profile. Notably, Yang et al. [57] demonstrated that NO3-N can percolate from the surface layer (0–20 cm) to the deeper layers (80–100 cm) in CF treatments or in a combination of CF and organic fertilizer treatments.
The available P content in the soils that grew cabbage, Chinese cabbage, and water spinach under treatments with G508 and G509 increased by 4.2–15.1 times, 2.5–12.2 times, and 69–71%, respectively, and the differences compared with CF were significant (p < 0.05) in general (Figure 3). Since the amount of organic fertilizer applied was based on their total N content, higher amounts of G509 were applied compared to G508. Except for water spinach, higher P2O5 content and, in turn, higher applied amount of G509 compared to G508 resulted in higher content of available P in the soil under the G509 treatments. The RD of N for cabbage was 1.3 and 2.0 times higher than Chinese cabbage and water spinach, which was also reflected in the differences in the available P content in the soil.
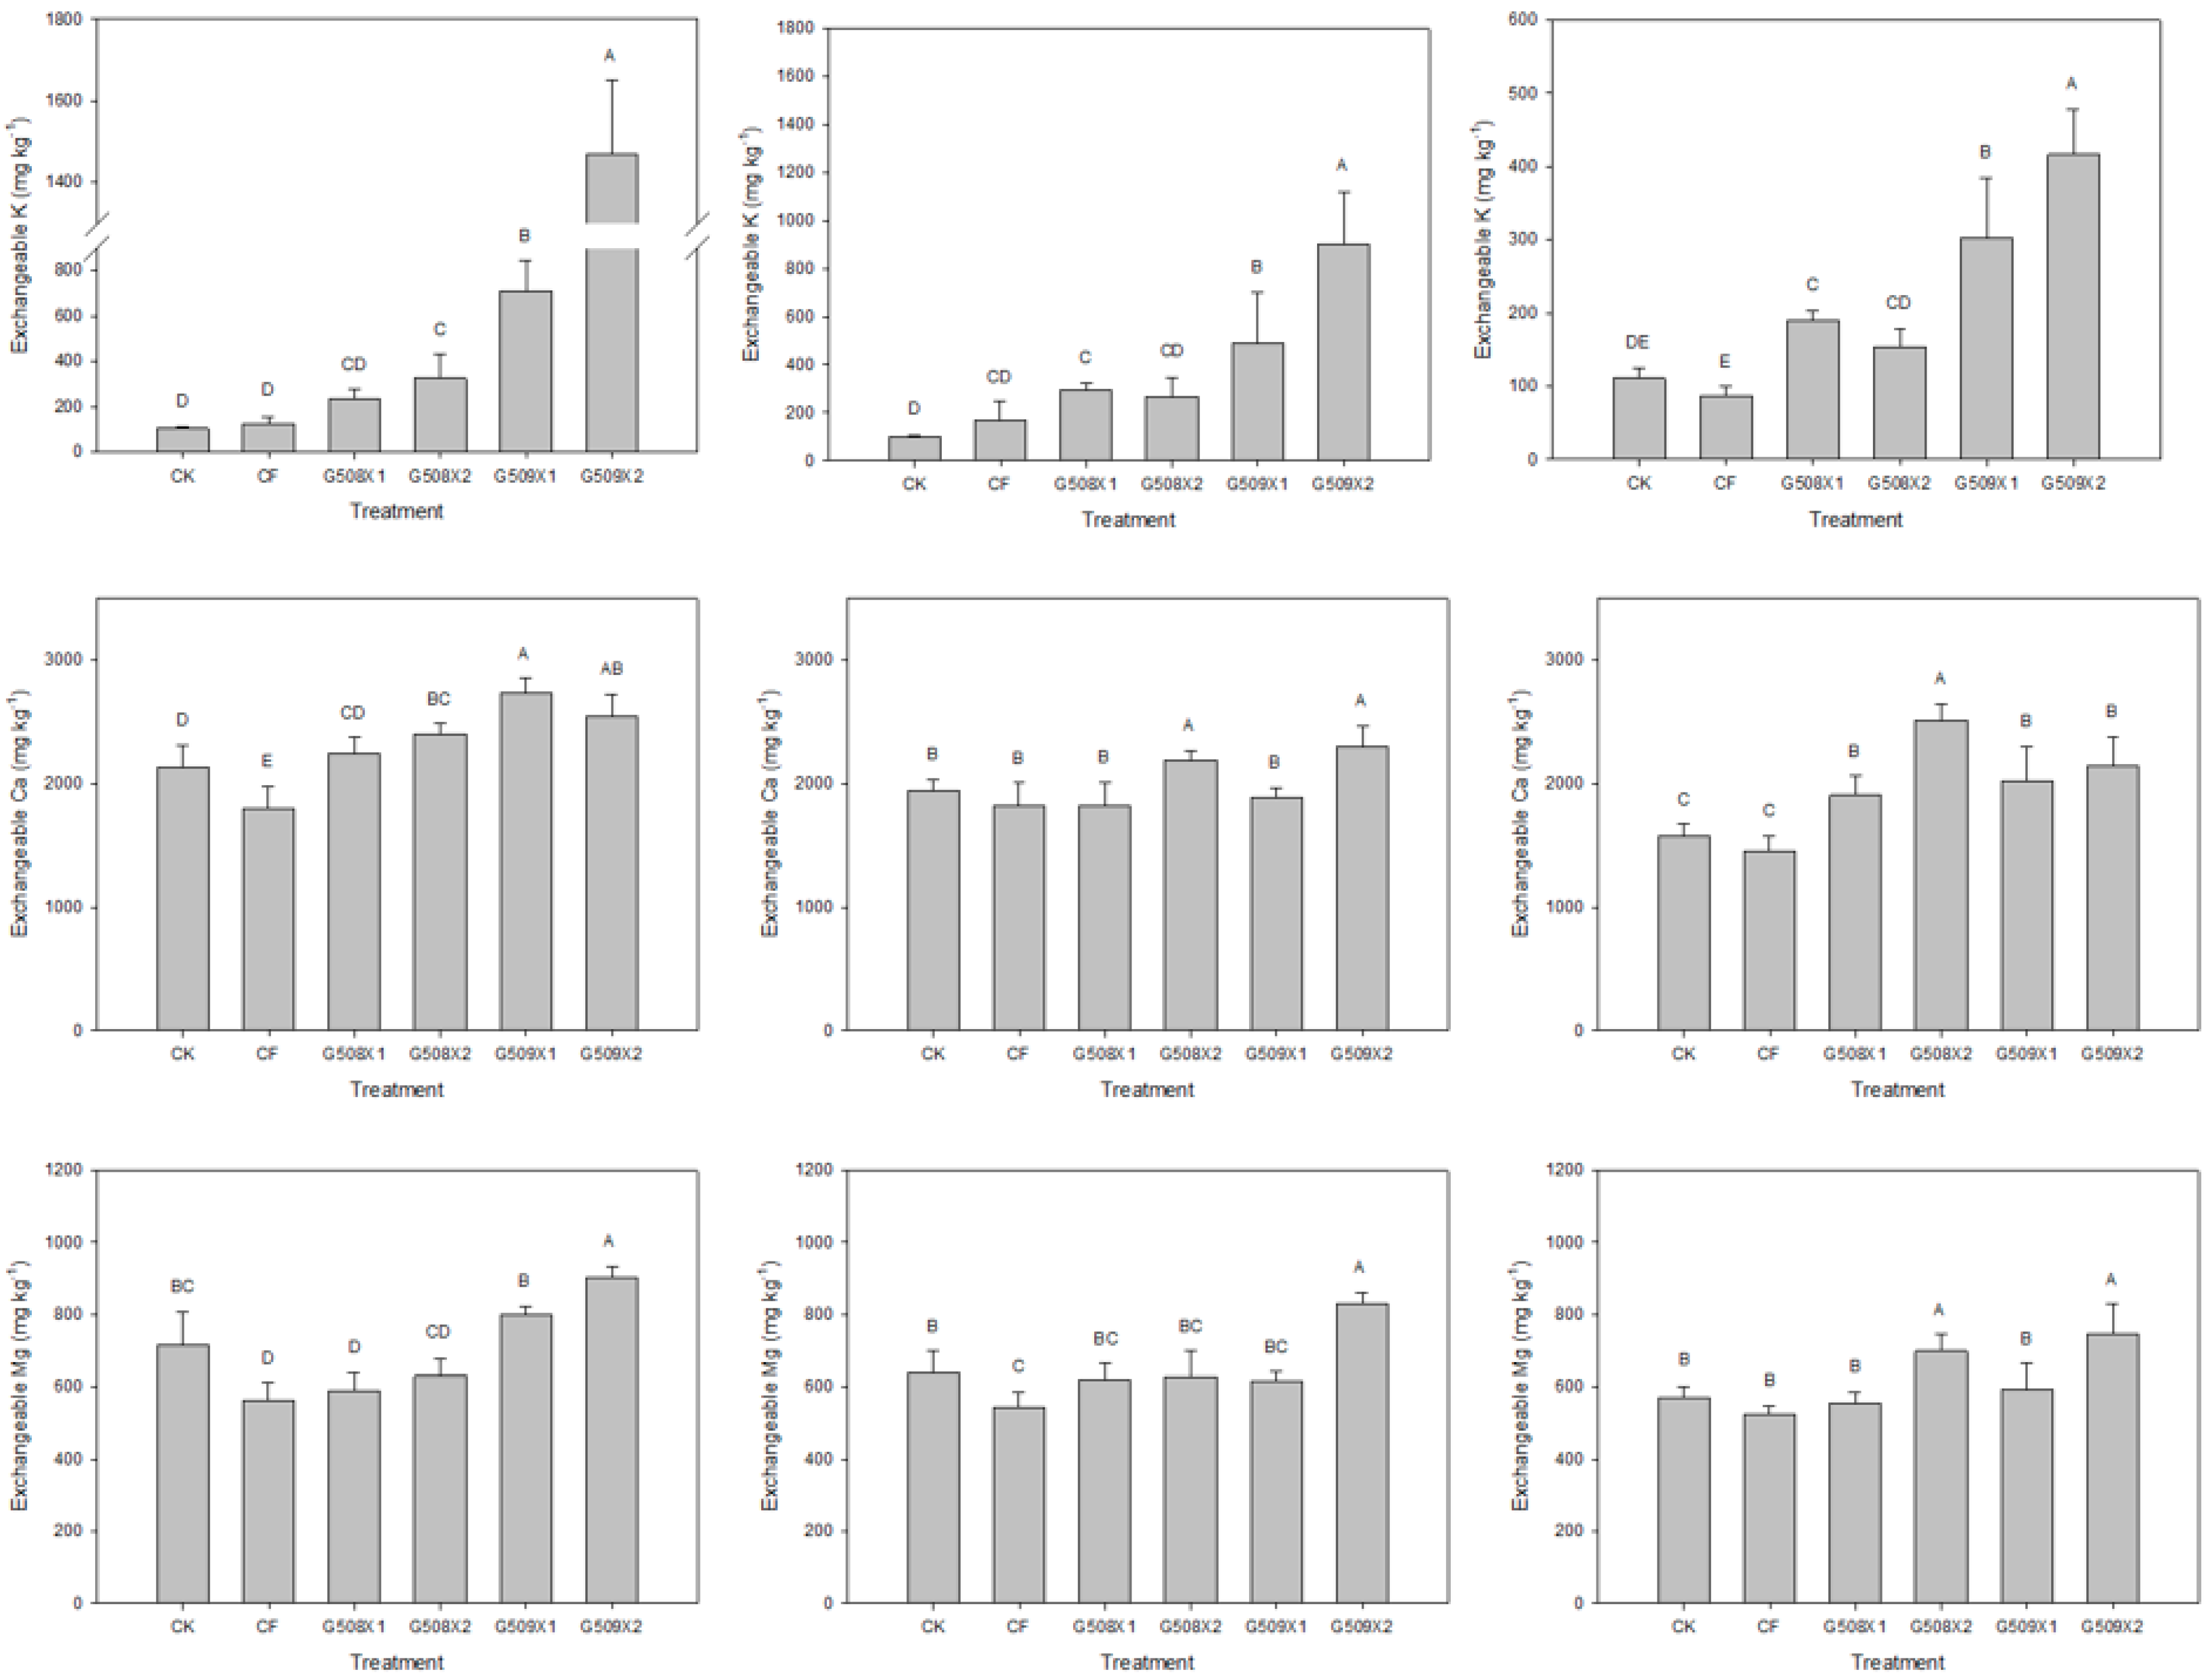
The application of G508 and G509 increased the concentrations of exchangeable cations significantly (p < 0.05) compared to CF (Figure 4). Under the two organic fertilizer treatments, the concentrations of exchangeable K in the soils that grew cabbage, Chinese, and water spinach increased by 1.9–11.8, 1.8–5.4, and 1.8–4.8 times, respectively, compared to CF. As a result of the higher K2O content in G509 compared to G508, the soil also had a higher content of exchangeable K under the G509 treatments. Notably, a high content of K in soil has been demonstrated to suppress the N uptake of plants [58]. As a result, the growth and yield of plants are inhibited due to the suppression of N, which is essential for the synthesis of protein, nucleic acid, and plant hormones. Apart from N, a high content of K also restricts the uptake of Ca and Mg in plants [59]. In effect, plants deficient in Ca result in decreases in their pectin, semi-cellulose, and cellulose, which are the primary formative elements of cell walls. Magnesium is a composition of porphyrins that act as activators of ribulose bisphosphate carboxylase and phosphoenolpyruvate carboxylase. The deficiency of Mg leads to the occurrence of chlorosis and the reduction in photosynthesis in plants. Since both the organic fertilizers had high CaO content, the experimental results demonstrated that amendments by the two organic fertilizers were able to increase the exchangeable Ca content in the soil (Figure 4). This is especially true for cabbage because of its higher amount of fertilizer application compared to the two other crops. Relative to CF, the concentrations of exchangeable Ca in the soils that grew cabbage, Chinese, and water spinach under the G508 and G509 treatments were 13–21%, 4–26%, and 31–73% higher, respectively (Figure 4). Moreover, since the irrigation water of inlet 5 had a higher concentration of Ca (77.6 mg L−1; Table A2), the soil that grew cabbage had a high content of exchange Ca, even under CK treatment—possibly because CK was located at inlet 5.
Relative to CF, the concentrations of exchangeable Mg in the soils that grew cabbage, Chinese, and water spinach under the G508 and G509 treatments were 5–60%, 13–52%, and 6–42% higher, respectively (Figure 4). The change in the soil’s exchangeable Mg was similar to that of the exchangeable Ca. Furthermore, since the irrigation water of inlet 5 had a higher concentration of Mg (28.4 mg L−1; Table A2), the soil that grew cabbage exhibited a high content of exchange Mg, even under CK treatment. Notably, increasing the concentration of exchangeable cations is helpful in decreasing the soil’s acidity, which was possibly reflected in the increase in the soil’s pH values (Figure 1) under the organic fertilizer treatments.
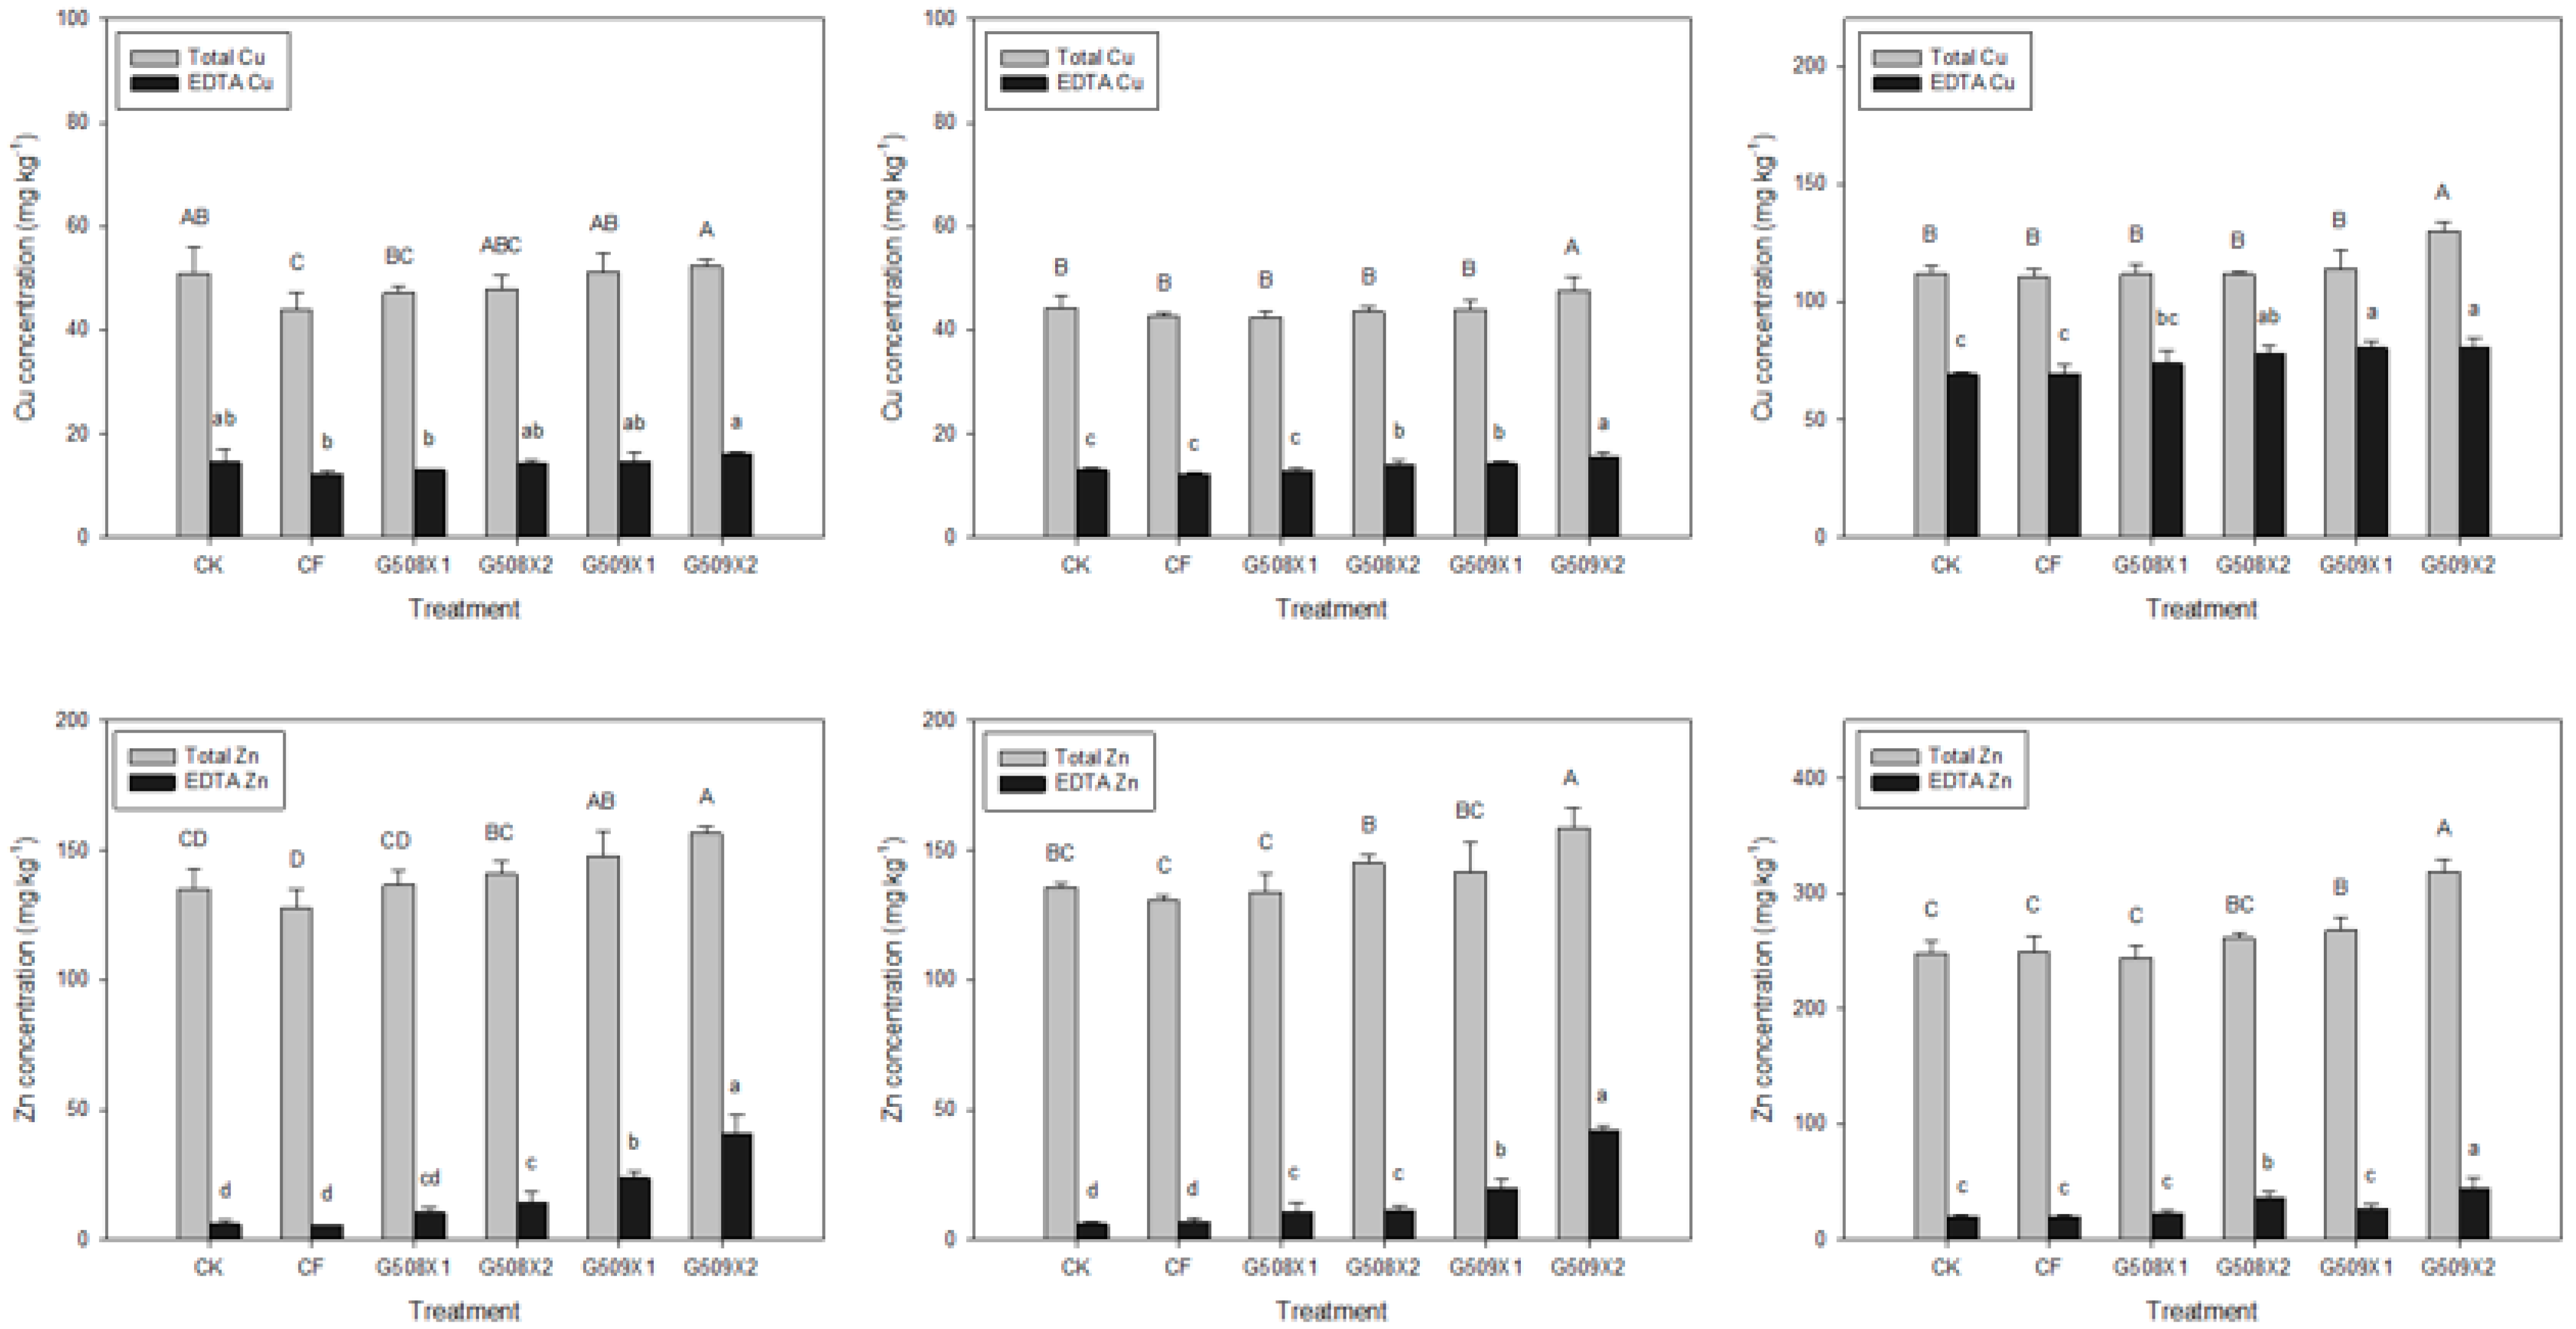
Compared to CF, the total and available concentrations of Cu increased slightly under the G508 and G509 treatments (Figure A2). Similarly, relative to CF, the total concentration of Cu in the soils that grew cabbage, Chinese cabbage, and water spinach increased by 7–19%, 2–12%, and 1–17%, respectively. For the available Cu concentration, the increases were 5–30%, 5–27%, and 7–16% for cabbage, Chinese cabbage, and water spinach, respectively, compared to CF. Concentrations of the available Cu accounted for 27–33% and 62–71% of the total Cu concentration in the soils in block A and block B, respectively. Meanwhile, G509 exhibited a higher Cu content (67 mg kg−1) compared to G508 (23 mg kg−1). Moreover, a higher amount of G509 was applied to the soil because of its lower total N content compared to G508. As a result, the increasing range of the soil’s total and available concentrations under G509 was higher compared to the G508 treatments.
Although the range of this increase reached 1–19% under amendments by the two organic fertilizers compared to CF, the difference in the total Cu concentration between the initial soil and the soil after the field experiment was only 5–14 mg kg−1. The initial Cu concentrations in the soils of block A and block B were used to estimate the time required to raise their Cu concentration beyond the control standard (200 mg kg−1), as indicated by the EPA of Taiwan for G509X2 treatment, in order to increase the soil’s Cu concentration to its utmost. For the soil in block A with 44 mg Cu kg−1, it would take >15 years to reach a concentration beyond 200 mg kg−1. However, for the soil in block B with 125 mg Cu kg−1, it will only take <5 years to reach the same concentration. Therefore, the soil’s initial Cu concentration should be taken into consideration when chicken-manure-processed organic fertilizers are applied on land. Moreover, as a result of the high content of OM in organic fertilizers, the hydroxyl and carboxyl of the fulvic acid and humic acid form complexes with Cu to decrease their uptake by crops [49,60,61]. Another study also revealed that OM-bounding and residual were two of the major fractions of soil Cu that have low availability and, thus, cannot be easily absorbed by plant roots [62].
The soil’s total and available Zn concentrations under the different treatments had a similar changing tendency as Cu. Relative to CF, the total concentrations of Zn in the soils that grew cabbage, Chinese cabbage, and water spinach increased by 1.9–7.4 times, 3–21 times, and 1.2–2.2 times, respectively, under treatments by organic fertilizers (Figure A2). For the available Zn concentration, compared to CF, the levels of increase for cabbage and Chinese cabbage were 1.9–7.4 times and 1.6–6.3 times, respectively. The available Zn occupied only approximately 4–27% of the total soil Zn, which indicated that most of the Zn in the soil was not available for uptake by crops. Similar to the experimental results in the case of Cu, increasing levels of Zn under the G509 treatments were higher than those in G508—resulting from both the higher amount of G509 applied and its higher content of Zn (470 mg kg−1). Using the same estimation method as in the case of Cu, it would take >37 years for the soil in block A to raise its total Zn concentration from 149 mg kg−1 to beyond the control standard (600 mg kg−1), as stated by the EPA of Taiwan for G509X2 treatment. However, it would take only <8 years for the soil in block B with a higher concentration of Zn—292 mg kg−1—to go beyond the same control standard. Soil with a high Zn concentration inhibits crop growth as well as its consumption by animals [63,64]. Exchangeable, carbonate bonding, and Fe- and Mn-oxides bounding are the three main fractions of Zn in soil with low availability and, thus, cannot be easily absorbed by plants [62].

3.3. Results of the Incubation Experiment

3.3.1. Influence on the Soil’s Available N

Figure 5 presents the change in 2 M KCl-extractable NH4+-N under the G508 and G509 treatments over time. The concentration of NH4+-N on D0 was within 47–60 mg kg−1, but it decreased drastically to 4–15 mg kg−1 on D10 and remained roughly the same after that. The nitrification of NH4+-N to NO3-N was responsible for this phenomenon. The transformation of N was determined by the soil’s pH. Furthermore, ammonification and nitrification are dominant in acidic and alkaline environments, respectively [23]. The soil’s pH at the beginning of the incubation experiment was approximately 8.2; it maintained levels of 6.5–7.5 during D10–D120. The above soil pH values were appropriate for nitrification, resulting in declining concentrations of NH4+-N after D10. During D20 to D120, the concentrations of NH4+-N were in the range of 6–15 mg kg−1, which showed no change over time. The experimental results of this study are consistent with those of Azeez and Van [16], who reported that the maximum concentration of NH4+-N was observed at the beginning of the incubation experiment (D0–D20) and then decreased because of nitrification. A similar result was observed by another study [24], which showed that soil pH within 7–8 was favorable for nitrification and soil’s NH4+-N concentration was therefore within a constant range and did not change with increase in the incubating period in general.
The concentration of NO3-N on D0 was not detectable (ND) for all treatments, but it drastically increased on D10 (Figure 6). For the organic fertilizer treatments, the maximum values for G509X1, G508X1, G509X2, and G508X2 were identified on D30, D50, D80, and D90, respectively, while their NO3-N concentrations were approximately 100, 121, 127, and 174 mg kg−1. At the end of the incubation experiment, the concentration of NO3-N was in decreasing order for G508X2, G508X1, G509X2, and G509X1. The concentration of NO3-N increased severely on D10 since the nitrification process was dominant after this day. In comparison to G509, the soil under the G508 treatments had higher concentrations of NO3-N than that under the G509 treatments, possibly because most of the OM in G508 could be mineralized in an easier manner than G509. During D100–D120, the concentrations of NO3-N under all the treatments decreased—possibly due to the immobilization of microorganisms. The C/N ratio of organic fertilizer plays an important role in determining the rate of mineralization. The results of an incubation experiment conducted by Rasouli-Sadaghiani and Moradi [17] showed that a maximum concentration of NO3-N was determined during D10–D30 when a low C/N ratio (<12) of organic fertilizer was applied. However, the concentration of NO3-N decreased after D30 as a result of immobilization. This result is consistent with the findings of this study because G508 and G509 also have low C/N ratios (6.3 and 8.9). Furthermore, an incubation experiment conducted by Bitzer and Sams [65] applying manure without composting revealed that approximately 50–86% of organic N was mineralized and released as NO3-N. In agreement with the experimental results of the above study, approximately 80% and 60% of organic N was mineralized as NO3-N under the G508 and G509 treatments, respectively, in the current study. Since G509 is a composted organic fertilizer and its OM is more stable and does not degrade as easily as G508, the mineralization rate of G508 was faster than that of G509, which resulted in more NO3-N release. This finding is also supported by Brinson Jr. et al. [66], who pointed out that the amount of inorganic N released from composted chicken-litter manure was lower than that released from non-composted manure. The composting process increases the content of cellulose and decreases the content of semi-cellulose [24]. Therefore, most of the residues after a composting process cannot be easily degraded by microorganisms.
The total concentration of mineralized N (TMN) and the sum of the concentrations of NH4+-N and NO3-N, extracted by 2 M KCl, were used to detect the total inorganic N released during mineralization under the G508 and G509 treatments. Equation (1) was used to calculate the N releasing rate (NRR) between the treatment and CK. This value can be used to assess the proportion of organic fertilizer mineralized during the incubation experiment. The TMN increased with the amount of organic fertilizer applied, and it was at the levels of 47–60 mg kg−1 on D0. This possibly resulted from N’s immobilization, which transforms inorganic N into organic N. The TMN decreased on D30, D50, and D80 for G509X1, G508X1, and G509X2, respectively.
N   releasing   rate   = Difference   of   the   total   concentration   of   mineralized   N   between   treatment   and   CK   N   applied   by   the   treatment  
The NRR of the G508X1, G508X2, G509X1, and G509X2 was 8–43%, 2–37%, 6–14%, and 2–16% from D0 to D50, D90, D30, and D80, respectively, which then decreased over time. The above results revealed that the NRR is determined not only by the type and amount of organic fertilizer but also by its mineralizing period. Further incubation experiments are recommended in order to identify the NRR of different organic fertilizers before land application. Ismael et al. [13] pointed out the reduction in the yield of paddy rice when poultry-litter-based organic fertilizer was used as the only source of fertilization. Moreover, they also noted that using chemical fertilizer as a top-dressing fertilizer was necessary to maintain the yield of paddy rice when applying poultry-litter-based organic fertilizer as the base fertilizer. Lin et al. [67] also reported that using organic fertilizer as the base fertilizer and chemical fertilizer as the top-dressing fertilizer led to increasing yields compared to conventional cultivation using only chemical fertilizers. With regard to organic fertilizer amendment, a positive relationship was observed between TMN and the total N concentration in crops [68]. Therefore, additional chemical fertilizers are proposed for application after D50, D90, D30, and D80 for G508X1, G508X2, G509X1, and G509X2, respectively, according to the TMN of the two organic fertilizers studied in this paper.

3.3.2. Influence on Soil’s pH and EC

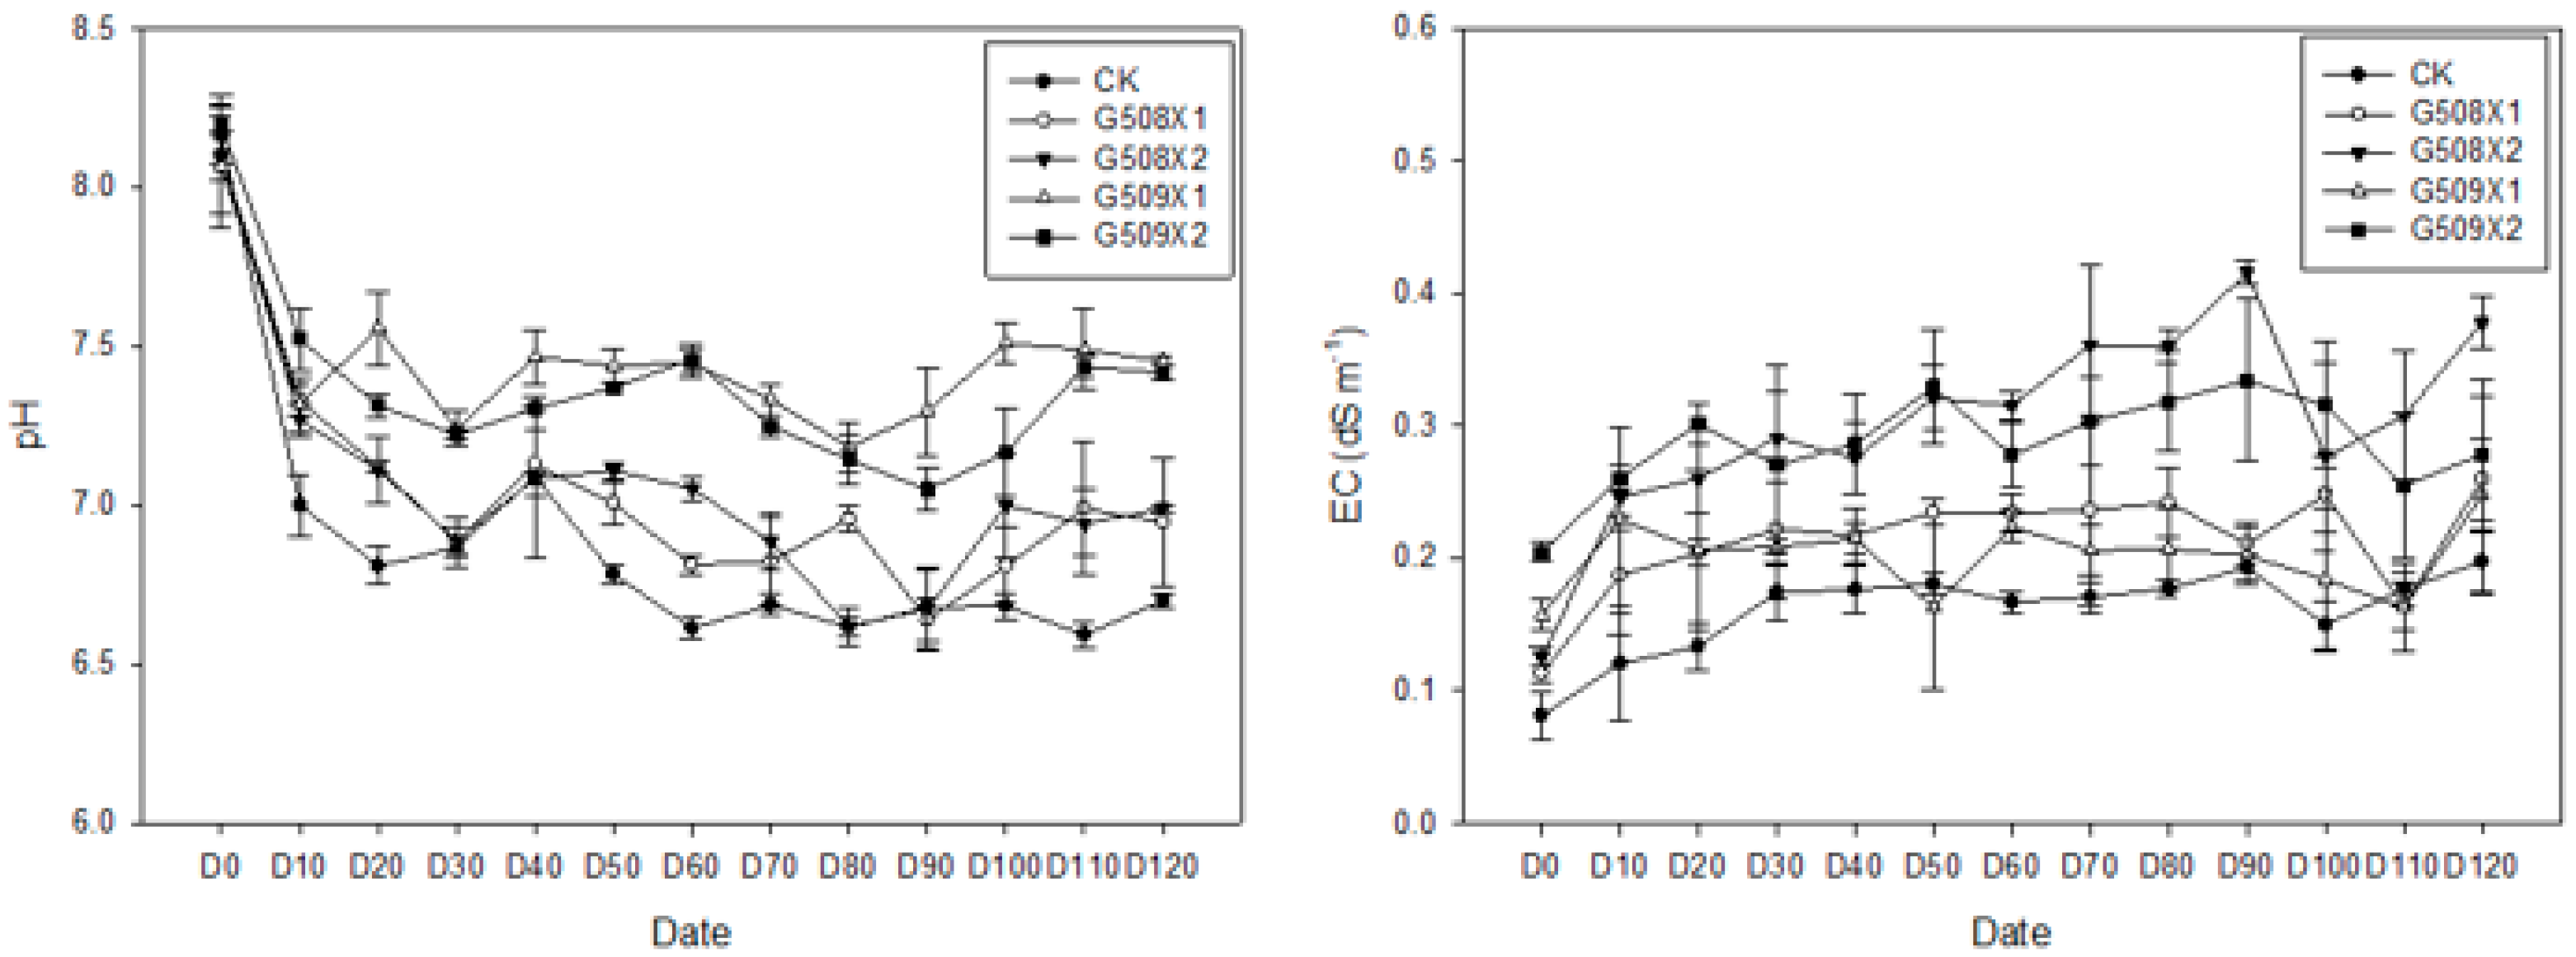
Since soil pH affects the activity of microorganisms, the availability of nutrients, and the development of plant roots, this study also determined soil pH during the incubation experiment. The highest pH values of the different treatments were noted on D0 (8.0–8.2, Figure 6), which then decreased with an increase in the incubation period. On D10, the soil pH values were at the 7.0–7.6 level, with the lowest and highest values under the CK and G509X2 treatments, respectively. The soil pH of CK during D20–D120 was at the level of 6.6–7.1, which was lower compared to the other treatments. Furthermore, soil treated with G509 had higher pH values (7.2–7.6) during D20–D80 compared to the other treatments. During D90–D120, the soil pH values of the two organic fertilizer treatments increased to reach levels of 6.6–7.0 and 7.0–7.6 for G508 and G509, respectively. Three reasons were possibly responsible for the decrease in soil pH: (1) release of organic acids during mineralization of the organic fertilizer, (2) release of H+ during nitrification, and (3) uptake of cations and release of H+ by plant roots. Large amounts of NO3-N were released during D0–D10 because of nitrification (Figure 5), which was responsible for the decrease in soil pH. A similar phenomenon was observed during D40–D80 under the G508 treatments—the soil pH decreased, while the concentration of NO3-N increased. The major reaction was immobilization rather than nitrification after D90, as a result of which the concentration of NO3-N decreased (Figure 5), leading to an increase in soil pH values after D90 (Figure 6). In comparison to CK, the application of G508 and G509 was able to raise the soil pH, especially for G509. This possibly happened because most of the OM in G509 are more stable than G508; in effect, this retarded the nitrification and the soil pH did not change drastically.
Apart from the pH, the soil’s EC was also determined in the incubation experiment, since it can be used to identify the content of soluble salts under the different treatments. On D0, G509X2 had the highest EC (0.20 dS m−1) among all treatments (Figure 6). During D0–D90, the soil’s EC increased along with the incubation period, except in the case of G509X1. These experimental results are consistent with the findings of Cabaleiro et al. [25], who also indicated that the soil’s EC increased along with the incubation period. At the end of the incubation experiment, the EC was in decreasing order for G508X2, G509X2, G508X1, G509X1, and CK. In addition, the EC increased along with the amount of organic fertilizer applied.

3.4. Influence on Crops

3.4.1. Influence on Crop Yield and Agronomic Traits

The influences of the different treatments on the yield of the three crops are displayed in Figure 7. Relative to CF and except for G508X2, the yield of cabbage under the other treatments of G508 and G509 decreased by 11–44%. The yields of Chinese cabbage and water spinach under treatment with G508X2 increased by 12% and 19%, respectively, compared with CF. However, their yields decreased by 6–54% in treatments with the other organic fertilizers. Since a higher amount of inorganic N was released under the G508 treatments (Figure 5), the three crops had similar yields as that in the CF treatment, and significantly (p < 0.05) higher yields compared to that in the G509 treatments. On the contrary, lower yields were observed under G509 treatments compared to CF because of its lower mineralization rate (Figure 5). Moreover, linear relationships were observed between crop yields and TMN on D70, while the regressing coefficient (r2) of cabbage, Chinese cabbage, and water spinach were 0.76, 0.54, and 0.90, respectively (detailed data not shown here).
The dry weight (DW) of cabbage grown with CF was 124.2 g head−1. Except for G508X2, all the DWs under other organic fertilizer treatments decreased by 11–26% (Table 2). The shoot height and diameter of the cabbage grown in CF were 24.0 cm and 14.1 cm, respectively, which decreased by 18–25% and 2–9% under organic fertilizer treatments, except in the case of G508X2. The DW of the Chinese cabbage grown with CF was 51.3 g head−1. Except for G508X2, all the DWs under other organic fertilizer treatments decreased by 11–23%. The shoot height and diameter of Chinese cabbage grown in CF were 23.7 cm and 18.4 cm, respectively, which increased by 4–12% and decreased by 10–27% under organic fertilizer treatments, except in the case of G508X2. The water spinach grown under CF treatment had a DW of 1.9 g plant−1, which increased by 4–31% and decreased by 19–22% under the G508 and G509 treatments, respectively. The shoot height of water spinach decreased by 3–28% under organic fertilizer treatments compared to CF. In summary, the agronomic traits of the three crops grown under different treatments were in the decreasing order of G508X2 > G508X1 = CF > G509X2 > G509X1 = CK. Notably, the soil under the G508 treatment had higher TMN; thus, the crops had better yields and exhibited more growth compared to other organic fertilizer treatments.

3.4.2. Influence on Element Content

Figure 8 depicts the N content in the edible portions of the three crops grown under different treatments. The highest N content was identified in the CF treatment—2.64%, 3.93%, and 1.48% for cabbage, Chinese cabbage, and water spinach, respectively. Compared to CF, the N content under the G508 and G509 treatments decreased by 10–36%, 12–23%, and 9–18% for cabbage, Chinese cabbage, and water spinach, respectively. As a result of the lower TMN of G509 compared to G508, crops grown in soil treated with G509 had comparatively lower N content. In addition to TMN, the antagonism between N and K in the case of soil with high K content also decreased the N content of its crops [58]. High exchangeable K was observed in G509-treated soil (Figure 4), which possibly resulted in the low content of N in the three test crops.
The P content in the cabbage, Chinese cabbage, and water spinach grown in CF was 1.14%, 1.53%, and 1.12%, respectively (Figure 8). Under treatments with G508 and G509, their P concentrations decreased by 1–10%, increased by 5–8%, and increased by 2–17%, respectively, compared to CF. However, most of the differences were not statistically significant. Since organic fertilizers were applied based on their total N content and the N’s RD, higher amounts of P beyond the crops’ requirements were applied, thus enriching the amount of available P in the soil (Figure 3). Since the test soils’ pH (7.0 and 6.4) were within the neutral and weak alkaline ranges, the soil P had high availability and was, therefore, not a limiting factor for the growth of the test crops. Many previous studies have also demonstrated that the application of organic fertilizers enriches the soil P content to sufficient levels that support the growth of plants [6,8,69].
The K content in the cabbage, Chinese cabbage, and water spinach grown in CF was 3.36%, 5.85%, and 3.42%, respectively (Figure 8). Under treatments with G508 and G509, the K concentrations of cabbage and Chinese cabbage decreased by 4–14% and 2–25%, respectively, compared to CF. However, the K concentration of water spinach increased significantly (p < 0.05) by 33–86%, except in the case of G508X2. An antagonism between the soil’s P and the crop’s K was observed in the G509 treatments, which resulted in a lower K content in cabbage and Chinese cabbage. Taking the soil’s available P concentration into consideration (Figure 3), antagonism occurred when the soil’s available P concentration was more than 100 mg kg−1. However, this antagonism did not emerge directly. At first, a high concentration of P in the soil synergistically enhanced the Mg accumulation of plants, after which the antagonism between the soil’s Mg and crop’s K restricted the latter’s accumulation in plants [70]. Relative to CF, the concentration of the soil’s exchangeable Mg increased under treatments with organic fertilizers (Figure 4), especially under the G509 treatments. The synergism between the soil’s P and the crop’s Mg, followed by the antagonism between the crop’s Mg and K, as observed in this study, decreased the accumulation of K in cabbage and Chinese cabbage.
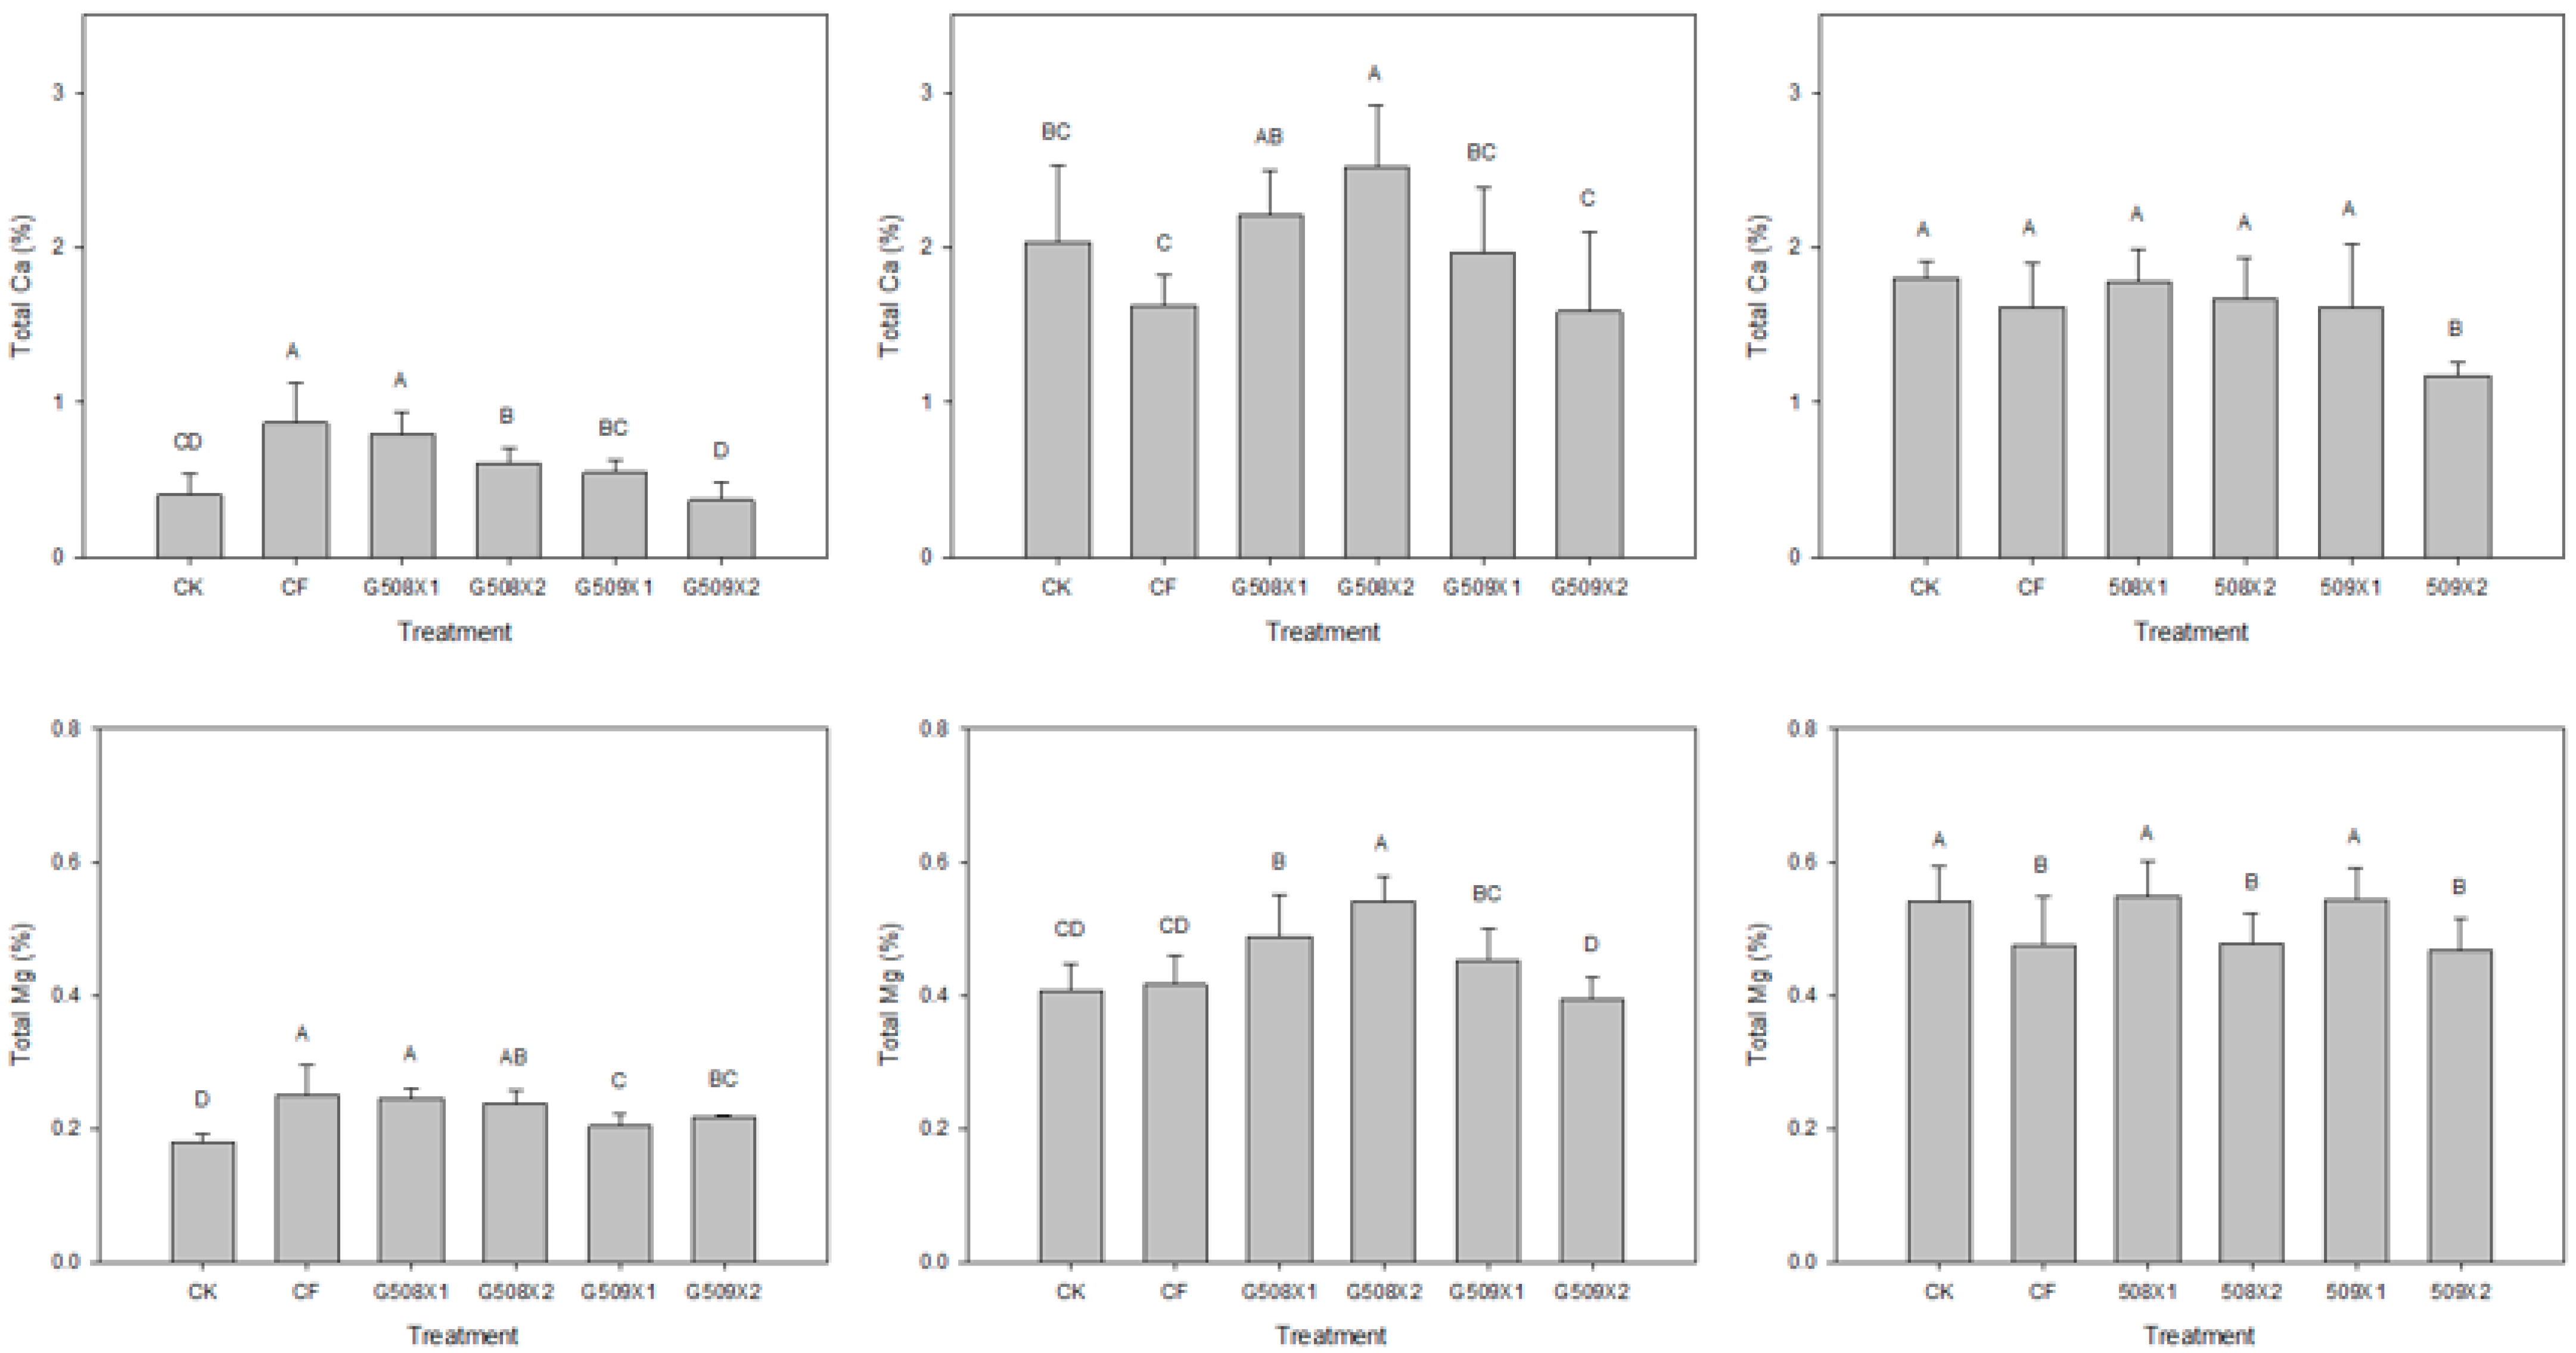
The Ca and Mg concentrations in the three crops grown under CF treatment were 0.8–1.7% and 0.2–0.5%, respectively. Under treatment with two organic fertilizers, the accumulation of Ca and Mg in the three crops was quite different (Figure 9). Relative to CF, significantly (p < 0.05) higher concentrations of Ca and Mg were observed in the G508 treatments compared to the G509 treatments. An antagonism was observed between the crop’s Ca and the other two nutrients in the soil. Since the soils amended by G509 had higher concentrations of available P and exchangeable K, the absorption and accumulation of Ca were inhibited. The experimental results revealed an antagonism between the soil’s K and the crop’s Ca, especially in the G509-amended soil with >400 mg kg−1 of exchangeable K. Similar results were reported by Magallanes-Quintanar et al. [71], who revealed that antagonism reduced the absorption of Ca when the soil had higher concentrations of P and K. The G509 treatments released less TMN, but the soil had a higher concentration of exchangeable K than the G508 treatments. Moreover, stronger antagonisms of K with N and Mg resulted from the higher K concentration in the crops. Therefore, crops grown in G509-treated soils had lower concentrations of Mg compared to those grown in G508-treated soils. In summary, soil treated with G508 had higher concentrations of TMN and lower concentrations of exchangeable K (<400 mg kg−1) compared to the G509 treatments. Therefore, crops grown in G508 treatments had higher concentrations of N and Mg compared to those grown in G509 treatments. On the other hand, G509-amended soils had lower concentrations of TMN and higher concentrations of exchangeable K (>400 mg kg−1) compared to G508 treatments. Therefore, crops grown in G509-amended soils accumulated lower concentrations of N and Mg, resulting from the antagonism of K with N and Mg. This phenomenon of synergism between N and Mg and the antagonism of K with N and Mg have also been demonstrated by Luo et al. [72].
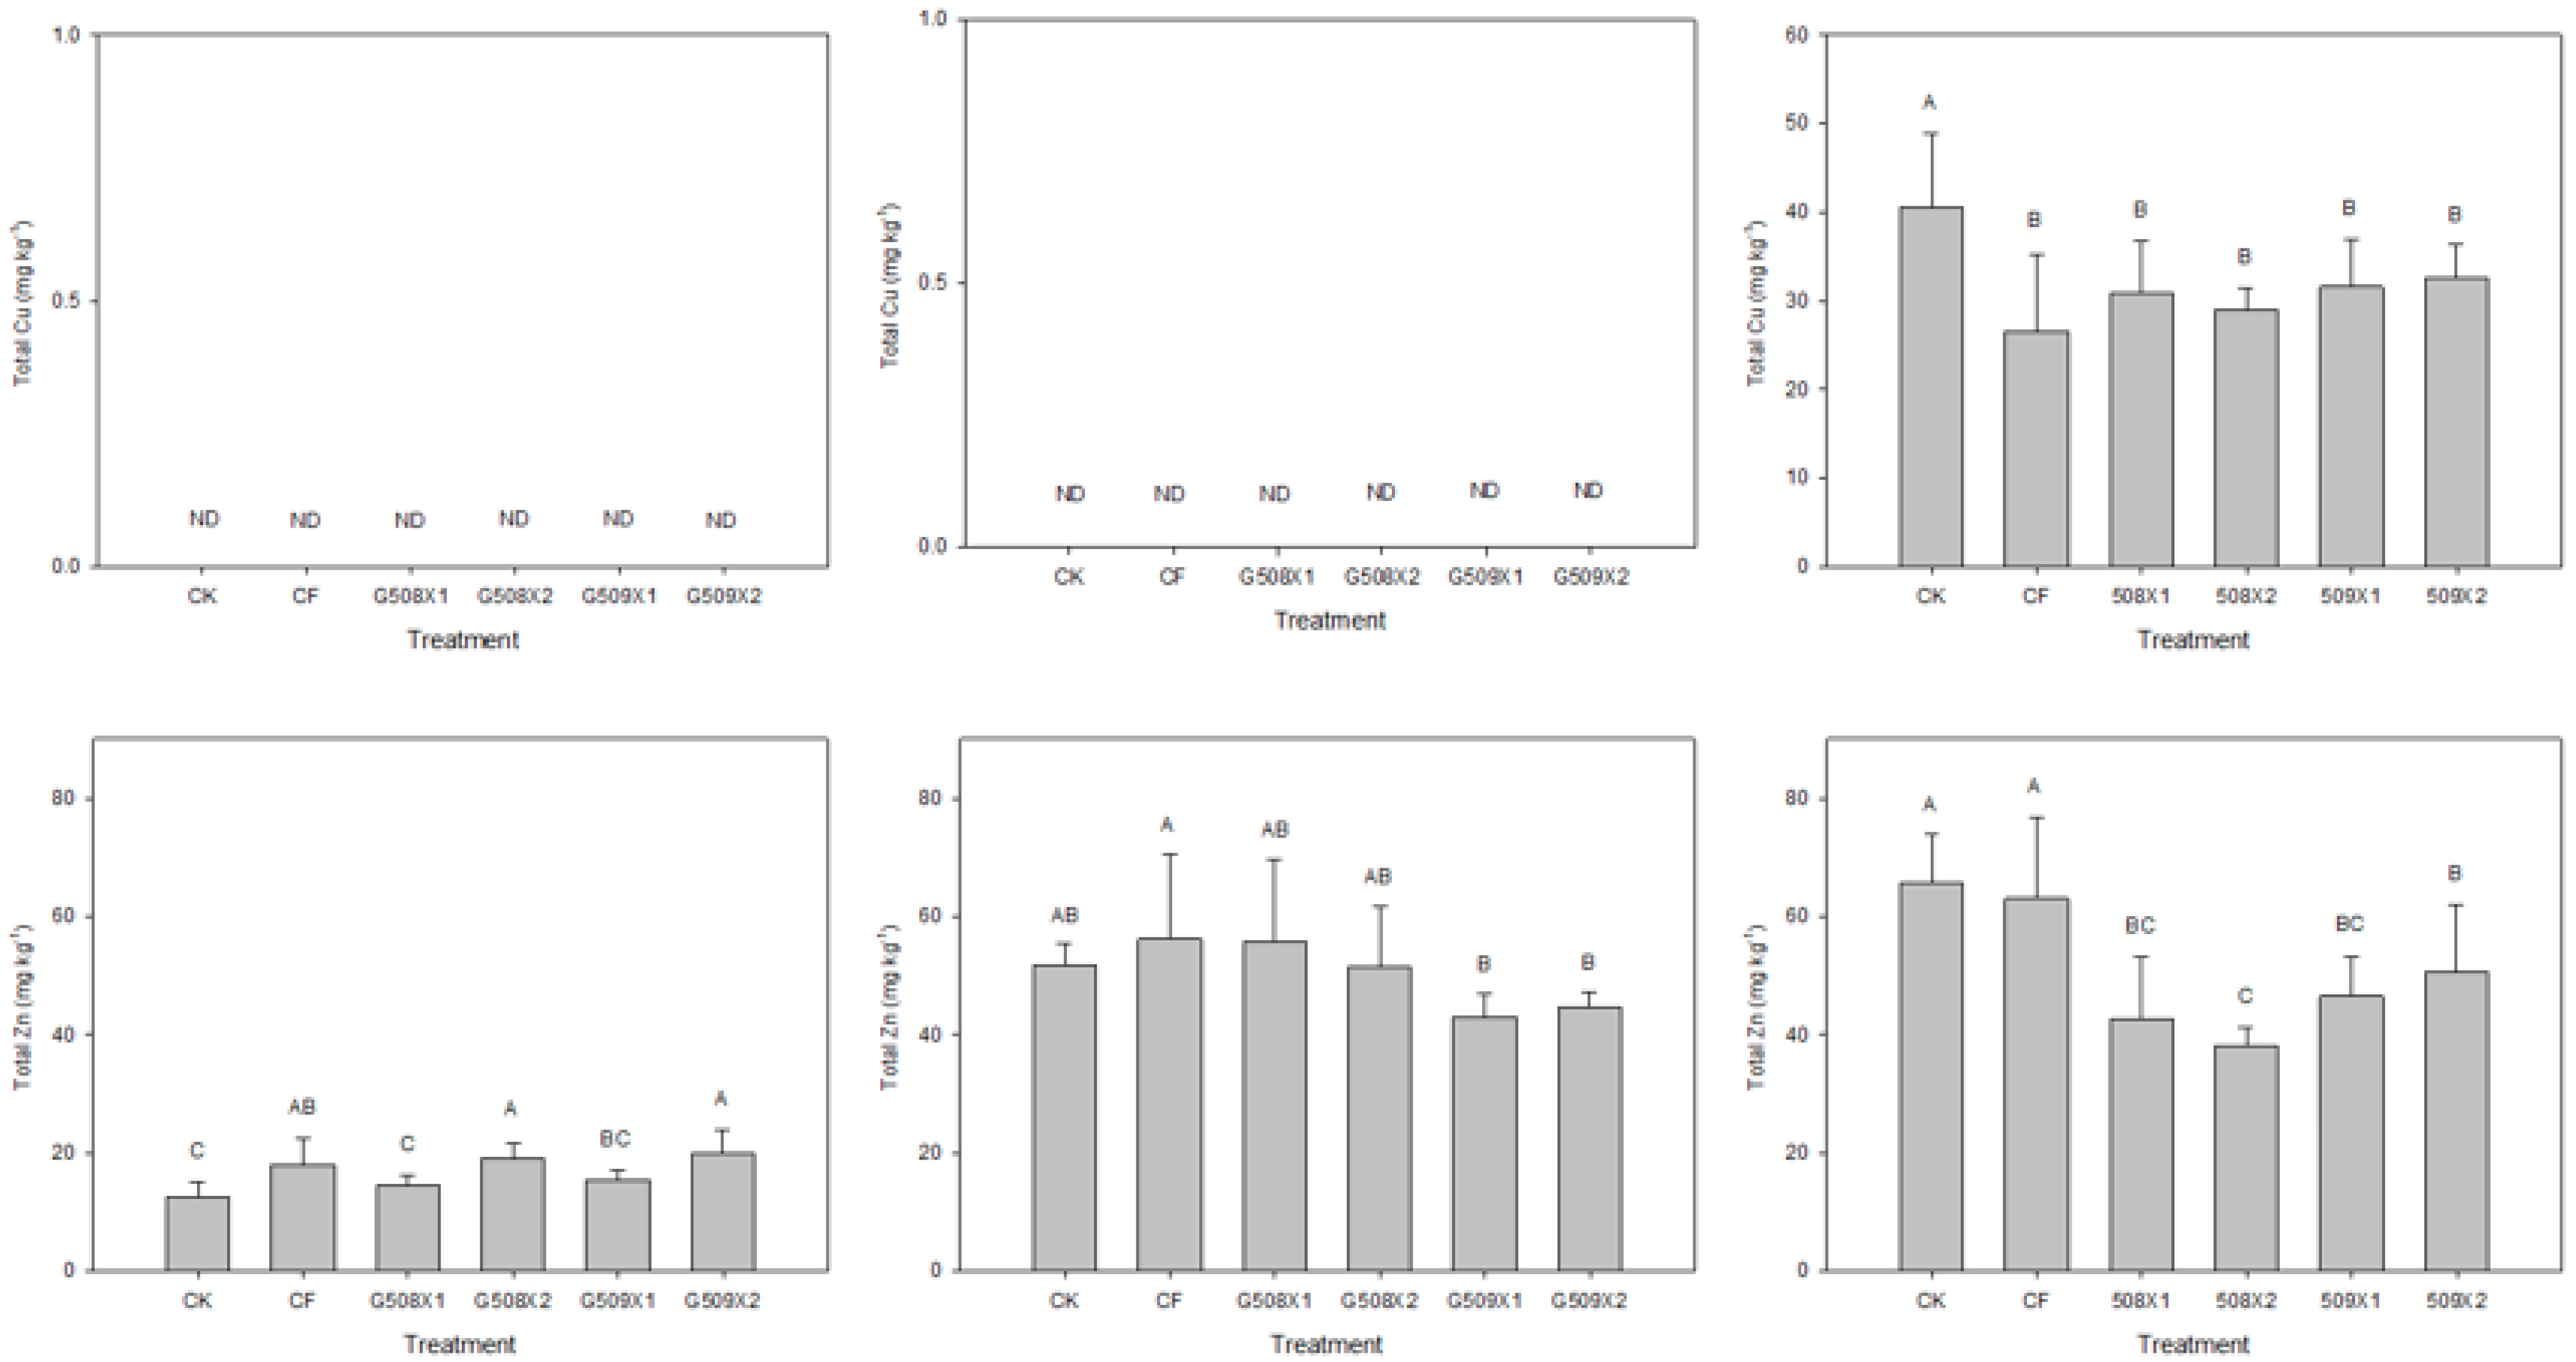
The total concentrations of Cu in cabbage and Chinese cabbage grown under different treatments were not detectable (Figure A3). Water spinach grown in CF had 26.5 mg kg−1 of Cu, which increased by 2.5–6.1 mg kg−1 under the G508 and G509 treatments, although the change was not statistically significant. In the CF treatment, the total concentrations of Zn in the cabbage, Chinese cabbage, and water spinach were 17.91, 56.19, and 63.03 mg kg−1, respectively. Under the organic fertilizer treatments, compared to CF, the concentrations of Zn in Chinese cabbage and water spinach decreased by 1–24% and 20–40%, respectively. Relative to CF, the Zn concentration in cabbage increased under treatments with G508X1, while it decreased by 4–9% in the case of G509X1 treatment, and increased by 7–11% under treatments with G508X2 and G509X2. The accumulation of Zn in the three crops under the different organic fertilizer treatments was quite different. The experimental results of this study are consistent with those of Li et al. [73], who concluded that it is impossible to predict the accumulation of Zn of 18 crops even when they are grown in the same Zn-contaminated soil because crops have different Zn requirements.

3.5. Nutrient Absorption Proportion

Organic matter must first be mineralized in order to consequently release inorganic nutrients into the soil after the application of organic fertilizers. The total amount of nutrients absorbed by crops is defined as the product of planting density, nutrient concentration, and the crop’s dry weight (Equation (2)). Using the quantity of nutrients absorbed by crops, as calculated above, and the total amount of nutrients in the organic fertilizers, one can estimate the nutrient absorption proportion (NAP; Equation (3)) under different treatments. The results of paddy rice cultivation amended with different organic fertilizers showed the NAP of N, P, and K to be 16–66%, 13–20%, and 28–36%, respectively [13]. Meanwhile, after growing rape in the field amended with different amounts of organic fertilizers for 8 months, a 28–44% NAP of N was reported [67].
Total amounts of nutrients absorbed by crops = planting density × crop’s nutrient concentration × crop’s dry weight
Nutrient   absorption   proportion   ( NAP ) = Difference   of   nutrient   absorbed   by   crop   between   treatment   and   CK   Total   amount   of   nutrient   applied × 100  
In this study, cabbage and Chinese cabbage had the same planting density of 1.44 × 10⁴ plants ha−1, while it was 2.7 × 10⁶ plants ha−1 for water spinach. Most of the N’s NAP for cabbage grown in G508 and G509 were <5%, except in the case of G508X1 (Table 3). The P’s NAP for cabbage in treatments with G508X1 and G508X2 was 12.81% and 10.71%, respectively. However, the NAP was <5% under other G509 treatments. Meanwhile, the K’s NAP was between 6–32%, while most of the NAP of Ca, Mg, Cu, and Zn was <5% in general. Most of the NAP for Chinese cabbage grown with different nutrients was <5%, except for K’s NAP under the G508X1 and G508X2 treatments. Water spinach had a higher NAP than the other two crops, with the ranges of N, P, and K being 11–37%, 29–178%, and 151–486%, respectively. The Ca’s NAP for water spinach grown under organic fertilizer treatments was at the 7–27% level, except in the case of G509X2. Among the two organic fertilizers tested in this study, G508 had a higher NAP than G509 in general—possibly resulting from its higher TMN compared to G509 (Figure 5). In addition, the tested crops exhibited better growth under the G508 treatments compared to G509 (Table 2). Therefore, crops absorbed significantly higher amounts of nutrients and, subsequently, had higher NAP under G508 treatments.
Although two types of RDs were applied under the G508X2 and G509X2 treatments, the NAP was higher under the G508X1 and G509X1 treatments. The above result is consistent with the soil’s analytical results—concentrations of the different soil nutrients were higher in G509 and twice the RD. Higher accumulated concentrations of various nutrients were observed in the G508 compared to the G509 treatments. Therefore, G508-treated soils had lower concentrations of nutrients compared to G509-treated soils. Relative to the G508 treatments, higher amounts of nutrients were retained in the soil under treatment with G509, exhibiting two times the RD of the nutrients. At the beginning of the field experiment, we decided to harvest the water spinach 45 days after sowing. However, this duration was extended by 25 more days, since the crop did not mature after growing for 45 days under the CK treatment. Therefore, many of the NAPs of P and K for water spinach were beyond 100%, since the crop could absorb these nutrients from the soils, in addition to the nutrients mineralized from the organic fertilizers. The results of the greenhouse experiment using chemical fertilizers, conducted by Šturm et al. [74] and Gao et al. [75], revealed that the N’s NAP for cabbage and Chinese cabbage was 30% and 5.3–23%, both of which are higher than the estimates of this study. The above phenomenon may have been caused because organic fertilizers need to be mineralized in order to convert the nutrients from their organic to inorganic forms. Therefore, the NAP under organic cultivations was higher than those in conventional cultivations.

4. Conclusions

This study was conducted both in a field and in a growth chamber to assess the advantages and disadvantages of two chicken-manure-processed organic fertilizers. Although the primary material used to produce both the organic fertilizers was the same, i.e., chicken manure, their N release kinetics as well as their effect on the promotion of soil properties and crop yield were quite different. Chicken-manure-processed organic fertilizer G508 exhibited a faster N mineralization rate than composted organic fertilizer G509, which is more suitable for crops with short growth periods. In addition, the application amount should also be taken into consideration from the viewpoints of yield, soil property, content of Cu and Zn, nutrient absorption proportion, etc. Although only three crops were tested and many unexcepted results were identified in the field experiment; moreover, soil and crop samples were only taken before and after the growth period, and the accuracy of the conclusion is not certain. We hope these experimental results provide useful information regarding the application of chicken-manure-processed organic fertilizers.

Author Contributions

Conceptualization, H.-Y.L.; data curation, C.-M.H.; methodology, C.-M.H. and H.-Y.L.; project administration and supervision, H.-Y.L.; writing—original draft, C.-M.H.; writing—review and editing, H.-Y.L. All authors have read and agreed to the published version of the manuscript.

Funding

This research was funded by the Council of Agriculture of the Republic of China (R.O.C.), grant numbers 110-AS-2.4.2-AD-U1 and 111-AS-2.4.2-AD-U1, and in part by the Ministry of Education, Taiwan, R.O.C., under the Higher Education Sprout Project.

Acknowledgments

We gratefully appreciate all our labmates for helping with the field and laboratory works and preparing the setup for the experiment.

Conflicts of Interest

The authors declare no conflict of interest.

Appendix A

Table A1. Basic properties of the soils in block A and block B.
Soil PropertypHECWASOMAvail. NAvail. PExch. KExch. CaExch. MgTotal CuTotal Zn
dS m−1---- % ------------------------------------------ mg kg−1 --------------------------------------
Mean7.070.1735.811.228.3110.1147.51608406.744.19149.2
Block AMin.6.790.1227.140.984.617.02189.81483389.640.39136.7
Max.7.460.2944.431.3912.514.1120.81811423.350.85169.7
Mean6.420.2246.053.698.9817.7160.51938473.5124.7292.3
Block BMin.6.050.1342.053.256.597.38126.41747451.4113.6259.3
Max.7.020.3250.494.0011.944.0205.02160499.8140.9344.3
WAS: wet aggregate stability, OM: organic matter.
Table A2. Basic properties of irrigation water at different locations.
InletpHECKCaMg
dS m−1------------------------------- mg L−1 -------------------------------
Water 18.12 ± 0.040.80 ± 0.018.6 ± 0.665.2 ± 0.024.6 ± 2.4
Water 28.28 ± 0.040.56 ± 0.017.8 ± 0.671.3 ± 0.424.6 ± 0.4
Water 38.13 ± 0.010.53 ± 0.006.1 ± 0.261.2 ± 1.621.0 ± 0.3
Water 48.20 ± 0.050.62 ± 0.019.6 ± 0.169.6 ± 1.225.6 ± 0.1
Water 58.24 ± 0.070.81 ± 0.0012.0 ± 0.277.6 ± 0.428.4 ± 1.5
Water 68.13 ± 0.160.61 ± 0.076.1 ± 0.057.1 ± 0.021.8 ± 6.0
Water 78.34 ± 0.010.67 ± 0.0010.7 ± 0.380.2 ± 0.826.8 ± 1.0
Figure A1. The wet aggregate stability (WAS) of soil after the field experiment: cabbage (left), Chinese cabbage (middle), and water spinach (right). The different letters indicate the significance among the treatments obtained through one-way ANOVA analysis (Duncan test, p < 0.05, n = 4). The codes have the same meanings as those in Figure 1.
Agronomy 12 02355 g0a1
Figure A2. Total and available concentrations of Cu and Zn in the soil under different treatments after the field experiment: cabbage (left), Chinese cabbage (middle), and water spinach (right). The different letters indicate the significance among the treatments obtained through one-way ANOVA analysis (Duncan test, p < 0.05, n = 4). The codes have the same meanings as those in Figure 1.
Agronomy 12 02355 g0a2
Figure A3. The total concentrations of Cu and Zn of the three crops under different treatments: cabbage (left), Chinese cabbage (middle), and water spinach (right). The different letters indicate the significance among the treatments obtained through one-way ANOVA analysis (Duncan test, p < 0.05, n = 4). The codes have the same meanings as those in Figure 1.
Agronomy 12 02355 g0a3

References

  1. Mamo, M.; Molina, J.A.E.; Rosen, C.J.; Halbach, T.R. Nitrogen and carbon mineralization in soil amended with municipal solid waste compost. Can. J. Soil Sci. 1999, 79, 535–542. [Google Scholar] [CrossRef]
  2. Hudson, B.D. Soil organic-matter and available water capacity. J. Soil Water Conserv. 1994, 49, 189–194. [Google Scholar]
  3. Feng, G.; Adeli, A.; Read, J.; McCarty, J.; Jenkins, J. Consequences of pelletized poultry litter applications on soil physical and hydraulic properties in reduced tillage, continuous cotton system. Soil Tillage Res. 2019, 194, 104309. [Google Scholar] [CrossRef]
  4. Bayu, W.; Rethman, N.F.G.; Hammes, P.S.; Alemu, G. Application of farmyard manure improved the chemical and physical properties of the soil in a semi-arid area in Ethiopia. Biol. Agric. Hortic. 2006, 24, 293–300. [Google Scholar] [CrossRef]
  5. Adeli, A.; Varco, J.J.; Sistani, K.; Rowe, D. Effects of swine lagoon effluent relative to commercial fertilizer applications on warm-season forage nutritive value. Agron. J. 2005, 97, 408–417. [Google Scholar] [CrossRef]
  6. Wang, Y.; Zhu, Y.; Zhang, S.; Wang, Y. What could promote farmers to replace chemical fertilizers with organic fertilizers? J. Clean. Prod. 2018, 199, 882–890. [Google Scholar] [CrossRef]
  7. Tewolde, H.; Buehring, N.; Feng, G.; Way, T. Managing soil nutrient buildup by rotating crops and fertilizers following repeated poultry litter applications. Soil Sci. Soc. Am. J. 2021, 85, 340–352. [Google Scholar] [CrossRef]
  8. Dikinya, O.; Mufwanzala, N. Chicken manure enhanced soil fertility and productivity: Effects of application rates. J. Soil Sci. Environ. Manag. 2010, 3, 46–54. [Google Scholar]
  9. Amos, H.; Izundu, C.; Audu, I. Effect of chicken manure on the performance of vegetable maize (Zea mays saccharate) varieties under irrigation. Discourse J. Agric. Food Sci. 2013, 12, 190–195. [Google Scholar]
  10. Ahmed, A.M.S.; Abu-Zreig, M.; Abdalla, M.A.; Yamanaka, N.; Elhadi, E.A.; Rezig, F.A.M. Integration of composts with NPK improved soil fertility, growth and yield of sorghum in sandy desert soils of Sudan. Int. J. Agric. Biol. 2020, 23, 373–380. [Google Scholar] [CrossRef]
  11. Huang, X.; Jia, Z.; Guo, J.; Li, T.; Sun, D.; Meng, H.; Yu, G.; He, X.; Ran, W.; Zhang, S.; et al. Ten-year long-term organic fertilization enhances carbon sequestration and calcium-mediated stabilization of aggregate-associated organic carbon in a reclaimed Cambisol. Geoderma 2019, 355, 113880. [Google Scholar] [CrossRef]
  12. Mumbach, G.L.; Gatiboni, L.C.; de Bona, F.D.; Schmitt, D.E.; Correa, J.C.; Gabriel, C.A.; Dall’Orsoletta, D.J.; Iochims, D.A. Agronomic efficiency of organomineral fertilizer in sequential grain crops in southern Brazil. Agron. J. 2020, 112, 3037–3049. [Google Scholar] [CrossRef]
  13. Ismale, F.; Ndayiragije, A.; Fangueiro, D. New fertilizer strategies combining manure and urea for improved rice growth in Mozambique. Agronomy 2021, 11, 783. [Google Scholar] [CrossRef]
  14. Abuarab, M.E.; El-Mogy, M.M.; Hassan, A.M.; Abdeldaym, E.A.; Abdelkader, N.H.; El-Sawy, M.B.I. The effects of root aeration and different soil conditioners on the nutritional values, yield, and water productivity of potato in clay loam soil. Agronomy 2019, 9, 418. [Google Scholar] [CrossRef]
  15. Cassity-Duffey, K.; Cabrera, M.; Gaskin, J.; Franklin, D.; Kissel, D.; Saha, U. Nitrogen mineralization from organic materials and fertilizers: Predicting N release. Soil Sci. Soc. Am. J. 2020, 84, 522–533. [Google Scholar] [CrossRef]
  16. Azeez, J.O.; Van Averbeke, W. Nitrogen mineralization potential of three animal manures applied on a sandy clay loam soil. Bioresour. Technol. 2010, 101, 5645–5651. [Google Scholar] [CrossRef] [PubMed]
  17. Rasouli-Sadaghiani, M.H.; Moradi, N. Effect of poultry, cattle, sheep manures and sewage sludge on N mineralisation. Chem. Ecol. 2014, 30, 666–675. [Google Scholar] [CrossRef]
  18. Rothé, M.; Darnaudery, M.; Thuries, L. Organic fertilizers, green manures and mixtures of the two revealed their potential as substitutes for inorganic fertilizers used in pineapple cropping. Sci. Hortic. 2019, 257, 108691. [Google Scholar] [CrossRef]
  19. Gordillo, R.M.; Cabrera, M.L. Mineralizable nitrogen in broiler litter: I. Effect of selected litter chemical characteristics. J. Environ. Qual. 1997, 26, 1672–1679. [Google Scholar] [CrossRef]
  20. Paul, E.A.; Clark, F.E. Soil Microbiology and Biochemistry, 2nd ed.; Academic Press: San Diego, CA, USA, 1996. [Google Scholar]
  21. Cui, L.; Li, D.; Wu, Z.; Xue, Y.; Xiao, F.; Zhang, L.; Song, Y.; Li, Y.; Zheng, Y.; Zhang, J.; et al. Effects of nitrification inhibitors on soil nitrification and ammonia volatilization in three soils with different pH. Agronomy 2021, 11, 1674. [Google Scholar] [CrossRef]
  22. Bergamasco, M.A.M.; Braos, L.B.; Lopes, S.L.; Cruz, M.C.P. Nitrogen mineralization and nitrification in two soil with different pH levels. Commun. Soil Sci. Plant Anal. 2019, 50, 2873–2880. [Google Scholar] [CrossRef]
  23. Eneji, A.E.; Irshad, M.; Honna, T.; Yamamoto, S.; Endo, T.; Masuda, T. Potassium, calcium, and magnesium mineralization in manure-treated soils. Commun. Soil Sci. Plant Anal. 2003, 34, 1669–1679. [Google Scholar] [CrossRef]
  24. Huang, C.C.; Chen, Z.S. Carbon and nitrogen mineralization of sewage sludge compost in soils with a different initial pH. Soil Sci. Plant Nutr. 2009, 55, 715–724. [Google Scholar] [CrossRef]
  25. Cabaleiro, F.A.; Sainz, M.J.; Seoane-Labandeira, S.; Lopez-Mosquera, M.E. Salt effect of dehydrated broiler litter on organic lettuce. Biol. Agric. Hortic. 2018, 34, 107–119. [Google Scholar] [CrossRef]
  26. Wang, X.H.; Song, Y.P.; Ren, J.; Liu, T.K.; Hou, X.L.; Li, Y. Response of biomass and photosynthesis in non-heading Chinese cabbage to excess copper. J. Anim. Plant Sci. 2013, 23, 1659–1665. [Google Scholar]
  27. Ali, S.; Rizwan, M.; Ullah, N.; Bharwana, S.A.; Waseem, M.; Farooq, M.A.; Abbasi, G.H.; Farid, M. Physiological and biochemical mechanisms of silicon-induced copper stress tolerance in cotton (Gossypium hirsutum L.). Acta Physiol. Plant. 2016, 38, 262. [Google Scholar] [CrossRef]
  28. Chiou, W.Y.; Hsu, F.C. Copper toxicity and prediction models of copper content in leafy vegetables. Sustainability 2019, 11, 6215. [Google Scholar] [CrossRef]
  29. Warne, M.S.J.; Heemsbergen, D.; McLaughlin, M.; Bell, M.; Broos, K.; Whatmuff, M.; Barry, G.; Nash, D.; Pritchard, D.; Penney, N. Models for the field-based toxicity of copper and zinc salts to wheat in 11 Australian soils and comparison to laboratory-based models. Environ. Pollut. 2008, 156, 707–714. [Google Scholar] [CrossRef]
  30. Tiecher, T.L.; Ceretta, C.A.; Tiecher, T.; Ferreira, P.A.A.; Nicoloso, F.T.; Soriani, H.H.; Rossato, L.V.; Mimmo, T.; Cesco, S.; Lourenzi, C.R.; et al. Effects of zinc addition to a copper-contaminated vineyard soil on sorption of Zn by soil and plant physiological responses. Ecotoxicol. Environ. Saf. 2016, 129, 109–119. [Google Scholar] [CrossRef]
  31. Du, W.; Yang, J.; Peng, Q.; Liang, X.; Mao, H. Comparison study of zinc nanoparticles and zinc sulphate on wheat growth: From toxicity and zinc biofortification. Chemosphere 2019, 227, 109–116. [Google Scholar] [CrossRef]
  32. Lafond, S.; Pare, T.; Dinel, H.; Schnitzer, M.; Chambers, J.R.; Jaouich, A. Composting duck excreta enriched wood shavings: C and N transformations and bacterial pathogen reductions. J. Environ. Sci. Health B 2002, 37, 173–186. [Google Scholar] [CrossRef] [PubMed]
  33. Turner, C. The thermal inactivation of E-coli in straw and pig manure. Bioresour. Technol. 2002, 84, 57–61. [Google Scholar] [CrossRef]
  34. Wilkinson, K.G.; Tee, E.; Tomkins, R.B.; Hepworth, G.; Premier, R. Effect of heating and aging of poultry litter on the persistence of enteric bacteria. Poult. Sci. 2011, 90, 10–18. [Google Scholar] [CrossRef] [PubMed]
  35. Chang, R.; Pandey, P.; Li, Y.; Venkitasamy, C.; Chen, Z.; Gallardo, R.; Weimer, B.; Jay-Russell, M.; Weimer, B. Assessment of gaseous ozone treatment on Salmonella Typhimurium and Escherichia coli O157:H7 reductions in poultry litter. Waste Manag. 2020, 117, 42–47. [Google Scholar] [CrossRef] [PubMed]
  36. Farkas, R.; Hogsette, J.A.; Borzsonyi, L. Development of Hydrotaea aenescens and Musca domestica (Diptera: Muscidae) in poultry and pig manures of different moisture content. Environ. Entomol. 1998, 27, 695–699. [Google Scholar] [CrossRef]
  37. Thomas, G.W. Soil pH and soil acidity. In Methods of Soil Analysis. Part 3. Chemical Methods; Sparks, D.L., Page, A.L., Helmke, P.A., Loeppert, R.H., Soltanpour, P.N., Tabatabai, M.A., Johmston, C.T., Sumner, M.E., Eds.; SSSA Inc.: Madison, WI, USA; ASA Inc.: Madison, WI, USA, 1996; pp. 475–490. [Google Scholar]
  38. Rhoades, J.D. Salinity: Electrical conductivity and total dissolved solids. In Methods of Soil Analysis. Part 3. Chemical Methods; Sparks, D.L., Page, A.L., Helmke, P.A., Loeppert, R.H., Soltanpour, P.N., Tabatabai, M.A., Johmston, C.T., Sumner, M.E., Eds.; SSSA Inc.: Madison, WI, USA; ASA Inc.: Madison, WI, USA, 1996; pp. 417–435. [Google Scholar]
  39. Nelson, D.W.; Sommers, L.E. Total carbon, organic carbon, and organic matter. In Methods of Soil Analysis. Part 3. Chemical Methods; Sparks, D.L., Page, A.L., Helmke, P.A., Loeppert, R.H., Soltanpour, P.N., Tabatabai, M.A., Johmston, C.T., Sumner, M.E., Eds.; SSSA Inc.: Madison, WI, USA; ASA Inc.: Madison, WI, USA, 1996; pp. 961–1010. [Google Scholar]
  40. Kemper, W.; Rosenau, R. Aggregate stability and size distribution. In Methods of Soil Analysis: Part 1. Physical and Mineralogica Methods; Klute, A., Campbell, G.S., Jackson, R.D., Mortland, M.M., Nielsen, D.R., Eds.; SSSA Inc.: Madison, WI, USA; ASA Inc.: Madison, WI, USA, 1986; pp. 425–442. [Google Scholar]
  41. Mulvaney, R.L. Nitrogen—Inorganic forms. In Methods of Soil Analysis. Part 3. Book Ser. 5. Chemical Method; Sparks, D.L., Ed.; SSSA Inc.: Madison, WI, USA; ASA Inc.: Madison, WI, USA, 1996; pp. 1123–1184. [Google Scholar]
  42. Mehlich, A. Mehlich-3 soil test extractent a modification of Mehlich-2 extractent. Commun. Soil Sci. Plant Anal. 1984, 15, 1409–1416. [Google Scholar] [CrossRef]
  43. Olsen, S.R.; Cole, C.V.; Watanabe, F.S.; Dean, L.A. Estimation of Available Phosphorus in Soils by Extraction with Sodium Bicarbonate; USDA Circ. 939; USDA: Washington, DC, USA, 1954.
  44. Kuo, S. Phosphorus. In Methods of Soil Analysis. Part 3. Book Ser. 5. Chemical Method; Sparks, D.L., Ed.; SSSA Inc.: Madison, WI, USA; ASA Inc.: Madison, WI, USA, 1996; pp. 869–919. [Google Scholar]
  45. EPA/Taiwan. Method Code No: NIEA S321.65B; Environmental Protection Administration of Taiwan ROC: Taipei, Taiwan, 2018.
  46. Wear, J.I.; Evans, C.E. Relationship of zinc uptake by corn and sorghum to soil zinc measured by three extractant. Soil Sci. Soc. Am. Proc. 1968, 32, 543–546. [Google Scholar] [CrossRef]
  47. Gardner, W.H. Water content. In Methods of Soil Analysis: Part 1. Physical and Mineralogica Methods; Klute, A., Campbell, G.S., Jackson, R.D., Mortland, M.M., Nielsen, D.R., Eds.; SSSA Inc.: Madison, WI, USA; ASA Inc.: Madison, WI, USA, 1986; pp. 493–544. [Google Scholar]
  48. Loncarevic, S.; Johannessen, G.S.; Rørvik, L.M. Bacteriological quality of organically grown leaf lettuce in Norway. Lett. Appl. Microbiol. 2005, 41, 186–189. [Google Scholar] [CrossRef]
  49. Wan, Y.; Huang, Q.; Wang, Q.; Ma, Y.; Su, D.; Qiao, Y.; Jiang, R.; Li, H. Ecological risk of copper and zinc and their different bioavailability change in soil-rice system as affected by biowaste application. Ecotoxicol. Environ. Saf. 2020, 192, 110301. [Google Scholar] [CrossRef]
  50. Tisdall, J.M.; Oade, J.M. Organic matter and water-stable aggregates in soil. J. Soil Sci. Plant Nutr. 1982, 33, 141–163. [Google Scholar] [CrossRef]
  51. Haynes, R.J.; Swift, R.S. Stability of soil aggregates in relation to organic-constituents and soil-water content. J. Soil Sci. 1990, 41, 73–83. [Google Scholar] [CrossRef]
  52. Arshad, M.A.; Lowery, B.; Grossman, B. Physical tests for monitoring soil quality. In Methods for Assessing Soil Quality; Doran, J.W., Jones, A.J., Eds.; SSSA Spec. Publ.: Madison, WI, USA, 1996; pp. 123–141. [Google Scholar]
  53. Blazier, M.A.; Patterson, W.B.; Hotard, S.L. Straw harvesting, fertilization, and fertilizer type alter soil microbiological and physical properties in a loblolly pine plantation in the mid-south USA. Biol. Fertil. Soils 2008, 45, 145–153. [Google Scholar] [CrossRef]
  54. He, Z.; Tazisong, I.A.; Senwo, Z.N.; Zhang, D. Soil properties and macro cations status impacted by long-term applied poultry litter. Commun. Soil Sci. Plant Anal. 2008, 39, 858–872. [Google Scholar] [CrossRef]
  55. Moritsugu, M.; Kawasaki, T.; Suzuki, T. Comparison of absorption rates between ammonium and nitrate nitrogen in plants. Bull. Res. Inst. Bioresourc. Okayama Univ. 1995, 3, 91–103. [Google Scholar]
  56. Matsumoto, S.; Ae, N.; Yamagata, M. Nitrogen uptake response of vegetable crops to organic materials. Soil Sci. Plant Nutr. 1999, 45, 269–278. [Google Scholar] [CrossRef] [Green Version]
  57. Yang, C.; Du, W.; Zhang, L.; Dong, Z. Effects of sheep manure combined with chemical fertilizers on maize yield and quality and spatial and temporal distribution of soil inorganic nitrogen. Complexity 2021, 2021, 1–10. [Google Scholar] [CrossRef]
  58. Zhang, F.; Niu, J.; Zhang, W.; Chen, X.; Li, C.; Yuan, L.; Xie, J. Potassium nutrition of crops under varied regimes of nitrogen supply. Plant Soil 2010, 335, 21–34. [Google Scholar] [CrossRef]
  59. Pii, Y.; Cesco, S.; Mimmo, T. Shoot ionome to predict the synergism and antagonism between nutrients as affected by substrate and physiological status. Plant Physiol. Biochem. 2015, 94, 48–56. [Google Scholar] [CrossRef]
  60. Laborda, F.; Bolea, E.; Gorriz, M.P.; Martin-Ruiz, M.P.; Ruiz-Begueria, S.; Castillo, J.R. A speciation methodology to study the contributions of humic-like and fulvic-like acids to the mobilization of metals from compost using size exclusion chromatography-ultraviolet absorption-inductively coupled plasma mass spectrometry and deconvolution analysis. Anal. Chim. Acta 2008, 606, 1–8. [Google Scholar]
  61. Brunetto, G.; Bastos de Melo, G.W.; Terzano, R.; Del Buono, D.; Astolfi, S.; Tomasi, N.; Pii, Y.; Mimmo, T.; Cesco, S. Copper accumulation in vineyard soils: Rhizosphere processes and agronomic practices to limit its toxicity. Chemosphere 2016, 162, 293–307. [Google Scholar] [CrossRef]
  62. Sabiene, N.; Paulauskas, V.; Chen, S.Y.; Lin, J.G. Variations of metal distribution in sewage sludge composting. Waste Manag. 2008, 28, 1637–1644. [Google Scholar]
  63. Long, X.X.; Yang, X.E.; Ni, W.Z.; Ye, Z.Q.; He, Z.L.; Calvert, D.V.; Stoffella, J.P. Assessing zinc thresholds for phytotoxicity and potential dietary toxicity in selected vegetable crops. Commun. Soil Sci. Plant Anal. 2003, 34, 1421–1434. [Google Scholar] [CrossRef]
  64. Antonious, G.F.; Kochhar, T.S.; Coolong, T. Yield, quality, and concentration of seven heavy metals in cabbage and broccoli grown in sewage sludge and chicken manure amended soil. J. Environ. Sci. Health A 2012, 47, 1955–1965. [Google Scholar] [CrossRef] [PubMed]
  65. Bitzer, C.C.; Sims, J.T. Estimating the availability of nitrogen in poultry manure through laboratoly and field studies. J. Environ. Qual. 1988, 17, 47–54. [Google Scholar] [CrossRef]
  66. Brinson, S.E.; Cabrera, M.L.; Tyson, S.C. Ammonia volatilization from surface-applied, fresh and composted poultry litter. Plant Soil 1994, 167, 213–218. [Google Scholar] [CrossRef]
  67. Lin, Y.; Watts, D.B.; Torbert, H.A.; Howe, J.A.; Feng, Y. Integration of poultry litter and mineral nitrogen on growth and yield of winter canola. Agron. J. 2020, 112, 2496–2505. [Google Scholar] [CrossRef]
  68. Pinto, R.; Brito, L.M.; Coutinho, J. Organic production of horticultural crops with green manure, composted farmyard manure and organic fertiliser. Biol. Agric. Hortic. 2017, 33, 269–284. [Google Scholar] [CrossRef]
  69. Adekiya, A.O.; Agbede, T.M.; Aboyeji, C.M.; Dunsin, O.; Simeon, V.T. Effects of biochar and poultry manure on soil characteristics and the yield of radish. Sci. Hortic. 2019, 243, 457–463. [Google Scholar] [CrossRef]
  70. James, D.W.; Hurst, C.J.; Tindall, T.A. Alfalfa cultivar response to phosphorus and potassium deficiency elemental composition of the herbage. J. Plant Nutr. 1995, 18, 2447–2464. [Google Scholar] [CrossRef]
  71. Magallanes-Quintanar, R.; Valdez-Cepeda, R.D.; Olivares-Saenz, E.; Perez-Veyna, O.; Garcia-Hernandez, J.L.; Lopez-Martinez, J.D. Compositional nutrient diagnosis in maize grown in a calcareous soil. J. Plant Nutr. 2006, 29, 2019–2033. [Google Scholar] [CrossRef]
  72. Luo, J.; Zhou, X.; Tian, Y.; Chen, Y.; Chen, L. Disturibution of nutrients in camellia oleifera abel. and their correlation with soil nutrients over the period of fruit maturation. Bangladesh J. Bot. 2020, 49, 499–505. [Google Scholar] [CrossRef]
  73. Li, B.; Wang, Y.; Jiang, Y.; Li, G.; Cui, J.; Wang, Y.; Zhang, H.; Wang, S.; Xu, S.; Wang, R. The accumulation and health risk of heavy metals in vegetables around a zinc smelter in northeastern China. Environ. Sci. Pollut. Res. 2016, 23, 25114–25126. [Google Scholar] [CrossRef] [PubMed]
  74. Šturm, M.; Kacjan-Marsic, N.; Zupanc, V.; Bracic-Zeleznik, B.; Lojen, S.; Pintar, M. Effect of different fertilisation and irrigation practices on yield, nitrogen uptake and fertiliser use efficiency of white cabbage (Brassica oleracea var. capitata L.). Sci. Hortic. 2010, 125, 103–109. [Google Scholar] [CrossRef]
  75. Gao, N.; Liu, Y.; Wu, H.; Zhang, P.; Yu, N.; Zhang, Y.; Zou, H.; Fan, Q.; Zhang, Y. Interactive effects of irrigation and nitrogen fertilizer on yield, nitrogen uptake, and recovery of two successive Chinese cabbage crops as assessed using N-15 isotope. Sci. Hortic. 2017, 215, 117–125. [Google Scholar] [CrossRef]
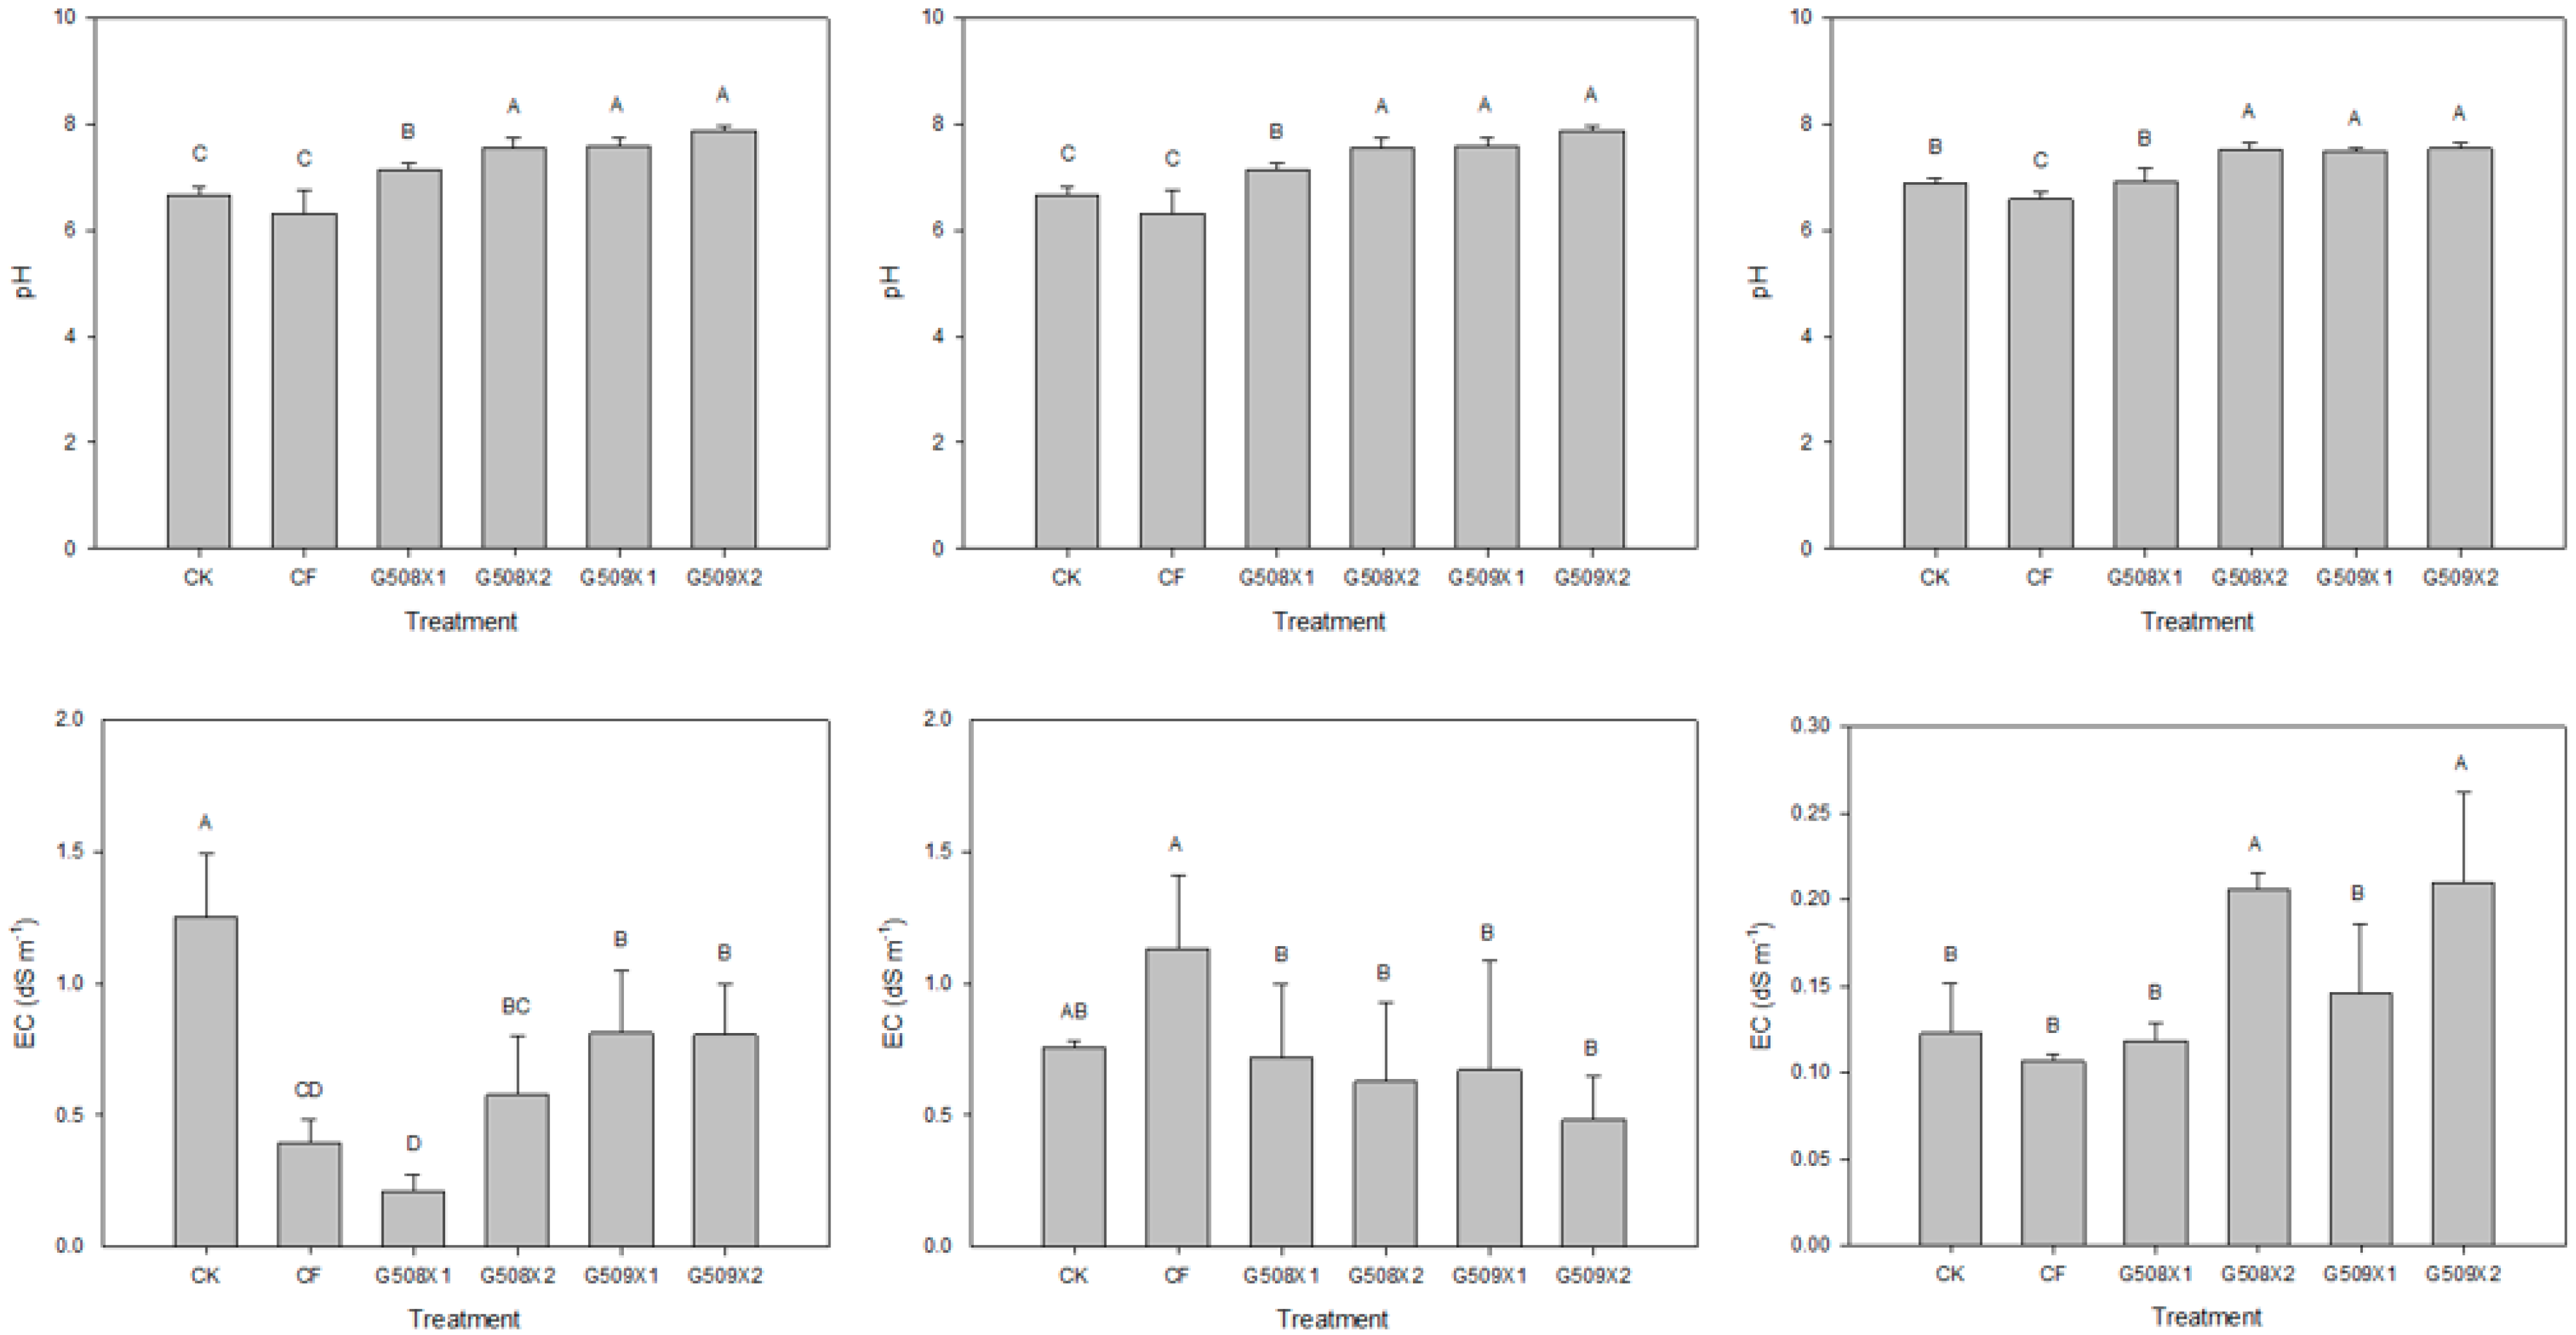
Figure 1. The pH and EC values of the soils after the field experiment: cabbage (left), Chinese cabbage (middle), and water spinach (right). The different letters indicate the significance among the treatments obtained through one-way ANOVA analysis (Duncan test, p < 0.05, n = 4). CK (control): no amendment; CF: chemical fertilizer at the recommended dose (RDs) of nitrogen; G508X1: G508 at the RD of nitrogen; G508X2: G508 at two times the RD of nitrogen; G509X1: G509 at the RD of nitrogen; G509X2: G509 at two times the RD of nitrogen.
Agronomy 12 02355 g001
Figure 2. The organic matter content of the soil after the field experiment under different treatments: cabbage (left), Chinese cabbage (middle), and water spinach (right). The different letters indicate the significance among the treatments obtained through one-way ANOVA analysis (Duncan test, p < 0.05, n = 4). The codes have the same meanings as those in Figure 1.
Agronomy 12 02355 g002
Figure 3. The contents of available N and available P of the soil after the field experiment under different treatments: cabbage (left), Chinese cabbage (middle), and water spinach (right). The different letters indicate the significance among the treatments obtained through one-way ANOVA analysis (Duncan test, p < 0.05, n = 4). The codes have the same meanings as those in Figure 1.
Agronomy 12 02355 g003
Figure 4. The contents of exchangeable K, exchangeable Ca, and exchangeable Mg in the soil after the field experiment under different treatments for cabbage (left), Chinese cabbage (middle), and water spinach (right). The different letters indicate the significance among the treatments obtained through one-way ANOVA analysis (Duncan test, p < 0.05, n = 4). The codes have the same meanings as those in Figure 1.
Agronomy 12 02355 g004
Figure 5. Concentrations of 2 M KCl-extractable NH4+-N, NO3-N, and total mineral N in the soils of the incubation experiment under different treatments (n = 3).
Agronomy 12 02355 g005
Figure 6. Changes in pH and EC in soils during the incubation experiment under different treatments (n = 3).
Agronomy 12 02355 g006
Figure 7. The yields of the three crops under different treatments: cabbage (left), Chinese cabbage (middle), and water spinach (right). The different letters indicate the significance among the treatments obtained through one-way ANOVA analysis (Duncan test, p < 0.05, n = 4). The codes have the same meanings as those in Figure 1.
Agronomy 12 02355 g007
Figure 8. The total concentrations of N, P, and K of the different crops under different treatments: cabbage (left), Chinese cabbage (middle), and water spinach (right). The different letters indicate the significance among the treatments obtained through one-way ANOVA analysis (Duncan test, p < 0.05, n = 4). The codes have the same meanings as those in Figure 1.
Agronomy 12 02355 g008
Figure 9. Total concentrations of Ca and Mg in the different crops under different treatments: cabbage (left), Chinese cabbage (middle), and water spinach (right). The different letters indicate the significance among the treatments obtained through one-way ANOVA analysis (Duncan test, p < 0.05, n = 4). The codes have the same meanings as those in Figure 1.
Agronomy 12 02355 g009
Table 1. Basic properties of the fertilizers used in this study.
FertilizerUnitG508G509Standards Announced by the AFA of the COA of Taiwan
G508G509
Water content%1310<20<20
pH 895–95–9
OM%5446>40>40
TN%5.03.1>2.51–4
P2O5%461–61–6
K2O%3.23.60.5–50.5–5
CaO%9.512.3N/AN/A
MgO%12.616.4N/AN/A
Asmg kg−11.31.0<25<25
Cdmg kg−1NDND<2.0<2.0
Crmg kg−1ND2.5<150<150
Cumg kg−12367<100<100
Hgmg kg−1<1.0<1.0<1.0<1.0
Nimg kg−1NDND<25<25
Pbmg kg−1NDND<150<150
Znmg kg−1294470<500<500
Coliform bacteriaMPN g−1<1N/A<1 × 103N/A
OM: organic matter content, TN: total nitrogen content, ND: not detectable, N/A: not applicable.
Table 2. The agronomic traits of cabbage, Chinese cabbage, and water spinach under different treatments.
CabbageChinese CabbageWater Spinach
Dry
Weight
Shoot
Height
Head
Diameter
Dry
Weight
Shoot
Height
Head
Diameter
Dry
Weight
Shoot
Height
Treatmentg head−1----------- cm -----------g head−1------------- cm -------------g plant−1cm
CK69.6 ± 0.1D14.9 ± 1.1D12.0 ± 1.0C53.4 ± 6.1AB25.2 ± 1.6ABC17.3 ± 1.6AB0.4 ± 0.1C34.9 ± 4.4C
CF124.2 ± 19.0AB24.0 ± 1.8A14.1 ± 1.0A51.3 ± 10.5AB23.7 ± 1.5CD18.4 ± 1.1A1.9 ± 0.4B79.7 ± 14.0A
G508X1110.5 ± 10.0BC18.0 ± 1.5C13.8 ± 0.3A45.8 ± 7.0BC25.8 ± 1.7AB16.5 ± 1.3B2.0 ± 0.3AB62.7 ± 10.9B
G508X2133.8 ± 15.4A24.1 ± 2.2A14.3 ± 0.9A59.2 ± 4.5A26.6 ± 2.1A18.5 ± 0.9A2.5 ± 0.4A77.4 ± 8.7A
G509X192.5 ± 16.8C18.7 ± 1.3BC13.0 ± 0.6B39.5 ± 4.4C24.6 ± 1.9BC14.5 ± 1.0C1.5 ± 0.4B57.6 ± 7.8B
G509X299.9 ± 14.3C19.8 ± 1.0B12.9 ± 0.7B45.9 ± 1.1BC22.8 ± 2.8D13.4 ± 2.3C1.6 ± 0.4B63.5 ± 10.8B
The different letters indicate the significance among the treatments obtained through one-way ANOVA analysis (Duncan test, p < 0.05, n = 4). The codes have the same meanings as those in Figure 1.
Table 3. Nutrition absorption proportions (NAP) of the three crops under different treatments.
TreatmentCabbage (%)
NPKCaMgCuZn
G508X15.1112.8131.43<5<5ND<5
G508X2<510.7124.77<5<5ND<5
G509X1<5<58.10<5<5ND<5
G509X2<5<56.30<5<5ND<5
TreatmentChinese cabbage (%)
NPKCaMgCuZn
G508X1<5<58.00<5<5ND<5
G508X2<5<522.02<5<5ND<5
G509X1<5<5<5<5<5ND<5
G509X2<5<5<5<5<5ND<5
TreatmentWater spinach (%)
NPKCaMgCuZn
G508X136.13177.2489.126.256.13<5<5
G508X223.37115.9351.316.00<5<5<5
G509X123.1557.54214.37.13<5<5<5
G509X211.3829.72151.0<5<5<5<5
<5: NAP less than 5%, ND: concentration was not detectable. The codes have the same meanings as those in Figure 1.
Publisher’s Note: MDPI stays neutral with regard to jurisdictional claims in published maps and institutional affiliations.