Abstract
Research is still under-represented for the long-term impacts of field biochar application on soil fertility, rice production and mineral nutrition and soil C sequestration. To investigate these effects, a field trial was established in the fall of 2010 with low (2.4 t ha−1), intermediate (6 t ha−1) and high (12 t ha−1) biochar doses. The biochar effect on soil nutrients is more pronounced in the surface soil and is dose dependent. In the surface soil, biochar application increased the availability of soil N, P and K. High dose decreased soil total Fe by 11.6% and Mn by 20.7%, leading to a slight but insignificant decrease in grain Fe and Mn concentration. The intermediate and high doses significantly increased the soil available Zn by 96.2% and 227.9% but did not affect the grain Zn concentration. Grain Cu concentration was significantly decreased by the intermediate (−19.6%) and high (−14.3%) dose of biochar. Biochar had a slight but insignificant boost on rice yield. Soil total C and N increased linearly with biochar application for the surface soil only where biochar was applied. In conclusion, with great soil C sequestration capacity, the long-term field return of biochar is beneficial for improving the soil macronutrient and Zn fertility, but caution is needed, as higher doses of biochar could potentially lead to a decrease in soil Fe and Mn and a reduction in grain Cu concentration.
1. Introduction
The utilization of agricultural wastes to produce biochar aids in reducing the potential environmental pollution sources and promoting the development of circular and sustainable agriculture. As a carbon-rich material, biochar is derived by pyrolyzing biomass at low temperatures under conditions of low or absent oxygen. The potential of biochar to preserve nutrients, improve soil fertility, enhance crop productivity, remediate environmental pollutants and sequester carbon is immense, which brings potential economic solutions to outstanding global problems, such as environmental pollution, food security and climate change [1,2,3].
Biochar has great agronomic and environmental effects and has been progressively adopted in agroecosystems [4]. Biochar benefits crop nutrition and productivity directly through its fertilizer effect [5] and biostimulant effect [3] and indirectly through its effects on nutrient and moisture retainment [6,7] and changes in soil biophysiochemical properties. Biochar application is reported to increase soil aggregation [8], cation exchange capacity [9] and acidic soil pH and stimulate microbial growth and function by protecting microbiota from predators and offering a habitat and nutrient reservoir for them [10,11,12]. Biochar can adsorb N, P and other nutrients and then slowly release nutrients after they are applied to the soil, thereby improving the utilization rate of soil nutrients [13,14]. In addition, biochar also has the functions of stabilizing soil C pools and promoting agricultural C sequestration [15,16,17]. In a meta-analysis, biochar was found to be composed mostly of recalcitrant C (97%), which has a mean residue time of 556 yrs, and biochar application reduced the decomposition of soil organic matter (SOM) by 3.8% [18]. The results indicate that atmospheric CO2 can be preserved as a stable C pool and stored for hundreds of years by forming biochar from biomass. Previous studies focused mainly on the short-term effect of biochar application due to the limited duration of experiments. Studies are still lacking regarding soil fertility, crop productivity, mineral nutrition and soil C responses to long-term (>10 years) biochar application.
Due to the unique properties of biochar, it can effectively immobilize trace metal elements and reduce their bioavailability. Many studies indicate that biochar can immobilize trace metal elements, such as lead (Pb), chromium (Cr), cadmium (Cd), zinc (Zn) and copper (Cu) [19,20], via at-surface processes (e.g., ion exchange, precipitation, adsorption and complexation, etc.), which are largely associated with biochar properties, mainly high pH, high and complex C, large surface area and abundant functional groups [21]. The availability of many trace metal ions is generally greater at lower pH. High soil pH after biochar application could enhance the complexation and precipitation of trace metal ions and their adsorption to soil and biochar particles, leading to a decrease in soil metal ion availability [12,21]. High and complex SOM upon biochar application could alter soil trace metal availability by chelation, leading to less soluble but more organic-bound metals. Moreover, the large surface area and great oxygen-containing functional groups of biochar favor the adsorption of trace metals and the formation of organo-mineral micro-agglomerates on the surface, especially when biochar experiences aging processes in the soil [12].
However, the effect on distinct metal ions is not consistent in the literature, and the performance of biochar is largely associated with pyrolysis temperature, feedstock type, application rate and soil properties [22,23]. For example, Xu et al. (2022) found that rice straw biochar pyrolyzed at 500 °C reduces soil iron (Fe) but increases manganese (Mn) availability in a 90 d incubation when added at a dose of 5% (w/w) in an acidic and neutral soil [12]. In a pot experiment, Namgay et al. (2010) found that wood biochar pyrolyzed at 550 °C decreases maize As, Cd, Pb and Cu concentrations, increases maize Zn concentration and soil As and Zn availability in a sandy soil (pH 6.38) [24]. Hard wood-derived biochar pyrolyzed at 550 °C was found to facilitate the uptake of micronutrients (Mn, Cu, Zn) and to enhance the productivity of beet in a field trial with podzolic soil (pH 6.38). In general, these results indicate that biochar may potentially decrease the solubility and availability of soil micronutrients while immobilizing heavy metals. However, these or other results are inconsistent and generated largely from microcosm incubation, pot experiments or short-term field trials. It is still unclear how long-term biochar application in the field would affect soil micronutrient (Fe, Mn, Cu and Zn) availability and rice micronutrient nutrition.
A multi-year field trial initiated in 2010 was conducted to evaluate the long-term effect of biochar dose on (1) soil fertility, i.e., the total content and bioavailability of soil macro- (N, P, K) and micronutrient (Fe, Mn, Cu, Zn); (2) rice yield and grain macro- and micronutrient minerals; and (3) soil C sequestration capacity. Consequently, three hypotheses were put forward in this study: (1) long-term biochar application may result in a decrease in soil micro- but not macronutrient availability, as the N, P and K fertilizer are supplied every season; (2) the effect would potentially lead to a reduction in grain micronutrients, but the effect is element and dose specific; (3) biochar would significantly increase soil C content, and the effect is most notable for the plow layer (0–15 cm), where the biochar is applied.
2. Materials and Methods
2.1. Biochar
The biochar used in the field experiment was produced from chopped (<5 cm) corn stalks from locals using a low-temperature pyrolysis furnace under limited oxygen. The pyrolysis temperature was raised to 400 °C and kept for 8 h before cooling down. The yield of biochar was around 40%, and the basal physicochemical properties of the biochar and corn stalks are given in Table 1.

Table 1.
Basic properties of corn stalks and their derived biochar.
2.2. Experimental Site
The field experiment was located in Xiaoji Town, Jiangdu District, Yangzhou, China (32°35′5″ N, 119°42′0″ E). The region is located in the transition climatic zone, from a subtropical humid monsoon climate to a temperate monsoon climate. The average annual temperature is 14.0 °C, and precipitation is 1058 mm, with the frost-free period being 220 d. The soil texture is 20% sand, 58% silt and 22% clay. Soil basic physicochemical properties are pH 6.0, bulk density (1.2 g cm−3), total carbon (TC) 17.5 g kg−1, total nitrogen (TN) 1.99 g kg−1, total phosphorus (TP) 0.635 g kg−1, total potassium (TK) 15.2 g kg−1, Olsen phosphorus (AP) 13 mg kg−1, available potassium (AK) 49 mg kg−1.
2.3. Experimental Setup
The long-term field plot experiment was established in the fall of 2010 with the local wheat and rice rotation growing system. Four biochar doses were designed as experimental treatments: no biochar (B0, 0 t ha−1 yr−1), low dose (B1, 2.4 t ha−1 yr−1), intermediate dose (B2, 6 t ha−1 yr−1) and high dose (B3, 12 t ha−1 yr−1). The experimental plot was 10 m2 (4 m × 2.5 m) with three replicates and arranged in a randomized complete block design. The biochar was applied and mixed with surface soil (0–15 cm) annually before wheat cultivation (early November). The fertilizer regime (N: P2O5: K2O, kg ha−1 yr−1) was 180:50:50 for the wheat season and 200:70:70 for the rice season. Specifically, for wheat production (Ningmai No.14, 3200 plants per plot), P and K compound fertilizers were supplied as basal fertilizers, and urea was applied as base fertilizer (early November), jointing fertilizer (mid-March) and ear fertilizer (mid-April), with a proportion of 3:4:3. The planting density of rice (South Japonica 40) was 240 holes per plot, with 3 seedlings in each hole. The fertilizer regime was similar to the wheat season, with urea being assigned into base fertilizer (mid-June), tiller fertilizer (early July) and ear fertilizer (end of July) at a proportion of 3.5:3.5:3. The rice plots were periodically flooded and drained with intermittent irrigation, according to the local water management.
2.4. Plant and Soil Sampling
Rice grains were sampled in October 2021 after yield determination. The grain samples were oven dried at 70 °C for 48 h and ground for elemental analysis. Surface (0–15 cm) and subsurface (15–30 cm) composited soil samples were collected in late October 2021 at which time the field experiment had been continuously operated for 11 years. The soil samples were brought back to the laboratory and divided into two parts, with one being ground to pass a 20-mesh and a 100-mesh sieve for the determination of soil pH, available and total nutrients, and the other being stored at −20 °C for ammonium and nitrate measurements.
2.5. Plant and Soil Analyses
Grain C and N were determined by an elemental analyzer (Varo EL cube, Hanau, Germany). Grain samples were digested with H2SO4-H2O2 and determined for P and K by a spectrophotometer and a flame photometer, respectively. The concentrations of grain Fe, Mn, Cu and Zn were determined by an inductively coupled plasma spectrometer (Optima 7300 DV, Waltham, MA, USA) after dry ashing.
Soil pH was measured with a water: soil ratio of 2.5:1. Soil total C and N were analyzed with an elemental analyzer (Vario EL cube, Hanau, Germany). Soil Olsen P was extracted with 0.5 mol L−1 NaHCO3 and determined by a spectrophotometer. Soil available K (AK) was extracted with 1 mol L−1 NH4OAC and measured by a flame photometer. Fresh soil was extracted with 2 mol L−1 KCl and then determined for ammonia (NH4+) by the indophenol blue colorimetric method and nitrate and nitrite (NOx−–N), according to Doane et al. [25].
Soil available Fe, Cu, Mn and Zn (AFe, ACu, AMn and AZn) were analyzed by an inductively coupled plasma spectrometer (Optima 7300 DV, Waltham, MA, USA) after extraction with DTPA-CaCl2-TEA (pH 7.3). The total amounts of soil P, K, Fe, Cu, Mn and Zn (TP, TK, TFe, TCu, TMn and TZn) were determined by the same inductively coupled plasma spectrometer after digestion with a mixture acid of HCl-HNO3-HF-HClO4.
2.6. Statistical Analysis
One-way ANOVA and two-way ANOVA followed by the Tukey HSD multiple comparisons test were conducted using GraphPad Prism 9.0.0 for Windows, GraphPad Software, San Diego, CA, USA, www.graphpad.com (accessed on 16 April 2022). The Pearson correlation and line regression analyses were performed in Hiplot (https://hiplot.org, accessed on 18 April 022), a comprehensive and easy-to-use web service boosting the publication-ready biomedical data visualization.
3. Results
3.1. Soil Physicochemical Properties
The surface and subsurface soil had significantly different soil pH, total C, total N, NH4+–N and NOx–N (Table 2). Soil pH was generally higher in the subsurface soil (7.14–7.47) than in the surface soil (6.19–6.48), and biochar did not affect soil pH in both soil depths. Soil NH4+–N, NOx−–N, total C and total N were generally higher in the surface soil than in the subsurface soil. Biochar increased soil NH4+–N and NOx−–N in both soil depths, especially when biochar was applied at low (B1) and intermediate (B2) doses by comparison to no biochar control (B0). Soil total C and N increased linearly with biochar dose, but the effect was significant in the surface soil only, leading to significant Dose × Depth interactions (Table 2). High dose of biochar (B3) induced 3.25 and 2.13 times soil total C and N, respectively, when compared to no biochar control.
Table 2.
pH, NH4+–N, NOx−–N, total C and N of surface (0–15 cm) and subsurface (15–30 cm) soils after 11 years of continuous application of corn stalk biochar at 0 (B0), 2.4 (B1), 6 (B2) and 12 (B3) t ha−1 yr−1.
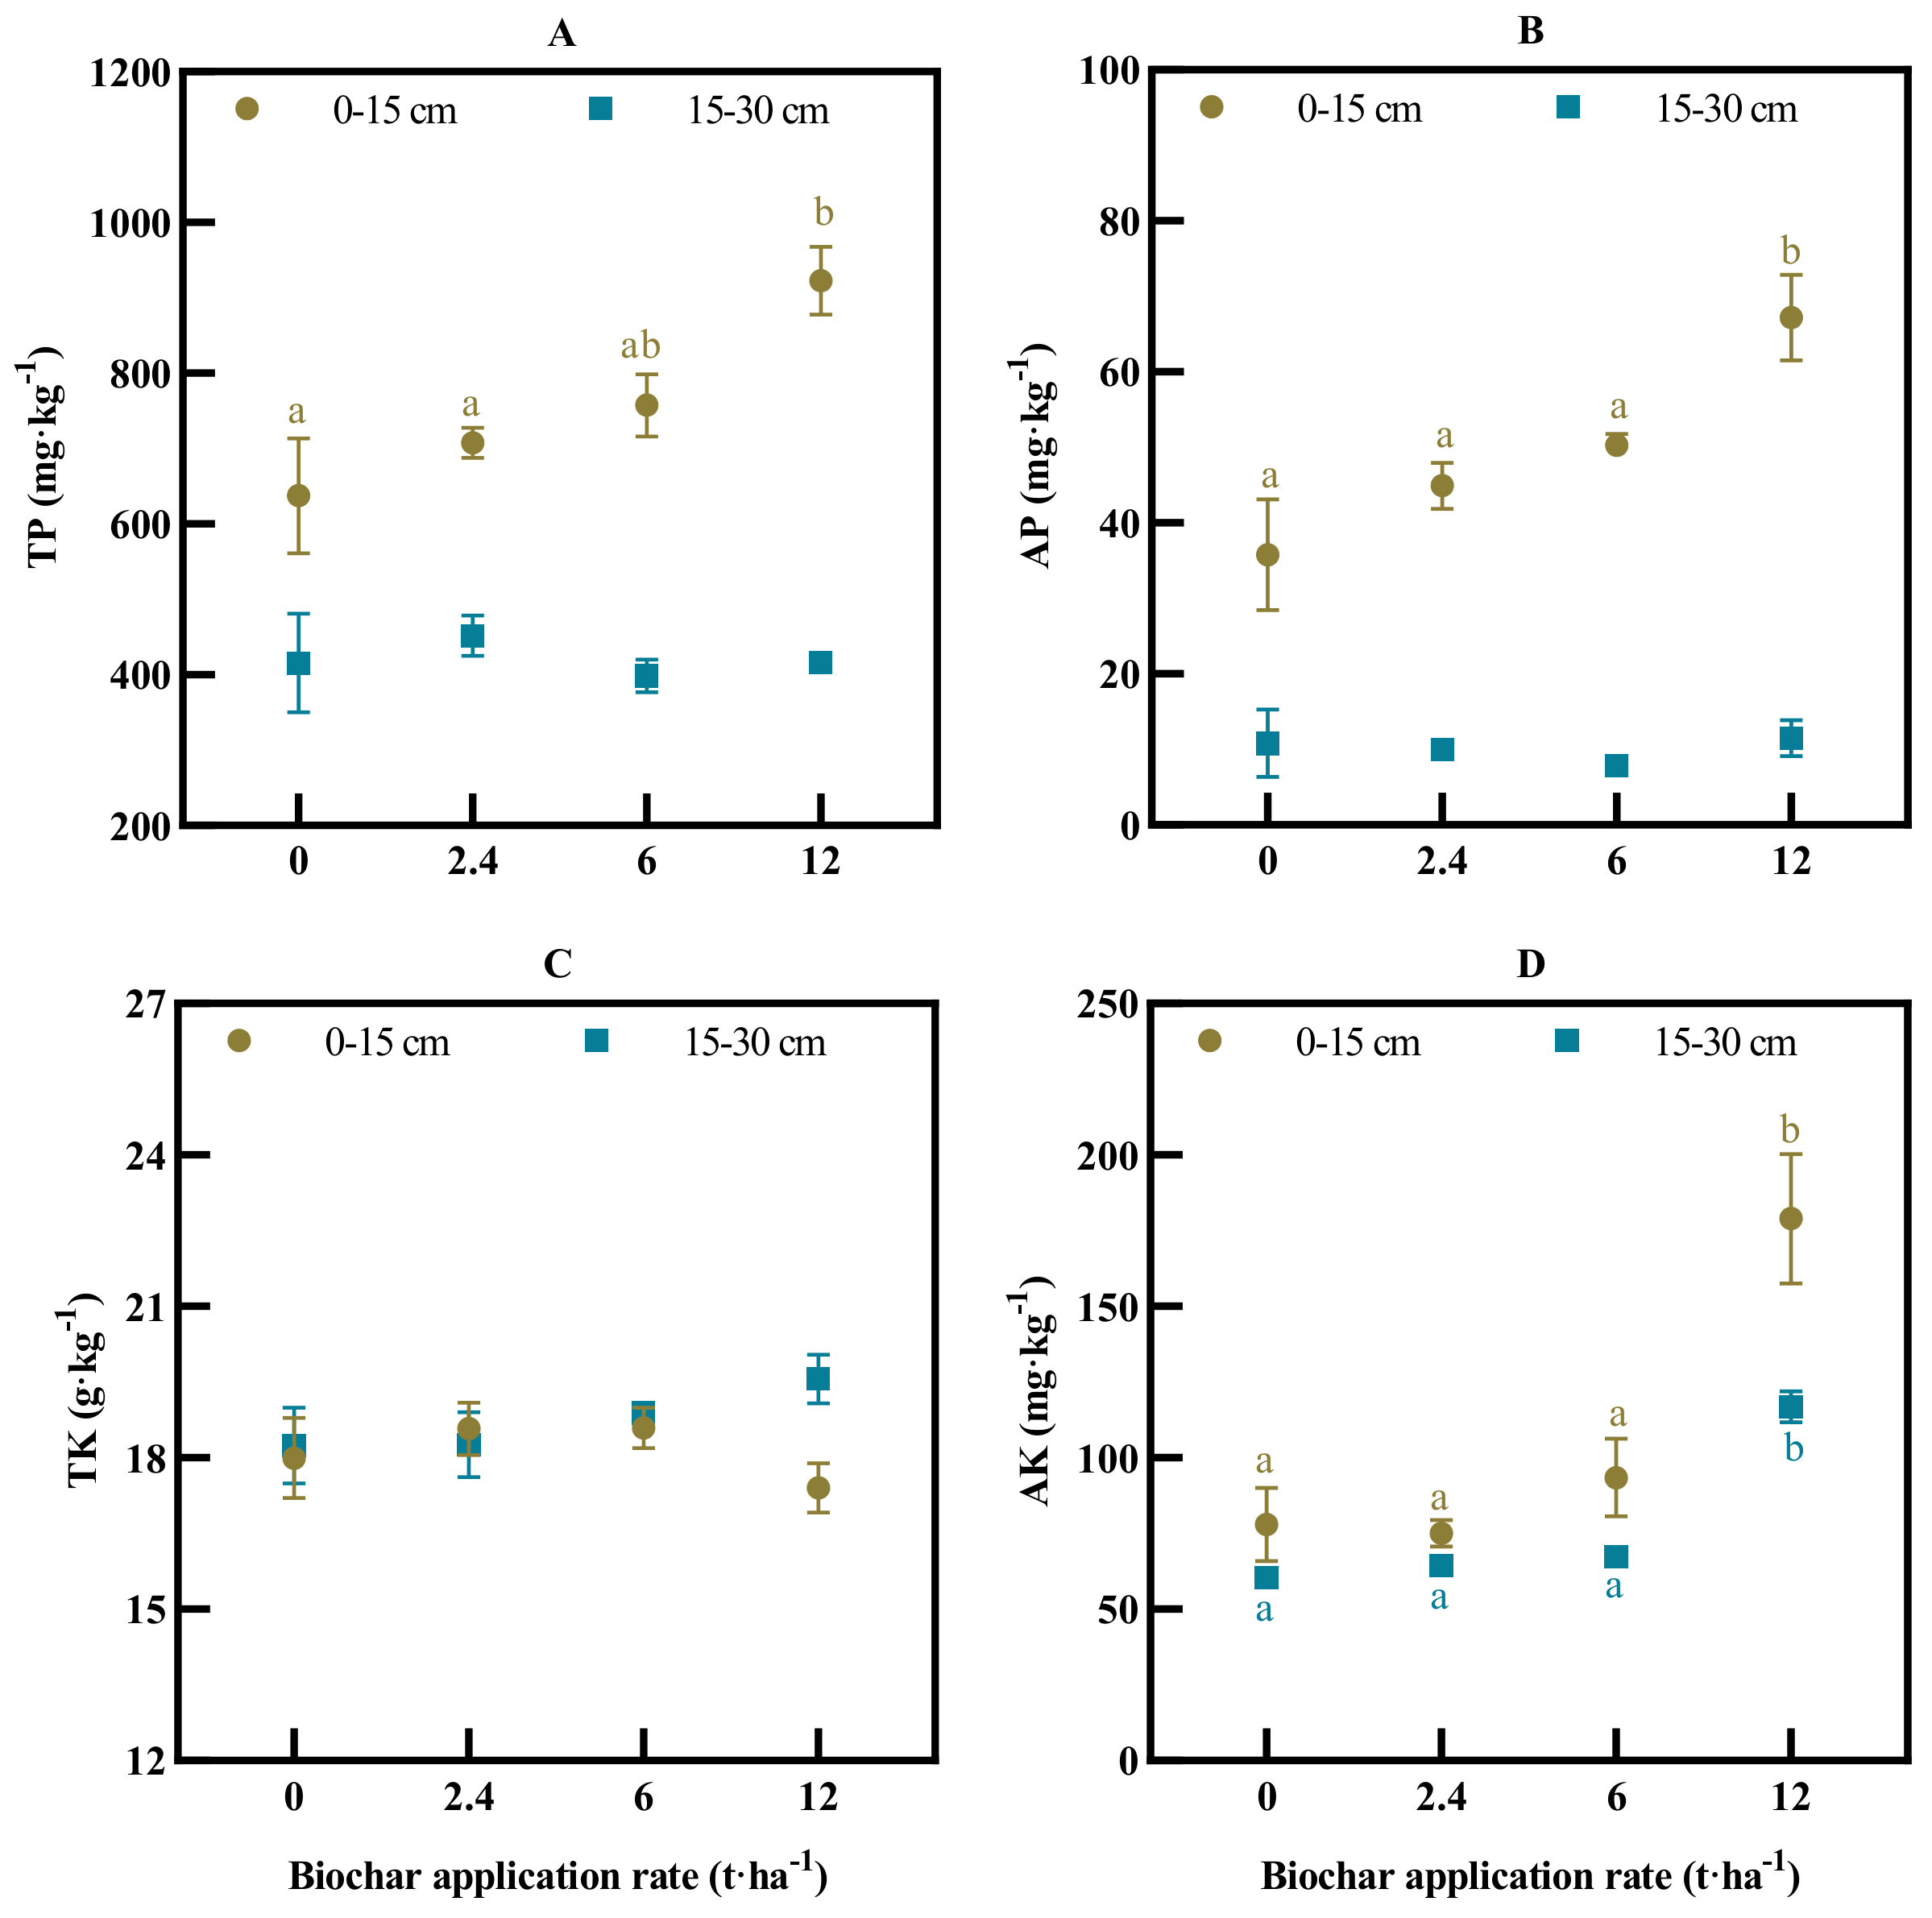
Soil total P and Olsen P were generally higher in the surface soil than in the subsurface soil (Figure 1A,B). Biochar did not affect soil total P and Olsen P in the subsurface soil (Figure 1A,B). In the surface soil, soil Olsen P and total P linearly increased with biochar application dose and reached the highest value at the high dose, which was 1.45 and 1.88 times that of control. Soil total K and available K had fewer differences between the two soil depths (Figure 1C,D). All biochar application doses did not affect soil total K in both soils, but high biochar dose (B3) increased soil available K by 129.5% and 93.1% in the surface and subsurface soil, respectively, when compared to no biochar control.
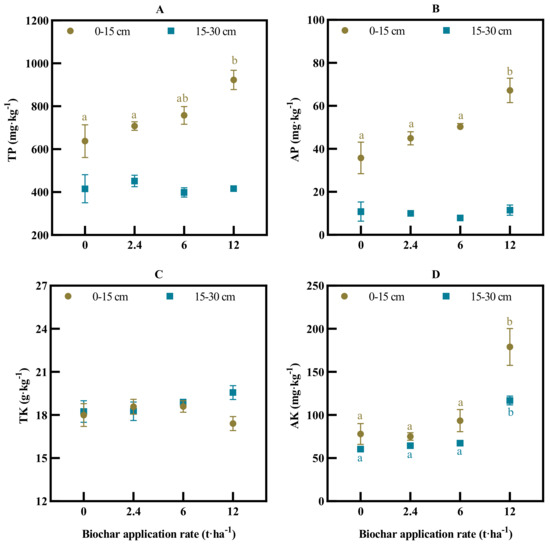
Figure 1.
Soil total P (TP, (A)), total K (TK, (C)), Olsen P (AP, (B)) and available K (AK, (D)) of surface (0–15 cm) and subsurface (15–30 cm) soils after 11 years of continuous application of corn stalk biochar at 0, 2.4, 6 and 12 t ha−1 yr−1. Error bars are ± s.e. (n = 3). Significant differences between biochar doses in the same soil depth were denoted by lower-case letters.
3.2. Soil Total Fe, Mn, Cu, Zn and Their Availability
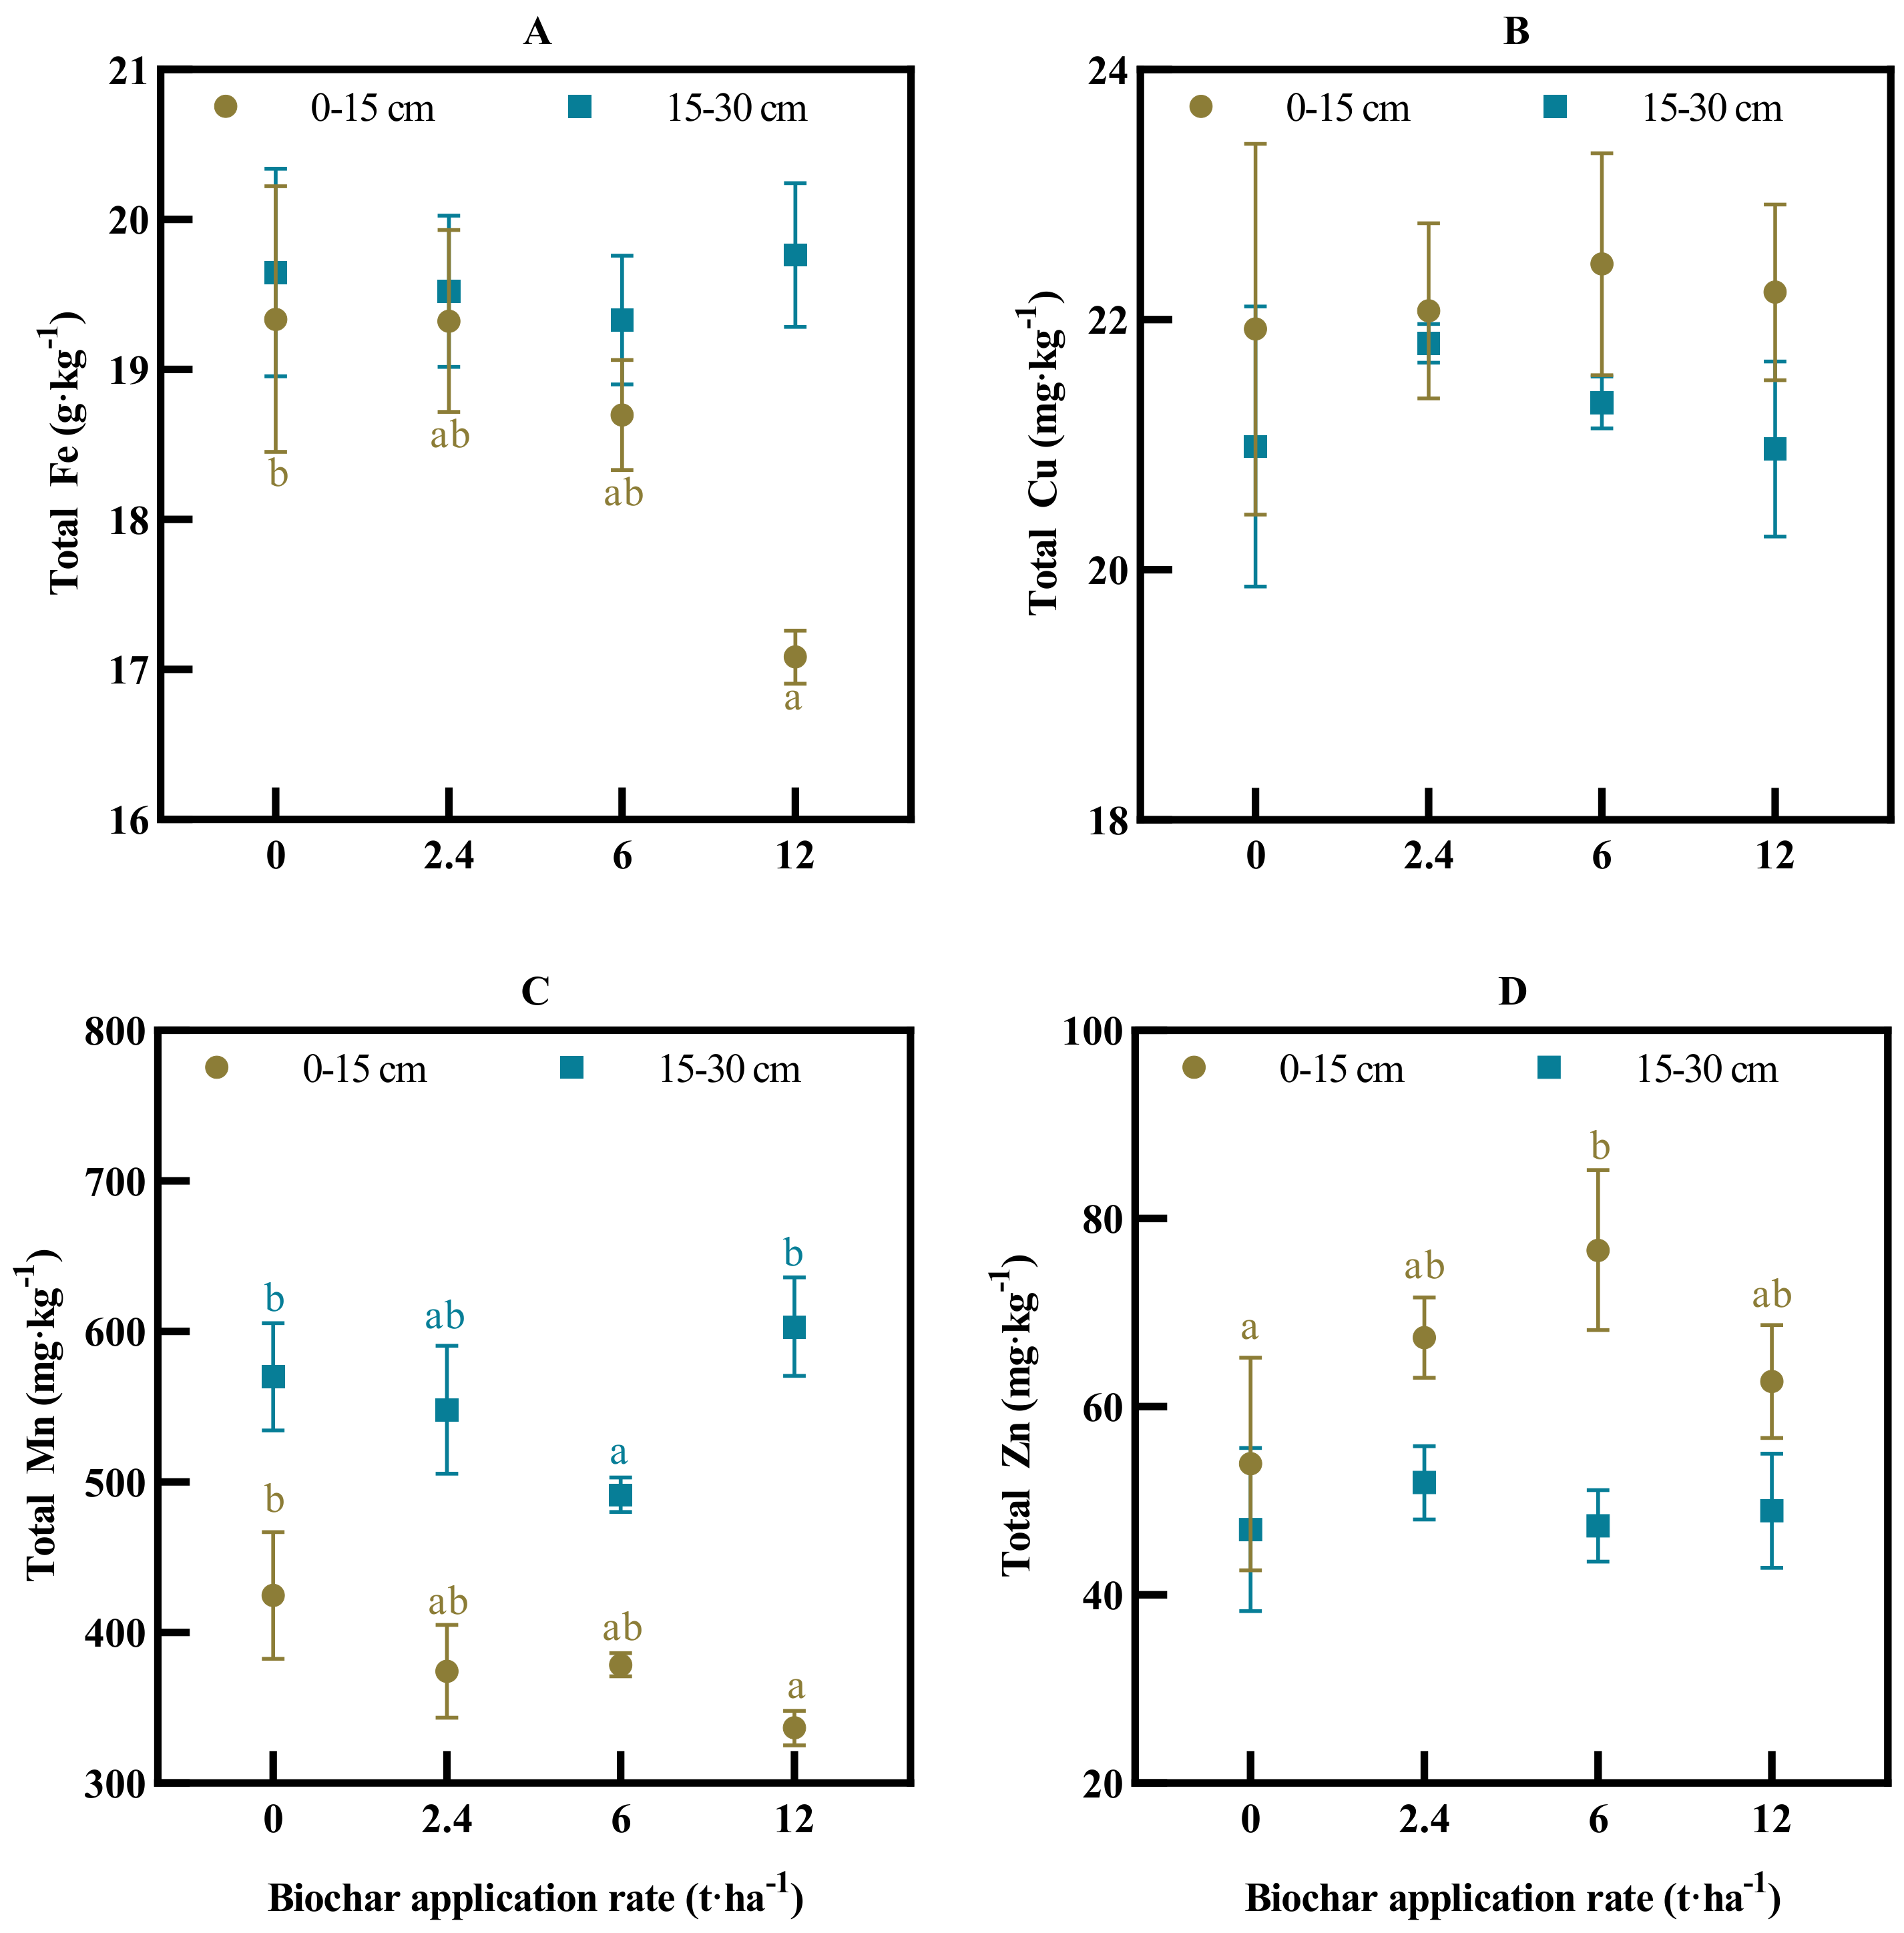
Soil total Fe was higher in the subsurface soil (19.3–19.8 g kg−1) compared to surface soil (17.1–19.3 g kg−1), especially when a high dose of biochar was applied (Figure 2A). Biochar did not affect soil total Fe in the subsurface soil but decreased the total Fe in the surface soil, with a significant decrease (−11.6%) being detected for B3 when compared to B0. Soil total Mn was also higher in the subsurface soil (491.6–603.3 mg kg−1) than in the surface soil (336.8–424.9 mg kg−1). Soil total Mn decreased linearly with biochar application dose in the surface soil, with a significant decrease (−20.7%) being found for B3 when compared to B0 (Figure 2C). Moreover, soil total Mn was significantly lower (−13.8%) in B2 when compared to B0 in the subsurface soil. Soil total Cu tended to be higher in the surface soil than in the subsurface soil, with no obvious biochar effect for both soils (Figure 2B). Soil total Zn was higher in the surface soil (47.0–51.9 mg kg−1) than in the subsurface soil (53.0–67.4 mg kg−1) (Figure 2D). Biochar did not affect soil total Zn in the subsurface soil. In the surface soil, soil total Zn first increased and then decreased with the increase in biochar application dose, reaching a peak at B2, which was 42.1% higher than B0.
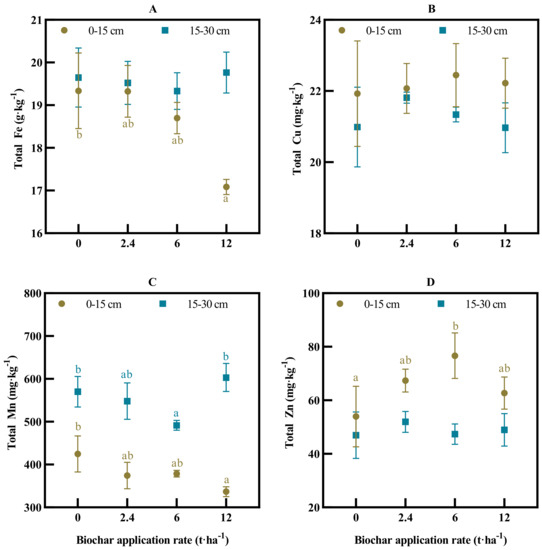
Figure 2.
Soil total Fe (A), Cu (B), Mn (C) and Zn (D) of surface (0–15 cm) and subsurface (15–30 cm) soils after 11 years of continuous application of corn stalk biochar at 0, 2.4, 6 and 12 t ha−1 yr−1. Error bars are ± s.e. (n = 3). Significant differences between biochar doses in the same soil depth are denoted by lower-case letters (p < 0.05).
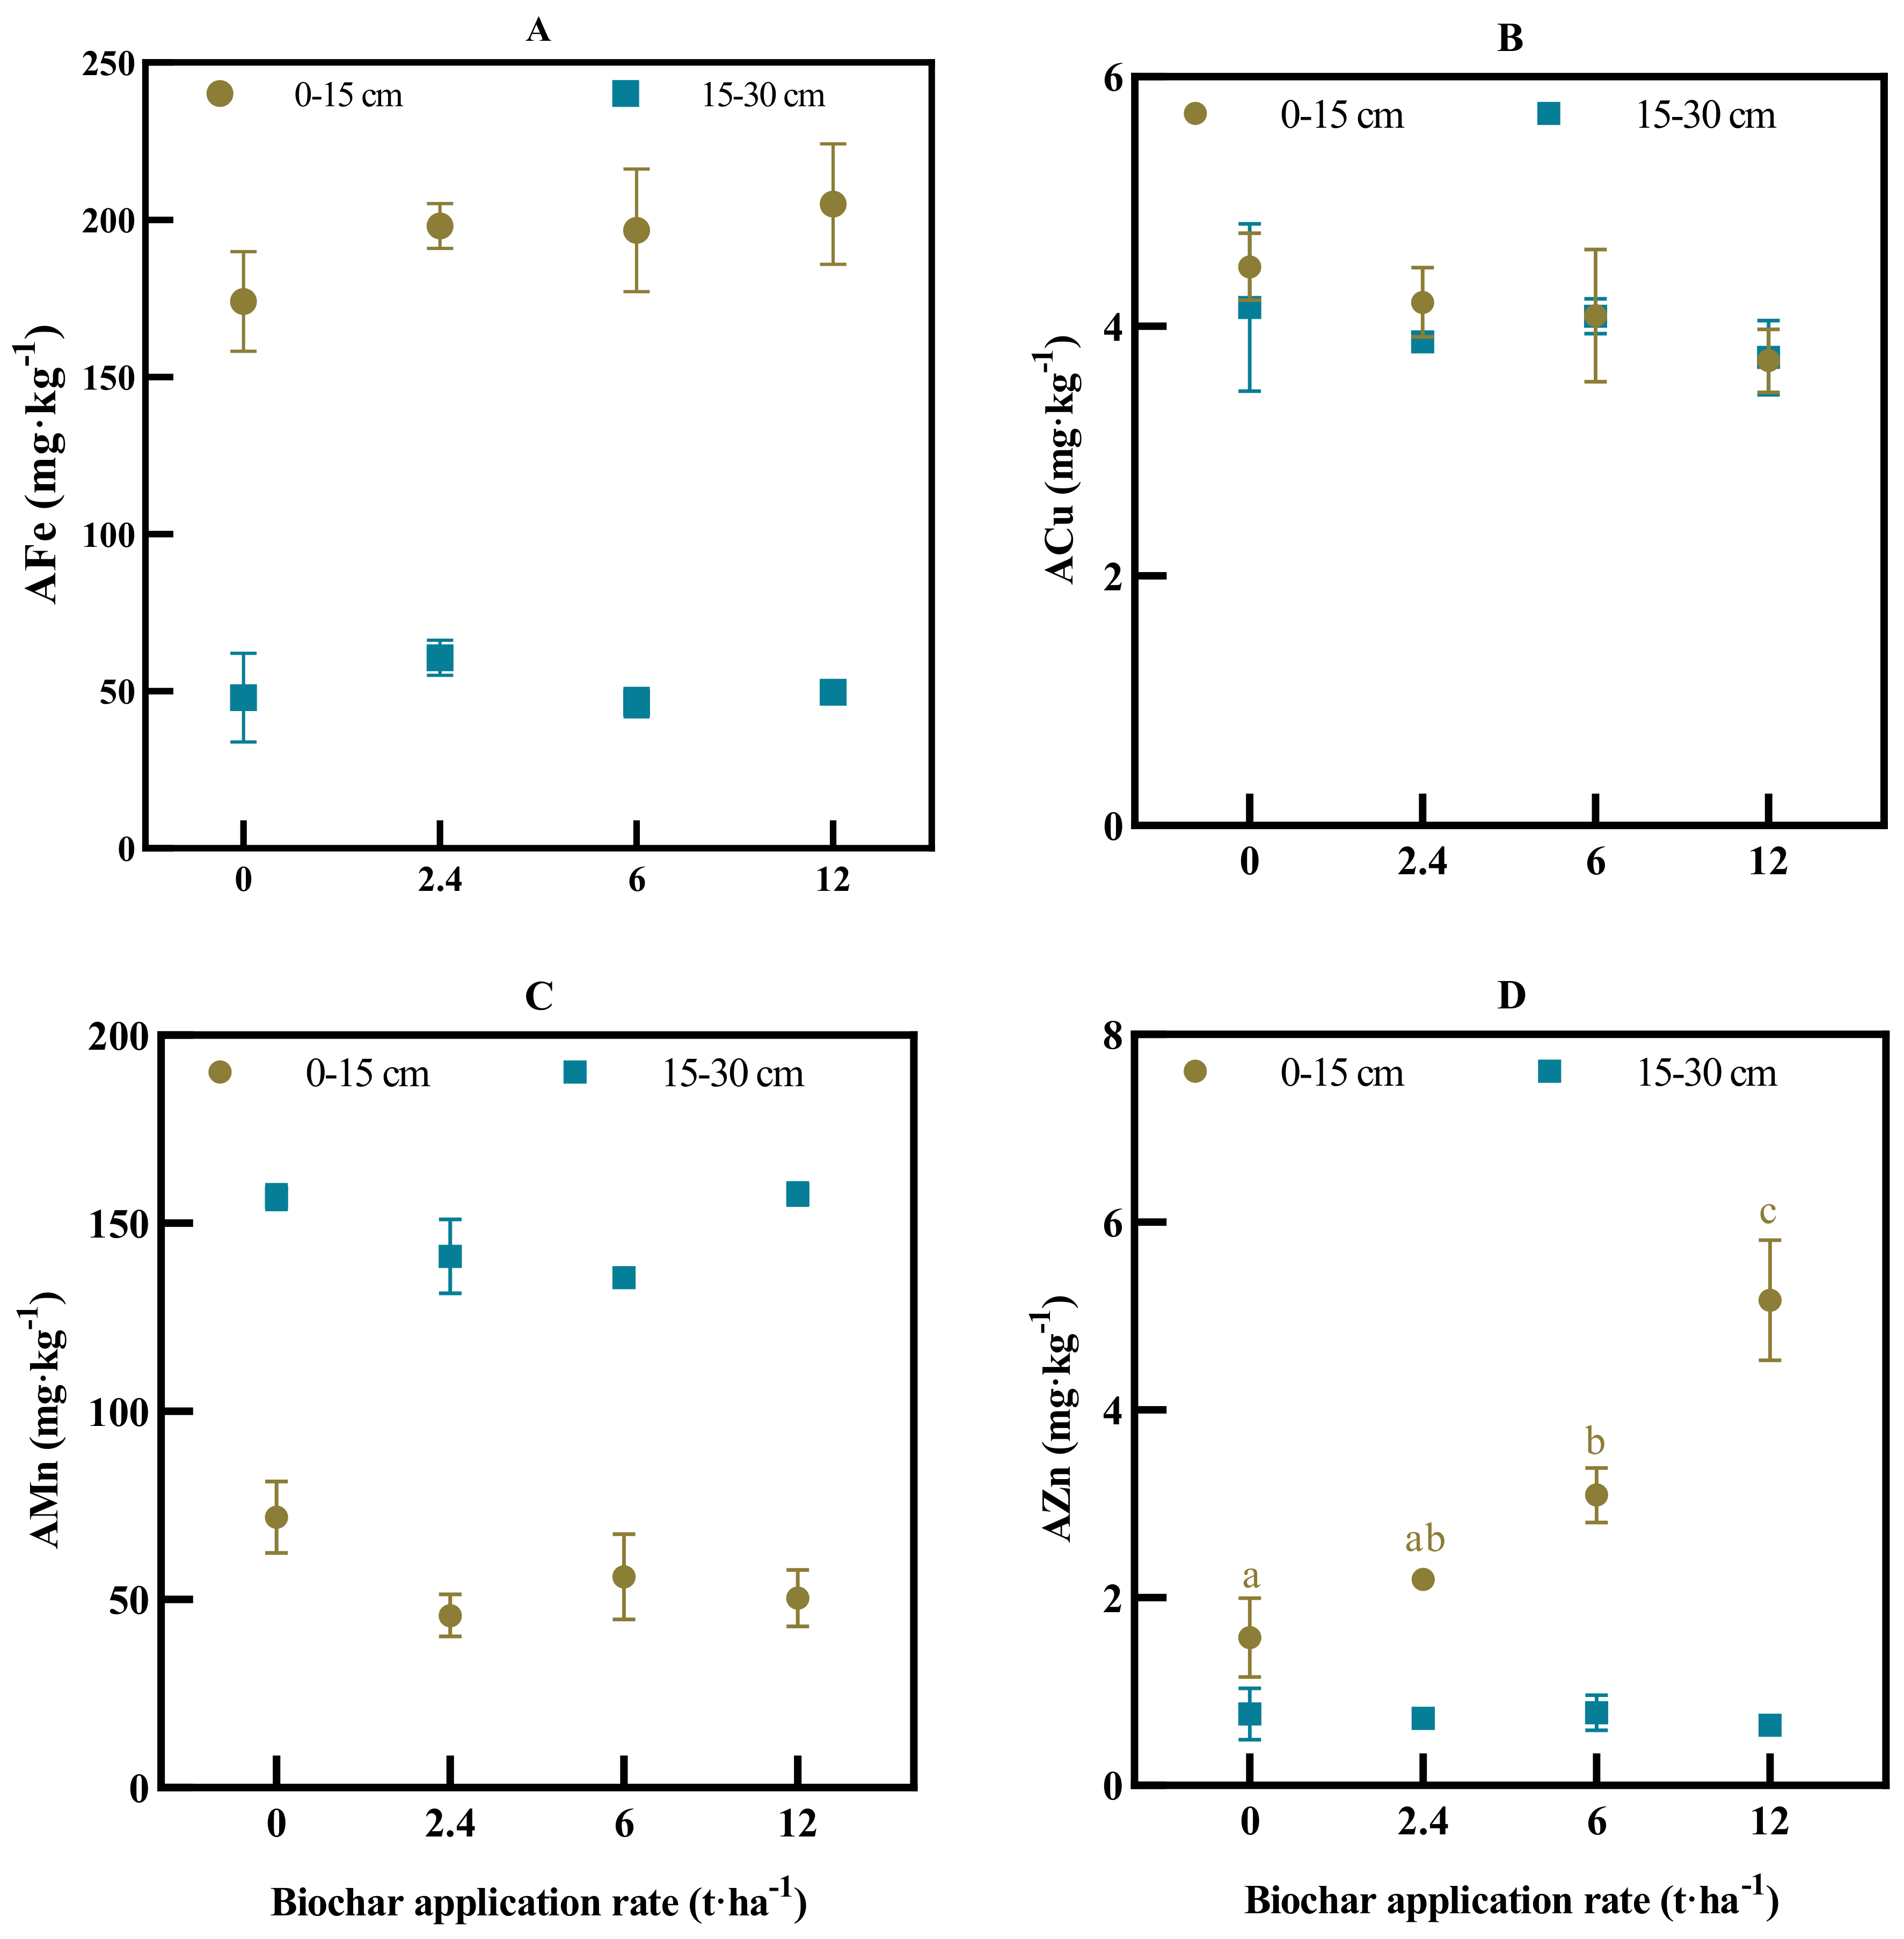
Soil available Fe and Zn were significantly higher in the surface soil than in the subsurface soil (Figure 3A,D), and the result was the opposite for soil available Mn, which was much higher in the subsurface soil (135.5–157.8 mg kg−1) than in the surface soil (41.3–71.9 mg kg−1) (Figure 3C). Specifically, soil Cu and Mn availability tended to decrease with biochar application dose but with no significant statistical differences with B0 in the surface soil (Figure 3B,C). Soil Fe and Zn availability tended to increase with biochar application dose (Figure 3A,D), and the differences in soil available Zn were significant by comparison to B0 when higher doses (B2, B3) of biochar were applied. Specifically, the intermediate and high doses of biochar increased soil available Zn by 96.2% and 227.9%, respectively, when compared to B0 (Figure 3D). Soil available Zn was positively correlated with soil total C and N (R2 = 0.88, Figure 4A,B).
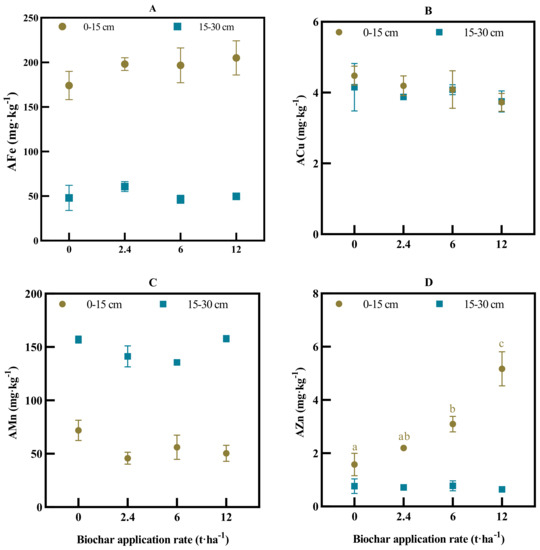
Figure 3.
Soil available Fe (A), Cu (B), Mn (C) and Zn (D) of surface (0–15 cm) and subsurface (15–30 cm) soils after 11 years of continuous application of corn stalk biochar at 0, 2.4, 6 and 12 t ha−1 yr−1. Error bars are ± s.e. (n = 3). Significant differences between biochar doses in the same soil depth are denoted by lower-case letters (p < 0.05).
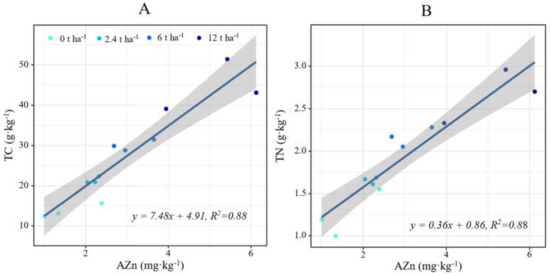
Figure 4.
The relationship between soil available Zn (AZn) with soil total carbon (TC, (A)) and total nitrogen (TN, (B)) in the surface (0–15 cm) soil.
3.3. Rice Yield and Mineral Nutrients
The yield of rice was 7.21 t ha−1 in B0, and biochar application tended to increase the yield of rice but with no significance when compared to control (Table 3). Biochar application had no obvious effect on N, P, Fe and Zn concentrations but tended to decrease K, Fe and Mn concentrations of rice grain when compared to B0 (Table 3). Moreover, biochar decreased the Cu concentration of rice grain, with significant reductions being found for the intermediate (−19.6%) and high (−14.3%) doses of biochar when compared to control (Table 3).
Table 3.
Grain N, P, K and Fe, Cu, Mn, Zn of rice grown in soils after 11 years of continuous application of corn stalk biochar at 0 (B0), 2.4 (B1), 6 (B2) and 12 (B3) t ha−1 yr−1.
3.4. Correlation of Soil Micronutrients with Physicochemical Properties
In the surface soil, soil available Fe was negatively correlated with soil pH; soil available Mn was positively correlated with soil pH but negatively correlated with soil available Fe; soil available Zn was positively correlated with soil total C and N; soil total Mn was negatively correlated with soil total N; soil total Cu was negatively correlated with soil pH (Figure 5). In the subsurface soil, soil available Fe was positively correlated with soil total C; soil available Cu, Zn and total Cu were positively correlated with soil total C and N; soil total Zn was positively correlated with total C (Figure 5).
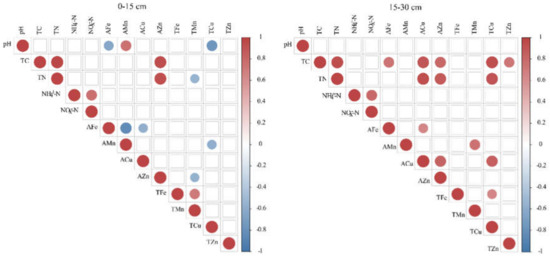
Figure 5.
Pearson’s correlation among soil pH, total C (TC), total N (TN), NH4+–N, NOx−–N, available and total Fe, Mn, Cu and Zn in the surface (0–15 cm) and subsurface (15–30 cm) soil. The red circle indicates a positive correlation, and the blue circle indicates a negative correlation. Significant correlations (p < 0.05) were presented by circles. The red circle indicates a positive correlation, and the blue circle indicates a negative correlation. The larger the coefficient, the bigger the size of the circles. The larger the coefficient, the darker the color of the circles.
4. Discussion
4.1. Long-Term Biochar Effect on Soil Fertility Status of Macro- and Micronutrients
The surface soil (0–15 cm) accumulated significantly high amounts of total N and P but not K after 11 years of biochar application, reaching the highest level at 12 t ha−1 (Table 2 and Figure 1A,C). Biochar itself is rich in N and P (Table 1), and the annual application of it brought about large quantities of these minerals in soil where biochar was applied (Table S1). Moreover, biochar may have improved N and P retention from leaching and/or migration downward [26] via surface adsorption, precipitates, complexation and ion changes due to high surface area, porosity and more C-containing functional groups, which is supported by the result, whereby biochar had no effect on soil total N and P in the subsurface soil when compared to no biochar control (Table 2 and Figure 1A,C). Biochar application increased NH4+–N and NOx−–N retention in both soil depths (Table 2), probably by adsorption of NH4+–N and reduced leaching of NOx−–N, which is consistent with the findings of Gao et al. (2016) [27] and Sorrenti, Ventura and Toselli (2016) [28]. Moreover, the accumulation of N may also be associated with less gaseous loss [26] and the assumption and fact that biochar can reduce the mineralization of residue and SOM—i.e., the negative priming effect [29,30]. Biochar may also affect soil N availability via increases in microbial immobilization and nitrification processes [31,32]. The availability of P and K was increased with biochar addition, and it depended on biochar dose and soil depth (Figure 1B,D), which is compatible with many previous findings [33,34,35]. The results indicate that biochar may serve as a slow-release fertilizer, benefit crop production and reduce nutrient leaching to other environments.
Similar to soil N, P and K, the biochar effect on soil micronutrients was also more pronounced in the surface soil than the subsurface soil. The effects of biochar dose on micronutrients showed inconsistent results. Biochar had adverse effects on soil total Fe and Mn, as they decreased with biochar dose in the surface soil (Figure 2A,C). Theoretically, the high dose of biochar application could have raised soil total Fe by 0.38 g kg−1 and total Mn by 16.29 mg kg−1 (Table S1) after 11 years of continuous application, which, however, did not increase soil total Fe and Mn. This indicates that the high dose of biochar may have led to leaching of Fe and Mn, possibly via the chemical reduction of Fe and Mn oxides by phenolic hydroxyl groups and/or the formation of soluble metal–organic complexes with functional groups of dissolved organic C from biochar [36]. Biochar application did not result in a decrease in soil Fe and Mn availability (Figure 3A,C), which were negatively correlated with each other (Figure 5). Zinc is more precipitated, less reducible and readily complexed by most organic ligands, and the intermediate dose of biochar increased soil total Zn in the surface soil (Figure 2D). Soil available Zn increased with biochar dose (Figure 3D), as Zn in biochar generally increases soil Zn availability [37]. Soil available Zn was positively correlated with soil total C and N in the surface soil (Figure 4 and Figure 5), indicating Zn was more stabilized via complexation. However, for soils with high Zn content (e.g., Zn-contaminated soils), biochar application is found to reduce soil Zn mobility [38]. Although with trends of slight increase or decrease, the repeated application of biochar for 11 years had no significant effect on soil Fe, Cu and Mn availability, and soil available Fe, Cu and Zn were positively correlated with soil total C content in the subsurface soil (Figure 5). In the literature, El-Naggar et al. (2018) found rice hull biochar increased dissolved Fe, Mn, Cu and Zn in a mining soil [39]. Using hard wood-derived biochar, Ippolito et al. (2014) also found biochar increased soil Fe and Mn bioavailability [40] but had no effect on Cu and Zn availability, which is confirmed by Cai and Chang (2016) [41]. The results indicate soil micronutrient availability is influenced by biochar dose, but the result depends on the element type and soil depth.
4.2. Rice Yield and Grain Mineral Concentration
Rice is an important dietary source of mineral elements worldwide. The yield of rice was as high as 7.21 t ha−1 with no biochar control. Biochar application induced a slight but insignificant increase on rice grain yield (Table 3), which may have resulted from the increase in the availability of soil N, P, K and Zn in the depth with biochar application. The results are consistent with many previous findings that show that yield increase is associated with nutrient enhancement upon biochar application, in particular, in nutrient-poor soils [42,43,44]. In this present study, the increase in rice yield was not significant, which may partially derive from the fact that the biochar was applied before the planting of wheat, and thus, less fertilizer effect of biochar was left for the late rice season. Indeed, biochar increased the yield of wheat by 11.9–28.4% when compared to control (data not shown). Rice contains a low level of micronutrients with poor bioavailability in its grain when compared to other crops [45,46]. The inherently low micronutrient status of rice was not improved by biochar application. On the contrary, biochar application significantly decreased the Cu concentration of rice grain (Table 3), especially when intermediate and high doses of biochar were applied. Moreover, the availability of K, Fe and Mn in rice grain tended to decrease with biochar dose (Table 3). The biochar effect may largely be regulated by the feedstock type, the application dose of biochar and the nutrient requirements of different crops. For example, woody biochar decreases the concentration of micronutrients (Fe, Mn, Cu, Zn) in wheat grains [47]. By contrast, woody biochar favored the uptake of Fe and Zn in legumes and vegetables [27]. Moreover, wheat straw biochar was found to decrease shoot Mn but not Fe concentration in maize [48]. Our results suggest that micronutrient fertilizer is recommended to supplement potential micronutrients (e.g., Cu) for better rice nutritional quality in soils receiving high doses of biochar.
4.3. Long-Term Biochar Effect on Soil Carbon Accumulation
Soil total C increased positively with biochar dose, and it depended on soil depth (Table 2), which confirmed our third hypothesis. In theory, the cumulative introductions of C into the surface soil by biochar application were estimated at 6.54 g kg−1, 16.34 g kg−1 and 32.68 g kg−1, respectively, for the treatment of low, intermediate and high doses of biochar application (Table S1), which were comparable to the measured contents of soil total C in biochar-applied treatments when taking off soil total C in control (Table 2). The results suggest that after application, only a minimal part of biochar undergoes decomposition by soil microorganisms, and the remaining biochar contributes directly to the increase in soil total C. Moreover, the fertilizer effect of biochar might have increased the belowground C inputs through more plant residues, root biomass and rhizodeposits [44,49], leading to increases in plant-derived C in the soil. Furthermore, biochar increases SOC recalcitrance, has a protective effect on soil C sources and can reduce SOC and fresh C (original residues) mineralization [50,51]. In the subsurface soil, biochar doses tended to increase soil total C, but the differences were not statistically significant (Table 2). The reasons could be that (1) both fertilizers and biochar were applied in the plow layer (0–15 cm); (2) the roots of the crops were mainly distributed in the surface soil; (3) the SOC in the subsurface soil may endure greater microbial decomposition once the substrate is available for microbial activity when compared to the surface soil [52]. Moreover, the biochar effect may be significant and reflected in the more sensitive C pool other than total C. More studies are needed to discern the soil C dynamics in the subsoils upon long-term biochar application. The results indicate that biochar is effective in building up stable SOC and has great potential in mitigating climate change.
5. Conclusions
Biochar had great soil C sequestration capacity, but the effect was most notable for the plow layer (0–15 cm), where the biochar was applied. The biochar effect on the nutrient status of soil and rice depended on the element type and biochar dose. Eleven years of continuous application of corn stalk biochar increased the availability of soil N, P, K and Zn, which may have contributed to the slight but insignificant increase in rice yield. High dose of biochar decreased soil total Fe and Mn but not their availability in the surface soil, resulting in a slight and insignificant decrease in grain Fe and Mn concentration. Biochar did not improve the inherently low micronutrient status of rice. By contrast, it significantly decreased the Cu concentration of rice grain. Micronutrient fertilizer is thus recommended to supplement potential micronutrients (e.g., Cu) for better rice nutritional quality in soils receiving high doses of biochar.
Supplementary Materials
The following supporting information can be downloaded at: https://www.mdpi.com/article/10.3390/agronomy12081924/s1, Table S1: Estimation of potential increases in surface (0–15 cm) soil C, N, P, K, Fe (g·kg−1 soil) and Cu, Mn, Zn (mg·kg−1 soil) by continuous application of biochar at 2.4 (B1), 6 (B2) and 12 (B3) t ha−1 yr−1 for 11 years.
Author Contributions
Conceptualization, Q.X., Z.X. and X.W.; Data curation, J.W., P.J. and W.Y.; Formal analysis, Q.X., J.W., Z.C. and P.J.; Funding acquisition, Q.X., Z.X. and X.W.; Investigation, J.W., J.D. and J.F.; Methodology, J.W., J.D. and J.F.; Project administration, Q.X. and X.W.; Resources, Q.L. and Z.C.; Software, J.W. and Q.L.; Validation, W.Y.; Visualization, J.W., Z.X. and X.W.; Writing—original draft, Q.X.; Writing—review and editing, Q.X., Z.X. and X.W. All authors have read and agreed to the published version of the manuscript.
Funding
This research was supported by National Natural Science Foundation of China (grant number 42007075, 41977085, 31772394, 41171191), China Scholarship Council, the National Key Research and Development Program of China (2021YFD1700800), the 333 Project in Jiangsu Province (BRA2020300), the Six-talent Peaks Project in Jiangsu Province (TD-JNHB-012), the Special Project on Agricultural Science and Technology (201503137) and the Jiangsu Agriculture Science and Technology Innovation Fund (JASTIF) (CX(20)2003).
Institutional Review Board Statement
Not applicable.
Informed Consent Statement
Not applicable.
Data Availability Statement
Data are contained within the article or Supplementary Materials.
Conflicts of Interest
The authors declare no conflict of interest.
Abbreviations
C, carbon; N, nitrogen; P, phosphorus; K, potassium; Fe, iron; Mn, manganese; Cu, copper; Zn, Zinc; SOC, soil organic carbon; TN, total nitrogen.
References
- Ding, Y.; Liu, Y.G.; Liu, S.B.; Li, Z.W.; Tan, X.F.; Huang, X.X.; Zeng, G.M.; Zhou, L.; Zheng, B.H. Biochar to improve soil fertility. A review. Agron. Sustain. Dev. 2016, 36, 36. [Google Scholar] [CrossRef]
- Kavitha, B.; Reddy, P.V.L.; Kim, B.; Lee, S.S.; Pandey, S.K.; Kim, K.H. Benefits and limitations of biochar amendment in agricultural soils: A review. J. Environ. Manag. 2018, 227, 146–154. [Google Scholar] [CrossRef] [PubMed]
- Joseph, S.; Cowie, A.L.; Van Zwieten, L.; Bolan, N.; Budai, A.; Buss, W.; Cayuela, M.L.; Graber, E.R.; Ippolito, J.A.; Kuzyakov, Y.; et al. How biochar works, and when it doesn’t: A review of mechanisms controlling soil and plant responses to biochar. GCB Bioenergy 2021, 13, 1731–1764. [Google Scholar] [CrossRef]
- Tisserant, A.; Cherubini, F. Potentials, limitations, co-benefits, and trade-offs of biochar applications to soils for climate change mitigation. Land 2019, 8, 179. [Google Scholar] [CrossRef]
- Buss, W.; Wurzer, C.; Manning, D.A.C.; Rohling, E.J.; Borevitz, J.; Mašek, O. Mineral-enriched biochar delivers enhanced nutrient recovery and carbon dioxide removal. Commun. Earth Environ. 2022, 3, 67. [Google Scholar] [CrossRef]
- Safian, M.; Motaghian, H.; Hosseinpur, A. Effects of sugarcane residue biochar and P fertilizer on P availability and its fractions in a Calcareous clay loam soil. Biochar 2020, 2, 357–367. [Google Scholar] [CrossRef]
- Alling, V.; Hale, S.E.; Martinsen, V.; Mulder, J.; Smebye, A.; Breedveld, G.D.; Cornelissen, G. The role of biochar in retaining nutrients in amended tropical soils. J. Plant. Nutr. Soil Sci. 2014, 177, 671–680. [Google Scholar] [CrossRef]
- Jin, L.; Wei, D.; Yin, D.W.; Zhou, B.K.; Ding, J.L.; Wang, W.; Zhang, J.M.; Qiu, S.J.; Zhang, C.J.; Li, Y.; et al. Investigations of the effect of the amount of biochar on soil porosity and aggregation and crop yields on fertilized black soil in northern China. PLoS ONE 2020, 15, e0238883. [Google Scholar] [CrossRef] [PubMed]
- Guedes, R.S.; Pinto, D.A.; Ramos, S.J.; Dias, Y.N.; Junior, C.F.C.; Gastauer, M.; Filho, P.W.M.E.S.; Fernandes, A.R. Biochar and conventional compost reduce hysteresis and increase phosphorus desorbability in iron mining waste. Rev. Bras. Cienc. Solo 2021, 45, e0200174. [Google Scholar] [CrossRef]
- Yan, T.T.; Xue, J.H.; Zhou, Z.D.; Wu, Y.B. Biochar-based fertilizer amendments improve the soil microbial community structure in a karst mountainous area. Sci. Total Environ. 2021, 794, 148757. [Google Scholar] [CrossRef]
- He, C.H.; Dong, W.X.; Hu, C.S.; Li, J.Z. Biochar’s effect on soil N2O consumption and the microbial mechanism. Chin. J. Eco-Agric. 2019, 27, 1301–1308. [Google Scholar]
- Xu, Q.; Xu, Q.Y.; Zhu, H.; Li, H.; Yin, W.Q.; Feng, K.; Wang, S.S.; Wang, X.Z. Does biochar application in heavy metal-contaminated soils affect soil micronutrient dynamics? Chemosphere 2022, 290, 133349. [Google Scholar] [CrossRef] [PubMed]
- Borchard, N.; Schirrmann, M.; Cayuela, M.; Kammann, C.; Wrage-Monnig, N.; Estavillo, J.; Fuertes-Mendizabal, T.; Sigua, G.; Spokas, K.; Ippolito, J.; et al. Biochar, soil and land-use interactions that reduce nitrate leaching and N2O Emissions: A meta-analysis. Sci. Total Environ. 2019, 651, 2354–2364. [Google Scholar] [CrossRef] [PubMed]
- Wu, P.; Ata-Ul-Karim, S.T.; Singh, B.P.; Wang, H.L.; Wu, T.L.; Liu, C.; Fang, G.D.; Zhou, D.M.; Wang, Y.J.; Chen, W.F. A scientometric review of biochar research in the past 20 years (1998–2018). Biochar 2019, 1, 23–43. [Google Scholar] [CrossRef]
- Crombie, K.; Mašek, O.; Cross, A.; Sohi, S. Biochar-synergies and trade-offs between soil enhancing properties and C sequestration potential. GCB Bioenergy 2015, 7, 1161–1175. [Google Scholar] [CrossRef]
- Papageorgiou, A.; Azzi, E.S.; Enell, A.; Sundberg, C. Biochar produced from wood waste for soil remediation in Sweden: Carbon sequestration and other environmental impacts. Sci. Total Environ. 2021, 776, 145953. [Google Scholar] [CrossRef]
- Shin, J.D.; Park, D.G.; Hong, S.G.; Jeong, C.; Kim, H.; Chung, W. Influence of activated biochar pellet fertilizer application on greenhouse gas emissions and carbon sequestration in rice (Oryza sativa L.) production. Environ. Pollut. 2021, 285, 117457. [Google Scholar] [CrossRef]
- Wang, J.Y.; Xiong, Z.Q.; Kuzyakov, Y. Biochar stability in soil: Meta-analysis of decomposition and priming effects. GCB Bioenergy 2016, 8, 512–523. [Google Scholar] [CrossRef]
- Beesley, L.; Moreno-Jiménez, E.; Gomez-Eyles, J.L. Effects of biochar and greenwaste compost amendments on mobility, bioavailability and toxicity of inorganic and organic contaminants in a multi-element polluted soil. Environ. Pollut. 2010, 158, 2282–2287. [Google Scholar] [CrossRef]
- Khan, S.; Chao, C.; Waqas, M.; Arp, H.P.H.; Zhu, Y.G. Sewage sludge biochar influence upon rice (Oryza sativa L.) yield, metal bioaccumulation and greenhouse gas emissions from acidic paddy soil. Environ. Sci. Technol. 2013, 47, 8624–8632. [Google Scholar] [CrossRef]
- Li, H.B.; Dong, X.L.; da Silva, E.B.; de Oliveira, L.M.; Chen, Y.S.; Ma, L.Q. Mechanisms of metal sorption by biochars: Biochar characteristics and modifications. Chemosphere 2017, 178, 466–478. [Google Scholar] [CrossRef] [PubMed]
- Bandara, T.; Herath, I.; Kumarathilaka, P.; Hseu, Z.Y.; Ok, Y.S.; Vithanage, M. Efficacy of woody biomass and biochar for alleviating heavy metal bioavailability in serpentine soil. Environ. Geochem. Health. 2017, 39, 391–401. [Google Scholar] [CrossRef] [PubMed]
- Bogusz, A.; Oleszczuk, P.; Dobrowolski, R. Adsorption and desorption of heavy metals by the sewage sludge and biochar-amended soil. Environ. Geochem. Health. 2019, 41, 1663–1674. [Google Scholar] [CrossRef] [PubMed]
- Namgay, T.; Singh, B.; Singh, B.P. Influence of biochar application to soil on the availability of As, Cd, Cu, Pb, and Zn to maize (Zea mays L.). Soil Res. 2010, 48, 638–647. [Google Scholar] [CrossRef]
- Doane, T.A.; Horwáth, W.R. Spectrophotometric determination of nitrate with a single reagent. Anal. Lett. 2003, 36, 2713–2722. [Google Scholar] [CrossRef]
- Hossain, M.Z.; Bahar, M.M.; Sarkar, B.; Donne, S.W.; Ok, Y.S.; Palansooriya, K.N.; Kirkham, M.B.; Chowdhury, S.; Bolan, N. Biochar and its importance on nutrient dynamics in soil and plant. Biochar 2020, 2, 379–420. [Google Scholar] [CrossRef]
- Gao, S.; Hoffman-Krull, K.; Bidwell, A.L.; DeLuca, T.H. Locally produced wood biochar increases nutrient retention and availability in agricultural soils of the San Juan Islands, USA. Agric. Ecosyst. Environ. 2016, 233, 43–54. [Google Scholar] [CrossRef]
- Sorrenti, G.; Ventura, M.; Toselli, M. Effect of biochar on nutrient retention and nectarine tree performance: A three-year field trial. J. Plant. Nutr. Soil Sci. 2016, 179, 336–346. [Google Scholar] [CrossRef]
- Hernandez-Soriano, M.C.; Kerré, B.; Goos, P.; Hardy, B.; Dufey, J.; Smolders, E. Long-term effect of biochar on the stabilization of recent carbon: Soils with historical inputs of charcoal. GCB Bioenergy 2016, 8, 371–381. [Google Scholar] [CrossRef]
- Weng, Z.; Zwieten, L.V.; Singh, B.-P.; Tavakkoli, E.; Kimber, S.W.L.; Morris, S.; Macdonald, L.M.; Cowie, A. The accumulation of rhizodeposits in organo-mineral fractions promoted biochar-induced negative priming of native soil organic carbon in Ferralsol. Soil Biol. Biochem. 2018, 118, 91–96. [Google Scholar] [CrossRef]
- Werner, S.; Kätzl, K.; Wichern, M.; Buerkert, A.; Steiner, C.; Marschner, B. Agronomic benefits of biochar as a soil amendment after its use as waste water filtration medium. Environ. Pollut. 2018, 233, 561–568. [Google Scholar] [CrossRef] [PubMed]
- Abujabhah, I.S.; Doyle, R.; Bound, S.A.; Bowman, J.P. The effect of biochar loading rates on soil fertility, soil biomass, potential nitrification, and soil community metabolic profiles in three different soils. J. Soils Sediments 2016, 16, 2211–2222. [Google Scholar] [CrossRef]
- Efthymiou, A.; Grønlund, M.; Müller-Stöver, D.S.; Jakobsen, I. Augmentation of the phosphorus fertilizer value of biochar by inoculation of wheat with selected Penicillium strains. Soil Biol. Biochem. 2018, 116, 139–147. [Google Scholar] [CrossRef]
- Zhang, M.; Liu, Y.; Wei, Q.; Gou, J. Effects of short-term application of Moutai lees biochar on nutrients and fungal community structure in yellow soil of Guizhou. Environ. Sci. Pollut. Res. 2021, 28, 67404–67413. [Google Scholar] [CrossRef]
- Lehmann, J.; da Silva, J.P.; Steiner, C.; Nehls, T.; Zech, W.; Glaser, B. Nutrient availability and leaching in an archaeological Anthrosol and a Ferralsol of the Central Amazon basin: Fertilizer, manure and charcoal amendments. Plant. Soil 2003, 249, 343–357. [Google Scholar] [CrossRef]
- Graber, E.R.; Tsechansky, L.; Lew, B.; Cohen, E. Reducing capacity of water extracts of biochars and their solubilization of soil Mn and Fe. Eur. J. Soil Sci. 2014, 65, 162–172. [Google Scholar] [CrossRef]
- Olmo, M.; Alburquerque, J.A.; Barrón, V.; del Campillo, M.C.; Gallardo, A.; Fuentes, M.; Villar, R. Wheat growth and yield responses to biochar addition under Mediterranean climate conditions. Biol. Fertil. Soils 2014, 50, 1177–1187. [Google Scholar] [CrossRef]
- Houben, D.; Evrard, L.; Sonnet, P. Mobility, bioavailability and pH-dependent leaching of cadmium, zinc and lead in a contaminated soil amended with biochar. Chemosphere 2013, 92, 1450–1457. [Google Scholar] [CrossRef]
- El-Naggar, A.; Shaheen, S.M.; Ok, Y.S.; Rinklebe, J. Biochar affects the dissolved and colloidal concentrations of Cd, Cu, Ni, and Zn and their phytoavailability and potential mobility in a mining soil under dynamic redox-conditions. Sci. Total Environ. 2018, 624, 1059–1071. [Google Scholar] [CrossRef]
- Ippolito, J.A.; Stromberger, M.E.; Lentz, R.D.; Dungan, R.S. Hardwood biochar influences calcareous soil physicochemical and microbiological status. J. Environ. Qual. 2014, 43, 681–689. [Google Scholar] [CrossRef]
- Cai, Y.; Chang, S.X. Biochar effects on soil fertility and nutrient cycling. In Biochar: Production, Characterization and Applications, 1st ed.; Ok, Y.S., Uchimiya, S.M., Chang, S.X., Bolan, N., Eds.; CRC Press: Boca Raton, FL, USA, 2016; pp. 246–271. [Google Scholar]
- Schmidt, H.P.; Pandit, B.H.; Cornelissen, G.; Kammann, C.I. Biochar-Based Fertilization with Liquid Nutrient Enrichment: 21 Field Trials Covering 13 Crop Species in Nepal. Land Degrad. Dev. 2017, 28, 2324–2342. [Google Scholar] [CrossRef]
- Agegnehu, G.; Bass, A.M.; Nelson, P.N.; Bird, M.I. Benefits of biochar, compost and biochar-compost for soil quality, maize yield and greenhouse gas emissions in a tropical agricultural soil. Sci. Total Environ. 2016, 543, 295–306. [Google Scholar] [CrossRef] [PubMed]
- Agegnehu, G.; Srivastava, A.K.; Bird, M.I. The role of biochar and biochar-compost in improving soil quality and crop performance: A review. Appl. Soil Ecol. 2017, 119, 156–170. [Google Scholar] [CrossRef]
- Huang, S.; Wang, P.T.; Yamaji, N.; Ma, J.F. Plant Nutrition for Human Nutrition: Hints from Rice Research and Future Perspectives. Mol. Plant 2020, 13, 825–835. [Google Scholar] [CrossRef] [PubMed]
- Nakandalage, N.; Seneweera, S. Micronutrients Use Efficiency of Crop-Plants Under Changing Climate. In Plant Micronutrient Use Efficiency: Molecular and Genomic Perspectives in Crop Plants; Hossain, M.A., Kamiya, T., Burritt, D.J., Phan Tran, L.-S., Fujiwara, T., Eds.; Academic Press: Cambridge, MA, USA, 2018; pp. 209–224. [Google Scholar]
- Hartley, W.; Riby, P.; Waterson, J. Effects of three different biochars on aggregate stability, organic carbon mobility and micronutrient bioavailability. J. Environ. Manag. 2016, 181, 770–778. [Google Scholar] [CrossRef] [PubMed]
- Bornø, M.L.; Müller-Stöver, D.S.; Liu, F. Biochar properties and soil type drive the uptake of macro- and micronutrients in maize (Zea mays L.). J. Plant Nutr. Soil Sci. 2019, 182, 149–158. [Google Scholar] [CrossRef]
- Weng, Z.; Van Zwieten, L.; Singh, B.P.; Tavakkoli, E.; Joseph, S.; Macdonald, L.M.; Rose, T.J.; Rose, M.T.; Kimber, S.W.L.; Morris, S.; et al. Biochar built soil carbon over a decade by stabilizing rhizodeposits. Nat. Clim. Chang. 2017, 7, 371–376. [Google Scholar] [CrossRef]
- Weng, Z.; Van Zwieten, L.; Singh, B.P.; Kimber, S.; Morris, S.; Cowie, A.; Macdonald, L.M. Plant-biochar interactions drive the negative priming of soil organic carbon in an annual ryegrass field system. Soil Biol. Biochem. 2015, 90, 111–121. [Google Scholar] [CrossRef]
- Fang, Y.Y.; Singh, B.P.; Singh, B. Temperature sensitivity of biochar and native carbon mineralisation in biochar-amended soils. Agric. Ecosyst. Environ. 2014, 191, 158–167. [Google Scholar] [CrossRef]
- Heitkötter, J.; Marschner, B. Is there anybody out there? Substrate availability controls microbial activity outside of hotspots in subsoils. Soil Syst. 2018, 2, 35. [Google Scholar] [CrossRef]


Publisher’s Note: MDPI stays neutral with regard to jurisdictional claims in published maps and institutional affiliations. |
© 2022 by the authors. Licensee MDPI, Basel, Switzerland. This article is an open access article distributed under the terms and conditions of the Creative Commons Attribution (CC BY) license (https://creativecommons.org/licenses/by/4.0/).