Article

Long-Term Conservation Tillage Practices Directly and Indirectly Affect Soil Micro-Food Web in a Chinese Mollisol

Institute of Agricultural Resource and Environment, Jilin Academy of Agricultural Sciences, Key Laboratory of Crop Ecophysiology and Farming System in Northeast China, Ministry of Agriculture and Rural Affairs, Changchun 130033, China
*
Authors to whom correspondence should be addressed.
Agronomy 2022, 12(10), 2356; https://doi.org/10.3390/agronomy12102356
Submission received: 30 August 2022 / Revised: 25 September 2022 / Accepted: 27 September 2022 / Published: 29 September 2022

Abstract

:
Soil micro-food webs play an essential role in maintaining or improving the stability of agricultural soils, and they can be influenced by tillage. However, little is known with respect to soil microbial and faunal communities and their relationships shaped by long-term tillage practices. The goal of this study was to investigate the impact of 38 years of no-tillage (NT), subsoil tillage (ST), moldboard plow tillage (MP), and rotary and ridge tillage (CT) practices on soil microbial and faunal communities, and their relationships with soil properties using high-throughput sequencing technology and structural equation modeling (SEM) at 2 soil depths (0–20 cm and 20–40 cm). The results indicate that, after the 38-year (1983–2020) period, the bacterial, fungal, protozoan, and metazoan gene copy numbers under the NT treatment at 0–20 cm were 1.31–6.13 times higher than those under the other treatments. Conversely, the microbial and protozoan alpha diversities were reduced under the NT treatment compared with the CT treatment. However, MP significantly increased microbial and faunal gene copy numbers at 20–40 cm. Moreover, the bacterial community composition remarkably varied relative to the community composition of the fungi and fauna in response to the tillage practices and soil depths. Additionally, the highest and lowest average connectivities of the soil micro-food web networks were observed under the ST and MP treatments, respectively. The SEM demonstrated that tillage practices and soil depths explained 73–98% of the microbial and faunal abundances, diversities, and compositions. Additionally, tillage and depth demonstrated direct quantitative effects and indirect quantitative effects by altering the soil mean weight diameter of aggregates, soil organic carbon, and total nitrogen. Overall, subsoil tillage is recommended as the optimal practice for application in northeast China, and it could improve soil properties and aid in forming a more complex soil micro-food web structure.

1. Introduction

Tillage practices play a crucial role in agricultural management, and they strongly affect soil physicochemical properties and biological characteristics [1]. Increasing evidence suggests that conventional tillage (CT) practices (soil tillage intensity rating values > 80) hugely disturb the surface soil layer, aggravate soil erosion, and decrease soil nutrient capacity [2,3]. Conversely, conservation tillage practices, such as no-tillage and reduced tillage, are generally viewed as beneficial to sustainable agricultural development, as they reduce soil disturbance, promote the accumulation of soil organic matter, reduce the potential for compaction, and improve soil moisture holding capacity and infiltration [3,4,5]. Soil micro-food webs play a central role in nutrient cycling and the maintenance of soil structure, and they contribute to both crop growth and the sustainability of soil productivity [6]. Therefore, gaining insight into the influence of tillage practices on soil micro-food webs is profitable to preserve biological diversity and amplify the functions of soil biota in agroecosystems [7,8].
As important facilitators and regulators in ecological processes, soil micro-food webs are also sensitive to tillage practices [9]. Microorganisms (bacteria and fungi) and microbivores (protozoa and metazoa) are vital components of soil micro-food webs [6]. Many studies have paid a great deal of attention to the effects of tillage practices on soil nematode and microbial community compositions. Zhong et al. [10] discovered that the number of protozoa, bacterivores, and omnivore–carnivores, and the abundance of bacteria and arbuscular mycorrhizal fungi at a soil layer depth of 0–40 cm after a 12-year field experiment, were increased by reduced tillage (RT) and no-tillage (NT) compared to CT. Moreover, the species richness and the connectance of the soil food web at soil depths of 0–5 and 5–15 cm were significantly affected by tillage practices, and their values decreased in the order of NT > RT > CT [11]. Similar results have also been reported for the ridge tillage system at a 0–20 cm soil depth, suggesting that conservation tillage can improve the structure and function of soil food webs through bottom–up effects [12]. In addition, it was revealed that soil microorganisms and nematode communities were affected by the stover mulching frequency but not by the amount of stover mulching in a ten-year no-tillage system. The higher abundance of bacterial phospholipid-derived fatty acids (PLFAs) was correlated with bacterivores in high-frequency mulching, and more carbon flowed from the mulch into the soil micro-food web [13]. However, most of these studies were based on traditional techniques, such as the Baermann funnel method, a modified cotton–wool filter method, and phospholipid fatty acids. Studies using high-throughput sequencing to explore soil micro-food webs at a soil depth between 0–20 and 20–40 cm in conservation tillage systems are still limited. Furthermore, previous studies lack a quantitative analysis of the effective mechanisms of tillage practices and soil depths, combined with soil properties, that affect soil micro-food webs.
Northeast China’s cultivated land occupies 14% of the total amount of national plowland, and it has become the essential grain bowl of the country [14]. To improve the soil temperature and to facilitate drainage, rotary and ridge tillage with the straw-removed system is commonly used in this region. However, continually shallow tillage and the absence of straw-returning management have resulted in severe soil degradation and depressed soil biodiversity [1,15]. Conservation tillage practices are a potential alternative to improve soil quality and activity [16,17]. We hypothesized that different long-term conservation tillage practices affect the arable layer soil micro-food web by altering soil physiochemical conditions and further affecting soil microbial and faunal gene abundances, community diversities, and compositions. In the present study, using high-throughput sequencing and structural equation modeling, our objectives were (1) to study the differences between soil microbial and faunal communities at 0–20 and 20–40 cm soil depths under different tillage practices; (2) to determine the relationship between the soil micro-food web; and (3) to reveal how tillage practices and soil depths affect soil properties and, by extension, the gene abundances, diversities, and compositions of the soil microbial and faunal communities.

2. Materials and Methods

The long-term field experiment was established in 1983 in Gongzhuling country, Jilin province, China (43°52′ N, 124°81′ E, with an altitude of 206 m). The long-term field experiment has continued until now. This region has a typical middle-temperate continental monsoon climate, with an average temperature of 4.5 ℃ and an average annual precipitation of 568 mm. The soil has a clay loam texture and is classified as Mollisol according to the USDA soil taxonomy. The initial soil conditions in the 0–20 cm layer in May 1983 before the experiment commenced was as follows: the soil organic carbon (SOC), total nitrogen (TN), total phosphorus (TP), total potassium (TK), alkaline nitrogen (AN), available phosphorus (AP), available potassium (AK), and pH had values of 16.3 g kg–1, 1.5 g kg–1, 0.6 g kg–1, 22.6 g kg–1, 114.4 mg kg–1, 27.5 mg kg–1, 152.3 mg kg–1, and 7.6, respectively. The soil texture consisted of 36.3% clay, 24.5% silt, and 39.2% sand. This has been described in Zheng et al. [18].

2.1. Experimental Design

The long-term field experiment involved four types of tillage practices, namely, (1) rotary and ridge tillage (CT), (2) no-tillage (NT), (3) subsoil tillage (ST), and (4) moldboard plowing tillage (MP), and it was designed as a randomized complete block with three replications. Each plot measured 1950 m2 (150 m × 13 m). The field was rotary-tilled to a depth of 20 cm with a 15 cm high ridge after harvest and shallow tilled to maintain ridges at the maize jointing stage in the CT treatment (Figure S1); subsoiled with a vertical blade to a depth of 35 cm (no soil turning) in the jointing stage of maize in the ST treatment; and plowed to a depth of 35 cm (soil turning) and harrowed two times after harvesting in the MP treatment. The maize straw was removed in the CT and MP treatments, and the straw was removed, except for 40–45 cm high stubble (about 3200 kg ha–1), to conserve the soil in the NT and ST treatments. CT practice was considered as a control treatment. Maize grown throughout the experiment. Maize (the main varieties in this region are Zhengdan 958 and Xiangyu 998) was planted at a density of 60,000 plants ha–1 in early May, and it was harvested at the end of September. There were 20 rows in each plot with a line spacing of 65 cm and a row spacing of 25 cm in the CT, NT, and MP treatments. The ST treatment modified the conventional line distance of 65 cm to include a 90 cm wide subsoiling belt and a 40 cm strip for the crops. The fertilizers were applied twice on sowing (75 kg N ha–1, 90 kg P2O5 ha–1, and 80 kg K2O ha–1) and on 20 June (150 kg N ha–1). Tilling, sowing, and seed fertilizing were mechanical operations. Topdressing, harvesting, and straw handling were manual operations. The field operations and the relevant details of each tillage method are described in Zheng et al. [18].

2.2. Soil Sampling and Soil Physicochemical Property Analysis

Soil samples (from 0–20 cm and 20–40 cm depths) were collected after the maize harvest on 23 October 2020. One composite sample consisted of ten cores of soil randomly obtained from each plot using a 5 cm diameter soil corer. When sampling in the field, an incubator and ice box were used to preserve soil samples. The soil samples were divided into two sub-samples. One soil subsample was air-dried for the determination of soil properties, and the subsamples were passed through a 2 mm sieve and stored at −80 ℃ for molecular analyses. The undisturbed bulk soil was collected to place in plastic boxes for an analysis of aggregates.
The soil bulk density (BD) was determined using the core ring method [19]. Soil water-stable aggregates were isolated, and the mean weight diameter was calculated according to Kemper and Rosenau [20]. SOC and TN were measured using an elemental analyzer EA 3000 (Eurovector, Milano, Italy). Total phosphorus (TP) and total potassium (TK) were assessed by digestion and then spectrophotometer detection and flame photometer detection [21]. AN was measured using the alkaline hydrolysis diffusion method [22]. AP was determined using the NaOH fusion–molybdenum antimony anti-colorimetric method [23]. AK was determined using the flame photometric method [24]. Soil pH was determined using a PHSJ–3F digital pH meter (1:2.5 soil:water ratio). Soil texture was measured using Malvern Mastersizer 3000 particle size analyzer.

2.3. DNA Extraction, PCR Amplification, and Sequencing

Soil microbial and faunal DNA were extracted using the method provided by a PowerSoil DNA Isolation Kit (MOBIO, Carlsbad, CA, USA) from 0.5 g fresh soil. The bacterial 16S rRNA gene was profiled based on the primer pair 338F (5′–ACTCCTACGGGAGGCAGCA–3′) and 519R (5′–ATTACCGCGGCTGCTGG–3′) [25], the fungal ITS region was amplified using the primer pair ITS5F (5′–GGAAGTAAAAGTCGTAACAAGG–3′) and ITS1R (5′–GCTGCGTTCTTCATCGATGC–3′) [26], the protozoan 18S gene was profiled based on the primer pair Fw (5′–ATTAGGGTTCGATTCCGGAGAGG–3′) and Rv (5′–CTGGAATTACCGCGGSTGCTG–3′) [27], and the metazoan 18S gene was amplified using the primer pair NF1 (5′–GGTGGTGCATGGCCGTTCTTAGTT–3′) and 18Sr2b (5′–TACAAAGGGCAGGGACGTAAT–3′) [28]. The PCR process was as follows: 98 °C for 5 min, followed by 25 cycles of 98 °C for 30 s, 52 °C for 30 s, 72 °C for 1 min, and a final extension of 72 °C for 5 min. The PCR products were checked on 2% agarose gel and further purified using a TruSeq Nano DNA LT Library Prep Kit (Illumina, San Diego, CA, USA). Subsequently, the purified amplicons were sequenced according to an equimolar and paired-end method with the Illumina MiSeq platform (Majorbio Bioinformatics Technology, Shanghai, China). The raw sequence data were processed using QIIME2 software [29]. Operational taxonomic units (OTUs) were generated at a 97% sequence identity cut-off using QIIME software (Version 1.17). The microbial and faunal alpha diversities are represented using the Shannon diversity index.

2.4. Quantitative PCR (qPCR)

Quantitative PCR was used to determine the abundances of the bacterial 16S rRNA, fungal ITS1, protozoan 18S, and metazoan 18S genes. The primer sets 338F/519R, ITS5F/ITS1R, Fw/Rv, and NF1/18Sr2b were used to determine the bacterial, fungal, protozoan, and metazoan gene copy numbers using a CFX96 (Bio–Rad Laboratories, Hercules, CA, USA) with a AceQ qPCR SYBR Green Master Mix (Jizhenbio, Shanghai, China). The quantitative real-time PCR parameters were as follows: 95 °C (5 min), followed by 40 cycles of 95 °C (15 s) and 60 °C (30 s). Standard curves were generated by serially diluting plasmids, as described by Wang et al. [30]. At the end of each PCR run, a melting curve analysis was performed to evaluate the amplification specificity [31]. The amplification efficiencies were 100.00%, 91.64%, 95.29%, and 97.63%, and the R values were 0.998, 0.997, 0.997, and 0.998 for the bacterial, fungal, protozoan, and metazoan communities, respectively.

2.5. Statistical Analysis

Analysis of variance (ANOVA) was conducted using SPSS Statistics 23.0 software (International Business Machines Corporation, Armonk, NY, USA) with the Duncan’s multiple range test at p < 0.05. Origin 9.0 software (OriginLab, Northampton, MA, USA) was used to plot graphs. A network analysis (based on phyla level) was performed to identify the interrelations between microbial and faunal taxa using the GENESCLOUD website (https://www.genescloud.cn/chart/AssoNetWorkPlot) (accessed on 15 June 2022). The Spearman rank correlation matrix (r value) was used, and only data with a strong correlation (|r| > 0.7) and statistical significance (p value < 0.05) were selected. The igraph’s induced subgraph function was used to extract the nodes with the top 100 average abundance values (default values) in order to construct the dominant seed network, and then the ggraph package was used for visualization. The “Multi–level Modularity optimization algorithm” of igraph was used to perform modular cutting on the co-occurrence network [32]. The clustering of the different samples and the microbial and faunal community structures were illustrated using the principal coordinate analysis (PCoA) for microbial and faunal beta diversities. Correlations among the soil properties, and the microbial and faunal compositions were determined using a redundancy analysis (RDA) in CANOCO 4.5 (Microcomputer Power, Ithaca, NY, USA). A structural equation model (SEM) was constructed using AMOS 22.0 (International Business Machines Corporation, Armonk, NY, USA). The chi-square statistic, the root-mean-square error of approximation (RMSEA), the comparative fit index (CFI), and the goodness of fit index (GFI) were used to evaluate the model fit.

3. Results

3.1. Soil Physiochemical Properties

In the 0–20 cm soil layer, NT significantly increased soil SOC, TP, AP content, and BD compared to the other treatments (Table 1). Under the ST treatment, the TN and AN contents were higher, and the pH was lower than those under the other treatments. Furthermore, compared with the CT and MP treatments, the NT and ST treatments markedly increased MWD (p < 0.05). In the 20–40 cm soil layer, the highest values of TN, AN, and AP content were discovered under the ST treatment. Under the under MP treatment, the SOC content was significantly higher than those under the other treatments. In addition, the NT treatment remarkably enhanced soil pH, and the CT treatment significantly decreased soil MWD compared to the other treatments. Moreover, the deep tillage (ST and MP) reduced BD than CT and NT treatments.

3.2. Soil Microbial and Faunal Communities

According to the bacterial community structure, the dominant phyla across the four treatments were Actinobacteria, Proteobacteria, Acidobacteria, Chloroflexi, Gemmatimonadetes, Patescibacteria, Verrucomicrobia, Rokubacteria, Bacteroidetes, Nitrospirae, Latescibacteria, and Firmicutes, with contributions of 33.67%, 22.43%, 13.52%, 10.26%, 8.06%, 2.30%, 1.99%, 1.98%, 1.97%, 0.76%, 0.62%, and 0.51%, respectively (Figure 1A). The ANOVA results indicated that the NT treatment significantly increased the relative abundances of Patescibacteria and Rokubacteria in the topsoil layer (0–20 cm) and Rokubacteria, Nitrospirase, and Latescibacteria in the subsoil layer (20–40 cm). The highest relative abundance of Proteobacteria was observed under the ST treatment in the topsoil layer. Acidobacteria and Verrucomicrobia in the topsoil layer and Proteobacteria, Gemmatimonadetes, Patescibacteria, and Bacteroidetes in the subsoil layer were remarkably higher under the MP treatment than under the other treatments. Among all sequences, the dominant fungal phyla were Basidiomycota, Ascomycota, and Mortierellomycota, with average contributions of 59.47%, 18.10%, and 4.97%, respectively (Figure 1B). Among them, a relatively greater abundance of Basidiomycota both in the topsoil and subsoil layers was observed under the NT treatment. The highest relative abundances of Ascomycota and Mortierellomycota were observed under the MP treatment in the topsoil layer. Apicomplexa, Blastocysta, Amoebozoa, Ichthyosporea, and Choanozoa were the five most dominant protozoa phyla, with average contributions of 38.54%, 4.07%, 4.37%, 0.93%, and 0.72%, respectively (Figure 1C). Apicomplexa was higher, and Blastocysta, Amoebozoa, Ichthyosporea, and Choanozoa were lower under the NT treatment than under the other treatments in both the topsoil and subsoil layers. The highest relative abundances of Blastocysta and Choanozoa were observed under the MP treatment in the topsoil layer. The metazoan phyla Nematoda, Arthropoda, Chordata, and Platyhelminthes were dominant, with averages accounting for 87.62%, 7.93%, 0.58%, and 0.41% (Figure 1D). The highest relative abundance of Arthropoda was observed under the NT treatment in the topsoil layer. Furthermore, compared with the CT treatment, the NT, ST, and MP treatments markedly increased the relative abundance of Nematoda and decreased the relative abundances of Arthropoda, Chordata, and Platyhelminthes in the subsoil layer.
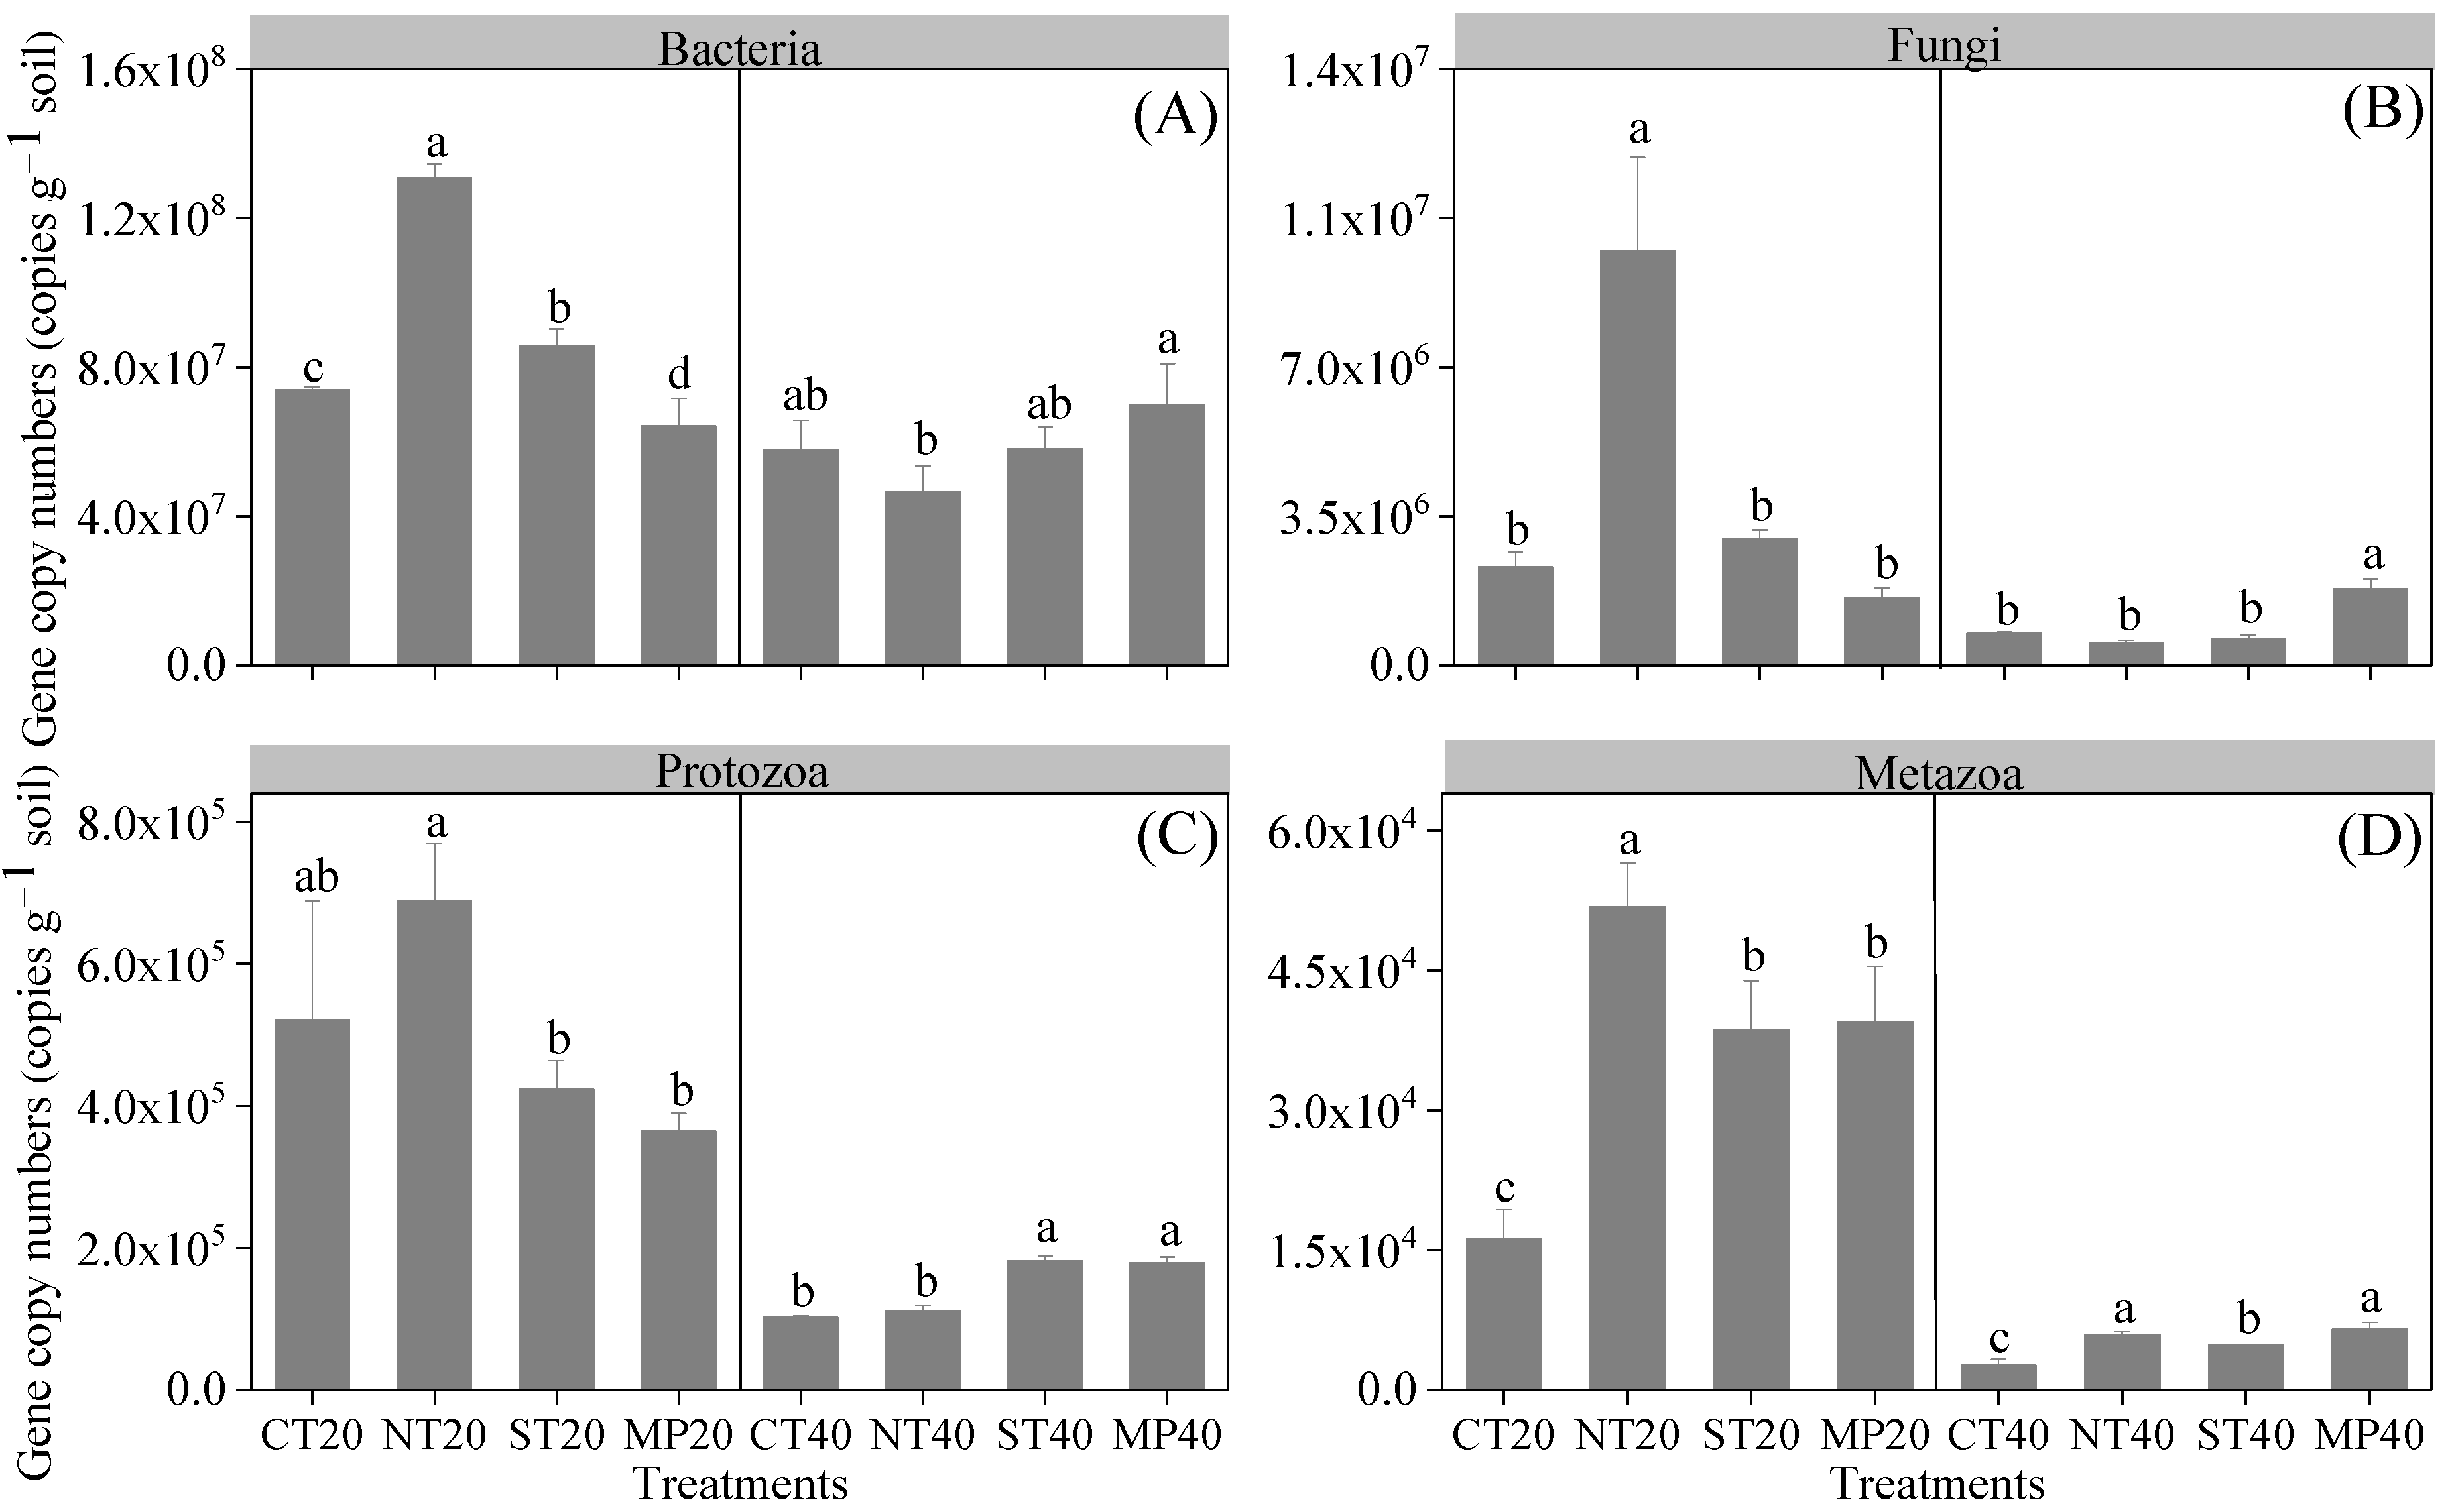
The tillage practices had significant effects on the microbial and faunal gene abundance of the soil (Figure 2). In the 0–20 cm soil layer, the bacterial, fungal, protozoan, and metazoan gene copy numbers under the NT treatment were 1.31–3.19, 1.32–1.89, 1.52–2.04, and 3.27–6.13 times higher than those in the other treatments, respectively (Figure 2A–D). In the 20–40 cm soil layer, the highest values of the bacterial, fungal, and metazoan gene copy numbers were observed under the MP treatment (Figure 2A–D), and the protozoan gene copy numbers were markedly increased under the ST and MP treatments compared to the other treatments (Figure 2C). Furthermore, except for the gene abundances of the bacteria and fungi under the MP treatment, which did not significantly change between the two soil layers (Figure 2A,B), the microbial and faunal gene abundances decreased with the increase in soil depth.
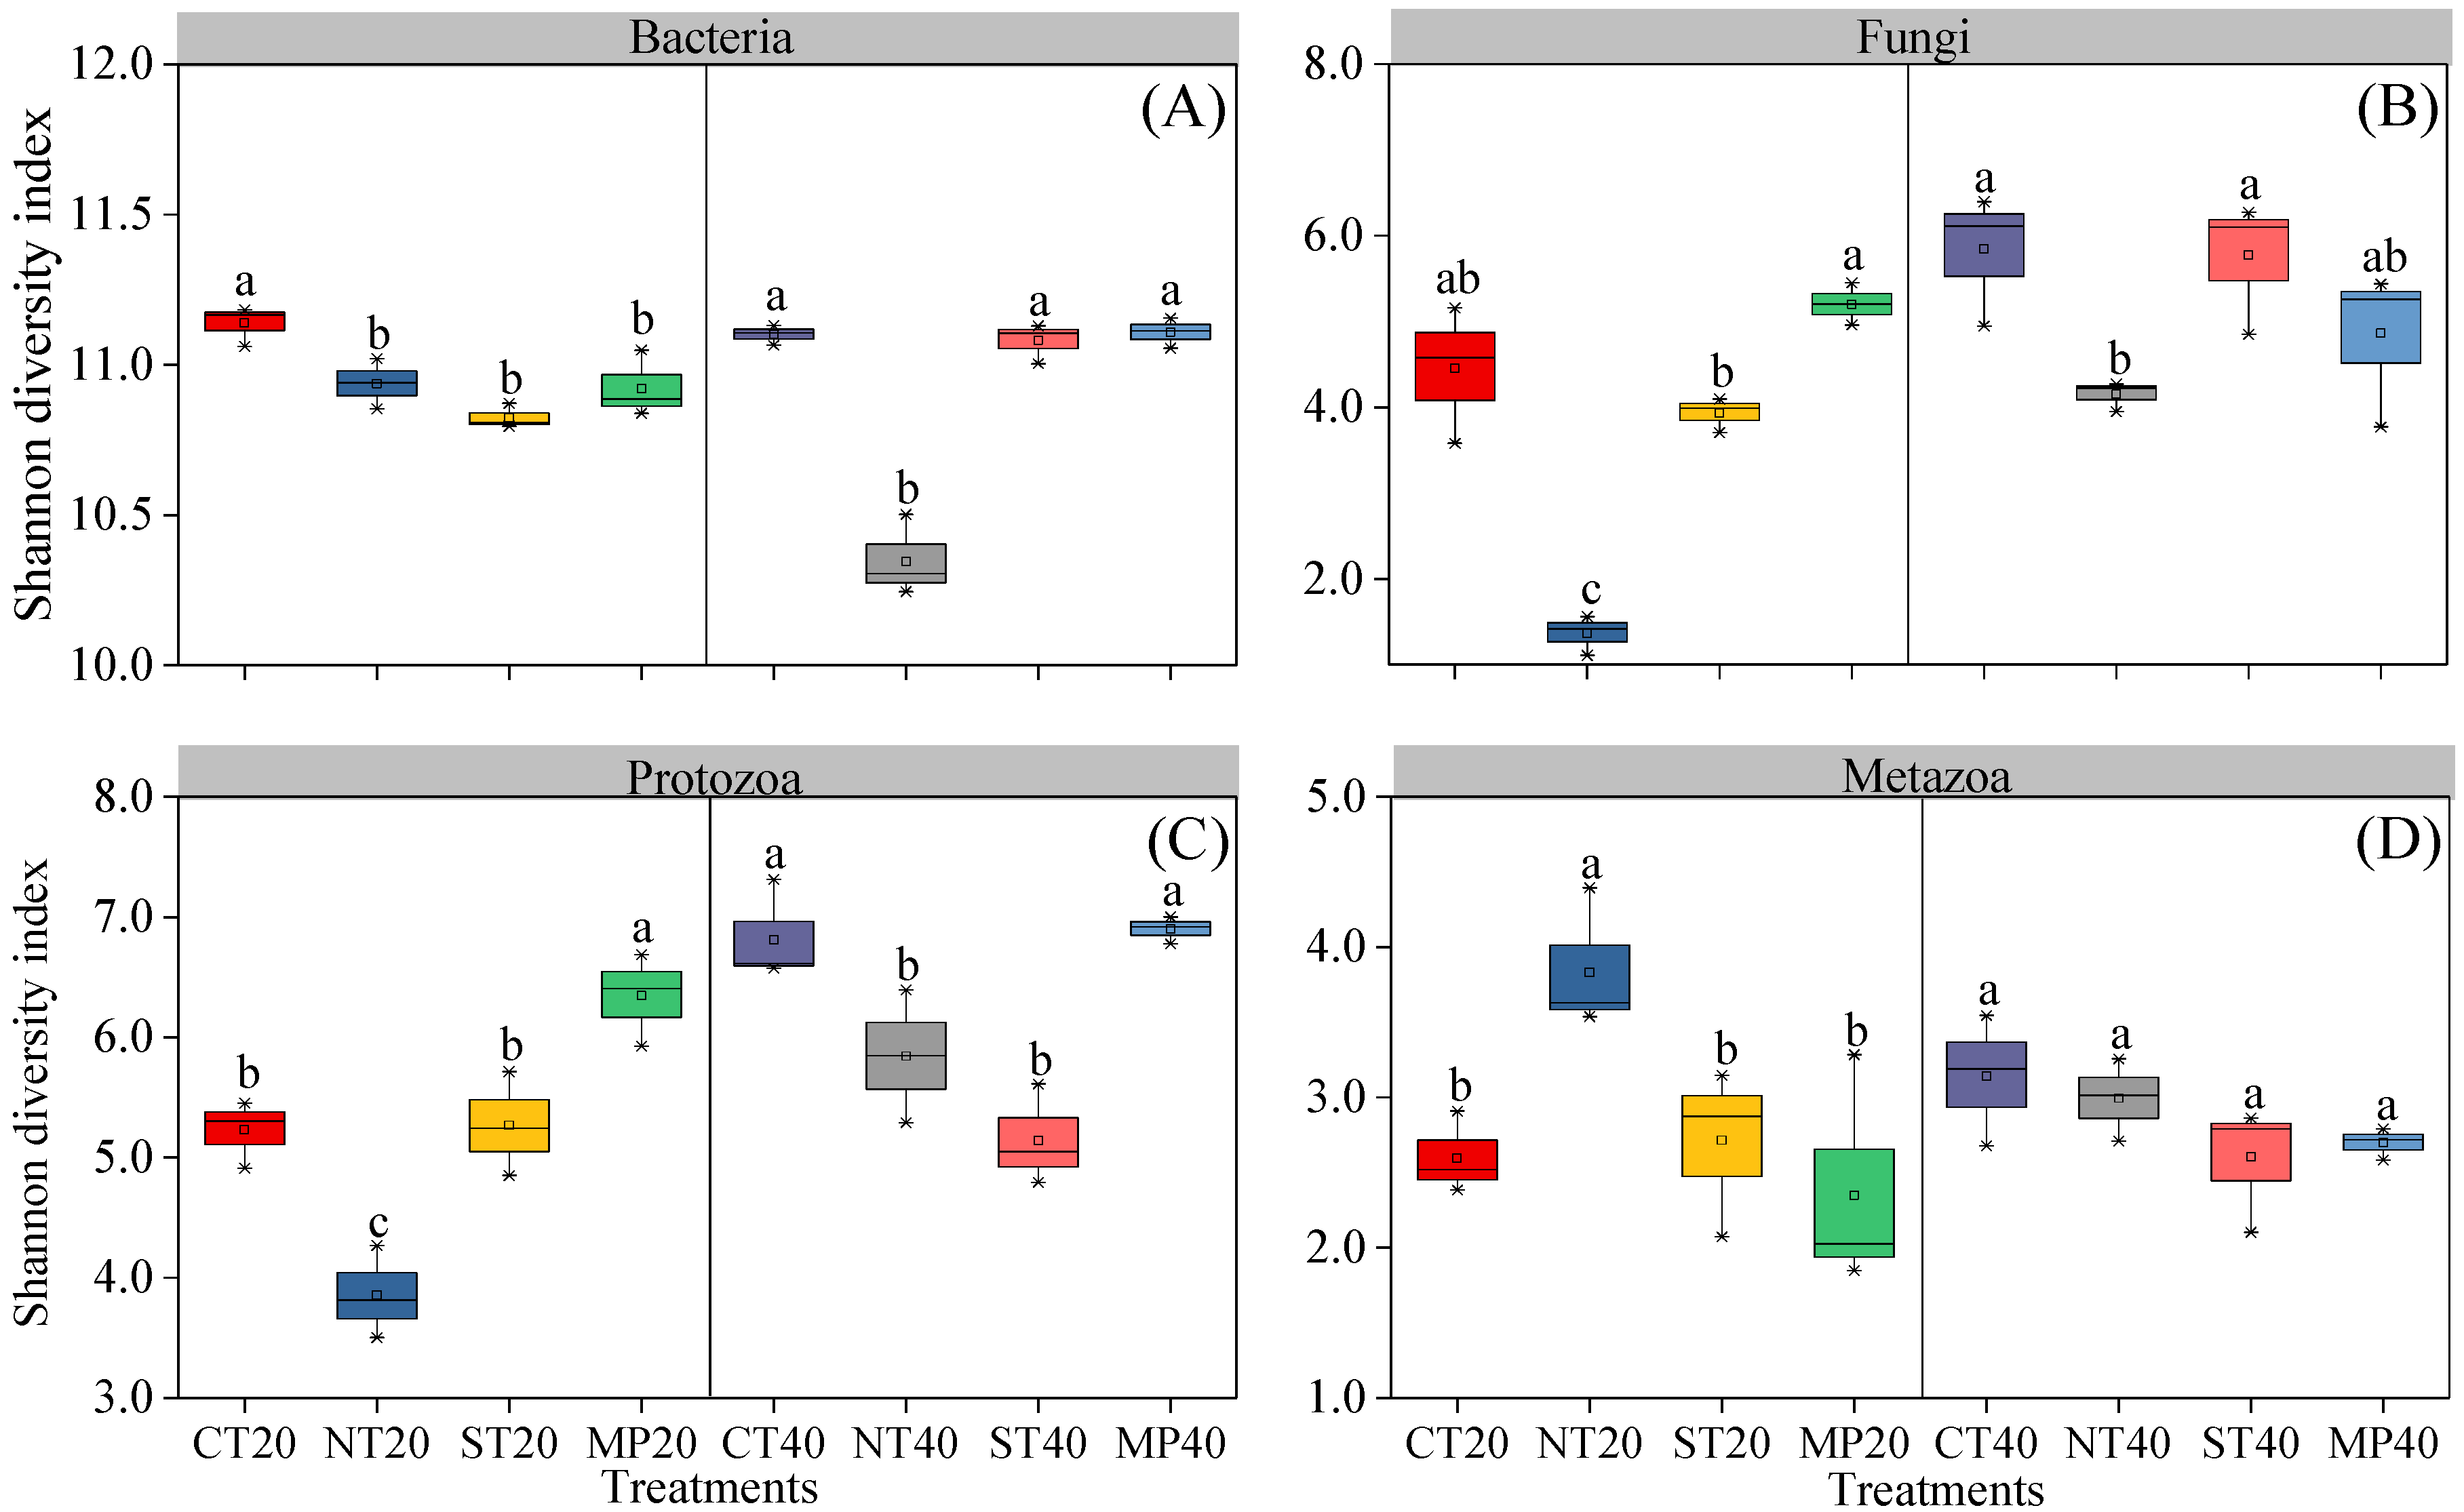
The Shannon diversity index and the principal coordinate analysis (PCoA) reflect the microbial and faunal community alpha and beta diversities, respectively. For bacteria, compared with the CT treatment, the ST and MP treatments significantly decreased the bacterial Shannon diversity index in the 0–20 cm soil layer. However, this reduction was also observed in the 0–20 cm and 20–40 cm soil layers under the NT treatment (Figure 3A). The soil bacterial communities in the different tillage practices and soil depths were separated from each other (Figure 4A). For fungi, the fungal Shannon index diversity under the NT treatment was 3.27 and 1.42 times lower than that under the CT treatment in the 0–20 cm and 20–40 cm soil layers, respectively (Figure 3B). The soil fungal communities in the CT, NT, and ST treatments and the two soil depths were separated from each other and with the MP treatment (Figure 4B). For protozoa, the highest value of the protozoan Shannon diversity index was observed under the MP treatment in the 20–40 cm soil layer, the NT and ST treatments significantly decreased the protozoan Shannon index diversity compared to the MP treatment in both soil layers; a reduction was also observed in the 0–20 cm soil layer under the CT treatment (Figure 3C). Except for the CT and MP treatments in the 0–20 cm soil layer, the protozoan communities in the other practices at the two soil depths were separated from each other (Figure 4C). For metazoa, compared with the CT treatment, only the NT treatment significantly improved the metazoan Shannon index diversity in the 0–20 cm soil layer (Figure 3D). Except for the CT, ST, and MP treatments in the 20–40 cm soil layer, the protozoan communities in the other practices at the two soil depths were separated from each other (Figure 4D).

3.3. Soil Micro-Food Web Relationships

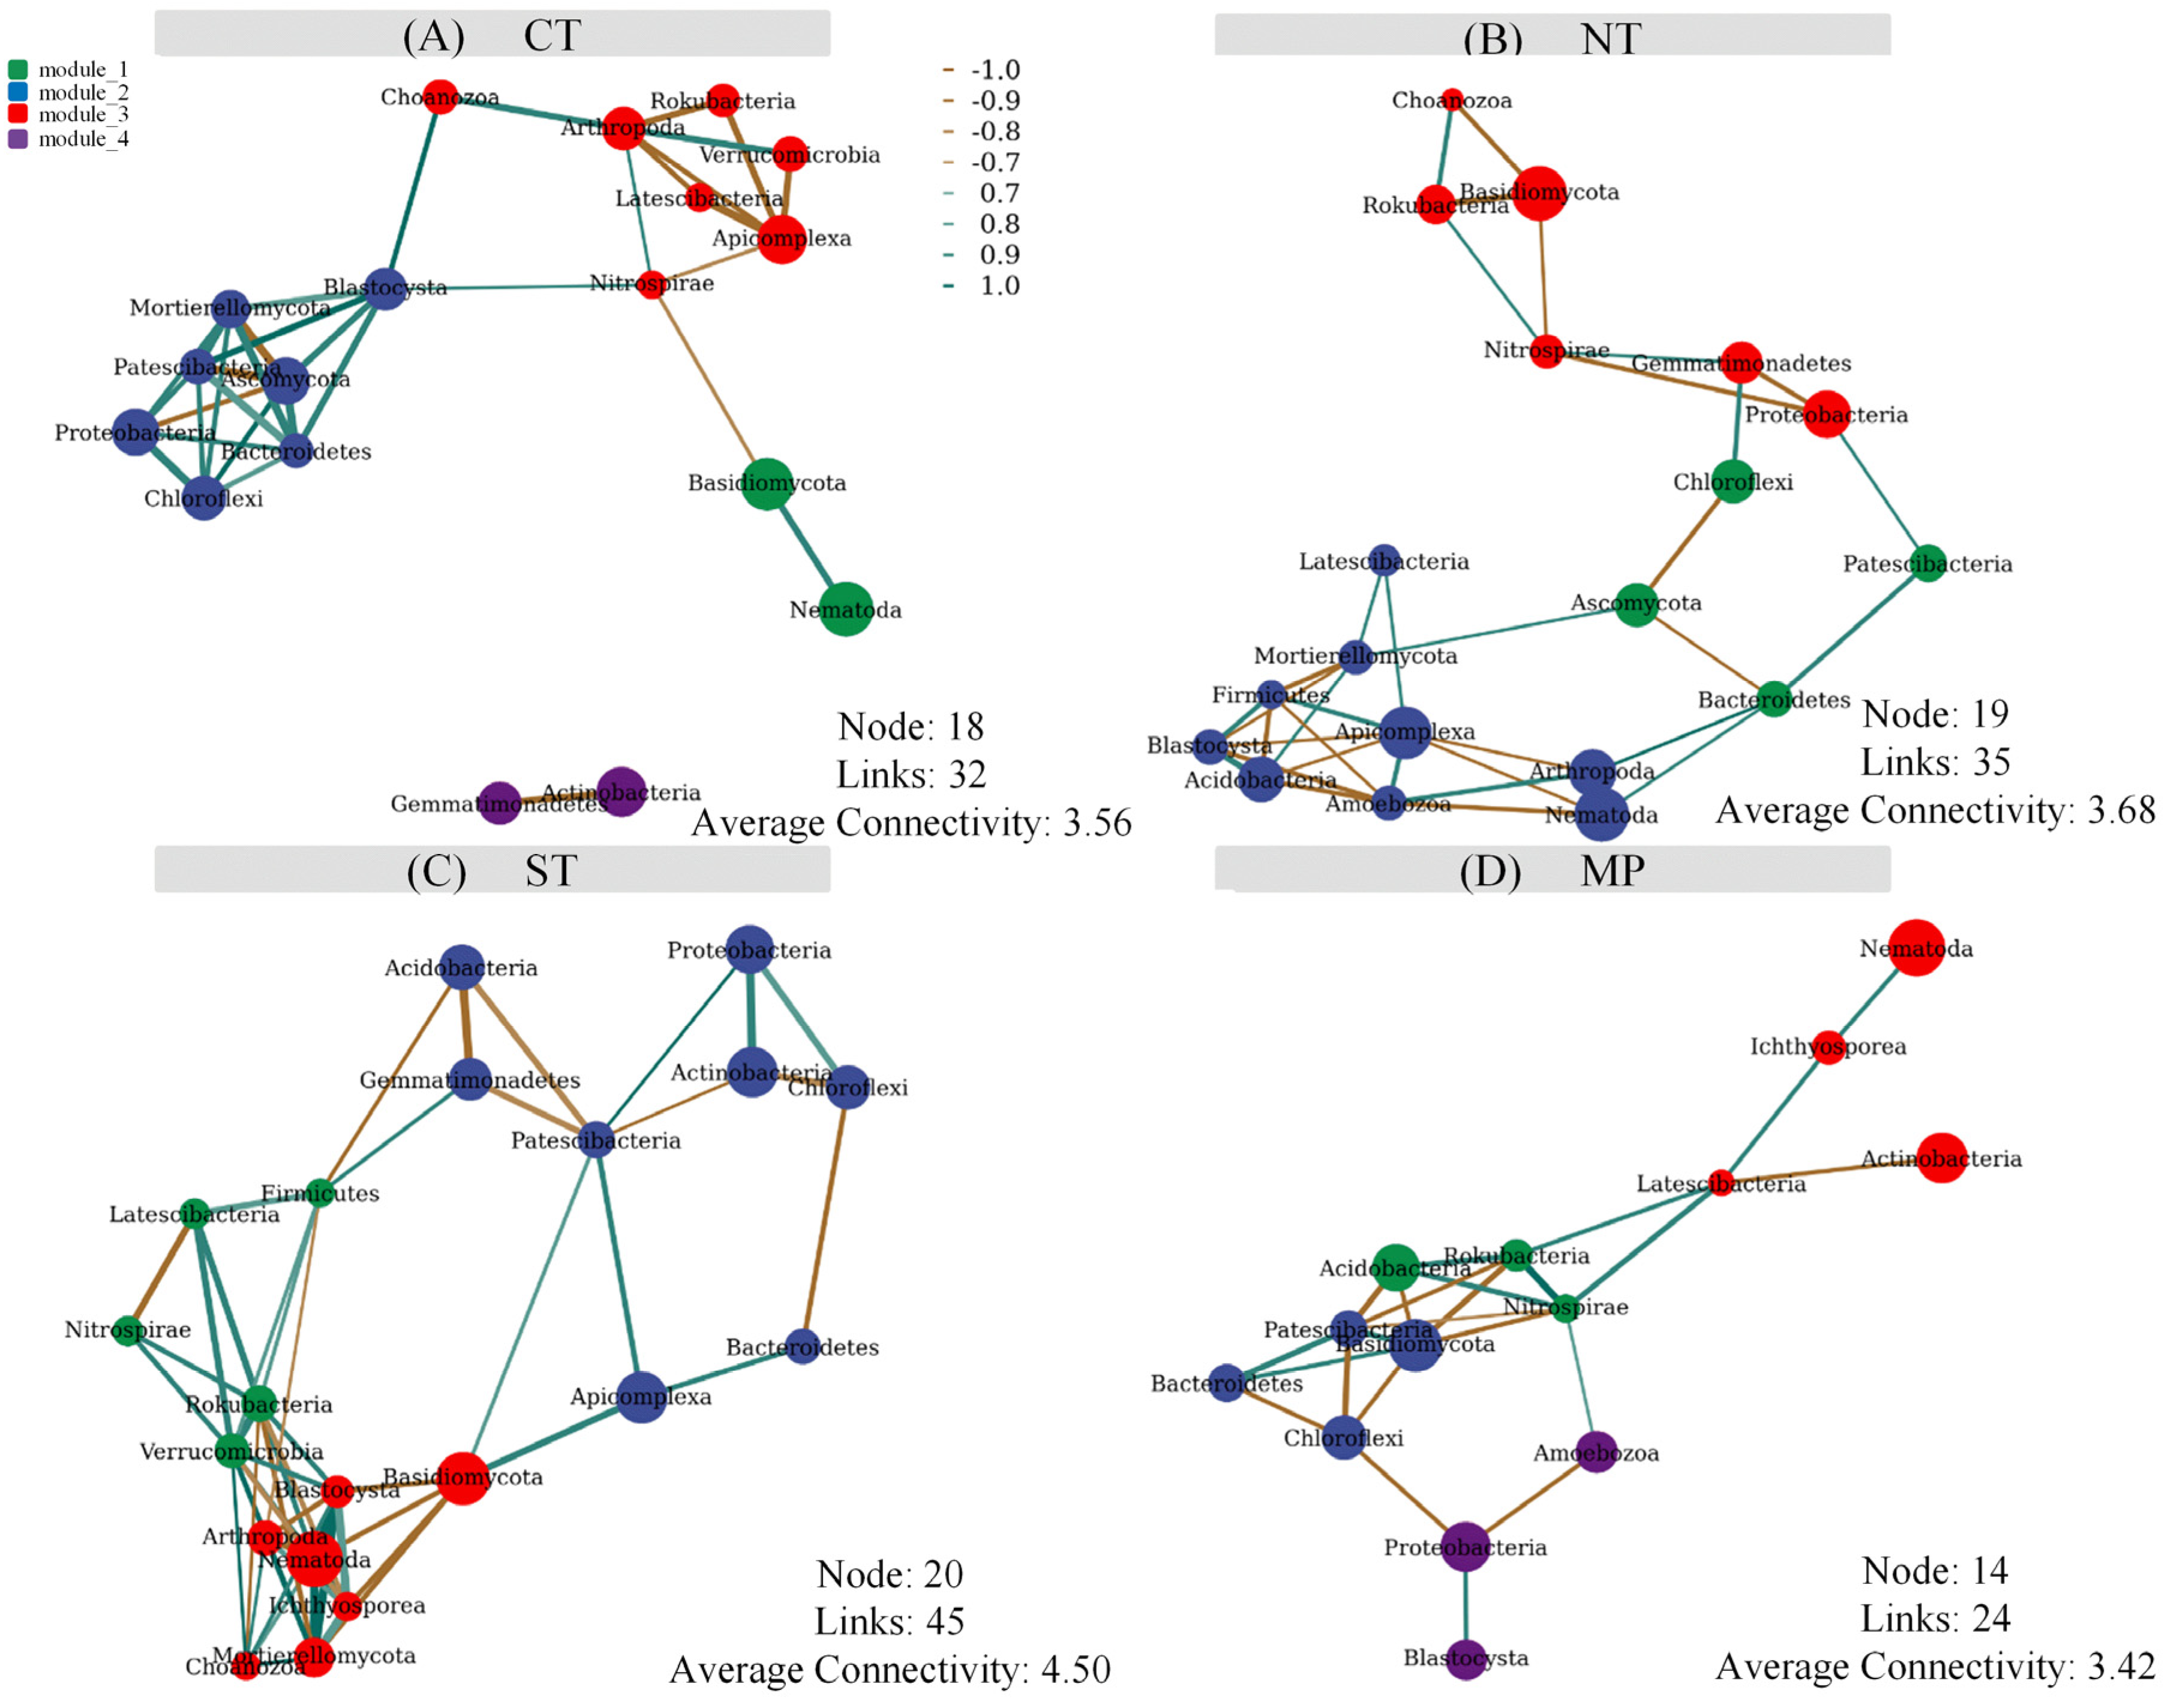
The microbial and faunal co-occurrence networks displayed differences in network structures among the different tillage practices (Figure 5). The nodes and links in the CT, NT, and ST treatments were increased compared to those in the MP treatment, but the average connectivity in the ST treatment was significantly higher than that in the other treatments. Most of the hub nodes detected in the CT treatment belonged to Arthropoda, Blastocysta, Mortierellomycota, Bacterioidetes, and Patescibacteria (Figure 5A). In contrast, the hub nodes of Apicomplexa and Amoebozoa were dominant in the NT treatment (Figure 5B). Intriguingly, the hub nodes in the ST and MP treatments were bacteria and fungi but not protozoa or metazoa. The highly linked nodes, also called “key species”, mainly belonged to Rokubacteria and Verrucomicrobia in the ST treatment (Figure 5C) and to Patescibacteria, Nitrospirae, and Basidiomycota in the MP treatment (Figure 5D).
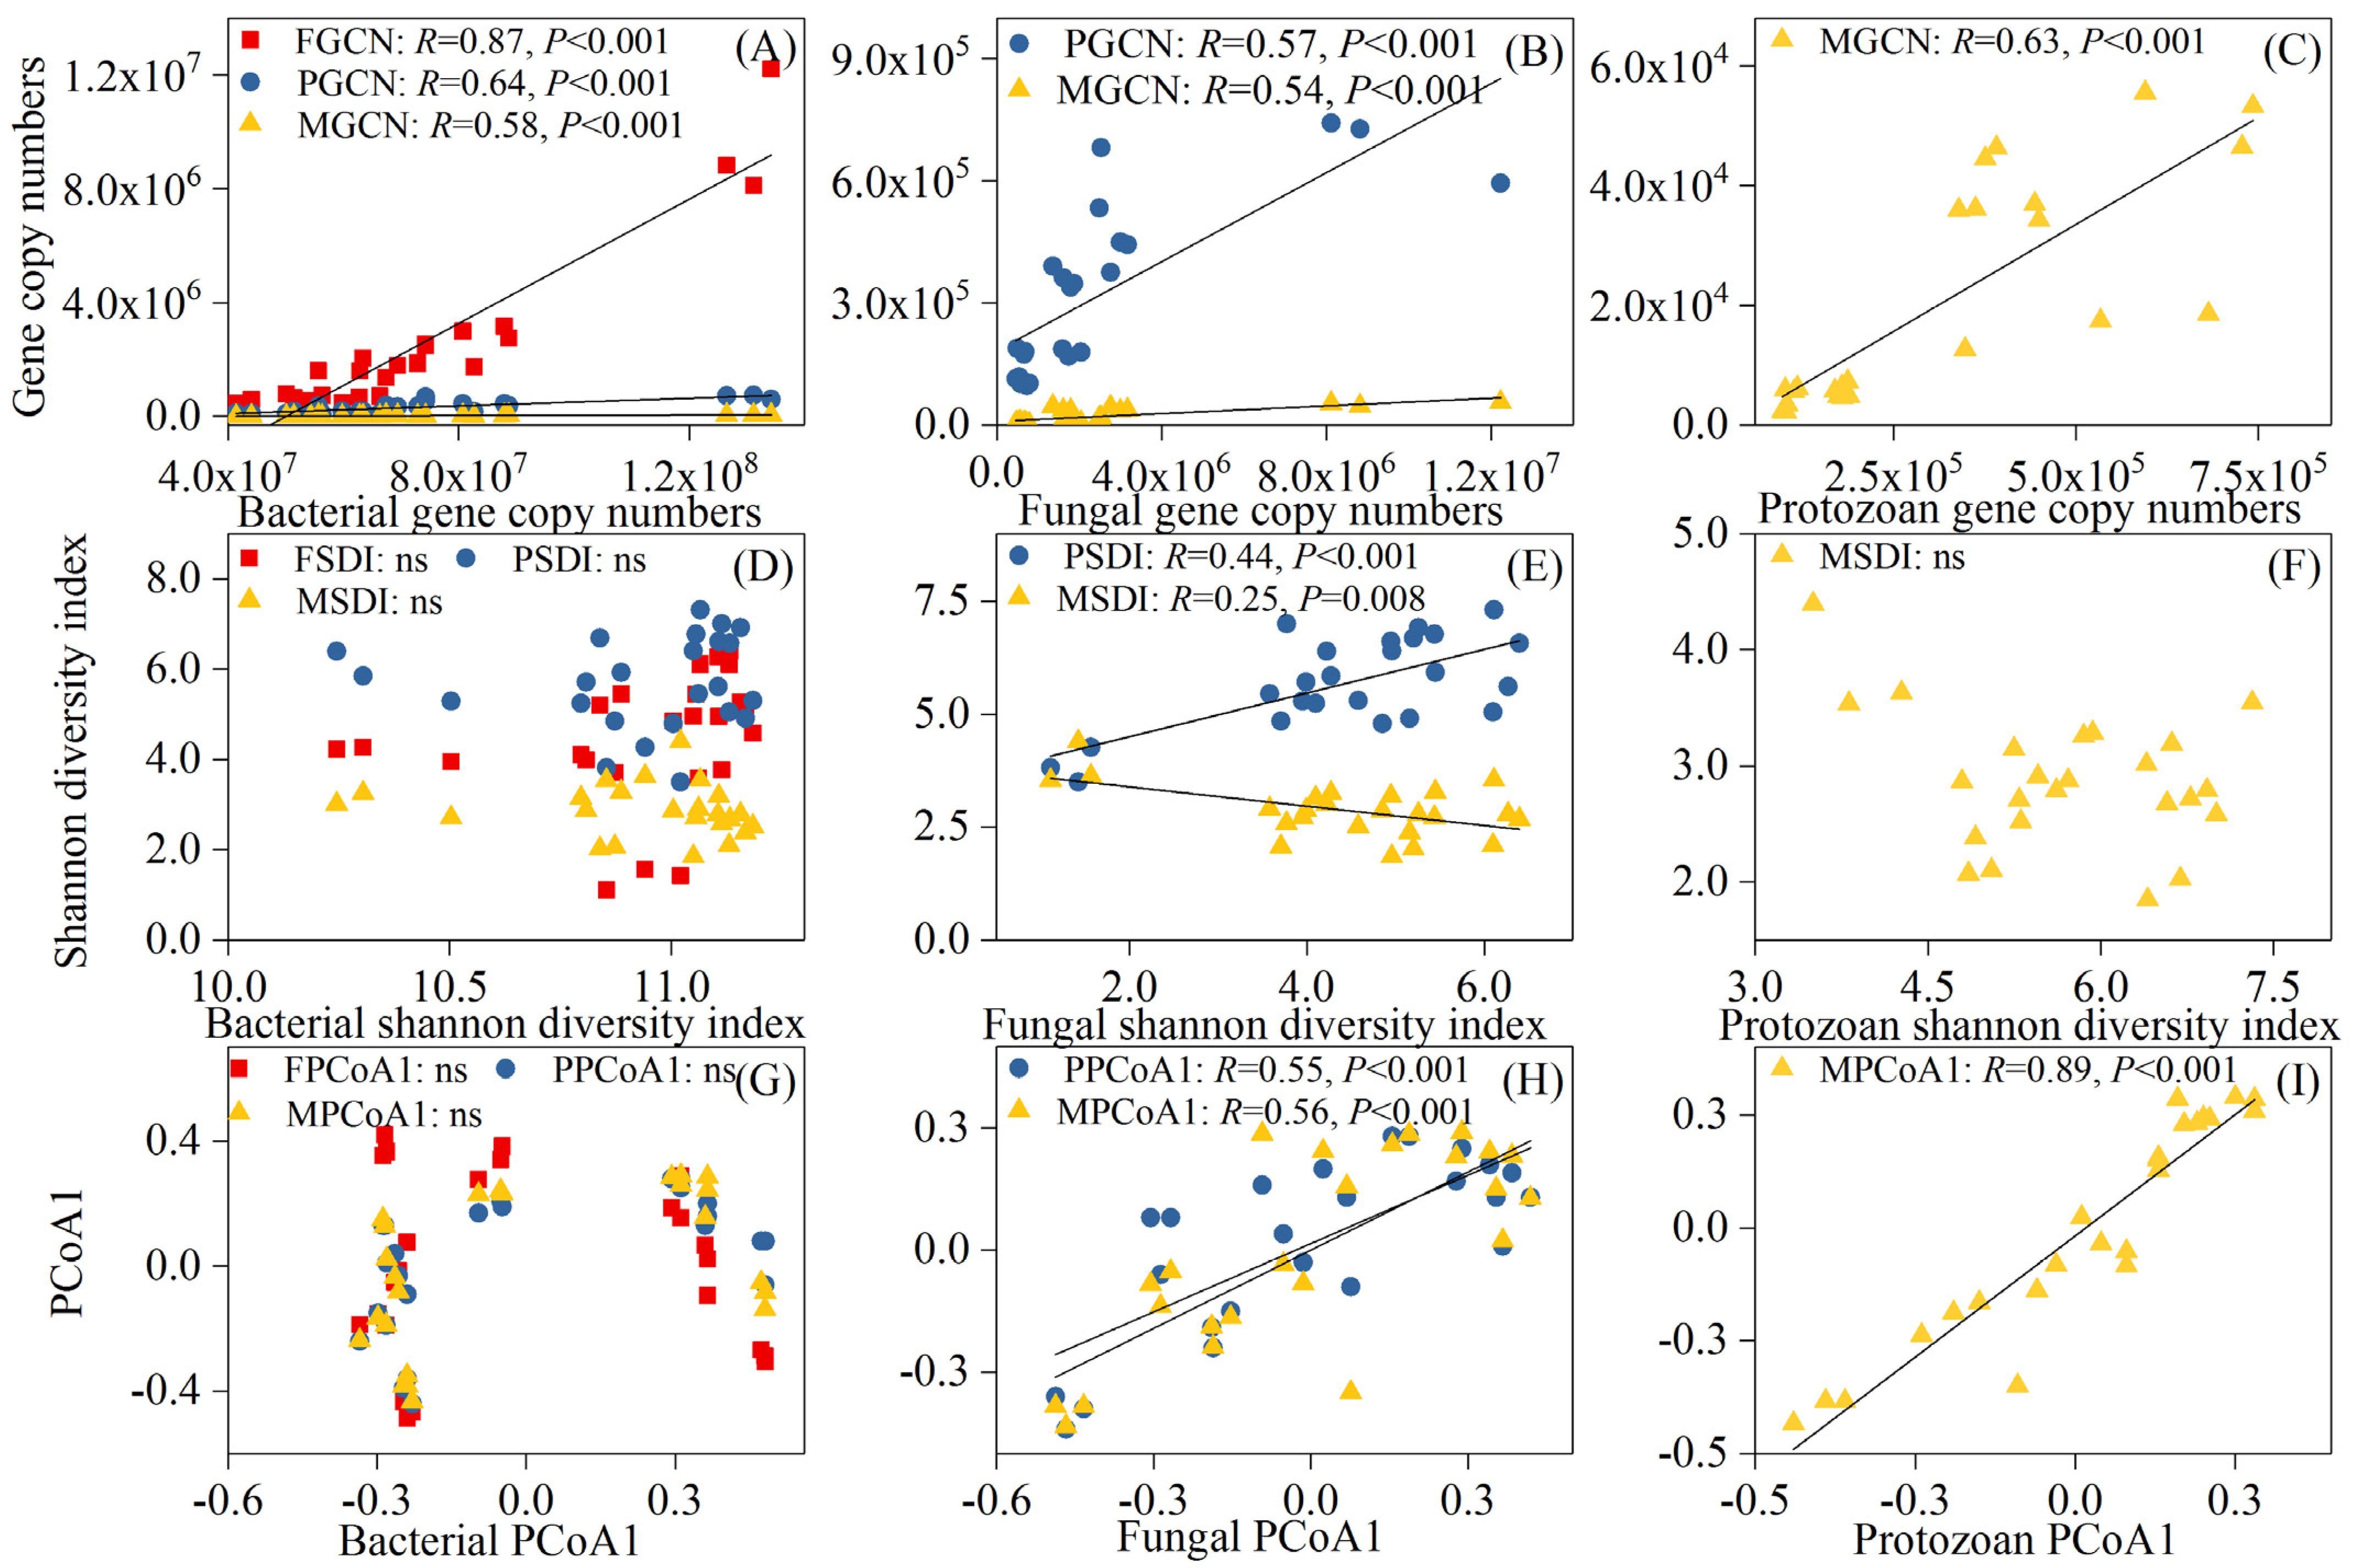
The multi-regression analysis revealed that the faunal gene copy numbers increase with an increase in the microbial gene copy numbers (Figure 6A,B). In addition, the bacterial gene copy numbers were significantly correlated with the fungal gene copy numbers (Figure 6A), and the protozoan gene copy numbers indicated a positive correlation with an increase in the metazoan gene copy numbers (Figure 6C). However, the faunal Shannon diversity index was only susceptible to the fungal Shannon diversity index. The protozoan Shannon diversity index increased with an increase in the fungal Shannon diversity index, while the metazoan Shannon diversity index decreased with an increase in the fungal Shannon diversity index (Figure 6E). Furthermore, it maintained a positive relationship with fungal PCoA1, protozoan PCoA1, and metazoan PCoA1 (Figure 6H,I).

3.4. Relationship between Soil Microbial and Faunal Communities and Soil Properties

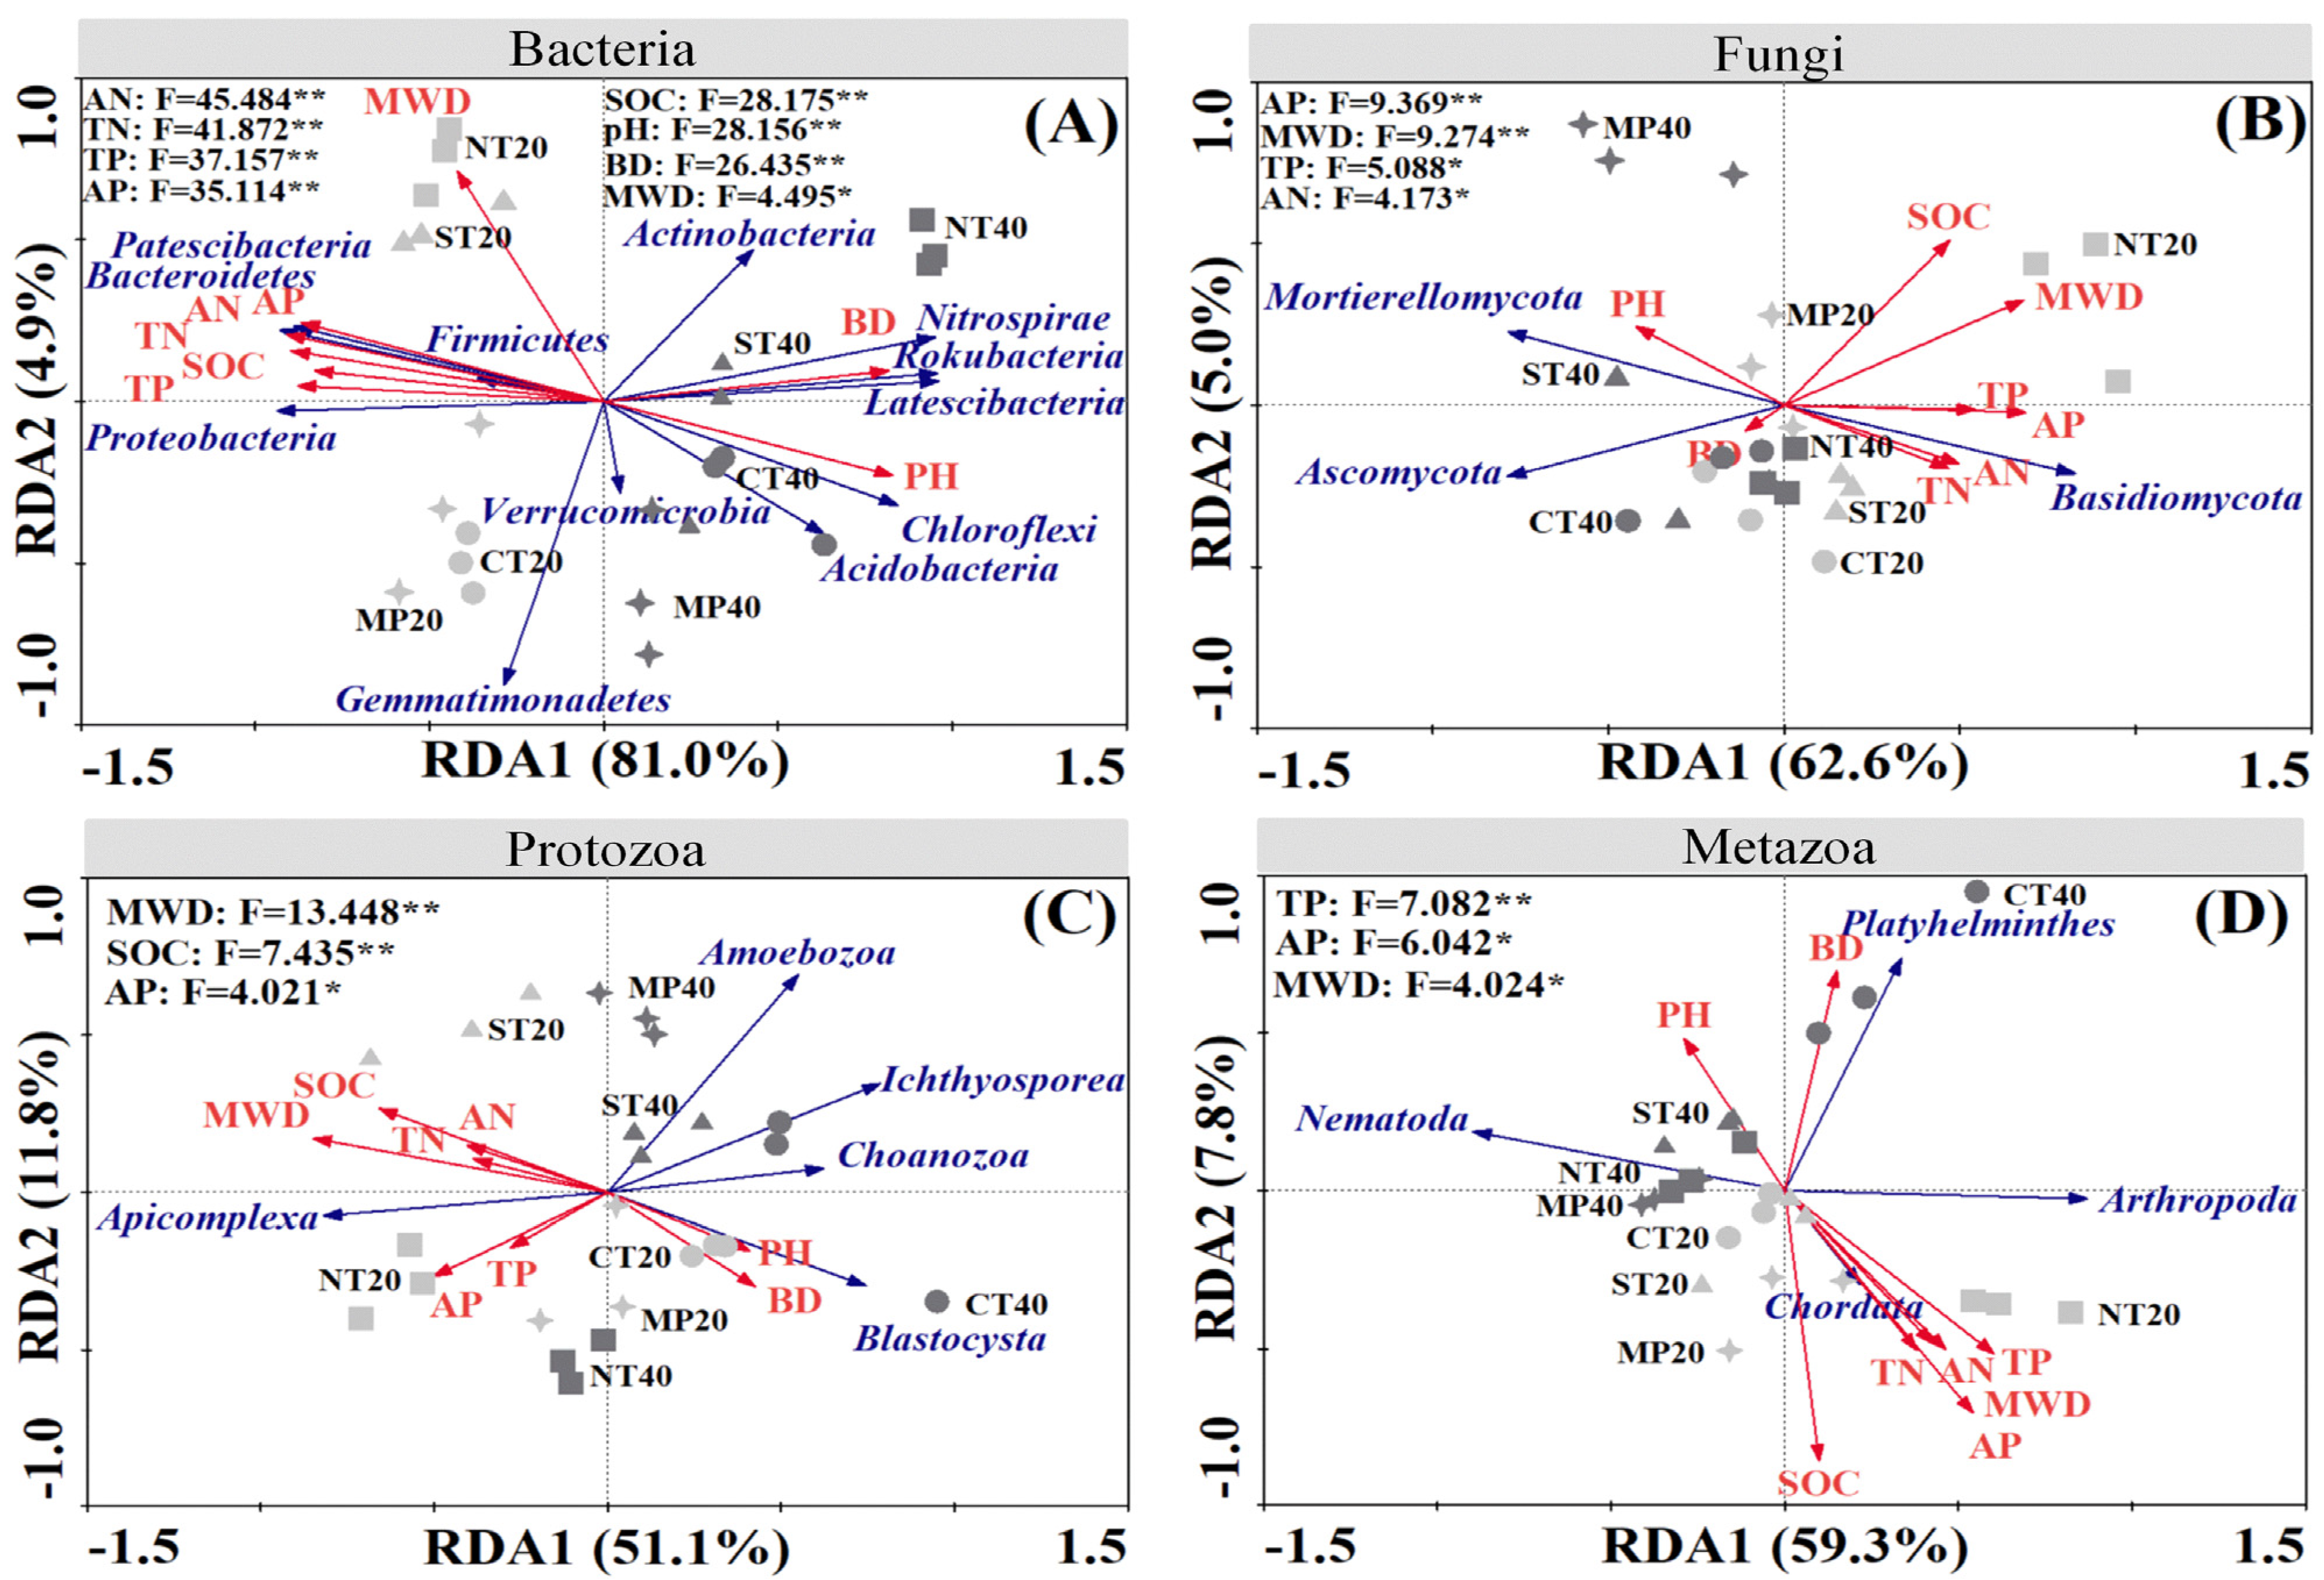
The redundancy analysis (RDA) between the microbial and faunal taxa at the phylum level (blue arrows) and the soil properties (red arrows) demonstrated that the bacterial community structure was significantly related to soil pH, BD, MWD, SOC, TN, TP, AN, and AP (Figure 7A). The fungal community structure was remarkably related to soil TP, AP, AN, and MWD (Figure 7B). Moreover, SOC, AP, and MWD were considerably associated with changes in protozoan phyla (Figure 7C). Furthermore, soil properties, such as TP, AP, and MWD, were dramatically related to changes in the relative abundances of the metazoan phyla (Figure 7D).
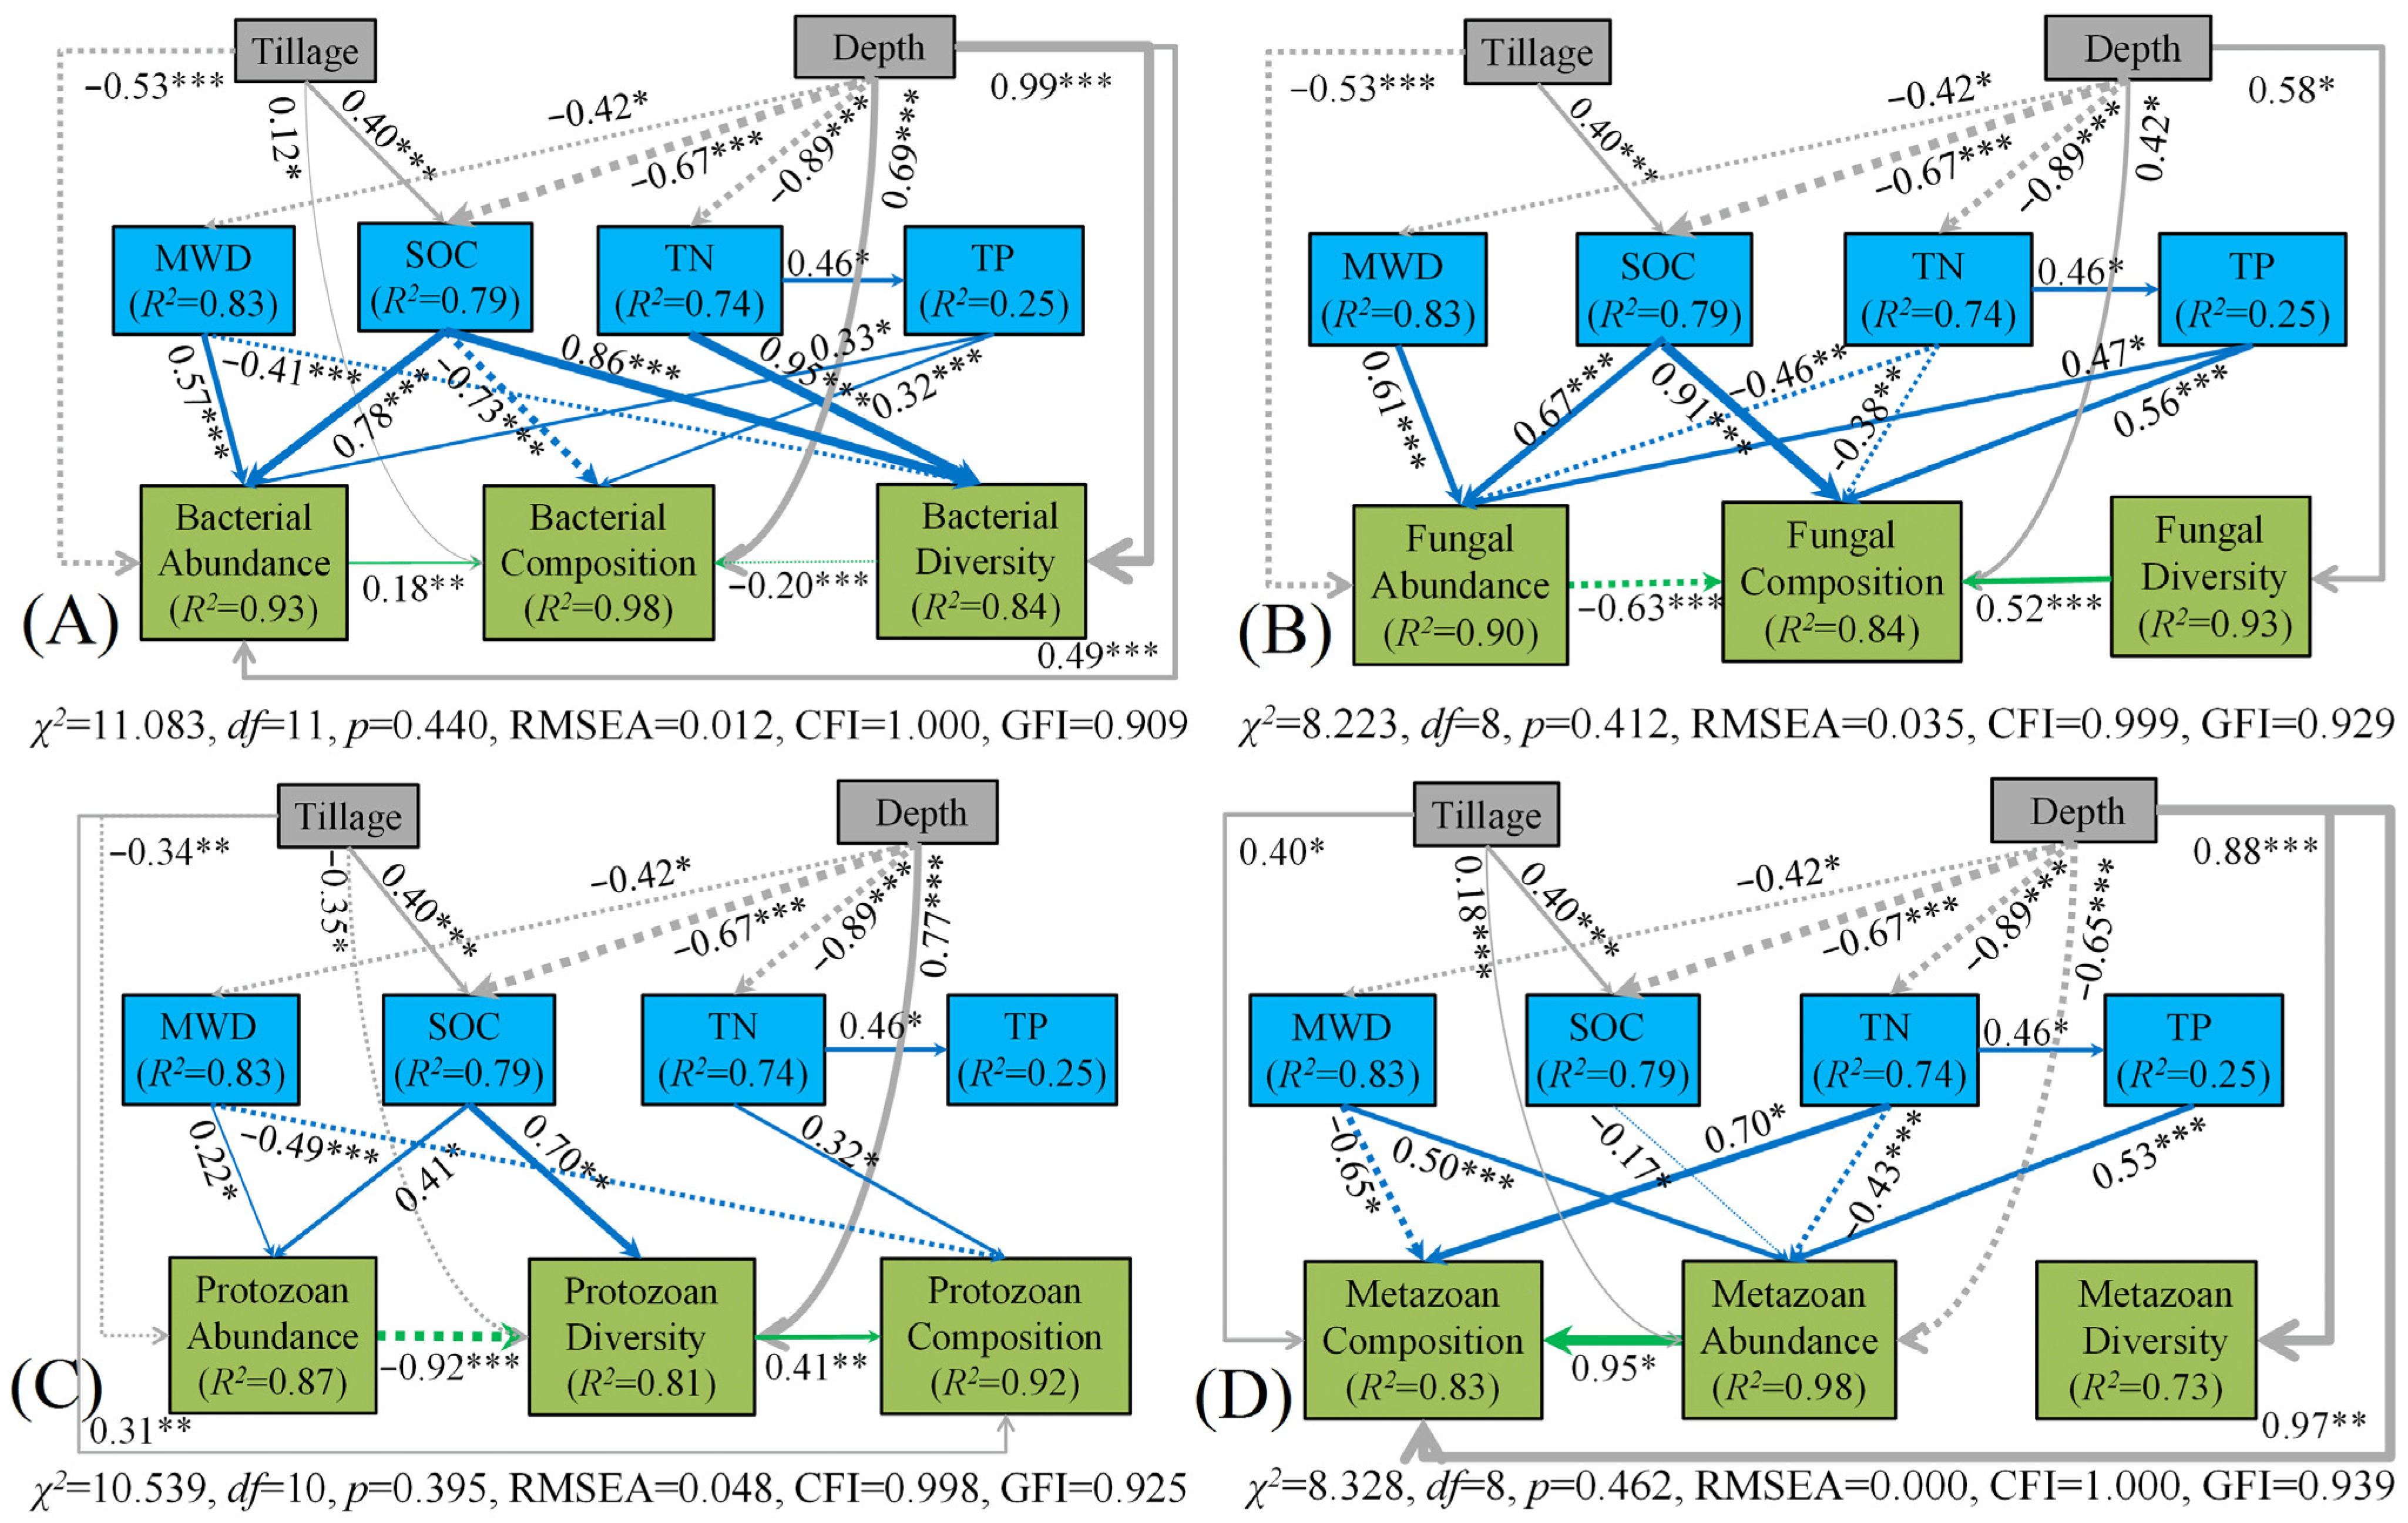
We used the structural equation model (SEM) to assess the direct and indirect effects of the tillage practices and the soil depths on the soil microbial and faunal community abundances, diversities, and compositions. Tillage and depth together explained 93% of the bacterial abundance, 84% of the bacterial diversity, and 98% of the bacterial composition (Figure 8A). Tillage and depth had significant direct effects on bacterial abundance and composition, and depth also had a direct impact on bacterial diversity. Meanwhile, tillage and depth indirectly affected bacterial abundance, diversity, and composition, primarily by impacting MWD, SOC, and TN. Tillage and depth together explained 90% of the fungal abundance, 93% of the fungal diversity, and 84% of the fungal composition (Figure 8B). Tillage had a direct negative effect on fungal abundance, while depth directly influenced fungal diversity and composition. Furthermore, tillage and depth had an indirect impact on fungal abundance and composition via MWD, SOC, and TN. Tillage and depth together explained 87% of the protozoan abundance, 81% of the protozoan diversity, and 92% of the protozoan composition (Figure 8C). Tillage and depth directly impacted protozoan diversity, and tillage negatively affected protozoan abundance and composition. Additionally, tillage and depth manifested indirect effects on protozoan abundance, diversity, and composition via MWD, SOC, and TN. Tillage and depth together explained 98% of the metazoan abundance, 73% of the metazoan diversity, and 83% of the metazoan composition (Figure 8D). Tillage and depth directly regulated metazoan abundance and composition, and depth also had a direct effect on metazoan diversity. Additionally, tillage and depth influenced MWD, SOC, and TN, which affected the abundance and composition in metazoan communities.

4. Discussion

4.1. Effect of Different Tillage Practices on Soil Microbial and Faunal Communities

The soil microbial and faunal community structures were sensitive to the application of different tillage practices, which could regulate the obtainable soil metabolic substrates and change the soil biota community [9]. Due to the relatively lower soil nutrition and the unstable soil structure in the CT treatment, the relative abundance of Chloroflexi flourished (Figure 1A), which, as K-strategists, exhibited an oligotrophic lifestyle [33]. Moreover, the relative abundances of Blastocysta, Choanozoa, and Arthropoda increased under the subsoil layer (Figure 1C,D). These results indicate that rotary tillage mixed the topsoil and broke up the large aggregates and root residues, that the active organic matter could be rapidly decomposed, and that the K-strategists became the dominant soil microbes in utilizing recalcitrant organics [34]. Previous studies have confirmed that Arthropoda are predominant in the invertebrate community in soils under a CT system [35,36]. Our results discovered that the NT treatment significantly increased the topsoil nutrition content and improved soil structure stability, but the opposite trend was discovered with the organic nutrients in the subsoil layer (Table 1). Additionally, higher relative abundances of Rokubacvteria, Basidiomycota, and Apicomplexa under the NT treatment were discovered in both the topsoil and subsoil layers (Figure 1A–C). Rokubacteria can utilize a wide range of substances for carbon, and they use a generalist metabolic strategy in oligotrophic environments [37]. Long-term no-tillage with a high stubble cover seemed to create a suitable environment, which supplied enough organic substrates, significant soil moisture, and limited soil disturbance for the growth of Ascomycetes [38]. Liu et al. [39] also reported that Basidiomycota preferred oligotrophic environments. Furthermore, Apicomplexa, the first most abundant protistan group in soil, are described as being putative parasites of invertebrates [40]. Conversely, unlike the obvious stratification of soil nutrients under the NT treatment, the environments of the topsoil and subsoil layers were relatively homogenized under the MP treatment (Table 1). In addition, the dominant presence of both the so-called “copiotrophic” phyla (Ascomycota and Mortierellomycota) and the “oligotrophic” phyla (Acidobacteria and Verrucomicrobia) was detected in the topsoil layer under the MP treatment, and the relative abundances of the r-strategists (Proteobacteria, Gemmatimonadetes, and Bacteroidetes) were improved in the subsoil layer (Figure 1A,B). This might be because the r-strategist fungi were dominant in the early stages of the decomposition of labile carbon, and Acidobacteria and Verrucomicrobia were reported to adopt a K-strategy and were more abundant in resource-limited soil in order to decompose recalcitrant substrates [41,42]. The previous crop root residues were buried into the subsoil layers with moldboard plowing tillage, and the favorable soil ventilation conditions and abundant organic substrates promoted fast-growing r-strategists [43,44]. Additionally, the relative abundance of Proteobacteria was enhanced under the ST treatment in the topsoil layer (Figure 1A). It has been proposed that Proteobacteria are a part of the copiotrophic bacterial group (r-strategists), which can break down residues into simpler compounds in the early stages of decomposition [45]. This indicates that subsoiling and mulch tillage improved topsoil layer aeration and nutrient availability, accelerating the colonization of r-strategists.
In this study, the bacterial, fungal, protozoan, and metazoan gene copy numbers in the topsoil layer under the NT treatment were 1.31–6.13 times higher than those under the CT, ST, and MP treatments (Figure 2). Similar results were also discovered in a ten-year field study [12]. This finding may be explained by the increased input of crop straw on the surface and the lower soil disturbance under the NT treatment, which can serve as a food resource and provide comfortable accommodation for soil microorganisms [45]. However, the bacterial, fungal, and protozoan gene copy numbers in the subsoil layer were discovered to be higher under the MP treatment than under the NT treatment (Figure 2A–C). These results indicate that MP tillage buried the residue beneath the plow layer, and the microbial communities in the subsoil easily made contact with the straw carbon resource, leading to the fast growth of specific microorganisms (r-strategists) becoming the dominant soil microbes [44]. Distinctively, the bacterial and fungal gene copy numbers in the subsoil layer under the MP treatment were slightly higher than those in the topsoil layer (Figure 2A,B). This funding suggests that thirty-eight years of moldboard plowing tillage disturbance homogenized the bacterial and fungal gene copy numbers between the topsoil and subsoil layer, while the subsoil was differentiated from the topsoil under the no-tillage and reduced tillage treatments in this regard.
Microbial and faunal community diversity indices are essential measures, and they are determined by a combination of both historical and contemporary effects [10,11]. In our study, compared with the CT treatment, the bacterial, fungal, and protozoan Shannon diversity indices in both the topsoil and subsoil layers were significantly decreased under the NT treatment. On the contrary, the metazoan Shannon diversity index in the topsoil layer was discovered to be higher under the NT treatment than under the CT treatment (Figure 3), indicating that the topsoil and subsoil layers under the NT treatment provided an adverse microbial and protozoan habitat related to the increased soil bulk density and reduced soil labile carbon and that the relative abundances of rare microorganisms were decreased. The contrasting difference in bacterial community diversity between NT20 and CT20 portrayed an identical pattern to that of previous studies [46]. However, the sampling at a depth of 0–20 cm concealed the variation in the bacterial diversity between the surface (0–5 cm) and subsurface (5–20 cm) layers. Li et al. [15] discovered that the bacterial Shannon diversity was improved under NT compared to that under CT in the surface layer. Furthermore, in this study, there was a lower bacterial and metazoan Shannon diversity and a higher fungal and protozoan Shannon diversity under the NT treatment in the subsoil layer than in the topsoil layer (Figure 3). These results indicate that the anaerobic environment caused by the decline in soil porosity and oxygen content could inhibit bacteria and bacterivorous metazoan growth [47]. In the present study, the principal coordinate analysis suggested that soil bacterial phylogenetic composition was strongly affected by different tillage practices at both depths (Figure 4A), confirming similar previous studies [15,34]. Meanwhile, the fungal community composition tended to be identical at both depths under the MP treatment (Figure 4B). The negligible difference in the protozoan community composition between the CT and MP treatments in the topsoil layer (Figure 4C) and the metazoan community composition in the subsoil layer demonstrated convergent evolution after application tillage (Figure 4D). Hence, we suggest that different long-term tillage practices significantly influenced the bacterial community composition at both depths.

4.2. Relationships between Soil Microbial and Faunal Communities

Co-occurrence networks are ubiquitous and particularly crucial in understanding microbial community structure, providing deep insights into potential interactions and functional organization under soil perturbations [48]. The higher connectivity and the more nodes and links presage of the microbial and faunal communities formed a much more complex and extensive network, making for higher community stability, enhancing the breadth of niche, improving the efficiency of resource transfer, and helping to efficiently use soil nutrients [49]. In this way, our co-occurrence network analysis demonstrated that the nodes, links, and average connectivity reduced among tillage practices in a sequence of ST > NT > CT > MP (Figure 5). This is a further new discovery after Zhang et al. [11], who reported that the connectance of the food web in a black soil were significantly affected by tillage practices, and their values decreased of the order of NT > CT > MP. Liu et al. [50] Also observed that the NT bacterial community network displayed a more complex interaction in bulk and rhizosphere soils than did the CT and MP networks in black soils. Previous studies have demonstrated that ST has an impact comparable to the impact of NT on microbial community structure in the Chinese loess plateau [51]. In this study, we researched from the microbial level to the soil microfood web level to evaluate four common tillage practices in dryland farming systems in China. We discovered that the soil microfood web co-occurrence network under ST system was most complex. In the ST treatment, the reduce tillage led to soil structural stability, and the soil was only loosened to break up compaction. Additionally, the ST treatment caused a significantly higher MWD than did the CT and MP treatments, which might be attributed to the lower soil environmental disturbances and to the retention of crop straw on the soil surface. Co-occurrence network nodes with large numbers of links play determinant roles in shaping networks and are identified as being hub nodes [52]. In the present study, we observed that Rokubacteria and Verrucomicrobia were hub nodes in the ST treatment (Figure 5C). At the same time, Patescibacteria, Nitrospirae, and Basidiomycota were key species in the MP treatment (Figure 5D). The slower growing K-strategists were favored under oligotrophic conditions with a lower nutrient availability. This phenomenon suggests that these microbes were recruited to resist the relative deficiencies of available nutrients under deep tillage systems [52]. The protozoan taxa of Apicomplexa and Amoebozoa were hub nodes in the NT treatment (Figure 5B). Soil protists have been mainly considered bacterial feeders, and NT could build more complex interactions between consumers (such as bacterivores) and resources (such as bacteria). Thus, the stability of the soil micro-food web was improved by long-term conservation tillage [12].
Our results demonstrate a significant positive correlation between microbial and faunal gene copy numbers (Figure 6A–C). These results are in accordance with the conceptual framework of the microbial loop, indicating a strong top–down control of microbial biomass by bacterivorous and fungivorous protists and nematodes [10]. In addition, the protozoan Shannon diversity index increased with an increase in the fungal Shannon diversity index, while the metazoan Shannon diversity index decreased with an increase in the fungal Shannon diversity index (Figure 6E). This may be due to a taxonomically wide range of soil protest taxa being fungal feeders [53], while only fungivorous nematodes participate in the fungal decomposition channel [54]. Furthermore, there was a strong positive relationship between fungal, protozoan, and metazoan community compositions (Figure 6H,I). Previous studies have demonstrated that higher fungivore and total nematode biomasses are discovered in low-frequency mulching with less soil disturbance, offering stable survival conditions for K-strategist nematodes with a larger size [13].

4.3. Control of Soil Properties on Microbial and Faunal Communities

The changes in soil physicochemical properties induced by different tillage practices had more correlations with microbial and faunal community structures primarily due to the differentiated soil environment altering microbial and faunal species interactions [52]. The results of our RDA discovered that all soil physicochemical properties demonstrated stronger links with the bacterial community structure (Figure 7A). This phenomenon indicates that the bacterial community structure was the most sensitive to the variation in the soil environment. In contrast, the bacterial community composition separated between different tillage practices and soil depths in the PCoA confirmed this idea. Our previous research also discovered similar results [34]. A synthesis of all RDA results demonstrated that MWD and AP contributed more to the soil microbial and faunal community structures than did the other soil properties investigated (Figure 7). Soil MWD, which reflects soil structure stability, is known to influence soil microbial community structure to some extent [55]. Additionally, stabilizing agents tend to be transient in soil and need continuous inputs of organic materials and microbial activity to maintain stability [56]. In this study, a higher MWD was observed under the NT and ST treatments (Table 1). This result is similar to that of Frey et al. [57], who also noted that the MWD of water-stable aggregates reduced remarkably with the increase in tillage intensity. In addition, soil AP was higher in the topsoil layer and lower in the subsoil layer under the NT treatment than in the other tillage practices (Table 1). This suggests a redistribution of native P with time toward the surface in no-tillage systems [58]. A recent study documented that the effect of tillage practices on soil fungal community was mediated through soil AP, which was recognized as being an important driver of fungal communities [48]. Additionally, soil pH is one of the main determinants of soil biological life, the initial soil pH before the experiment was alkaline (7.6), but after many years of tillage practices, the soils became acidic (5.15–5.48) in the 0–20 cm soil depth. Guo et al. [59] have demonstrated that soil pH declined significantly from the 1980s to the 2000s in the major Chinese crop-production areas. Processes related to nitrogen cycling released 20 to 221 kilomoles of hydrogen ion (H+) per hectare per year, and base cations uptake contributed a further 15 to 20 kilomoles of H+ per hectare per year to soil acidification.
The critical effects of SEM provided confirmatory evidence for the hypothesis that tillage practices affect the arable layer soil micro-food web by altering soil physiochemical conditions and further affecting soil microbial and faunal abundances, community diversities, and compositions in a Chinese Mollisol (Figure 8). Moreover, tillage and depth had significant direct effects on the microbial and faunal communities in the present study, which can be explained by two possible reasons. One reason is that excessive tillage breaks up the network of hyphae and destabilizes soil aggregates, and it probably slows the rate at which hyphae can stabilize aggregates [60]. The other possible reason is that different tillage practices change the location of the straw incorporated into the soil, which leads to the heterogeneity of the soil environment and, thus, affects the soil microbial and faunal communities [61]. Furthermore, we discovered that tillage and depth had an indirect quantitative effect by affecting soil MWD, SOC, and TN, which, in turn, affected soil microbial and faunal abundances, community diversities, and compositions (Figure 8). SOC is one of the most essential components of soil quality, and its turnover is closely related to soil micro-food webs [13]. Our results indicate that soil microbial and faunal gene abundances were correlated with SOC, which is consistent with previous work [13,34]. This is because serial no-tillage with straw coverage not only reduces soil erosion in the surface soil but also improves soil aggregation and the accumulation of SOC, all of which are favorable to the survival of soil microorganisms [15]. However, the stratification ratio of SOC was greater under the no-tillage system [62], and the microbial gene abundance also decreased with the increase in soil depth (Table 1). On the contrary, MP disturbance homogenized the SOC and microbial gene abundance between MP20 and MP40 (Figure 2A,B). Meanwhile, bacterial and fungal energy channels are the main decomposition pathways in soil, and protozoa and metazoa are both facilitators and regulators of decomposition pathways. Thus, soil micro-food webs play a vital role in SOC degradation and nutrient cycling [13]. In addition, TN was significantly correlated with fungal and faunal community compositions (Figure 8B–D), perhaps because K-strategist fungal species and fungivorous multiply under low-N availability conditions, which can be explained by the ‘microbial N mining’ theory [63]. Additionally, we also discovered that TP had a positive correlation with microbial gene abundance and community composition (Figure 8A,B). Liu et al. [64] suggested that P availability is one of the limiting factors of microbial growth and soil respiration, and the ratio of fungi to bacteria significantly increases the response to P addition. Moreover, the microbial community compensates for the apparent P limitation by altering its composition, and microorganisms better adapted to acquiring P under acidic conditions, such as soil fungi, are discovered to have a higher abundance in more acidic environments [65]. Besides, there is actually an interconnection between physicochemical characteristics and soil biodiversity, the soil micro-food webs can certainly have a significant effect on soil physicochemical properties. The nematode community affected the soil organic matter decomposition indirectly through altering the structure of the microbial community [66]. The microbial community structure and activity affected soil C stabilization, and the protection of SOC was promoted by larger size soil aggregate structures [67].

5. Conclusions

No-tillage and subsoil tillage are commonly used conservation tillage practices. In this study, no-tillage promoted the topsoil accumulation of microbial and faunal abundance and soil organic carbon, while reducing microbial and protozoan community diversities. Conversely, subsoil tillage alleviated the stratification of soil organisms and nutrients in topsoil and subsoil, and it maintained soil microbial and faunal community diversities. Additionally, subsoil tillage enhanced the complexity and stability of the soil micro-food web structure. Tillage and depth had direct and indirect quantitative effects on microbial and faunal abundances, diversities, and compositions. Our results increase the understanding of the role of conservation tillage in altering the soil micro-food web in contrasting soil layers in a Chinese Mollisol.

Supplementary Materials

The following supporting information can be downloaded at: https://www.mdpi.com/article/10.3390/agronomy12102356/s1, Figure S1: Field picture at maize jointing stage.

Author Contributions

Conceptualization, P.S., Y.L. and J.Z.; methodology, P.S.; software, P.S.; validation, P.S., Y.L. and J.Z.; formal analysis, P.S. and Y.L.; investigation, P.S., R.L., H.Z., H.W., Y.Y., Y.L. and J.Z.; resources, Y.L. and J.Z.; data curation, R.L., H.W., Y.Y. and W.L.; writing—original draft preparation, P.S.; writing—review and editing, P.S., Y.L. and J.Z.; visualization, P.S.; supervision, Y.L. and J.Z.; project administration, Y.L. and J.Z.; funding acquisition, P.S. All authors have read and agreed to the published version of the manuscript.

Funding

This research was funded by the Jilin Province Basic Science Research Foundation (KYJF2021ZR006), the China Postdoctoral Science Foundation (2021M693907), and the Jilin Province Agricultural Science and Technology Innovation Project (CXGC2021RCB003, CXGC2020RCG010).

Data Availability Statement

The data presented in this study are available on request from the first author.

Conflicts of Interest

The authors declare no conflict of interest.

References

  1. Li, M.; He, P.; Guo, X.L.; Zhang, X.; Li, L.J. Fifteen-year no tillage of a Mollisol with residue retention indirectly affects topsoil bacterial community by altering soil properties. Soil Tillage Res. 2021, 205, 104804. [Google Scholar] [CrossRef]
  2. Ning, T.Y.; Liu, Z.; Hu, H.Y.; Li, G.; Kuzyakov, Y. Physical, chemical and biological subsoiling for sustainable agriculture. Soil Tillage Res. 2022, 223, 105490. [Google Scholar] [CrossRef]
  3. NRCS. Conservation Practices on Cultivated Cropland, a Comparison of CEAP I and CEAP II Survey Data and Modeling. 2022. Available online: https://www.nrcs.usda.gov/wps/portal/nrcs/main/national/technical/nra/ceap (accessed on 15 June 2022).
  4. Busari, M.A.; Kukal, S.S.; Kaur, A.; Bhatt, R.; Dulazi, A.A. Conservation tillage impacts on soil, crop and the environment. Int. Soil Water Conserv. 2015, 3, 119–129. [Google Scholar] [CrossRef]
  5. Gebhardt, M.R.; Daniel, T.C.; Schweizer, E.E.; Allmaras, R.R. Conservation tillage. Science 1985, 230, 625–630. [Google Scholar] [CrossRef]
  6. Wardle, D.A.; Verhoef, H.A.; Clarholm, M. Trophic relationships in the soil microfood–web: Predicting the responses to a changing global environment. Glob. Chang. Biol. 1998, 4, 713–727. [Google Scholar] [CrossRef]
  7. Wardle, D.A. Impacts of disturbance on detritus food webs in agro-ecosystems of contrasting tillage and weed management practices. Adv. Ecol. Res. 1995, 26, 107–185. [Google Scholar]
  8. Van den Hoogen, J.; Geisen, S.; Routh, D.; Ferris, H.; Traunspurger, W.; Wardle, D.A.; de Goede, R.G.M.; Adams, B.J.; Ahmad, W.; Andriuzzi, W.S.; et al. Soil nematode abundance and functional group composition at a global scale. Nature 2019, 572, 194–198. [Google Scholar] [CrossRef]
  9. Coleman, D.; Fu, S.L.; Hendrix, P.; Crossley, C.J. Soil foodwebs in agroecosystems: Impacts of herbivory and tillage management. Eur. J. Soil Biol. 2002, 38, 21–28. [Google Scholar] [CrossRef]
  10. Zhong, S.; Zeng, H.C.; Jin, Z.Q. Influences of different tillage and residue management systems on soil nematode community composition and diversity in the tropics. Soil Biol. Biochem. 2017, 107, 234–243. [Google Scholar] [CrossRef]
  11. Zhang, S.X.; Chang, L.; McLaughlin, N.B.; Cui, S.Y.; Wu, H.T.; Wu, D.H.; Liang, W.J.; Liang, A.Z. Complex soil food web enhances the association between N mineralization and soybean yield–a model study from long-term application of a conservation tillage system in a black soil of Northeast China. Soil 2021, 7, 71–82. [Google Scholar] [CrossRef]
  12. Zhang, S.X.; Li, Q.; Lü, Y.; Sun, X.M.; Jia, S.X.; Zhang, X.P.; Liang, W.J. Conservation tillage positively influences the microflora and microfauna in the black soil of Northeast China. Soil Tillage Res. 2015, 149, 46–52. [Google Scholar] [CrossRef]
  13. Kou, X.C.; Ma, N.N.; Zhang, X.K.; Xie, H.T.; Zhang, X.D.; Wu, Z.F.; Liang, W.J.; Li, Q.; Ferris, H. Frequency of stover mulching but not amount regulates the decomposition pathways of soil micro-foodwebs in a no-tillage system. Soil Biol. Biochem. 2020, 144, 107789. [Google Scholar] [CrossRef]
  14. Liu, J.Y.; Zhang, Z.X.; Xu, X.L.; Kuang, W.H.; Zhou, W.C.; Zhang, S.W.; Li, R.D.; Yan, C.Z.; Yu, D.S.; Wu, S.X.; et al. Spatial patterns and driving forces of land use change in China during the early 21st century. J. Geogr. Sci. 2010, 20, 483–494. [Google Scholar] [CrossRef]
  15. Li, H.L.; Shen, H.O.; Wang, Y.; Wang, Y.; Gao, Q. Effects of ridge tillage and straw returning on runoff and soil loss under simulated rainfall in the mollisol region of northeast China. Sustainability 2021, 13, 10614. [Google Scholar] [CrossRef]
  16. Wang, X.B.; Cai, D.X.; Hoogmoed, W.B.; Oenema, O.; Perdok, U.D. Developments in conservation tillage in rainfed regions of North China. Soil Tillage Res. 2007, 93, 239–250. [Google Scholar] [CrossRef]
  17. Jia, L.; Zhao, W.; Zhai, R.; Liu, Y.; Kang, M.; Zhang, X. Regional differences in the soil and water conservation efficiency of conservation tillage in China. Catena 2019, 175, 18–26. [Google Scholar] [CrossRef]
  18. Zheng, H.B.; Liu, W.R.; Zheng, J.Y.; Luo, Y.; Li, R.P.; Wang, H.; Qi, H. Effect of long–term tillage on soil aggregates and aggregate–associated carbon in black soil of Northeast China. PLoS ONE 2018, 28, e0199523. [Google Scholar] [CrossRef] [PubMed]
  19. Blake, G.R.; Hartage, K.H. Bulk Density. In Methods of Soil Analysis Part 1; Klute, A., Ed.; American Society of Agronomy: Madison, WI, USA, 1986; pp. 364–366. [Google Scholar]
  20. Kemper, W.D.; Rosenau, R.C. Aggregate Stability and Size Distribution. In Methods of Soil Analysis. Part 1. Physical and Mineralogical Methods–Agronomy Monograph 9; American Society of Agronomy: Madison, WI, USA, 1986; pp. 425–442. [Google Scholar]
  21. Olsen, S.; Sommers, L.; Page, A. Methods of Soil Analysis. Part 2. Chemical and Microbiological Properties of Phosphorus; ASA Monograph; Bloomsbury: London, UK, 1982; pp. 403–430. [Google Scholar]
  22. Dorich, R.A.; Nelson, D.W. Evaluation of Manual Cadmium Reduction Methods for Determination of Nitrate in Potassium Chloride Extracts of Soils. Soil Sci. Soc. Am. J. 1984, 48, 72. [Google Scholar] [CrossRef]
  23. Hedley, M.J.; Stewart, J.W.B. Method to measure microbial phosphate in soils. Soil Biol. Biochem. 1982, 14, 377–385. [Google Scholar] [CrossRef]
  24. Motsara, M.R.; Roy, R.N. Guide to Laboratory Establishment for Plant Nutrient Analysis; FAO: Rome, Italy, 2008. [Google Scholar]
  25. Wang, Z.G.; Hu, Y.L.; Xu, W.H.; Liu, S.; Hu, Y.; Zhang, Y. Impacts of dimethyl phthalate on the bacterial community and functions in black soils. Front. Microbiol. 2015, 6, 405. [Google Scholar] [CrossRef] [PubMed]
  26. Duan, Y.; Awasthi, S.K.; Chen, H.; Liu, T.; Zhang, Z.; Zhang, L.; Awasthi, M.K.; Taherzadeh, M.J. Evaluating the impact of bamboo biochar on the fungal community succession during chicken manure composting. Bioresour. Technol. 2019, 272, 308–314. [Google Scholar] [CrossRef] [PubMed]
  27. Hugerth, L.W.; Muller, E.E.L.; Hu, Y.O.O.; Lebrun, L.A.M.; Roume, H.; Lundin, D.; Wilmes, P.; Andersson, A.F.; Voolstra, C.R. Systematic design of 18S rRNA gene primers for determining eukaryotic diversity in microbial consortia. PLoS ONE 2014, 9, e95567. [Google Scholar] [CrossRef] [PubMed]
  28. Sapkota, R.; Nicolaisen, M. High-throughput sequencing of nematode communities from total soil DNA extractions. BMC Ecol. 2015, 15, 3. [Google Scholar] [CrossRef]
  29. Callahan, B.J.; McMurdie, P.J.; Rosen, M.J.; Han, A.W.; Johnson, A.J.A.; Holmes, S.P. DADA2: High–resolution sample inference from Illumina amplicon data. Nat. Methods 2016, 13, 581–583. [Google Scholar] [CrossRef]
  30. Wang, H.; Li, X.; Li, X.; Wang, J.; Li, X.; Guo, Q.; Yu, Z.; Yang, T.; Zhang, H. Long–term no–tillage and different residue amounts alter soil microbial community composition and increase the risk of maize root rot in northeast China. Soil Tillage Res. 2020, 196, 104452. [Google Scholar] [CrossRef]
  31. Yu, H.L.; Ling, N.; Wang, T.T.; Zhu, C.; Wang, Y.; Wang, S.J.; Gao, Q. Responses of soil biological traits and bacterial communities to nitrogen fertilization mediate maize yields across three soil types. Soil Tillage Res. 2019, 185, 61–69. [Google Scholar] [CrossRef]
  32. Chen, T.; You, Y.; Xie, G.; Zheng, X.; Zhao, A.; Liu, J.; Jia, W. Strategy for an association study of the intestinal microbiome and brain metabolome across the lifespan of rats. Anal. Chem. 2018, 90, 2475–2483. [Google Scholar] [CrossRef] [PubMed]
  33. Peng, J.W.; Liu, H.; Hu, Y.; Sun, Y.; Liu, Q.; Li, J.G.; Dong, Y.H. Shift in soil bacterial communities from K- to r-strategists facilitates adaptation to grassland degradation. Land Degrad. Dev. 2022, 33, 2076–2091. [Google Scholar] [CrossRef]
  34. Sui, P.X.; Tian, P.; Wang, Z.Y.; Lian, H.L.; Yang, Y.D.; Ma, Z.Q.; Jiang, Y.; Zheng, J.Y.; Qi, H. Soil properties and microbial communities of spring maize filed in response to tillage with straw incorporation and nitrogen fertilization in northeast China. PeerJ 2022, 10, e13462. [Google Scholar] [CrossRef]
  35. Brévault, T.; Bikay, S.; Maldes, J.M.; Naudin, K. Impact of a no-till with mulch soil management strategy on soil macrofauna communities in a cotton cropping system. Soil Tillage Res. 2007, 97, 140–149. [Google Scholar] [CrossRef]
  36. Manetti, P.L.; López, A.N.; Clemente, N.L.; Faberi, A.J. Tillage system does not affect soil macrofauna in southeastern Buenos Aires province, Argentina. Span. J. Agric. Res. 2010, 8, 377–384. [Google Scholar] [CrossRef] [Green Version]
  37. Becraft, E.D.; Woyke, T.; Jarett, J.; Ivanova, N.; Godoy-Vitorino, F.; Poulton, N.; Brown, J.M.; Brown, J.; Lau, M.; Onstott, T. Rokubacteria: Genomic giants among the uncultured bacterial phyla. Front. Microbiol. 2017, 8, 2264. [Google Scholar] [CrossRef]
  38. Wortman, S.E.; Drijber, R.A.; Francis, C.A.; Lindquist, J.L. Arable weeds, cover crops, and tillage drive soil microbial community composition in organic cropping systems. Appl. Soil Ecol. 2013, 72, 232–241. [Google Scholar] [CrossRef]
  39. Liu, Y.; Chen, X.; Liu, J.; Liu, T.; Cheng, J.; Wei, G.; Lin, Y. Temporal and spatial succession and dynamics of soil fungal communities in restored grassland on the loess plateau in China. Land Degrad. Dev. 2019, 30, 1273–1287. [Google Scholar] [CrossRef]
  40. Del Campo, J.; Heger, T.J.; Rodríguez-Martínez, R.; Worden, A.Z.; Richards, T.A.; Massana, R.; Keeling, P.J. Assessing the diversity and distribution of apicomplexans in host and free-living environments using high-throughput amplicon data and a phylogenetically informed reference framework. Front. Microbiol. 2019, 10, 2373. [Google Scholar] [CrossRef] [PubMed]
  41. Zhao, J.; Ni, T.; Xun, W.; Huang, X.; Huang, Q.; Ran, W.; Shen, Q. Influence of straw incorporation with and without straw decomposer on soil bacterial community structure and function in a rice-wheat cropping system. Appl. Microbiol. Biotechnol. 2017, 101, 4761–4773. [Google Scholar] [CrossRef]
  42. Rutere, C.; Knoop, K.; Posselt, M.; Ho, A.; Horn, M.A. Ibuprofen Degradation and Associated Bacterial Communities in Hyporheic Zone Sediments. Microorganisms 2020, 8, 1245. [Google Scholar] [CrossRef]
  43. Fierer, N.; Bradford, M.A.; Jackson, R.B. Toward an ecological classification of soil bacteria. Ecology 2007, 88, 1354–1364. [Google Scholar] [CrossRef]
  44. Dong, W.; Hu, C.; Chen, S.; Zhang, Y. Tillage and residue management effects on soil carbon and CO2 emission in a wheat-corn double-cropping system. Nutr. Cycl. Agroecosyst. 2008, 83, 27–37. [Google Scholar] [CrossRef]
  45. Scheu, S.; Schaefer, M. Bottom–up control of the soil macro fauna community in a beech wood on limestone: Manipulation of food resources. Ecology 1998, 79, 1573–1585. [Google Scholar] [CrossRef]
  46. Wang, C.Y.; Yan, L.; Gao, Y.H.; Liang, A.Z.; Sui, B.; Zhao, L.P.; Liu, S.X. Long-term effects of tillage practices on soil bacterial community abundance and metabolic diversity of black soil from northeast China. Int. J. Agric. Biol. 2018, 20, 2753–2762. [Google Scholar]
  47. Li, Y.Z.; Song, D.P.; Liang, S.H.; Dang, P.F.; Qin, X.L.; Liao, Y.C.; Siddique, K.H.M. Effect of no-tillage on soil bacterial and fungal community diversity: A meta-analysis. Soil Tillage Res. 2020, 204, 104721. [Google Scholar] [CrossRef]
  48. Guan, Y.P.; Xu, B.; Zhang, X.M.; Yang, W. Tillage practices and residue management manipulate soil bacterial and fungal communities and networks in maize agroecosystems. Microorganisms 2022, 10, 1056. [Google Scholar] [CrossRef] [PubMed]
  49. Mougi, A.; Kondoh, M. Diversity of interaction types and ecological community stability. Science 2012, 337, 349–351. [Google Scholar] [CrossRef] [PubMed]
  50. Liu, Z.X.; Gu, H.D.; Liang, A.Z.; Li, L.J.; Yao, Q.; Xu, Y.X.; Liu, J.J.; Jin, J.; Liu, X.B.; Wang, G.H. Conservation tillage regulates the assembly, network structure and ecological function of the soil bacterial community in black soils. Plant Soil 2022, 472, 207–223. [Google Scholar] [CrossRef]
  51. Jia, L.J.; Wang, Z.; Ji, L.; De Neve, S.; Struik, P.C.; Yao, Y.Q.; Lv, J.J.; Zhou, T.; Jin, K. Keystone microbiome in the rhizosphere soil reveals the effect of long-term conservation tillage on crop growth in the Chinese Loess Plateau. Plant Soil 2022, 473, 457–472. [Google Scholar] [CrossRef]
  52. Hu, X.J.; Liu, J.J.; Liang, A.Z.; Li, L.J.; Yao, Q.; Yu, Z.H.; Li, Y.S.; Jin, J.; Liu, X.B.; Wang, G.H. Conventional and conservation tillage practices affect soil microbial co-occurrence patterns and are associated with crop yields. Agric. Ecosyst. Environ. 2021, 319, 107534. [Google Scholar] [CrossRef]
  53. Geisen, S.; Koller, R.; Hünninghaus, M.; Dumack, K.; Urich, T.; Bonkowski, M. The soil food web revisited: Diverse and widespread mycophagous soil protists. Soil Biol. Biochem. 2016, 94, 10–18. [Google Scholar] [CrossRef]
  54. Thakur, M.P.; Geisen, S. Trophic regulations of the soil microbiome. Trends Microbiol. 2019, 27, 771–780. [Google Scholar] [CrossRef] [PubMed]
  55. Anderson, C.; Beare, M.; Buckley, H.L.; Lear, G. Bacterial and fungal communities respond differently to varying tillage depth in agricultural soils. PeerJ 2017, 5, e3930. [Google Scholar] [CrossRef]
  56. Blankinship, J.C.; Fonte, S.J.; Six, J.; Schimel, J.P. Plant versus microbial controls on soil aggregate stability in a seasonally dry ecosystem. Geoderma 2016, 272, 39–50. [Google Scholar] [CrossRef]
  57. Frey, S.D.; Elliott, E.T.; Paustian, K. Bacterial and fungal abundance and biomass in conventional and no-tillage agroecosystems along two climatic gradients. Soil Biol. Biochem. 1999, 31, 573–585. [Google Scholar] [CrossRef]
  58. Zibilske, L.M.; Bradford, J.M.; Smart, J.R. Conservation tillage induced changes in organic carbon, total nitrogen and available phosphorus in a semi-arid alkaline subtropical soil. Soil Tillage Res. 2002, 66, 153–163. [Google Scholar] [CrossRef]
  59. Guo, J.H.; Liu, X.J.; Zhang, Y.; Shen, J.L.; Han, W.X.; Zhang, W.F.; Christie, P.; Goulding, K.W.T.; Vitousek, P.M.; Zhang, F.S. Significant acidification in major Chinese croplands. Science 2010, 327, 1008–1010. [Google Scholar] [CrossRef]
  60. Tisdall, J. How stubble affects organic matter, plants and animals in the soil. J. Dep. Agric. West. Aust. 1992, 33, 18–21. [Google Scholar]
  61. Wang, Z.T.; Li, T.; Li, Y.Z.; Zhao, D.Q.; Han, J.; Liu, Y.; Liao, Y.C. Relationship between the microbial community and catabolic diversity in response to conservation tillage. Soil Tillage Res. 2020, 196, 104431. [Google Scholar] [CrossRef]
  62. Corral-Fernández, R.; Parras-Alcántara, L.; Lozano-García, B. Stratification ratio of soil organic C, N and C:N in Mediterranean evergreen oak woodland with conventional and organic tillage. Agric. Ecosyst. Environ. 2013, 164, 252–259. [Google Scholar] [CrossRef]
  63. Moorhea, D.L.; Sinsabaugh, R.L. A theoretical model of litter decay and microbial interaction. Ecol. Monogr. 2006, 76, 151–174. [Google Scholar] [CrossRef]
  64. Liu, L.; Gundersen, P.; Zhang, T.; Mo, J.M. Effects of phosphorus addition on soil microbial biomass and community composition in three forest types in tropical China. Soil Biol. Biochem. 2012, 44, 31–38. [Google Scholar] [CrossRef]
  65. DeForest, J.L.; Scott, L.G. Available organic soil phosphorus has an important influence on microbial community composition. Soil Sci. Soc. Am. J. 2010, 74, 2059–2066. [Google Scholar] [CrossRef]
  66. Kou, X.C.; Su, T.Q.; Ma, N.N.; Li, Q.; Wang, P.; Wu, Z.F.; Liang, W.J.; Cheng, W.X. Soil micro-food web interactions and rhizosphere priming effect. Plant Soil 2018, 432, 129–142. [Google Scholar] [CrossRef]
  67. Chen, X.; Han, X.Z.; You, M.Y.; Yan, J.; Lu, X.C.; Horwath, W.R.; Zou, W.X. Soil macroaggregates and organic-matter content regulate microbial communities and enzymatic activity in a Chinese Mollisol. J. Integr. Agric. 2019, 18, 2605–2618. [Google Scholar] [CrossRef]
Figure 1. Soil microbial and faunal community structure under different tillage management treatments at two soil depths. The stacked bar graph represents the relative abundance of the major phylum. (A) Bacteria, (B) Fungi, (C) Protozoa, and (D) Metazoa. CT20, Rotary and ridge tillage at 0–20 cm depth; NT20, No-tillage at 0–20 cm depth; ST20, Subsoil tillage at 0–20 cm depth; MP20, Moldboard plowing tillage at 0–20 cm depth; CT40, Rotary and ridge tillage at 20–40 cm depth; NT40, No-tillage at 20–40 cm depth; ST40, Sub–soiling tillage at 20–40 cm depth; MP40, Moldboard plowing tillage at 20–40 cm depth. n = 24 (four treatments, three replications per treatment, and two soil depths).
Agronomy 12 02356 g001
Figure 2. Changes in soil microbial (bacteria and fungi) and faunal (protozoa and metazoa) gene abundance (gene copy numbers). (A) Bacteria, (B) Fungi, (C) Protozoa, and (D) Metazoa. CT20, Rotary and ridge tillage at 0–20 cm depth; NT20, No-tillage at 0–20 cm depth; ST20, Subsoil tillage at 0–20 cm depth; MP20, Moldboard plowing tillage at 0–20 cm depth; CT40, Rotary and ridge tillage at 20–40 cm depth; NT40, No-tillage at 20–40 cm depth; ST40, Subsoil tillage g tillage at 20–40 cm depth; MP40, Moldboard plowing tillage at 20–40 cm depth. Different lower-case letters represent significant differences at p < 0.05 among treatments at the same soil depth as determined by Duncan’s multiple range test. n = 24 (four treatments, three replications per treatment, and two soil depths).
Agronomy 12 02356 g002
Figure 3. Changes in soil microbial (bacteria and fungi) and faunal (protozoa and metazoa) alpha diversity (Shannon diversity index). (A) Bacteria, (B) Fungi, (C) Protozoa, and (D) Metazoa. CT20, Rotary and ridge tillage at 0–20 cm depth; NT20, No-tillage at 0–20 cm depth; ST20, Subsoil tillage at 0–20 cm depth; MP20, Moldboard plowing tillage at 0–20 cm depth; CT40, Rotary and ridge tillage at 20–40 cm depth; NT40, No-tillage at 20–40 cm depth; ST40, Subsoil tillage at 20–40 cm depth; MP40, Moldboard plowing tillage at 20–40 cm depth. Different lower-case letters represent significant differences at p < 0.05 among treatments at the same soil depth as determined by Duncan’s multiple range test. n = 24 (four treatments, three replications per treatment, and two soil depths).
Agronomy 12 02356 g003
Figure 4. Principal coordinate analysis (PCoA) of changes in soil microbial (bacteria and fungi) and faunal (protozoa and metazoan) beta diversity. (A) Bacteria, (B) Fungi, (C) Protozoa, and (D) Metazoa. CT20, Rotary and ridge tillage at 0–20 cm depth; NT20, No-tillage at 0–20 cm depth; ST20, Subsoil tillage at 0–20 cm depth; MP20, Moldboard plowing tillage at 0–20 cm depth; CT40, Rotary and ridge tillage at 20–40 cm depth; NT40, No-tillage at 20–40 cm depth; ST40, Subsoil tillage at 20–40 cm depth; MP40, Moldboard plowing tillage at 20–40 cm depth. n = 24 (four treatments, three replications per treatment, and two soil depths).
Agronomy 12 02356 g004
Figure 5. Network visualization of the interaction strengths within soil microbial and faunal community structure. CT, Rotary and ridge tillage; NT, No-tillage; ST, Subsoil tillage; MP, Moldboard plowing tillage. n = 24 (four treatments, three replications per treatment, and two soil depths).
Agronomy 12 02356 g005
Figure 6. Relationship of gene copy numbers (AC), Shannon diversity index (DF), and PCoA1 (GI) between bacteria, fungi, protozoa, and metazoa. FGCN: fungal gene copy numbers; PGCN: protozoan gene copy numbers; MGCN: metazoan gene copy numbers; FSDI: fungal Shannon diversity index; PSDI: protozoan Shannon diversity index; MSDI: metazoan Shannon diversity index; FPCoA1: fungal PCoA1; PPCoA1: protozoan PCoA1; MPCoA1: metazoan PCoA1. n = 24 (four treatments, three replications per treatment, and two soil depths).
Agronomy 12 02356 g006
Figure 7. Ordination plots of the results from the redundancy analysis (RDA) to identify the relationships between microbial (bacteria and fungi) and faunal (protozoa and metazoa) taxa (blue arrows) and soil properties (red arrows) at the phylum level. ‘(A)’: the relationship between soil bacterial taxa and soil properties; ‘(B)’: the relationship between soil fungal taxa and soil properties; ‘(C)’: the relationship between soil protozoan taxa and soil properties; ‘(D)’: the relationship between the metazoan taxa and soil properties. CT20: Rotary and ridge tillage at 0–20 cm depth; NT20: No-tillage at 0–20 cm depth; ST20: Subsoil tillage at 0–20 cm depth; MP20: Moldboard plowing tillage at 0–20 cm depth; CT40: Rotary and ridge tillage at 20–40 cm depth; NT40: No-tillage at 20–40 cm depth; ST40: Subsoil tillage at 20–40 cm depth; MP40: Moldboard plowing tillage at 20–40 cm depth. BD: soil bulk density; MWD: mean weight diameter of aggregate; SOC: soil organic carbon; TN: total nitrogen; TP: total phosphorus; AN: available nitrogen; AP: available phosphorus; pH: the potential of hydrogen. * p < 0.05; ** p < 0.01. n = 24 (four treatments, three replications per treatment, and two soil depths).
Agronomy 12 02356 g007
Figure 8. Path diagrams of the structural equation modeling (SEM) for the relationship of tillage and depth on soil microbial (bacteria and fungi) and faunal (protozoa and metazoa) abundance (gene copy numbers), diversity (Shannon diversity index) and composition (PCoA1). (A) Bacteria, (B) Fungi, (C) Protozoa, and (D) Metazoa. MWD: mean weight diameter of aggregate; SOC: soil organic carbon; TN: total nitrogen; TP: total phosphorus. Values above the line represent the path coefficients. Solid lines indicate positive path coefficients and dashed lines indicate negative path coefficients. The width of arrows indicates the strength of the standardized path coefficient (* p < 0.05; ** p < 0.01; *** p < 0.001). n = 24 (four treatments, three replications per treatment, and two soil depths).
Agronomy 12 02356 g008
Table 1. Soil physicochemical properties of 0–40 cm soil layer under different tillage practices.
Soil DepthSoil PropertiesCTNTSTMP
0–20 cmBD (g cm–3)1.36 ± 0.02 b1.43 ± 0.02 a1.30 ± 0.05 b1.32 ± 0.03 b
MWD (mm)0.98 ± 0.01 c1.19 ± 0.05 a1.17 ± 0.03 a1.06 ± 0.02 b
SOC (g kg–1)13.31 ± 0.44 d17.10 ± 0.35 a14.52 ± 0.32 c15.55 ± 0.11 b
TN (g kg–1)1.51 ± 0.02 b1.49 ± 0.03 b1.64 ± 0.09 a1.48 ± 0.01 b
TP (g kg–1)0.54 ± 0.01 b0.58 ± 0.01 a0.48 ± 0.01 c0.55 ± 0.01 b
AN (mg kg–1)135.62 ± 0.75 c141.23 ± 1.94 b158.70 ± 3.43 a135.09 ± 1.21 c
AP (mg kg–1)24.69 ± 0.54 c31.83 ± 1.35 a19.95 ± 0.63 d27.17 ± 1.74 b
pH5.48 ± 0.08 a5.45 ± 0.01 a5.15 ± 0.06 b5.48 ± 0.29 a
20–40 cmBD (g cm–3)1.56 ± 0.02 a1.55 ± 0.03 a1.44 ± 0.04 b1.43 ± 0.03 b
MWD (mm)1.01 ± 0.01 b1.04 ± 0.01 a1.05 ± 0.01 a1.06 ± 0.01 a
SOC (g kg–1)7.67 ± 0.33 c6.72 ± 0.20 d9.21 ± 0.45 b15.13 ± 0.40 a
TN (g kg–1)0.94 ± 0.03 c0.76 ± 0.02 d1.21 ± 0.02 a1.08 ± 0.03 b
TP (g kg–1)0.37 ± 0.02 b0.32 ± 0.02 c0.43 ± 0.02 a0.42 ± 0.01 a
AN (mg kg–1)83.19 ± 0.89 c64.62 ± 1.74 d106.67 ± 2.39 a99.74 ± 0.55 b
AP (mg kg–1)3.98 ± 0.17 c3.09 ± 0.18 d8.44 ± 0.23 a6.17 ± 0.17 b
pH5.96 ± 0.01 c6.31 ± 0.05 a5.67 ± 0.06 d6.13 ± 0.04 b
Note: BD, soil bulk density; MWD, mean weight diameter; SOC, soil organic carbon; TN, total nitrogen; TP, total phosphorus; AN, available nitrogen; AP, available phosphorus; pH, potential of hydrogen. CT, Rotary and ridge tillage; NT, No-tillage; ST, Subsoil tillage; MP, Moldboard plowing tillage. Different lower case letters represent significant differences at p < 0.05 among treatments at the same soil depth as determined by Duncan’s multiple range test. n = 24 (four treatments, three replications per treatment, and two soil depths).
Publisher’s Note: MDPI stays neutral with regard to jurisdictional claims in published maps and institutional affiliations.