Article

Cultivating Improved Varieties of Maize Does Not Guarantee Sufficient Dietary Provision of Fe and Zn in a Maize–Bean Intercropping System in Eastern Uganda: Evaluating Effects of Climate and Soil Types

by
Lazarus Pierentino Lugoi
,
Vegard Martinsen
and
Åsgeir Rossebø Almås
*
Faculty of Environmental Sciences and Natural Resource Management, Norwegian University of Life Sciences (NMBU), 1432 Ås, Norway
*
Author to whom correspondence should be addressed.
Agronomy 2022, 12(10), 2383; https://doi.org/10.3390/agronomy12102383
Submission received: 31 August 2022 / Revised: 26 September 2022 / Accepted: 27 September 2022 / Published: 1 October 2022
(This article belongs to the Section Soil and Plant Nutrition)

Abstract

:
Since hunger and malnutrition are affecting billions of people, the effect of cropping seasons, soil types and climatic conditions (temperature and precipitation) on yield, iron (Fe), zinc (Zn) and amino acids content in grains of hybrid maize (Zea mays), at smallholder farms in Eastern Uganda, was examined. Thirty-six (36) on-farm experiments under maize–bean intercropping with NPK fertilizer were established across three soil types (Petric Plinthosols, Lixic Ferralsols and Vertisols) and growing conditions (seasons, temperature and rainfall). We found significant differences in the grain yield between seasons, but not between soil types. Fe (mean of 22.48 mg/kg) in maize–grains significantly correlated with Zn (mean of 23.21 mg/kg), soil pH, soil organic matter and total nitrogen. Grain amino acid concentrations differed significantly between the seasons and across soil types. Precipitation and temperature did not significantly influence grain-yield nor grain Fe and Zn contents. For two seasons, the hybrid maize variety did not perform better than other varieties in the regions. Thus, a critical finding is that improved varieties of maize is not enough to facilitate increased Fe and Zn uptake nor amino acids content in their grains to desired levels. Hence, a diet dominated by maize will not supply sufficient micronutrients (Fe and Zn) to meet the human dietary requirements in this region.

1. Introduction

Cereals are staple crops that provide calories and micronutrients to billions of people worldwide [1,2]. Although sufficient in calories, plausible evidence demonstrated that cereals are inherently low in multiple nutrients, especially micronutrients such as iron (Fe) and zinc (Zn) [3,4] and essential amino acids including lysine, tryptophan and methionine [5,6] in their grains. Sole or high dependence on cereals such as maize is associated with malnutrition, as they provide inadequate micronutrients to meet human dietary-nutrients for healthy living [3,7,8]. The resulting malnutrition, coupled with the low crop productivity common in smallholders’ rain-fed farming systems, widespread in regions such as Sub-Saharan Africa (SSA), make the regions probable hotspots of hunger and malnutrition. The malnutrition is associated with deficiency of micronutrients in consumable produce.
Micronutrients, in particular Fe and Zn, play crucial roles in the bio-functioning of enzymes and proteins involved in many metabolic processes in plants and humans [9,10]. Their deficiencies could lead to abnormal metabolism in the organisms with further undesirable consequences. Ref. [11] estimated that 800 million people are calorie deficient, while WHO figures for 2016 demonstrated that about 2 billion people suffer from multiple micronutrient deficiencies. Exposure of such a high population to the deficiencies has several societal and economic implications [4,12]. For instance, deficiencies of Fe, Zn and vitamin A are reported to be responsible for the high mortality rate of children under five years, their low cognitive development and reduced adults per capita labor productivity [4,13]. The severity of the problem is higher in developing regions, in particular, SSA [11,14], where cereals make up the bulk (about 65%) of food.
The prevalence of malnutrition is blamed on the emphases of production technologies on increasing yields, with no consideration of aspects of produce quality [13,15]. Thus, identifying effective ways and sites to increase both yield and quality attributes such as Fe and Zn contents and essential amino acids in grains of staple cereals is necessary to address hunger and micronutrient malnutrition. Approaches such as mineral fertilization, breeding [3,16], food supplementation and fortification were suggested to enrich consumable food with micronutrients. Food supplementation and fortification approaches [17,18,19] were considered ineffective, due to their high cost and outputs not reaching targeted rural population [4]. Refs. [1,20] suggest agronomic-based biofortification as the sustainable strategy. Adopting this approach, [21] state that the application of Zn-enriched fertilizers improves grain-yield and increases Zn in edible grains. The combined application of organic residues and Zn-fertilizer [22,23] significantly increased both yield and Zn concentration in maize grains on nutrient poor soils. Ref. [24] reported a significant increase in yield, Fe and Zn concentrations and protein content in wheat grains when fertilized with varied rates of N-fertilizer, in addition to soil and foliar application of Fe and Zn fertilizers. Ref. [14] suggest a combined fertilizer-application and improved crop varieties, as an effective agronomic approach to realize increased yield and micronutrients in cereal-grains. However, adoption of fertilizer application as a biofortification strategy by smallholders’ farmers in SSA is constrained by the high cost and sometimes unavailability of fertilizers. Ref. [20] suggest an intercropping system as a better and sustainable biofortification strategy.
Cereal-legume intercropping system is a widespread agronomic strategy to increase crop productivity and reduce the risks of crops’ failure [25]. Further, [20] reported that intercropping can increase Fe and Zn contents in seeds. They attributed this to the interspecific root-interaction of component crops, where the rhizospheric expressions of both strategies I and II to enhance the acquisition of soil Fe and Zn [26] occur under micronutrient deficiency. Moreover, legumes in the intercrop can lower soil pH [27] that can promote the availability of micronutrients for uptake by component crops. However, the nutrients’ status of maize–grains, especially micronutrients under intercropping, is rarely assessed as a biofortification strategy [20], in pursue of human nutritional health. How intercropping mechanisms benefit improved maize varieties in different agro-climatic environments needs further analysis. Most analyses, so far, of cereal-legume intercropping focused on or reported the benefits of intercropping on grain legume, see, for example, [20].
The effectiveness of intercropping as a biofortification strategy depends on the proper understanding of the regulating environment [3,28], especially soils and climate. Most soils worldwide are deficient in micronutrients hence, of low productivity, with crop produce low in micronutrients. Thus, knowledge of the association between micronutrient content in soils and their respective concentrations in edible parts (maize–grains) is crucial [29]. However, the role and effect of these environmental attributes is not adequately analyzed in many of these hunger- and malnutrition-affected countries, such as Uganda. Studies on how the interactive effect of soil and climatic conditions and improved crop varieties simultaneously determine the increased yield and micronutrient density in maize–grains under the intercropping system, according to our knowledge, has not been conducted in the Kyoga basin of Uganda. Such knowledge is needed to identify suitable environments and selection of area-specific strategies to address simultaneously increased yield and micro-nutrients density [30] in maize–grains. In addition, our understanding of this issue will help us design a potential adaptation strategy to projected and anticipated climate change impacts on agroecosystems. The main objective of this study was to assess environmental implications on maize–grain yield, concentration of Fe and Zn and some essential amino acids in maize–grains under the maize–bean intercropping system of Eastern Uganda. The specific objectives were to:
i.
Assess the effect of soil types, climate variables and seasons on yield and nutrient (Fe, Zn, starch and essential amino acids) quantities in maize–grains.
ii.
Identify sites where the intercropping system leads to an increase in grain-yield, Fe and Zn concentrations and amino acids’ content across the Kyoga basin.

2. Methods and Materials

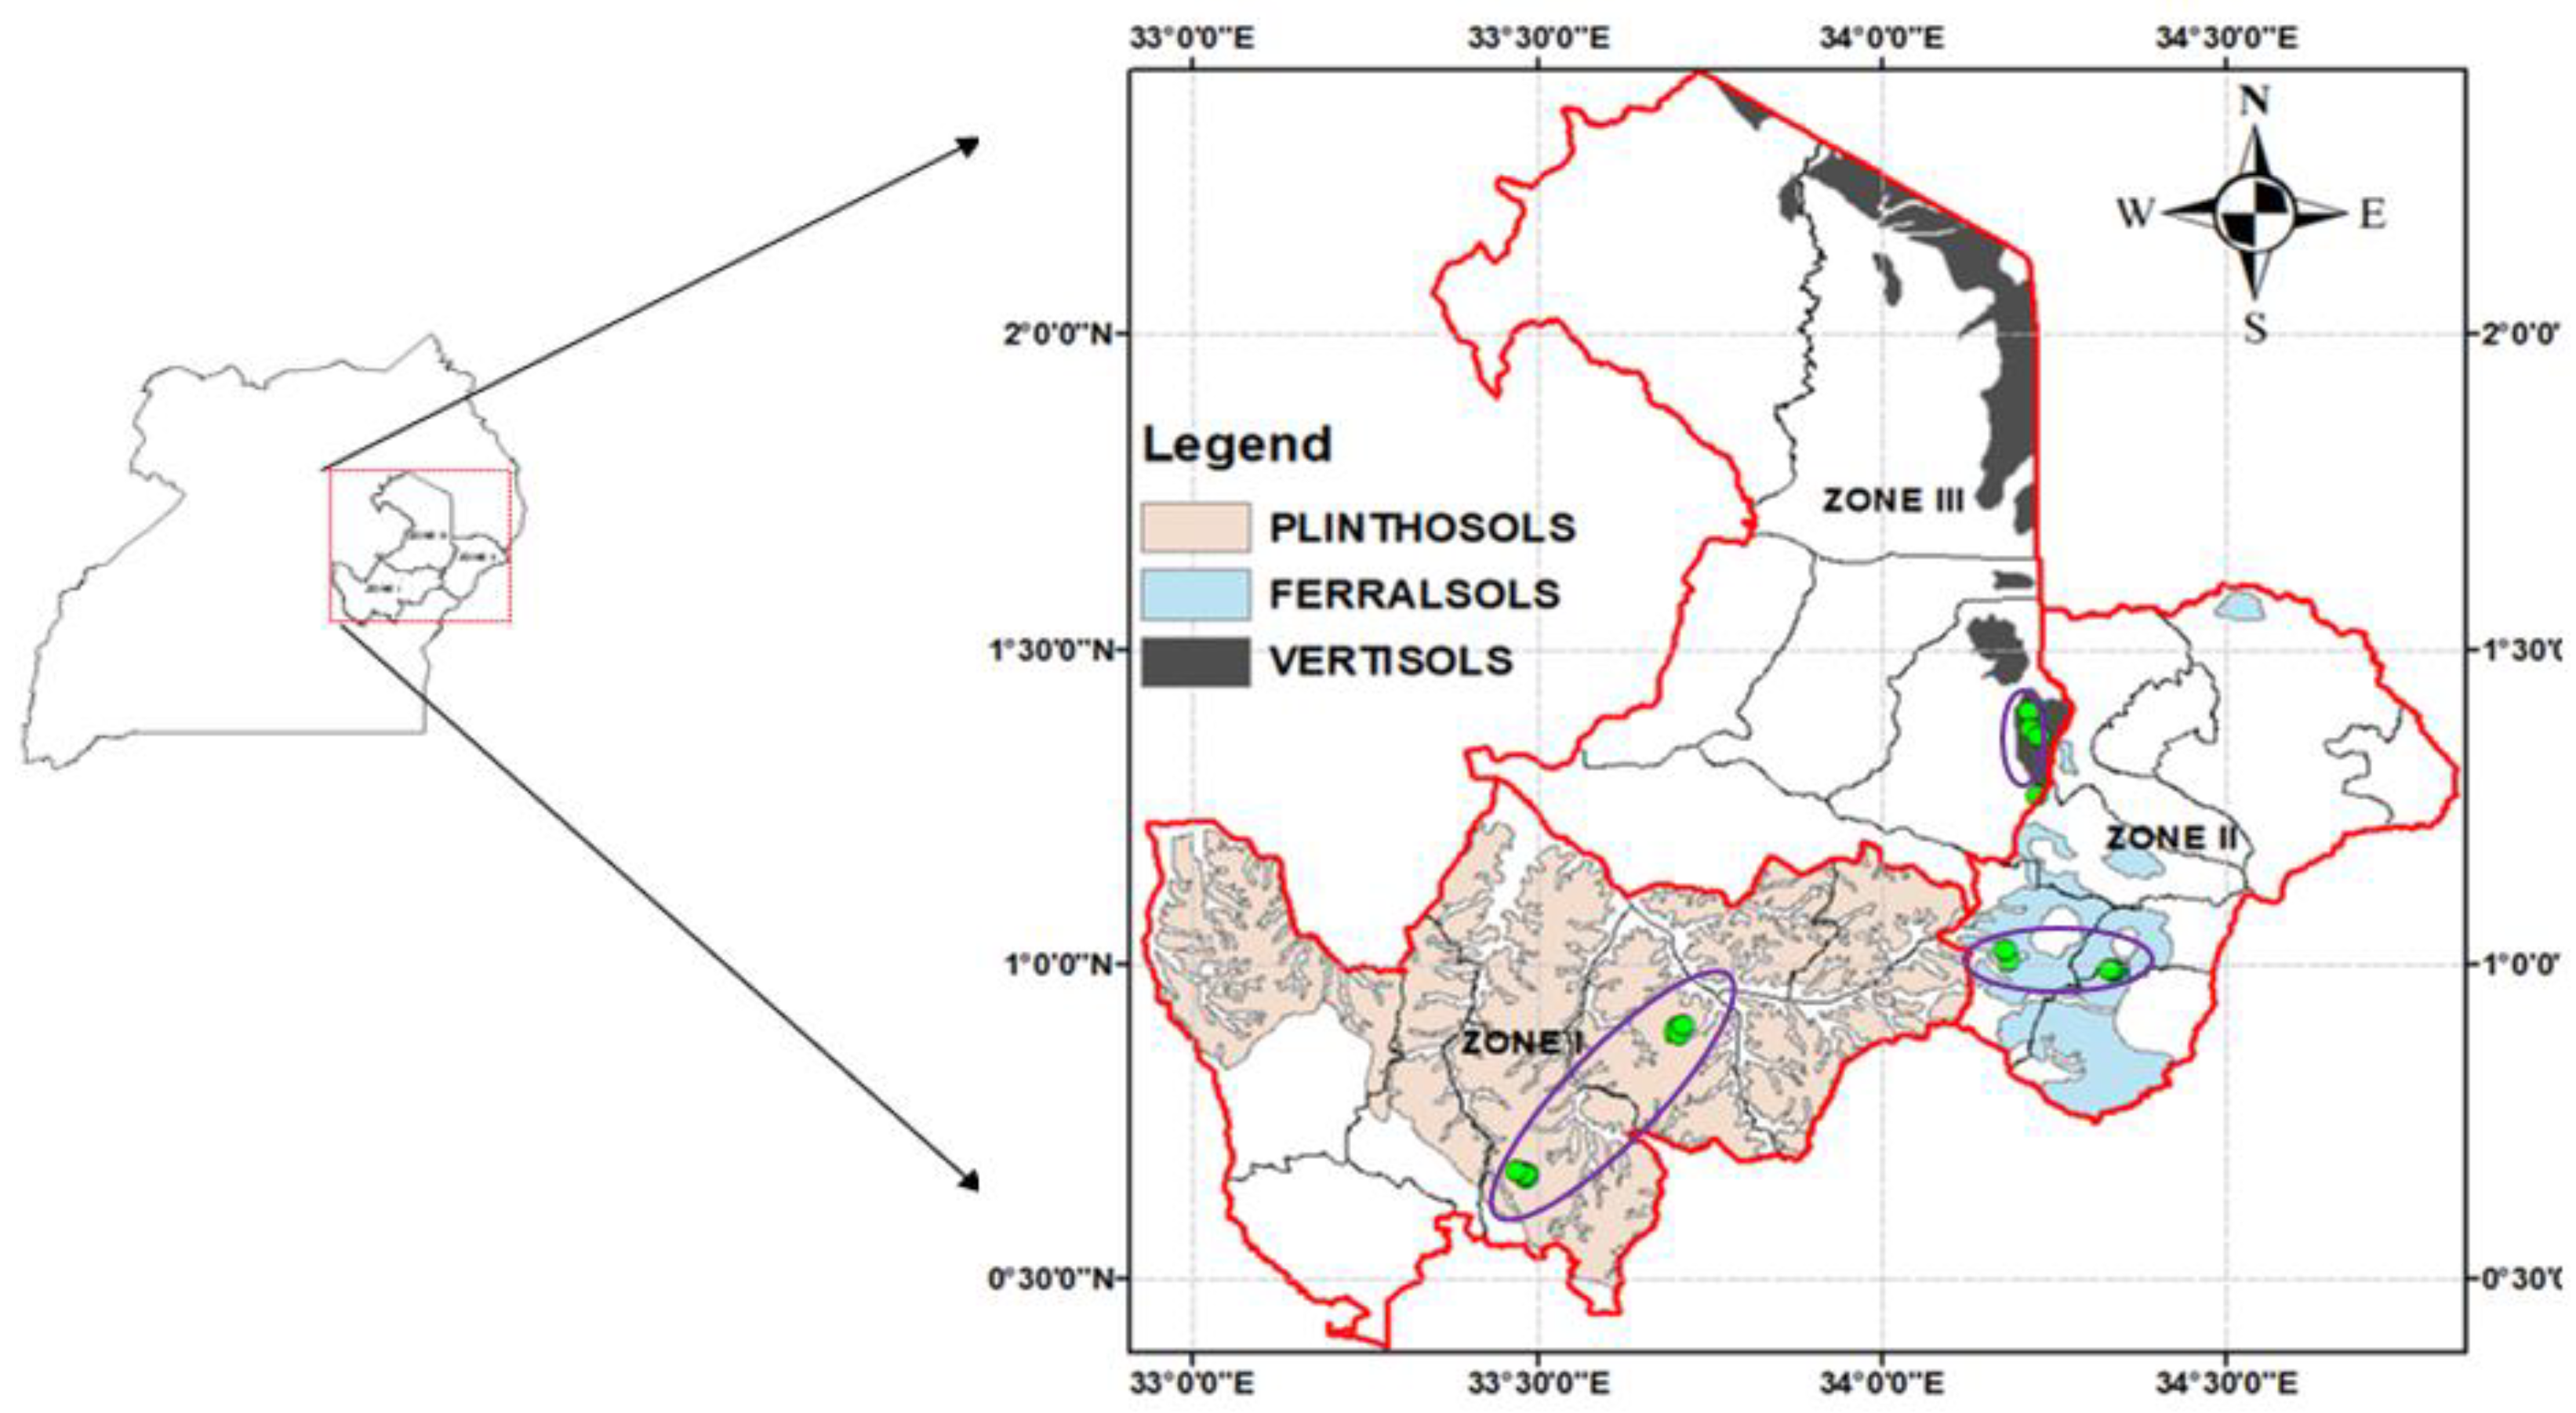
2.1. Study Area and Experimental Setup

Thirty-six on-farm experiments were established across three zones (I, II and III, Figure 1) with different climatic conditions in the Lake Kyoga basin in Eastern Uganda. These zones vary not only climatically, but also in their topography [31] and soil types as well, and are parts of the well-defined agro-ecological zones of Uganda [32]. Twelve on-farm field experiments (plots) were laid out in each of the three zones. The trial plots were on Petric Plinthosols, Lixic Ferralsols and Vertisols [33], in zones I, II and III, respectively.
In all of the 36 locations (12 × 3), each trial was on a farmer’s plot of 20 m × 30 m for two growing seasons of 2016 and 2017, during the long-rain season: March–April–May (MAM). In each of the zones, the cereal–legume intercropping system dominates, with maize as the main cereal component. Improved, high-yielding hybrid maize (Zea mays, Longe 10H) was intercropped with improved beans (Phaseolus vulgaris, K-132) as test crops in all the 36 trials. The National Agricultural and Crop Resources Research Institute [34] released these improved varieties. During sowing in both 2016 and 2017, three maize seeds were sown in holes at 90 cm spacing between plants within maize row, with 30 cm spacing between rows, but thinned to two plants after emergence. Beans were sown at the same time, between the maize rows. A single dose of compound NPK (17:17:17) fertilizer was applied only on maize at a rate of 50 kg/ha during sowing to supplement the biological nitrogen fixation (BNF) by beans. The fertilizer was placed in holes, covered with little soil, then maize–seeds were placed and finally covered. Weeding and pest control was carried out manually. Three weedings were implemented in the second season. The crops were harvested at physiological maturity. The maize–grain yield in each plot was calculated as an average of randomly selected four quadrants, each one a square meter from the inner rows. Harvested cobs were dried and hand-shelled prior to determining the grain weight based on a 13% moisture content. One random subsample of grains from each of the 36 plots was used for the analyses of nutrient contents.

2.2. Soil Characteristics

Before planting in each season, soil samples were collected from each plot at a 0–15 cm depth. Each plot was randomly sampled in triplicates, where each triplicate was made of nine sub-samples. Soil samples were air-dried and sieved through 2 mm mesh sieve prior to analyses. Soil pH was determined in soil to a water solution 1:2.5 with a digital pH meter. Soil organic carbon (SOC) content was determined using the Walkley-Black method (wet oxidation) [35] and converted to SOM using the factor 1.724. Total soil N was determined following the Kjeldahl method [36]. The plant available P (Pav) was estimated spectrophotometrically at a 882 nm wavelength from Mehlich 1 (0.05 mol L−1 HCl + 0.0125 mol L−1 H2SO4; pH 1.2) extracts (1:10; solid to solution ratio) [37]. Plant available K (Kav) and Fe (Feav) was estimated from the same Mehlich 1 extracts, using a flame photometer and atomic absorption spectrophotometer, respectively. For each analysis, an internal laboratory reference sample and blanks were repeatedly included for quality control.
Total Fe and Zn in soils from all plots were determined by an Inductively Coupled Plasma-Optical Emission Spectrometry (ICP-OES, SDVD, AGILENT), after decomposing 0.25 g of finely ground soil in 5 mL concentrated ultra-pure HNO3 in an ultra-CLAVE (MILS. MILESTONE) at 260 °C and 18 mbar for 1 h.

2.3. Weather Data

We obtained weather data from General Circulation Model (GCMs) simulations for 2016 and 2017, which were dynamically downscaled at 50 km spatial resolution using RCA4 (SMHI). The data was downloaded from the Earth System Grid Federation (ESGF) https://esg-dn1.nsc.liu.se/projects/esgf-liu/ accessed on 11 December 2017. We selected monthly maximum, minimum and average temperatures and interpolated them to fine resolution of 1 km × 1 km. We used the variables at the 1 km × 1 km resolution to characterize temperature conditions during the experimental periods. Precipitation data at 4 km resolution were from TAMSAT (ARC.v2) data archive, University of Reading, UK; URL (https://www.tamsat.org.uk/data/rfe/index.cgi) accessed on 11 December 2017. Thereafter, we resampled the data as well to 1 km × 1 km using bilinear interpolation.

2.4. Crop Parameters

Maize–grain yield, grain Fe and Zn concentrations, starch, crude protein (CP), amino acids and total protein (TP, computed as the sum of the individual amino acids), were determined as quality parameters of maize–grains. Crude protein was estimated by multiplying the Kjeldahl extracted N by 6.25 [38]. Total starch was determined by the “Total Starch Assay” method (AACC-method 76-13-01). Briefly, 100 mg of the milled maize–grain subsample was wetted with 0.2 mL ethanol (80% v/v). A total of 3 mL α-amylase was added to digest the sample, and the content was incubated in boiling water for 6 min. The final supernatant, obtained after the addition of 4 mL sodium acetate buffer and 0.1 mL amyloglukosidase, was analyzed in a MaxMat Spectrophotometer (MaxMat PL II Multi-analyzer, France). Amino acids were determined following the European Union protocol EC No 152/2009 (EC No 152/2009). Samples (fine grain–flour) were oxidized and hydrolyzed, and amino acids were estimated from aliquot using an Amino Acids Analyzer (Biochrom 30+, UK).
Iron and Zn concentration in maize–grains were determined using the ICP-OES, after decomposing 0.2–0.3 g of the maize–grain flour mixed with 5 mL of concentrated HNO3 and 2 mL ultrapure water in the ultra-CLAVE. The uptake of Fe and Zn was later calculated by correcting for the maize–grain yields.

2.5. Statistical Analyses

The differences in maize–grain yields and the nutritional attributes between the trial seasons (two levels) and between the soil types (three levels) were analyzed using two-way ANOVA. Pearson moment correlation analysis was used to examine the associations of the plant parameters with soil and climatic parameters. Multiple Linear regression was used to assess relationships between grain-yield, soil and plant variables. Soil pH, SOM, available P (Pav), K (Kav) and Fe (Fav) as well as maize–grain Fe and Zn concentrations were log-transformed to avoid violations of model assumptions. Prior to fitting the final model, the predictors were screened for multi-collinearity. Due to potential confounding effects of soil types (zones) and climate, correlations and linear regression for the plant parameters and climatic attributes were assessed for each of the soil types separately. We implemented the analyses in R, version R 3.4.4; Vienna, Austria [39] Environment.

3. Results

3.1. Characterization of Soil and Climate Conditions of Kyoga Basin

3.1.1. Soil Conditions

Table 1 summarizes the statistics of selected edaphic parameters across the soil types in the study area. All soil attributes (Table 1) differ significantly (p-value < 0.05) between the soil types.
Soil pH in the trial sites on Plinthosols and Vertisols were significantly higher than on Ferralsols (Table 1). Soil organic matter (SOM) content was below the critical 3.0% level in trials on Plinthosols and Vertisols but just above the 3.0% for productive soils in Uganda [40] in those on Ferralsols.
Both SOM and total N were significantly higher in Ferralsols than in Plinthosols and Vertisols (p-value < 0.05). The available P (Pav) was above the 10 mg/kg (Mehlich-1 extractable) threshold level [40] in Ferralsols and Vertisols and differed significantly (p = 0.03) between soil types. Available Fe (Feav) was significantly (p = 0.002) higher in Plinthosols than in Ferralsols and Vertisols, with the concentrations of Feav ranging from 89.35–141.12 mg/kg with a mean of 115.45 ± 4.54 mg/kg in the Plinthosols, 79.05–132.54 mg/kg with a mean of 102.69 ± 5.9 mg/kg in Ferralsols and 56.38–68.3 with a mean 68.3 ± 2.33 mg/kg in Vertisols. Thus, with most experimental plots, and with SOM and Tot-N below the critical levels [40], this suggests that the soil fertility problem is prevalent in the study area, as SOM and N are among essential macronutrients in defining the soil fertility.

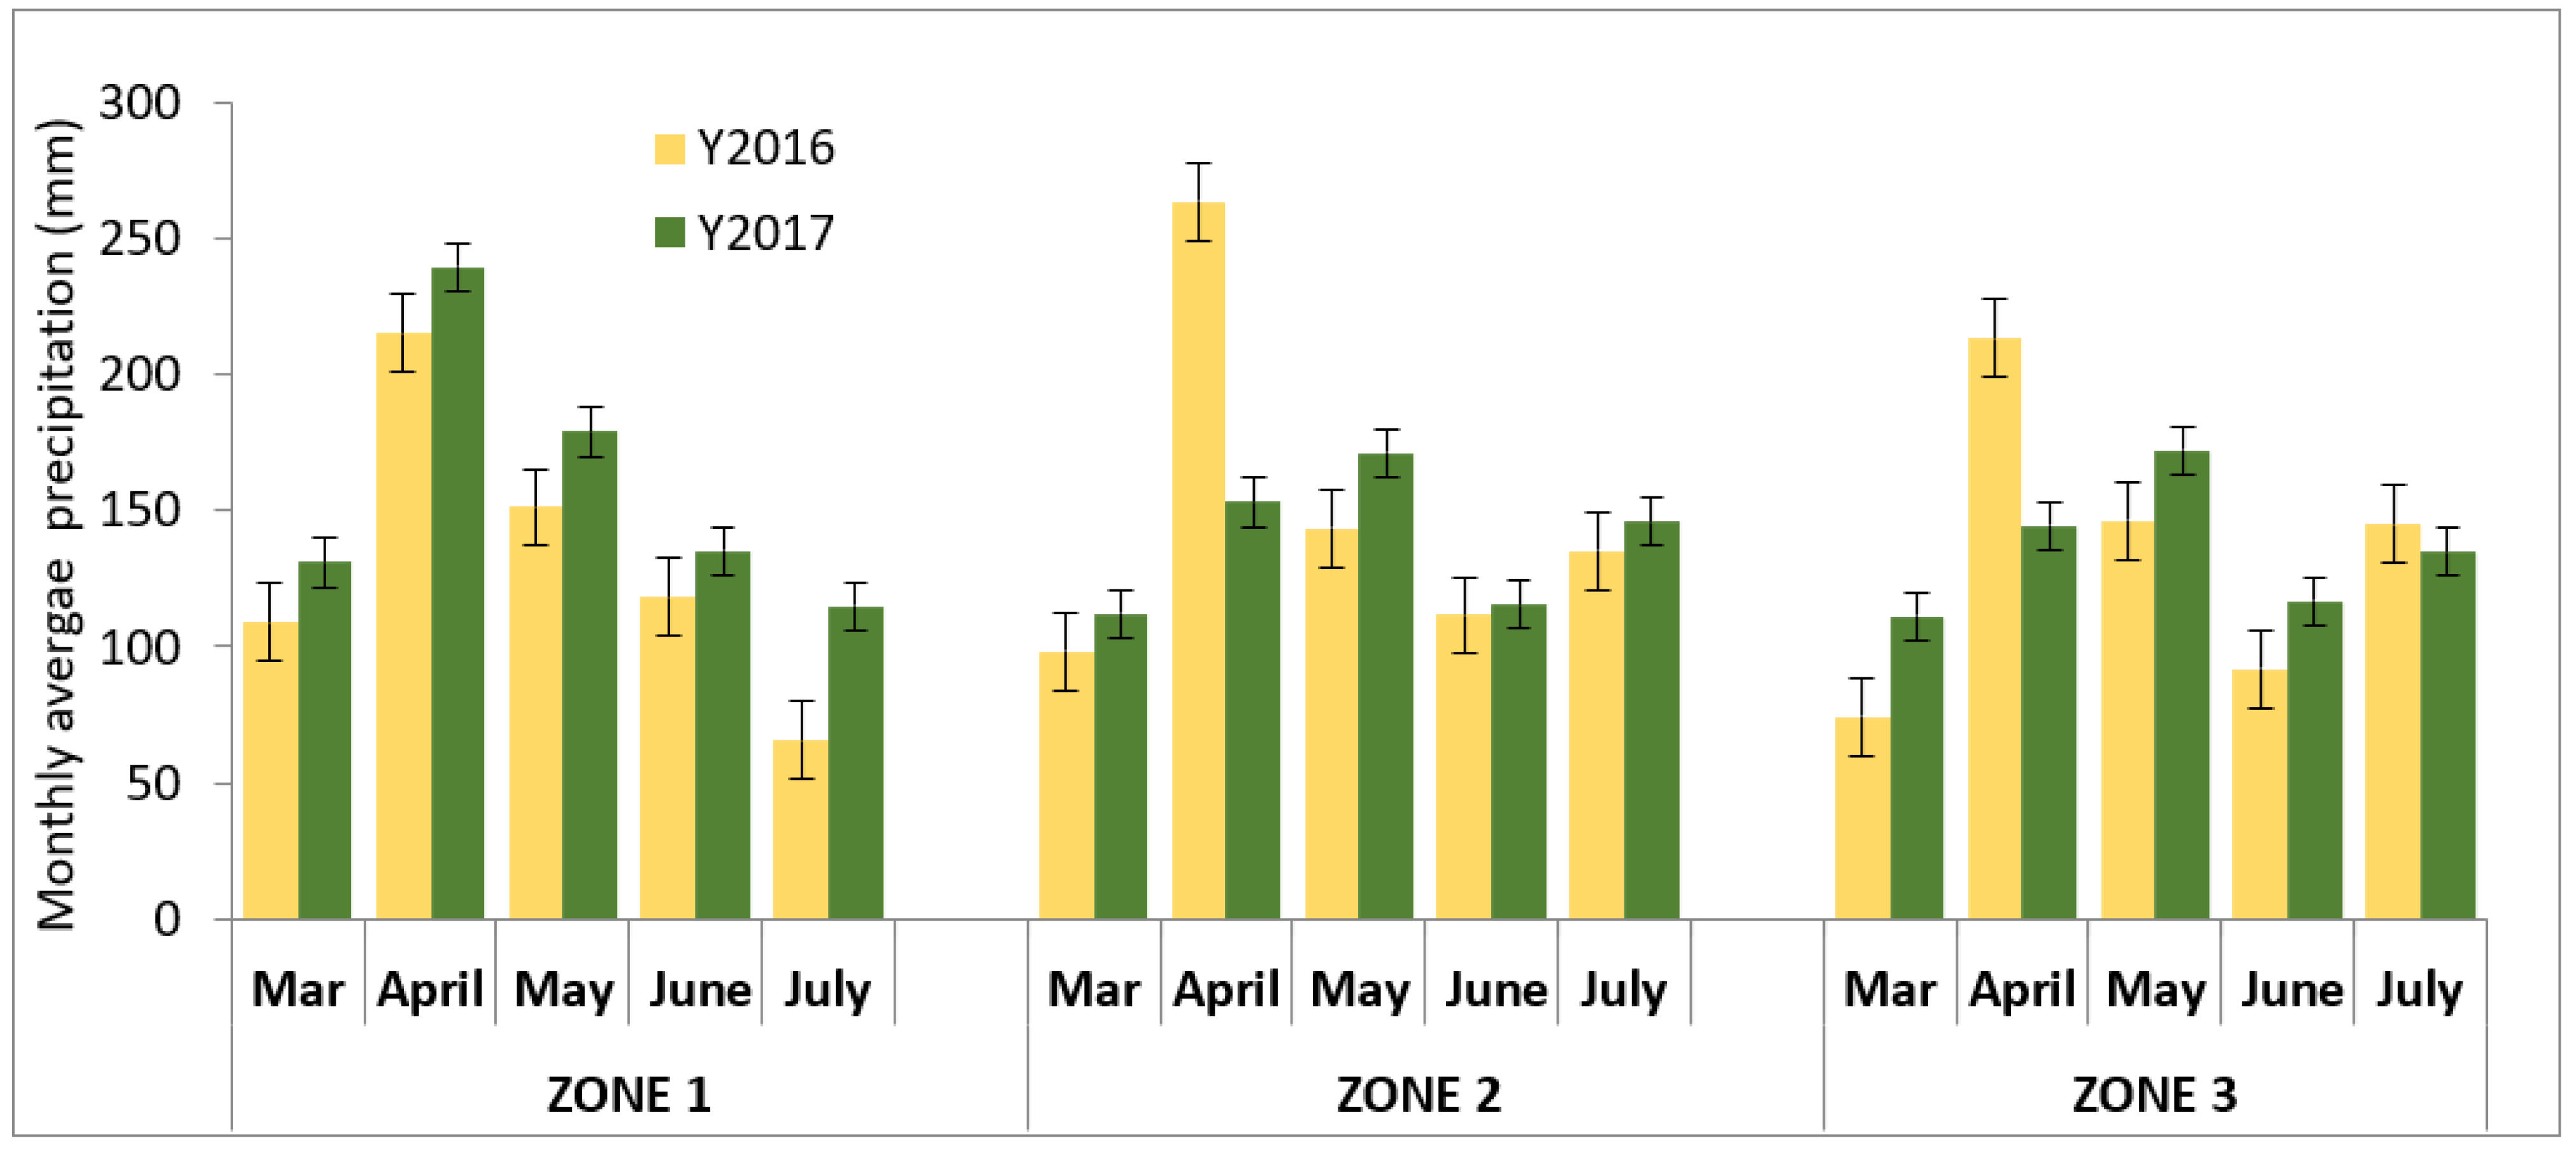
3.1.2. Climatic Conditions

Across the zones, the precipitation was higher during the long-rain season (MAM) in 2017 than in 2016 (Figure 2) whereas the maximum and minimum temperatures only vary slightly between 2016 and 2017 (Figure 3).
During the seasons, the average of the precipitation, maximum and minimum temperatures were 651 mm, 29.7 °C and 17.6 °C, for zone 1 (Plinthosols); 670 mm, 26.9 °C and 16.7 °C for zone 2 (Ferralsols) and 578 mm, 28.1 °C and 17.2 °C for zone 3 (Vertisols), respectively. These climatic estimates were above the average (560 mm) for precipitation (March–April–May) but within the maximum (28 °C) and minimum (17 °C) temperature ranges for Eastern Lake Kyoga basin, as reported by [32].

3.2. Maize Grain Yield

The average grain-yield for the experimental seasons (Figure 4a) was significantly (p < 0.0001) higher in the second (2.89 t/ha ±0.17 t/ha) than in the first (1.2 t/ha ± 0.12 t/ha) season. Across the soil types, (Figure 4 b) the highest grain yield was recorded in plots underlain with Vertisols (2.69 t/ha ± 0.02 t/ha) and lowest (1.17 t/ha ± 0.01 t/ha) in those with Plinthosols. However, this grain-yield difference was not statistically significant (p > 0.05) between the soil types. Moreover, the grain yields were not correlated with neither the investigated climatic variables nor soil attributes.
The average maize–grain yield (2.01 t/ha ± 0.15 t/ha) obtained from all the plots during the two seasons was, however, lower than the variety of the expected attainable yield (3.0 - 3.5 t/ha) under optimal environmental and management conditions for different agro-ecological zones of Uganda [34].

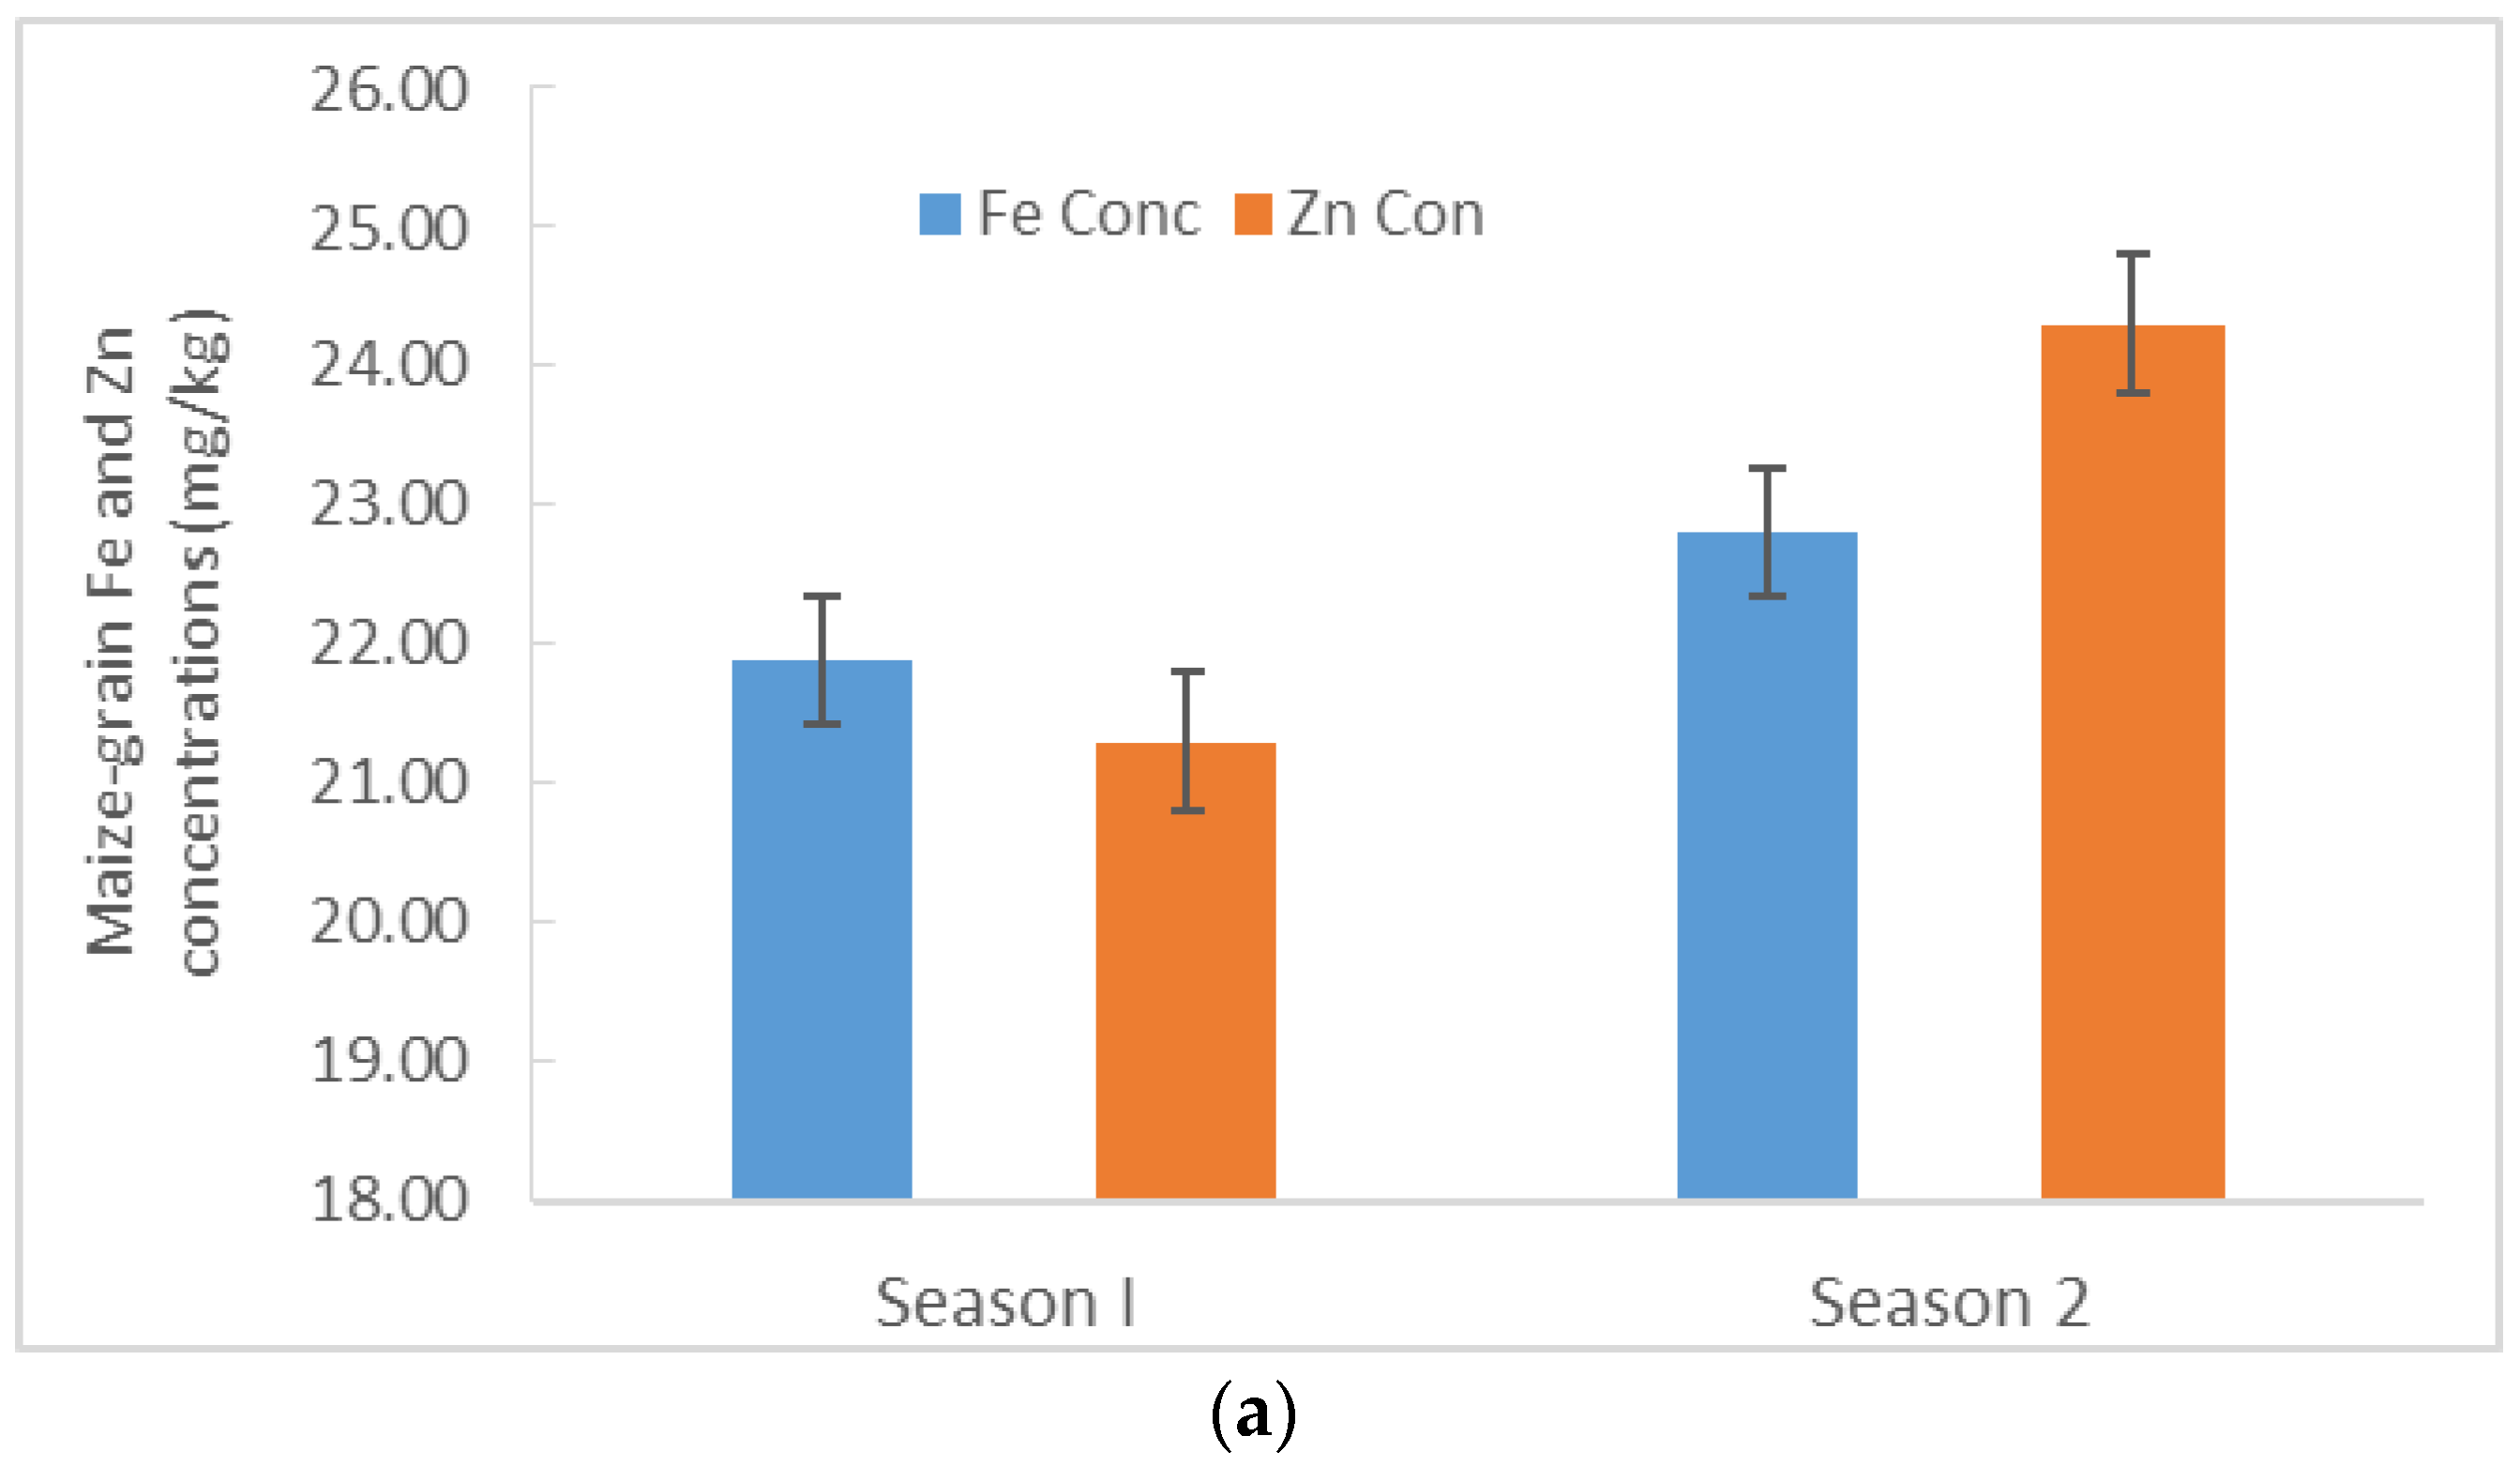
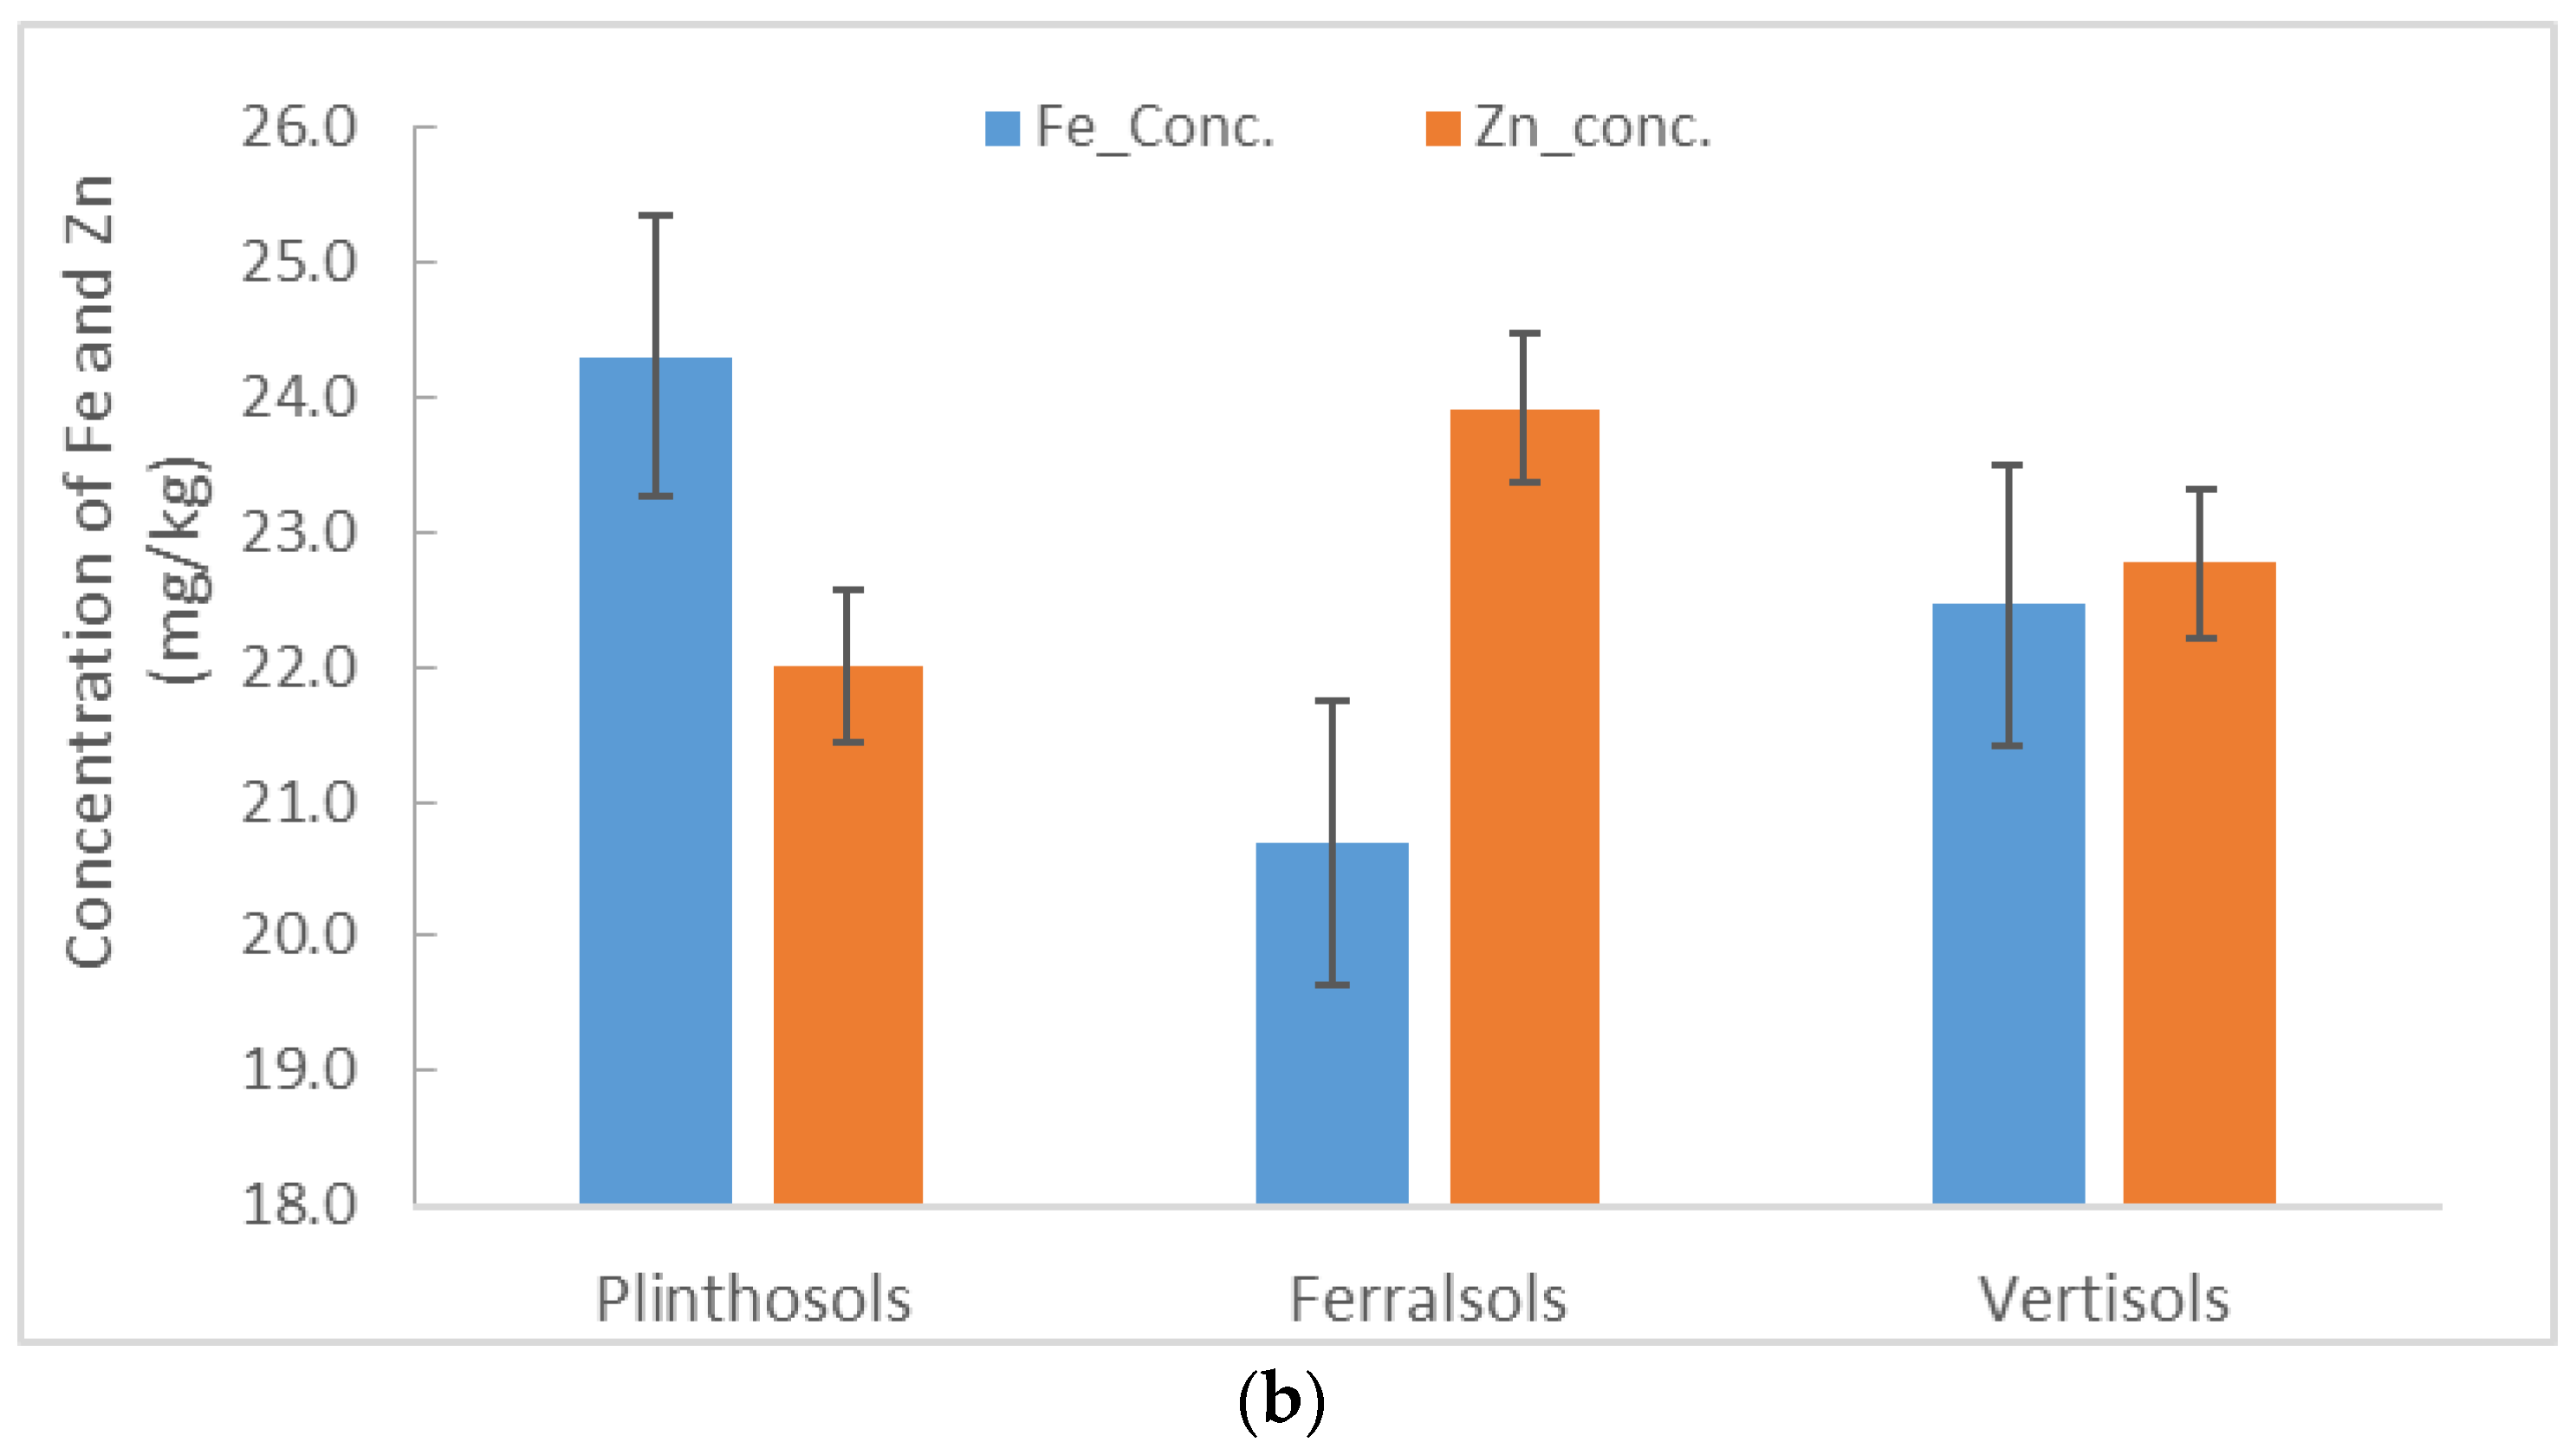
3.3. Maize–Grain Iron (Fe) and Zinc (Zn) Concentrations

For the experimented seasons, maize–grain Fe concentrations ranged from 12 mg/kg to 45 mg/kg with a mean of 22.48 mg/kg ± 0.7 mg/kg. Across the soil types (Figure 5b), the grain Fe concentrations were highest in plots on Plinthosols (24.3 mg/kg ± 1.4 mg/kg) and lowest in those plots on Ferralsols (20.7 mg/kg ± 1.04 mg/kg). Despite these recorded differences in grain Fe concentration between seasons and soil types, they were not significant.
Maize–grain Zn concentrations ranging from 17 mg/kg to 29 mg/kg with a mean of 23.21 mg/kg ± 0.4 mg/kg across the seasons was significantly (p < 0.01) higher in season two than in season one (Figure 5a). For each soil type, the grain Zn concentrations were highest in plots on Ferralsols (23.9 ± 0.57 mg/kg) and lowest in Plinthosols plots (22.0 ± 0.6 mg/kg) (Figure 5b) but the differences between soil types were not significant.
Maize–grain Fe concentration significantly correlated with soil pH (r = 0.41, p = < 0.05), whereas grain Zn concentration significantly correlated with SOM (r = 0.40, p = 0.04) and TotN (r = 0.41, p = 0.03).
Table 2 summarizes the maize–grains’ Fe and Zn concentrations, and their respective uptakes across soil types. Maize–grain Fe and grain Zn uptakes differed significantly (p < 0.01 and p < 0.01, respectively) between the seasons but not between the soil types (p = 0.19 and p = 0.14, respectively). Moreover, Fe uptake was correlated (r = 0.85, p = 0.0001) with Zn uptake, but maize–grain Fe concentrations were not correlated (p = 0.68) with grain Zn concentration. This suggests that the significant difference of Fe and Zn uptakes between the seasons and the significant correlation of the uptakes were due to the influence of maize–grain yield (Figure 3).
In addition, maize–grain Fe concentration was not correlated (r = 0.04, p = 0.77) with grain yield, whereas maize–grain Zn concentration was significantly correlated with the grain yield (r = 0.33, p = 0.014). However, neither maize–grain Fe and Zn concentrations nor their respective uptakes were correlated with the climatic attributes.

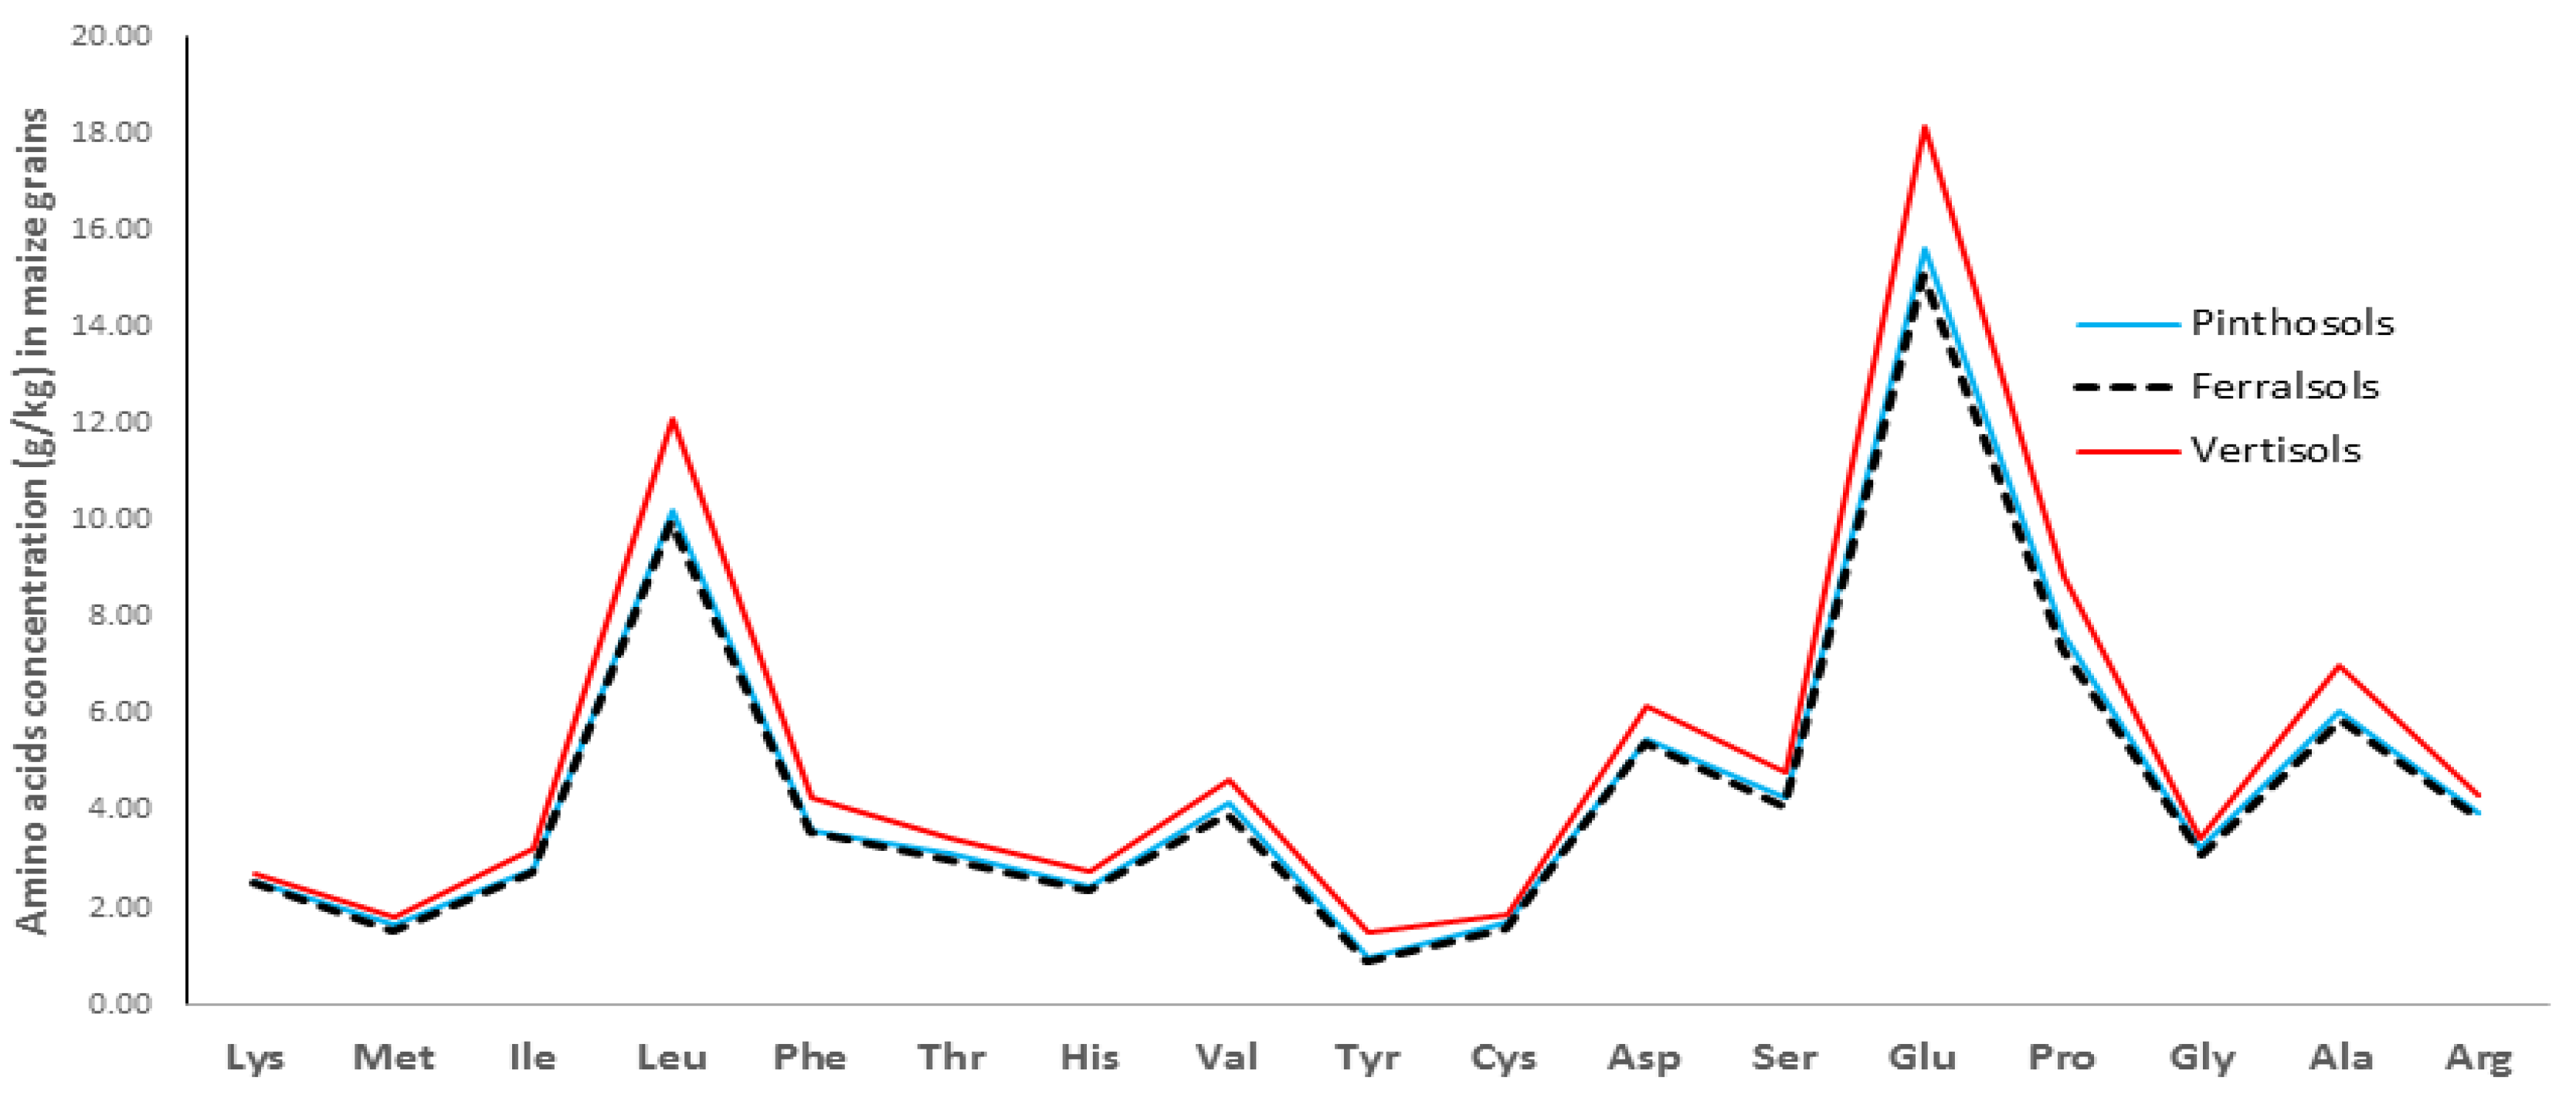
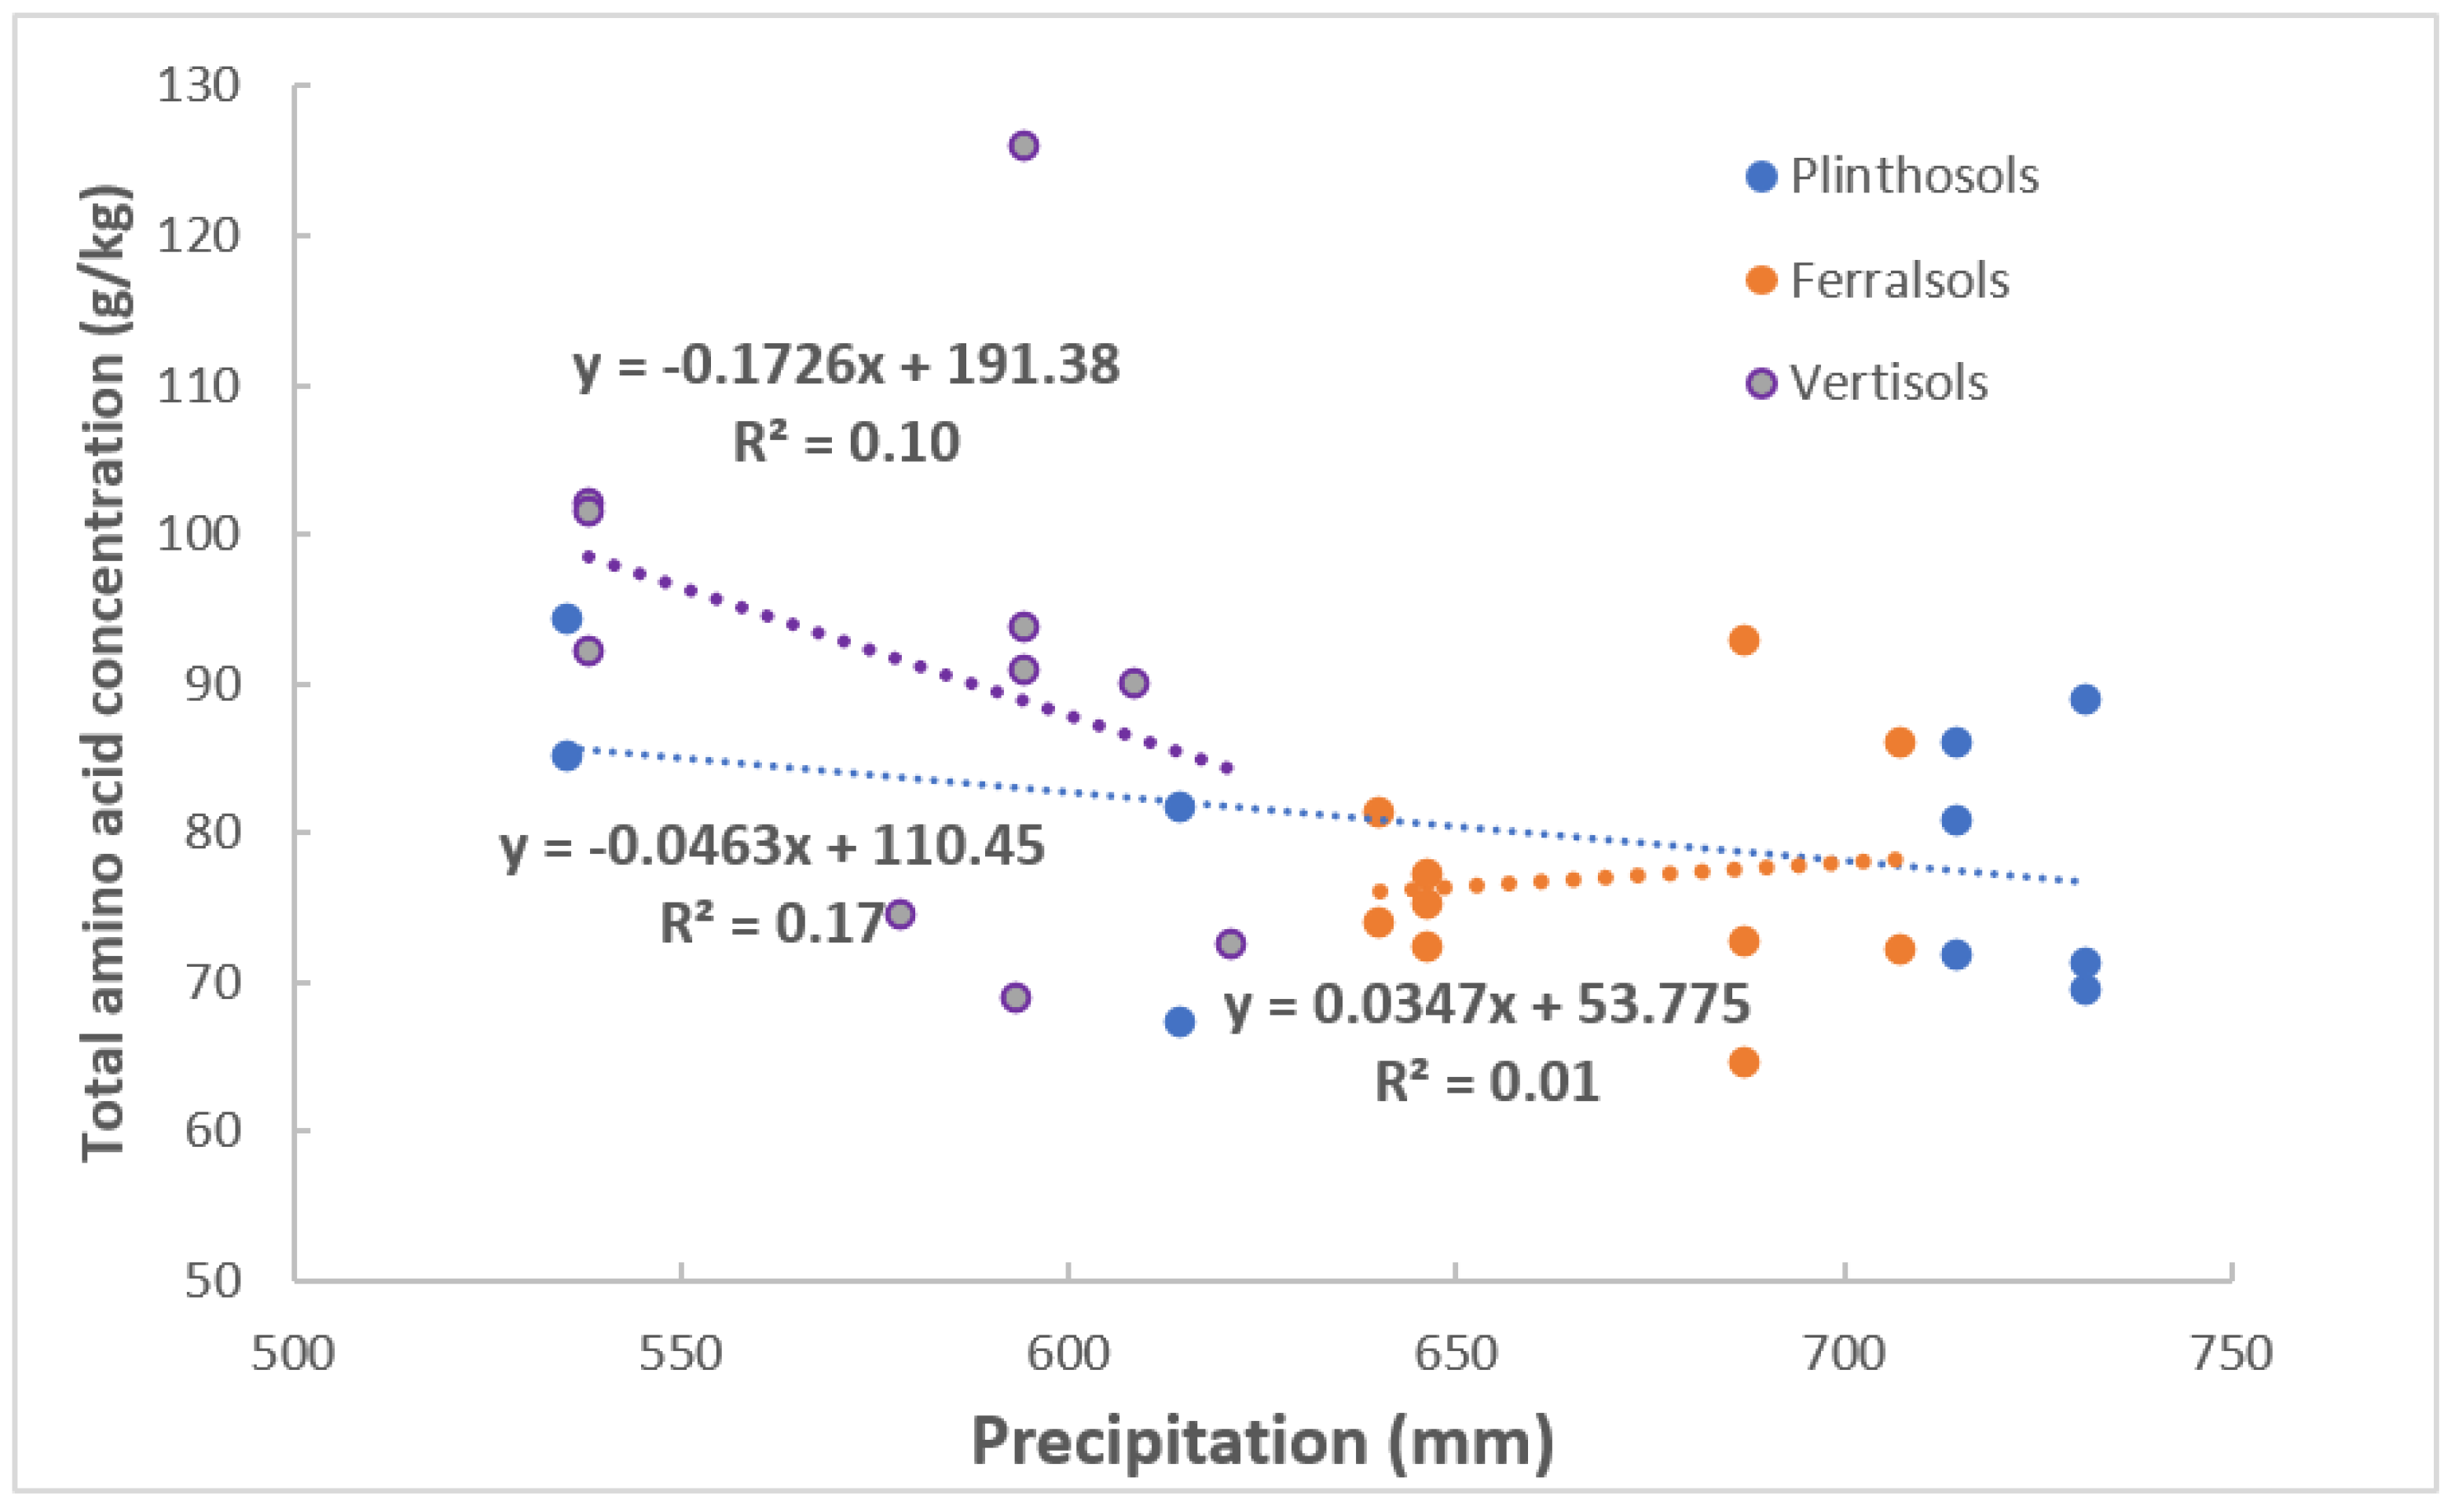
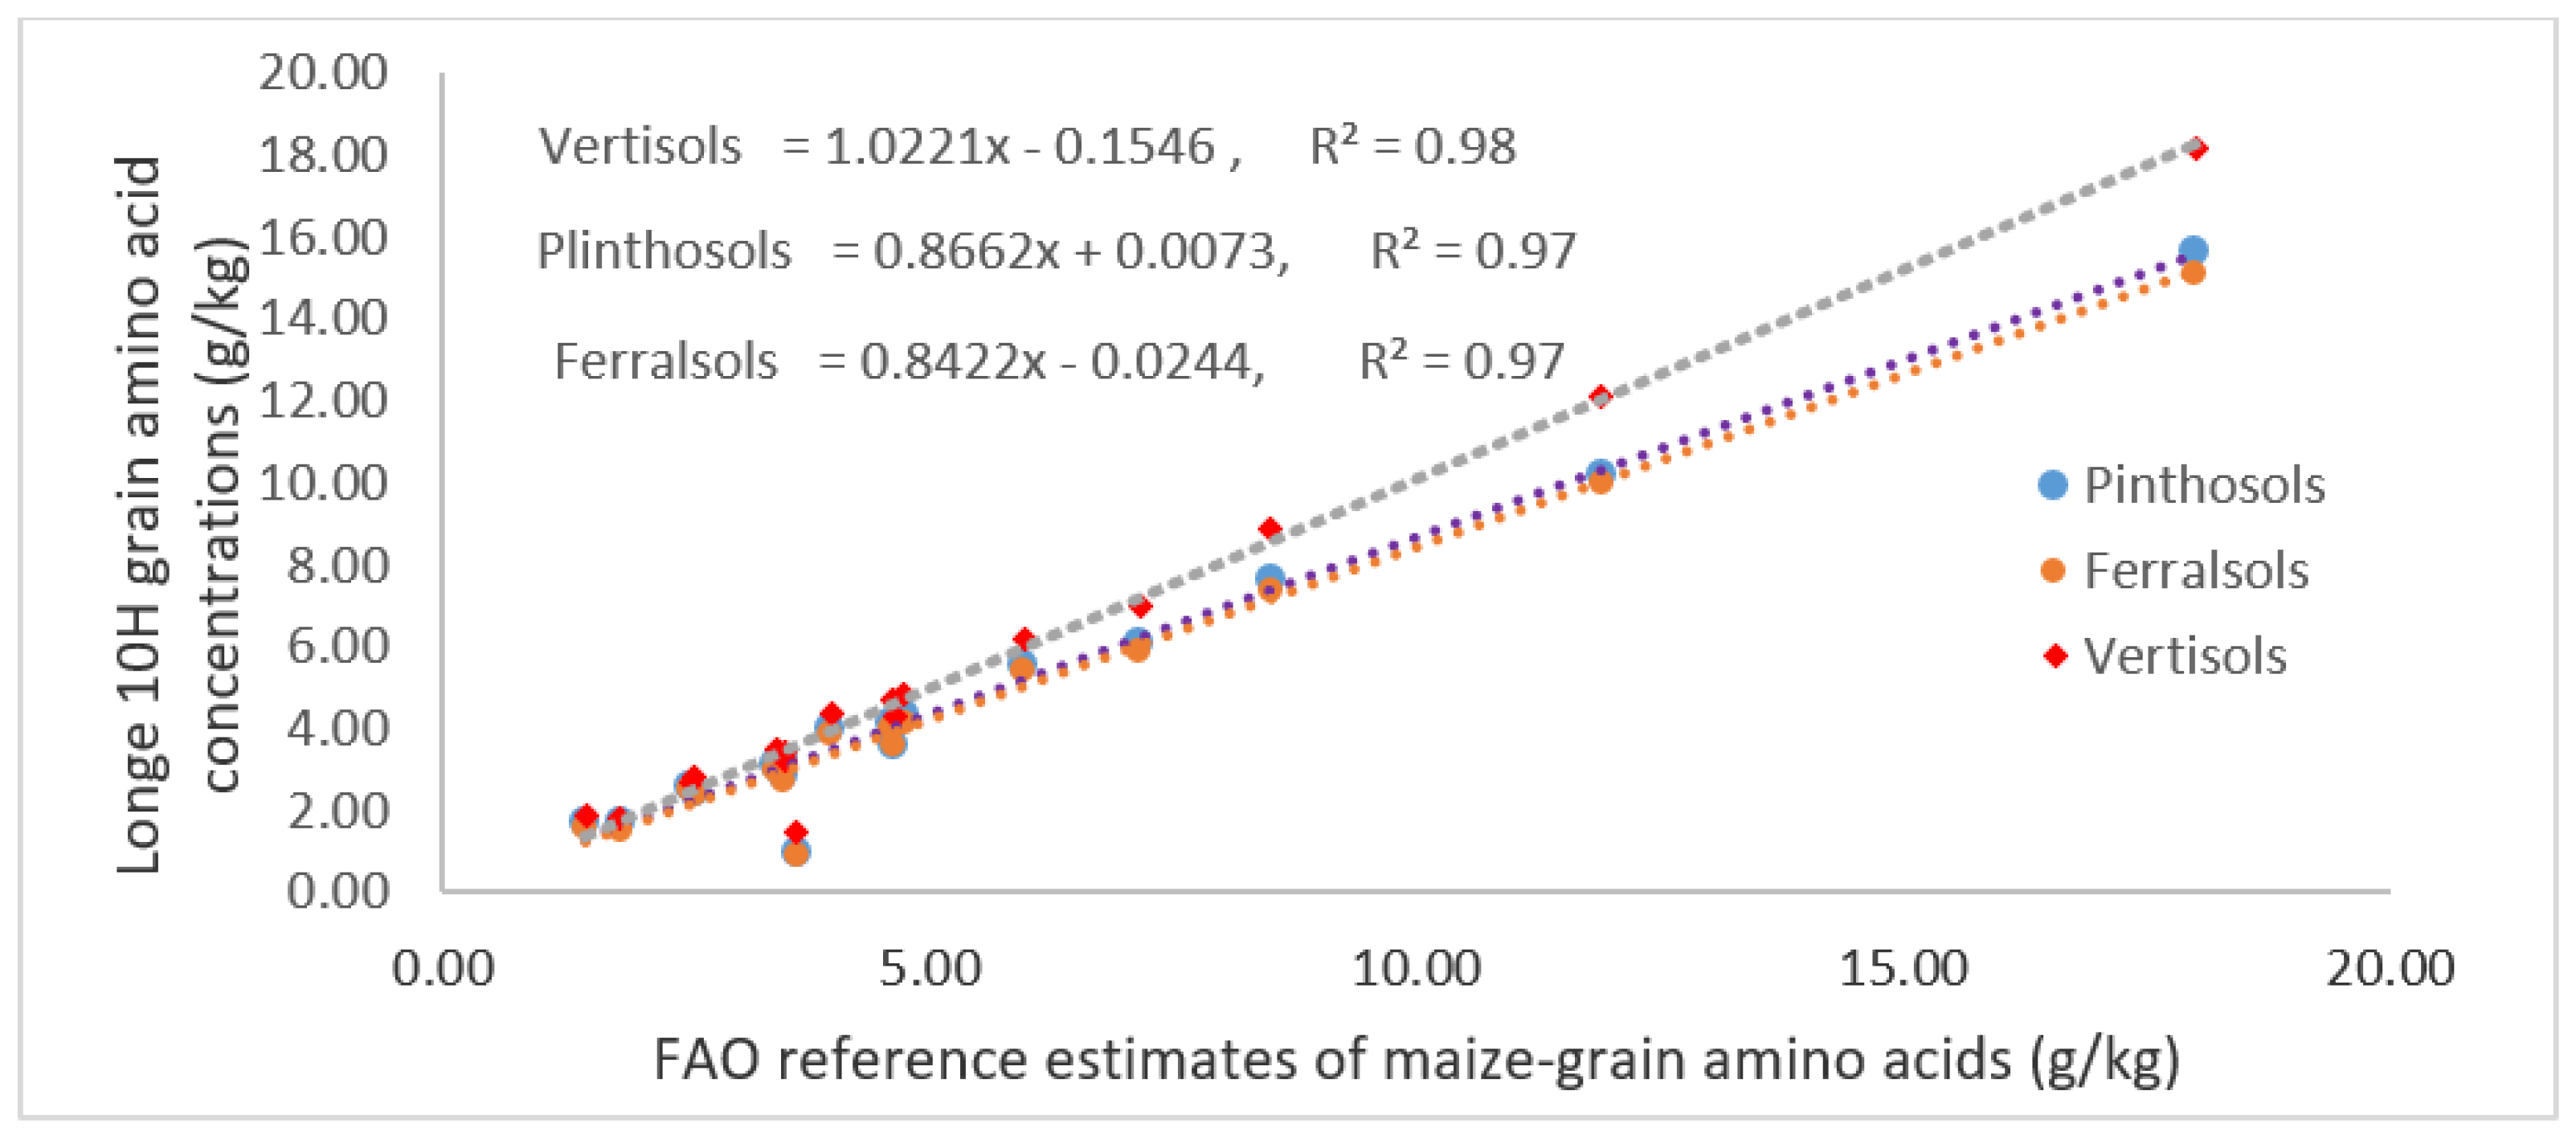
3.4. Maize–Grain Starch, Crude and Total Proteins Content

Averaged for all plots, over the experimental seasons, the starch content in maize–grains was 65.3 ± 0.6% for plants grown in Plinthosols, 64.6 ± 1.2% in Ferralsols and 63.3 ± 1.1% in Vertisols plots, but this difference was not statistically significant. However, we found a significant negative correlation between grain–starch content and total protein (Figure 6).
Across the seasons, maize–grain crude protein was slightly higher in season 1 (9.66 ± 0.26 g/kg) than in season 2 (9.24 ± 0.23 g/kg), but this difference was not significant. In contrast, crude protein differed significantly (p = 0.004) across soil types (9.55 ± 0.23; 8.83 ± 0.22 and 10.27 ± 0.42 g/kg for Plinthosols, Ferralsols and Vertisols, respectively).
Across the soil types, the total protein (viz. sum of amino acids) in maize–grain was significantly (p = 0.03) higher in plots on Vertisols (91.4 ± 5.3 g/kg) than in Ferralsols (77.0 ± 2.5 g/kg) with Plinthosols (79.8 ± 2.9 g/kg) in between. Moreover, there was significant correlation between maize–grain crude protein and total protein (r = 0.96, p = < 0.0001). Figure 7 shows the profiles of individual amino acid concentrations in maize grains across soil types. Glutamic acid had the highest concentration (15.6–18.2 g/kg) followed by Leucine (10.2–12.1) with Tyrosine being the lowest (0.9–1.51 g/kg). Among the essential amino acids estimated, Methionine (1.52–1.80 g/kg) was the lowest concentration (Figure 7) in all experimental sites.
Both estimated crude protein and total protein were negatively but insignificantly (r = −0.17, p = 0.36; r = −0.15, p = 0.42, respectively) correlated with maize–grain yield. Although the yield was highest in Vertisols, the lowest yield was in Plinthosols, where the total protein was intermediately taken up.
However, there was a negative and significant linear association between total protein and precipitation for the Plinthosols and Vertisols, but not in the Ferralsols (Figure 8).

4. Discussion

Edaphic factors in combination with climatic conditions and management practices play a great role in shaping the yields and nutritional quantities of crop plants [41]. Thus, to concurrently increase the yield and enrich consumable grains of crops such as cereal, which are predominantly low in micronutrients such as Fe and Zn [9], as well as essential amino acids, requires identifying and understanding the environmental influences [28] on these crop attributes. We examined the relationships between the environmental factors (soil and climate) and selected crop parameters of improved hybrid maize in a controlled maize–bean intercropping system. We found that the environmental factors had a smaller effect on the varieties’ analyzed parameters, and only a few of the investigated field soil and climate parameters proved a significance with the plant variables.

4.1. Maize–Grain Yield

Despite being a high-yielding variety [34], fertilized with 50 kg NPK/ha supplementing BNF and cultivated under the intercropping system, the average grain yield (2.01 t/ha ± 0.15 t/ha) was lower than the expected NaCRRI attainable yield of 3.0–3.5 t/ha, with an exception of yield on Vertisols in season two (3.58 ± 1.3 t/ha). This exception was probably due to the Vertisols having a high moisture holding capacity. The average yield attained in these trials; however, was within a FAO ten-year-average yield for maize varieties in Uganda [11]. Moreover, the varieties’ yield was within the range of the average yield of maize (1.2–2.2 t/ha) in SSA [42]. All of these imply that on the yield basis, the variety did not perform better than the other varieties grown in the basin and SSA. Moreover, the implemented agronomic practices were insufficient for the variety to realize its yield potential in Kyoga basin. The trials’ attained low grain yield, however, concur with [43], who also found low maize yield in the area. The significant increase in yield during the second season suggests that factors other than climatic ones were responsible for the increase, as precipitation and temperature did not explain a significant variation observed in maize yield. Moreover, results of the analysis of grain yield with soil attributes (Table 1) revealed no significant correlations between the tested soil attributes and maize yield, despite significant differences in edaphic factors (pH, SOM, TotN, P, Feav and FeTot) across soil types.
The content of SOM (2.18–3.54%), plant available P and K (6.9–17.6 mg/kg and 0.36–0.65 mg/kg, respectively, Table 1), are in the ranges of those reported by, e.g., [44], under conservation farming (CF) and annual ridge tillage in Southern Malawi and under CF and conventional farming in Zambia [45]. The concentration of TotN varied from 0.13–0.21%, which is slightly greater than what is reported for soils (0.003%–0.11%) in SSA [44,45,46]. Despite the significant difference in soil attributes between the soil types and level of nutrients found in the present study compared to the levels reported, the insignificant grain yield difference between soil types suggests that the nutrients’ level is suboptimal and probably imbalanced [47] due to continual subsistent farming that probably leads to heavy nutrient mining. A potential soil fertility problem was observed in some of the plots that were infested with “witch-weed” (Striga hermontica). This weed has been suggested to indicate low soil fertility [47], as it competes with crops for nutrients. Although BNF reported to supply soil N at a range of 24–250 kg/ha/season [48,49] under intercropping systems, the applied 50 kg NPK/ha in combination with the expected BNF seems insufficient to improve soil fertility to boost the yield of the variety to the expected NACRRI attainable yield in the basin. Hence, it is likely this improved variety did not benefit from the intercropping system supplemented with the applied NPK, which was expected to increase its yield in the study area. Research elsewhere under similar soils [22,43] revealed that the combined inorganic and organic fertilizer application or integrated Nutrient Management [46] are viable options to realize the increased yield. This, however, requires further study on the option, whether it is conforming to the Kyoga environment.

4.2. Iron and Zn Concentrations and Uptake in Maize Grains

Maize–grain Fe and Zn concentrations did not differ significantly across soil types. Given that the same variety was used under the same management practices across the zones, this suggests that the levels of soil nutrients and effect of climatic conditions in the basin were insufficient to induce significant increase in the micronutrient contents, as asserted by [4]. This is probably due to the geochemical complexity involved in acquiring the available Fe and Zn from the soil rhizosphere, in combination with the plant regulatory metabolism [9]. Although beans and maize are known to express strategy I and II respectively to enhance the acquisition of Fe, and Zn under the micronutrients’ deficiency [50], these strategies do not seem effective under the Kyoga basin environment. Since we tested only one genotype, the impact of a “plant” factor remains a question to be further studied.
The significant positive correlation between Fe and Zn uptakes indicate that the processes of Fe and Zn acquisitions, transportation and assimilation are controlled by the gene pleiotropic effect [7], which breeders could explore. In their experiment on maize fertilized with nitrogen, [51] confirmed such a relationship, in which they found significant effects of nitrogen fertilization on both Zn and Fe concentration in maize silage and grains.
The significant positive correlation between grain Fe concentrations and soil pH may be indirect, perhaps connected to higher root and microbial activity [50,52], or a slightly higher proportion of the more soluble Fe-hydroxides relative to the less soluble Fe-oxides with increasing pH [53]. Moreover, this may be related to the increased solubility of dissolved organic matter (DOM) and thus Fe with pH [54]. However, the dissolved organic carbon (DOC), which is used as a proxy to estimate DOM, was not determined. The high levels of available Fe in the soils (FeAV, Table 1) and the high maize–grain Fe concentrations (Table 2) across the soil types, further strongly suggests a “plant factor” in addition to one or several geochemical factors, regulating the uptake of plant available Fe (Table 1). Although this variety portioned 12–45 mg/kg of Fe into grains, these concentrations are unlikely to provide dietary-Fe needs (10–18 mg/kg daily intake) in humans [55]. This is because the presence of anti-nutritional factors such as polyphenol and phytic acids [56], food processing and preparation methods may reduce the micronutrient bioavailability [57], hence reducing their effective role in resolving malnutrition due to Fe deficiency. Thus, diversifying the dietary sources is utterly necessary to alleviate the potential Fe deficiency in meals dominated by maize in the Kyoga basin.
The significant correlation of grain Zn concentration with SOM and TotN is consistent with a previous report [3] from Turkey, associating the Zn in soils with soil organic matter, one of the main pools of soil bioavailable Zn. Thus, increasing SOM and nitrogen through proper residue management, manure or compost applications will likely enhance the Zn supply, hence the subsequent uptake by maize plants [23] growing in these soils. This, however, requires the close management of soil pH to avoid the Zn fixation by soil constituents at a higher soil pH. Since Zn concentrations of <12 mg/kg in maize–grains was associated with Zn deficient soils [22], the grain Zn concentration (Table 2) suggest that soils at experimental sites were not Zn deficient. As such, adopting maize varieties with a genetic capacity to efficiently mine the soil available Zn will likely increase the yield and the micronutrient content in maize grains.
The ranges of Fe (20.3–25.20 mg/kg) and Zn (20.71–25.20 mg/kg) concentrations in maize–grains across soil types (Table 2) were consistent with those reported by [58] for 20 lines of Southern Africa maize germplasms. Moreover, they were consistent with those reported by [59] for early maturing lines in different ecological conditions of West Africa. However, our study recorded that the narrow ranges of grain Fe and Zn concentrations are of concern for the germplasm improvement by conventional breeding [4]. Although the use of the improved variety coupled with fertilizer applications were suggested as effective agronomic measures to realize the increased grain-yield and micronutrient density [14], our results revealed that these measures are ineffective under a Kyoga environment. This is probably due to the low rate of applied NPK or nutrients imbalance in the area. Therefore, the results did not provide evidence to discern areas in the basin where both soils and climatic conditions could improve the yield and grain micronutrient density of the tested variety. This further suggests that under Kyoga conditions, sole reliance of maize production on soil available Fe and Zn, even under an intercropping system, is not a successful biofortification strategy. Thus, importing varieties with a wider genetic variability in grain micronutrient (Fe and Zn) concentrations [60,61,62,63], or with higher efficiency in extracting soil available Fe and Zn, is recommended for this region.

4.3. Starch, CP and TP Content in Maize–Grains

The ranges of grain–starch concentrations are in line with those reported in the literature, e.g., [64] for other maize varieties grown in different agro-ecological and soil conditions of various countries. Similarly, the amino acid concentrations were consistent with those reported by FAO (Figure 9) from diverse soil types [55]. It is apparent from the figure that amino acid profiles of different maize varieties are the same. Hence, the profile of the given maize variety can be used to predict the amino acids profile of other varieties.
The negative correlation between starch content and total amino acids (Figure 6) is consistent with the inverse relationship between grain–yield and protein in cereals [10,65]. Surprisingly, we observed a higher mean yield from sites with significantly higher amino acids content. This suggests that there is a yield threshold, above which the dilution effect will result in decreasing the amino acid contents. The significant variation of total amino acids between soil types (sites) indicates the environment’s prominent role in controlling the nutrient contents [10]. Given the association of nitrogen with amino acids, it is likely that the increased fertilization with nitrogenous fertilizer in these soils will elevate the grain amino acid contents in this variety.
The significant negative correlation of amino acids with precipitation suggest that areas that are drought prone will have higher amino acid contents relative to wetter areas, but this will be on an expense of yield. Although this variety is stated to have an improved lysine content [34], our findings reveal that lysine concentration did not differ from those recently published [5,55,66].

5. Conclusions

This study examined the effect of the cropping season (2016 and 2017), soil types (Plinthosols, Lixic Ferralsols and Vertisols), the season precipitation and temperature on yield, Iron (Fe) and Zinc (Zn) concentrations and amino acids in grains of hybrid maize (Longe 10H) under the intercropping of smallholder farming in the Kyoga basin, Eastern Uganda. The study demonstrated that the maize–grain yield and uptake of micronutrients (Fe and Zn) vary significantly between seasons. In contrast, the soil types and growing season temperatures and precipitation have insignificant effects on the yield. As discussed, the soil fertility levels at the different sites are similar to other areas in Africa. One significant difference is the amount of fertilizer applied, which was significantly smaller than the amount taken up by the plants. Thus, despite the significant difference of edaphic properties between soil types, the soil conditions were suboptimal to significantly increase the grain yield or micronutrients harvesting into grains. Moreover, though the soil types contain high available Fe, the maize plant did not allocate substantial concentration into the grains. Thus, the results demonstrated statistically no substantive evidence to locate spatially where the interactive-effect of soil and climate factors will increase the yield and grain-micronutrient (Fe and Zn) contents of the tested hybrid maize across the basin.
In light of the results, the increasing yield in the basin was not possible by simple use of the improved variety fertilized with NPK at the rate of 50 kg/ha in combination with BNF and under an intercropping system. Thus, this study recommends further study on the improved management such as trials of different rates of NPK combined with organic fertilizers coupled with supplemental irrigation, given the variability of rain across the basin. We also recommend further testing of other varieties to identify plant factors regulating micronutrient uptakes and portioning into grains under a similar environment. Additionally, importing other varieties, which are high yielding and with efficient genetic potential to accumulate sufficient Fe and Zn into grains, is another option. Alternatively, food sources rich in micronutrients (Fe and Zn), such as red meat or diversifying meals, rather than solely depending on maize meals, are encouraged to resolve the likely micronutrient deficiency problem in Kyoga basin. Finally, geochemical studies on the impact of soil moisture, Fe-(hydro) oxides, pH and SOM controlling the speciation and kinetic of essential element (e.g., P, N, Zn, Fe) in such systems are important and should be given priority.

Author Contributions

Conceptualization: L.P.L.; Methodology: L.P.L.; V.M. and Å.R.A.; Software: L.P.L. and V.M.; Formal analysis: L.P.L. and V.M.; Investigation, and data curation: L.P.L.; Writing-Original, draft preparation: L.P.L.; Writing-Review and editing: V.M. and Å.R.A.; Visualization: L.P.L.; Supervision, Project Administration and Funding acquisition: Å.R.A. All authors have read and agreed to the published version of the manuscript.

Funding

This research was funded through CAPSNAC by NORHED I under grant No3303010034 and through ClimSmart project by NORHED II under grant No.61320.

Data Availability Statement

The data presented in this study are available on request from the corresponding author.

Acknowledgments

We are grateful to Bal Ram Singh and Samuel Kyamanywa for their great support of this study. We also acknowledged and thanked the Makerere University soil laboratory and NMBU Laboratories’ staffs for analyzing the soil and plant samples. We give special thanks to farmers in Eastern Uganda for providing plots to implement the experiments.

Conflicts of Interest

The authors declare no conflict of interest.

References

  1. Bouis, H.E.; Welch, R.M. Biofortification—A Sustainable Agricultural Strategy for Reducing Micronutrient Malnutrition in the Global South. Crop Sci. 2010, 50 (Suppl. S1), S-20–S-32. [Google Scholar] [CrossRef] [Green Version]
  2. Cakmak, I. Enrichment of cereal grains with zinc: Agronomic or genetic biofortification? Plant Soil 2007, 302, 1–17. [Google Scholar] [CrossRef]
  3. Cakmak, I.; Kutman, U.B. Agronomic biofortification of cereals with zinc: A review. Eur. J. Soil Sci. 2018, 69, 172–180. [Google Scholar] [CrossRef] [Green Version]
  4. Welch, R.M.; Graham, R.D. Breeding for micronutrients in staple food crops from a human nutrition perspective. J. Exp. Bot. 2004, 55, 353–364. [Google Scholar] [CrossRef] [PubMed] [Green Version]
  5. Galili, G.; Amir, R. Fortifying plants with the essential amino acids lysine and methionine to improve nutritional quality. Plant Biotechnol. J. 2013, 11, 211–222. [Google Scholar] [CrossRef] [PubMed]
  6. Ufaz, S.; Galili, G. Improving the content of essential amino acids in crop plants: Goals and opportunities. Plant Physiol. 2008, 147, 954–961. [Google Scholar] [CrossRef] [Green Version]
  7. Gupta, H.S.; Hossain, F.; Nepolean, T.; Vignesh, M.; Mallikarjuna, M.G. Understanding Genetic and Molecular Bases of Fe and Zn Accumulation Towards Development of Micronutrient-Enriched Maize. In Nutrient Use Efficiency: From Basics to Advances; Springer: New Delhi, India, 2015; pp. 255–282. [Google Scholar]
  8. Šimić, D.; Sudar, R.; Ledenčan, T.; Jambrović, A.; Zdunić, Z.; Brkić, I.; Kovačević, V. Genetic variation of bioavailable iron and zinc in grain of a maize population. J. Cereal Sci. 2009, 50, 392–397. [Google Scholar] [CrossRef]
  9. Briat, J.F.; Dubos, C.; Gaymard, F. Iron nutrition, biomass production, and plant product quality. Trends Plant Sci. 2015, 20, 33–40. [Google Scholar] [CrossRef]
  10. Shewry, P.R. Improving the protein content and composition of cereal grain. J. Cereal Sci. 2007, 46, 239–250. [Google Scholar] [CrossRef]
  11. FAO; IFAD; UNICEF; WFP; WHO. The State of Food Security and Nutrition in the World 2017; Building Resilience for Peace and Food Security. Rome, FAO. 2017. Available online: http://www.fao.org/state-of-food-security-nutrition (accessed on 18 September 2018).
  12. Harton, S.; Alderman, H.; Rivera, J.A. The Challenge of Hunger and Malnutrition; Copenhagen Consensus 2008 Project, Challenge Paper. 2008. Available online: http://www.who.int/pmnch/topics/nutrition/hunger/en/ (accessed on 5 September 2018).
  13. Bouis, H.E.; Saltzman, A. Improving nutrition through biofortification: A review of evidence from HarvestPlus, 2003 through 2016. Glob. Food Sec. 2017, 12, 49–58. [Google Scholar] [CrossRef]
  14. de Valença, A.W.; Bake, A.; Brouwer, I.D.; Giller, K.E. Agronomic biofortification of crops to fight hidden hunger in sub-Saharan Africa. Glob. Food Secur. 2017, 12, 8–14. [Google Scholar] [CrossRef]
  15. Grusak, M.A.; DellaPenna, D. Improving the nutrient composition of plants to enhance human nutrition and health. Ann. Rev. Plant Physiol. Plant Mol. Biol. 1999, 50, 133–161. [Google Scholar] [CrossRef]
  16. Zuo, Y.M.; Zhang, F.S.; Li, X.L.; Cao, Y.P. Studies on the improvement in iron nutrition of peanut by intercropping maize on a Calcareous soils. Plant Soil 2000, 220, 13–35. [Google Scholar] [CrossRef]
  17. Das, J.K.; Salam, R.A.; Kumar, R.; Bhutta, Z.A. Micronutrients fortification of food and its impact on woman and Child health: A systematic review. Syst. Rev. 2013, 2, 1–24. [Google Scholar] [CrossRef] [Green Version]
  18. Akhtar, S.; Arjun, F.M.; Anjum, M.A. Micronutrients fortification of Wheat flour: Recent development and strategies. Food Res. Int. 2011, 44, 652–659. [Google Scholar] [CrossRef]
  19. Gomez-Galera, S.; Rojas, E.; Christou, P. Critical evaluation of strategies for mineral fortification of staple Food crops. Transgenic Res. 2010, 19, 165–180. [Google Scholar] [CrossRef] [PubMed]
  20. Zuo, Y.; Zhang, F. Iron and Zinc biofortication strategies in dicot plants by intercropping with gramineous species. A review. Agron. Sustain. Dev. 2009, 29, 63–71. [Google Scholar] [CrossRef]
  21. Prasad, R.; Shivay, Y.S.; Kumar, D. Agronomic Biofortification of Cereal Grains with Iron and Zinc; Elsevier: Amsterdam, The Netherlands, 2014; pp. 55–91. [Google Scholar]
  22. Manzeke, G.M.; Mapfumo, P.; Mtambanengwe, F.; Chikowo, R.; Tendayi, T.; Cakmak, I. Soil fertility management effects on maize productivity and grain zinc content in smallholder farming systems of Zimbabwe. Plant Soil 2012, 361, 57–69. [Google Scholar] [CrossRef]
  23. Manzeke, G.M.; Mtambanengwe, F.; Nezomba, H.; Mapfumo, P. Zinc fertilization influence on maize productivity and grain nutritional quality under integrated soil fertility management in Zimbabwe. Field Crops Res. 2014, 166, 128–136. [Google Scholar] [CrossRef]
  24. Singh, B.R.; Timsina, Y.N.; Lind, O.C.; Cagno, S.; Janssens, K. Zinc and Iron Concentration as Affected by Nitrogen Fertilization and Their Localization in Wheat Grain. Front. Plant Sci. 2018, 9, 307. [Google Scholar] [CrossRef] [Green Version]
  25. Kermah, M.; Franke, A.C.; Adjei-Nsiah, S.; Ahiabor, B.D.K.; Abaidoo, R.C.; Giller, K.E. Maize-grain legume intercropping for enhanced resource use efficiency and crop productivity in the Guinea savanna of northern Ghana. Field Crops Res. 2017, 213, 38–50. [Google Scholar] [CrossRef] [PubMed]
  26. Xue, Y.; Yue, S.; Zhang, W.; Liu, D.; Cui, Z.; Chen, X.; Ye, Y.; Zou, C. Zinc, Iron, Managanese and Copper uptake requirements in response to Nitrogen supply and the increased grain yield of summer maize. PLoS ONE 2014, 9, e93895. [Google Scholar] [CrossRef] [PubMed]
  27. Layek, J.; Das, A.; Mitran, T.; Nath, C.; Meena, R.S.; Yodav, G.S.; Shivakumar, B.G.; Kumar, S.; Lal, R. Cereal+legumes intercropping: An option for improving Productivity and sustainable soil health. In Legumes for Soil Health and Sustainable Management; Meena, R.S., Ed.; Springer Nature: Singapore, 2018. [Google Scholar]
  28. Pandian, S.S.; Robin, S.; Vinod, K.K.; Rajeswari, S.; Manonmani, S.; Subramanian, K.S.; Saraswathi, R.; Kirubhakaran, A.P.M. Influence of intrinsic soil factors on genotype-by-environment interactions governing micronutrient content of milled rice grains. Aust. J. Crop Sci. 2011, 5, 1737–1744. [Google Scholar]
  29. Yang, X.E.; Chen, W.-R.; Feng, X. Improving human micronutrient nutrition through biofortification in the soil-plant system: China as case study. Environ. Geochem. Health 2007, 29, 413–428. [Google Scholar] [CrossRef] [PubMed]
  30. McIntyre, B.D.; Bouldin, D.R.; Urey, G.H.; Kizito, F. Modeling cropping strategies to improve human nutrition in Uganda. Agric. Syst. 2001, 67, 105–120. [Google Scholar] [CrossRef]
  31. Lugoi, L.P.; Bamutaze, Y.; Martinsen, V.; Dick, Ø.B.; Almås, Å.R. Ecosystem productivity response to environmental forcing, prospect for improved rain-fed cropping productivity in lake Kyoga Basin. Appl. Geogr. 2019, 102, 1–11. [Google Scholar] [CrossRef]
  32. Kaizzi, K.C.; Nansamba, A.; Musisi, K.F. Optimizing Fertilizer Use within the Context of Integrated Soil Fertility in Uganda. In Fertilizer Use Optimization in Sub-Saharan Africa; Wortmann, C.S., Sones, K.R., Eds.; CABI: Oxfordshire, UK, 2017. [Google Scholar]
  33. WRB, I.W. World Reference Base for Soil Resources 2006; World Soil Resources Reports No. 103; FAO: Rome, Italy, 2006. [Google Scholar]
  34. NaCRRI. National Crop Resources Research Institute. Ministry of Agriculture, Animal Industry and Fisheries, Gov of Uganda. 2009. Available online: https://tasai.org.info_portal (accessed on 8 September 2016).
  35. Ranst, E.v.; Verloo, M.; Demeyer, A.; Pauwels, J. Manual for the soil chemistry and fertility laboratory: Analytical methods for soils and plants equipment, and management of consumables. Lab Manual. 1999.
  36. Gibson, R.B. The Determination of Nitrogen by the Kjeldahl Method. J. Am. Chem. Soc. 1904, 26, 105–110. [Google Scholar] [CrossRef]
  37. Murphy, J.; Riley, J.P. A modified single solution method for the determination of phosphate in natural waters. Anal. Chim. Acta 1962, 27, 31–36. [Google Scholar] [CrossRef]
  38. Chang, S.K.C.; Zhang, Y. Protein Analysis. In Food Analysis; Neilsen, S.S., Ed.; Food Science Text Series; Springer: Cham, Switzerland, 2017. [Google Scholar] [CrossRef]
  39. R Core Team. R: A Language and Environment for Statistical Computing; R Foundation for Statistical Computing: Vienna, Austria, 2018; Available online: https://www.R-project.org/ (accessed on 4 June 2018).
  40. Foster, H.L. Rapid routine soil and plant analysis without automatic equipment I. East Afr. Agric. For. J. 1971, 37, 11. [Google Scholar] [CrossRef]
  41. Dangour, A.D.; Dodhia, S.K.; Hayter, A.; Allen, E.; Lock, K.; Uauy, R. Nutritional quality of organic foods: A systematic review. Am. J. Clin. Nutr. 2009, 90, 680–685. [Google Scholar] [CrossRef] [Green Version]
  42. Van Ittersum, M.K.; Van Bussel, L.G.J.; Wolf, J.; Grassini, P.; Van Wart, J.; Guilpart, N.; Claessens, L.; De Groot, H.; Wiebe, K. Can Sub-Saharan Africa Feed itself? Proc. Natl. Acad. Sci. USA 2016, 113, 14964–14969. [Google Scholar] [CrossRef] [PubMed] [Green Version]
  43. Kaizzi, K.C.; Byalebeka, J.; Semalulu, O.; Alou, I.; Zimwanguyizza, W.; Nansamba, A.; Musinguzi, P.; Ebanyat, P.; Hyuha, T.; Wortmann, C.S. Maize Response to Fertilizer and Nitrogen Use Efficiency in Uganda. Agron. J. 2012, 104. [Google Scholar] [CrossRef]
  44. Mloza-Banda, H.R.; Makwiza, C.N.; Mloza-Banda, M.L. Soil properties after conversion to conservation agriculture from ridge tillage in Southern Malawi. J. Arid. Environ. 2016, 127, 7–16. [Google Scholar] [CrossRef]
  45. Martinsen, V.; Shitumbanuma, V.; Mulder, J.; Ritz, C.; Cornelissen, G. Effects of hand-hoe tilled conservation farming on soil quality and carbon stocks under on-farm conditions in Zambia. Agric. Ecosyst. Environ. 2017, 241, 168–178. [Google Scholar] [CrossRef]
  46. Vanlauwe, B.; Tittonell, P.; Mukalama, J. Within-farm soil fertility gradients affect response of maize to fertiliser application in western Kenya. Nutr. Cycl. Agroecosystems 2006, 76, 171–182. [Google Scholar] [CrossRef]
  47. Nkonya, E.; Kaizzi, C.; Pender, J. Determinants of nutrient balances in a maize farming system in eastern Uganda. Agric. Syst. 2005, 85, 155–182. [Google Scholar] [CrossRef]
  48. Nyemba, R.C.; Dakora, F.D. Evaluating nitrogen fixation by food legumes in farmers’ fields in three agro ecological zones of Zambia using 15N natural abundance. Biol. Fertil. Soils 2010, 46, 461–470. [Google Scholar] [CrossRef]
  49. Njira, K.O.W.; Nalivata, P.C.; Kanyama-Phiri, G.Y.; Lowole, M.W. Biological Nitrogen Fixation in sole and doubled-up legume cropping systems in the sandy soils of Kasungu, Central Malawi. J. Soil Sci. Environ. Manag. 2012, 3, 224–230. [Google Scholar]
  50. Marschner, P. Marschner’s Mineral Nutrition of Higher Plants, 3rd ed.; Elsevier/Academic Press: Cambridge, CA, USA, 2012. [Google Scholar]
  51. Grujcic, D.; Hansen, T.H.; Husted, S.; Drinic, M.; Singh, B.R. Effect of nitrogen and zinc fertilization on zinc and iron bioavailability and chemical speciation in maize silage. J. Trace Elem. Med. Biol. 2018, 49, 269–275. [Google Scholar] [CrossRef]
  52. Colombo, C.; Palumbo, G.; He, J.Z.; Pinton, R.; Cesco, S. Review on Iron availability in soil: Interaction of Fe minerals, plants and microbes. J. Soils Sediments 2014, 14, 538–548. [Google Scholar] [CrossRef]
  53. Blume, H.P.; Brummer, G.W.; Fleige, H.; Horn, R.; Kandeler, E.; Knabner, I.K.; Kretzschmar, R.; Stahr, K.; Wilke, B.M. Scheffer/Schachtschabel Soil Science, 16th ed.; Springer-Cerlag: Berlin, Germany, 2016; p. 618. [Google Scholar]
  54. Almås, Å.R.; Lofts, S.; Tipping, E.; Mulder, J. Solubility of major cations and Cu, Zn and Cd in soil extracts of some contaminated agricultural soils near a zinc smelter in Norway: Modelling with a multisurface extension of WHAM. Eur. J. Soil Sci. 2007, 58, 1074–1086. [Google Scholar] [CrossRef] [Green Version]
  55. FAO. Amino Acid Content of Foods and Biological Data on Proteins. FAO Nutritional Studies No. 4 Rome—Italy. 1981. Available online: www.fao.org/docrep/005/AC854T/AC854T00.htm#TOC (accessed on 6 November 2017).
  56. Clemens, S. Zn and Fe biofortification: The right chemical environment for human bioavailability. Plant Sci. 2014, 225, 52–57. [Google Scholar] [CrossRef] [PubMed]
  57. Gibson, R.S.; Perlas, L.; Hotz, C. Improving the bioavailability of nutrients in plant foods at the household level. Proc. Nutr. Soc. 2006, 65, 160–168. [Google Scholar] [CrossRef] [Green Version]
  58. Bänziger, M.; Long, J. The potential for increasing the iron and zinc density of maize through plant-breeding. Food Nutr. Bull. 2000, 21, 397–400. [Google Scholar] [CrossRef] [Green Version]
  59. Oikeh, S.O.; Menkir, A.; Dixon, B.M.; Welch, R.; Glahn, R.P. Assessment of Concentrations of Iron and Zinc and Bioavailable Iron in Grains of Early-Maturing Tropical Maize Varieties. J. Agric. Food Chem. 2003, 51, 3688–3694. [Google Scholar] [CrossRef]
  60. Maziya-Dixon, B.; Kling, J.G.; Menkir, A.; Dixon, A. Genetic variation in total carotene, iron, and zinc contents of maize and cassava genotypes. Food Nutr. Bull. 2000, 21, 419–422. [Google Scholar] [CrossRef]
  61. Prasanna, B.M.; Mazumdar, S.; Chakraborti, M.; Hossain, F.; Manjaiah, K.M.; Agrawal, P.K.; Guleria, S.K.; Gupta, H.S. Genetic variability and genotype year interactions for Kernel iron and zinc concentration in maize (Zea mays L.). Indian J. Agric. Sci. 2011, 81, 704–711. [Google Scholar]
  62. Agrawal, P.K.; Jaiswal, S.K.; Prasanna, B.M.; Hossain, F.; Saha, S.; Guleria, S.K.; Gupta, H.S. Genetic variability and stability for kernel iron and zinc concentration in maize (Zea mays L.) Genotypes. Indian J. Genet. Breed 2012, 72, 421–428. [Google Scholar]
  63. Chen, F.; Chun, L.; Song, J.; Mi, G. Heterosis and genetic analysis of iron concentration in grains and leaves of maize. Plant Breed 2007, 126, 107–109. [Google Scholar] [CrossRef]
  64. Berardo, N.; Mazzinelli, G.; Valoti, P.; Lagana, P.; Redaelli, R. Characterization of Maize Germplasm for the chemical composition of the grain. J. Agric. Food Chem. 2009, 57, 2378–2384. [Google Scholar] [CrossRef] [PubMed]
  65. Uribelarrea, M.; Below, F.E.; Moose, S.P. Grain Composition and Productivity of Maize Hybrids Derived from the Illinois Protein Strains in Response to Variable Nitrogen Supply. Crop Sci. 2004, 44, 1593–1600. [Google Scholar] [CrossRef]
  66. Nuss, E.T.; Tanumihardjo, S.A. Quality protein maize for Africa: Closing the protein inadequacy gap in vulnerable populations. Adv. Nutr. 2011, 2, 217–224. [Google Scholar] [CrossRef] [PubMed] [Green Version]
Figure 1. Locations of districts in Eastern Uganda representing the three zones (I–III) where the study focused. The oblong features show the locations of the field experimental sites.
Agronomy 12 02383 g001
Figure 2. Precipitation distribution throughout the long-rain seasons in 2016 and 2017 across the three climatic zones.
Agronomy 12 02383 g002
Figure 3. Average (Tavg), minimum (Tmn) and maximum (Tmx) temperatures for the two seasons (2016 and 2017) across the three climatic zones.
Agronomy 12 02383 g003
Figure 4. Inter-seasonal (a) and across the soil types (b) mean +/− SE maize grain yield (t/ha).
Agronomy 12 02383 g004
Figure 5. (a) Mean +/− SE inter-seasonal maize–grain Fe and Zn concentrations. (b) Mean +/− SE maize–grain Fe and Zn concentrations across the soil types.
Agronomy 12 02383 g005aAgronomy 12 02383 g005b
Figure 6. Relationship between total protein (sum of amino acids) and starch in maize grains. TAAs concentration in grains (g/kg) = 225.39 − 2.22 × Starch (%), R2 = 0.28, p = 0.003.
Agronomy 12 02383 g006
Figure 7. Profiles of mean amino acids across the zones. Lys = lysine, Met = methionine, Ile = isoleucine, Leu = leucine, Phe = Phenylalanine, Thr = threonine, His = histidine, Val = valine, Cys = cysteine, Asp = asparagine, Ser = serine, Glu = Glutamine, Pro = proline, Gly = glycine, Ala = alanine and Arg = arginine.
Agronomy 12 02383 g007
Figure 8. Linear regression between amino acid concentrations and precipitation for the soil types.
Agronomy 12 02383 g008
Figure 9. The estimated individual amino acids’ concentrations in grain of the variety reference to FAO estimates for different varieties of maize.
Agronomy 12 02383 g009
Table 1. Soil variates (pH, SOM (%), total N (TotN %), available (Pav, Kav, and Feav) and total (Fetot and Zntot) concentrations across the study plots from Kyoga basin.
Soil ParameterZone 1 (Plinthosols)Zone 2 (Ferralsols)Zone 3 (Vertisols)
MinAvgMaxMinAvgMaxMinAvgMax
pH (1:25)5.426.227.324.935.656.355.466.136.65
SOM (%)1.282.183.071.793.544.861.542.23.07
TotN (%)0.070.130.180.090.210.280.090.130.18
Pav(mg/kg)2.386.8933.815.0117.5733.923.7513.3331.01
Kav(mg/kg)0.130.360.70.180.430.750.140.651.67
Feav (mg/kg)89.35115.45141.1279.05102.69132.5456.3868.383.29
Fetot(mg/kg)380021,58041,00012,00059,920100,000950018,92027,000
Zntot (mg/kg)10306020120230103070
Table 2. Means (± SD) of yields, maize–grain Fe and Zn concentrations and their respective uptakes.
SeasonsSoil TypeYield
(t/ha)
Fe Conc
(mg/kg)
Fe_Uptake
(g/ha)
Zn Conc
(mg/kg)
Zn_Uptake
(g/ha)
Season 1Plinthosols1.05 ± 0.3 a22.18 ± 5.123.29 ± 1.6 a21.09 ± 2.622.14 ± 1.30 a
Ferralsols0.99 ± 0.5 a20.36 ± 4.720.15 ± 2.3 a22.36 ± 2.722.13 ± 1.3 a
Vertisols1.74 ± 0.9 a24.29 ± 5.442.26 ± 2.3 a20.71 ± 1.936.00 ± 1.7 a
Season 2Plinthosols2.41 ± 0.6 a25.2 ± 7.660.73 ± 4.2 a25.2 ± 2.6 a60.73 ± 1.3 a
Ferralsols2.95 ± 0.5 a22 ± 5.364.9 ± 2.3 a24.73 ± 2.1 a72.95 ± 1.3 a
Vertisols3.58 ± 1.3 a20.3 ± 2.572.67 ± 4.9 a25.17 ± 1.0 a90.11 ± 1.7 a
Means (±SD) with same subscript differ significantly between seasons at p < 0.05 level of significance.
Publisher’s Note: MDPI stays neutral with regard to jurisdictional claims in published maps and institutional affiliations.

