Article

Transcriptomic Analysis of the Differences in Leaf Color Formation during Stage Transitions in Populus × euramericana ‘Zhonghuahongye’

1
Research Institute of Non−Timber Forestry, CAF, Zhengzhou 450003, China
2
Research Institute of Tropical Forestry, Chinese Academy of Forestry, Guangzhou 510520, China
3
College of Forestry, Henan Agricultural University, Zhengzhou 450002, China
*
Author to whom correspondence should be addressed.
These authors contributed equally to this work.
Agronomy 2022, 12(10), 2396; https://doi.org/10.3390/agronomy12102396
Submission received: 12 August 2022 / Revised: 17 September 2022 / Accepted: 26 September 2022 / Published: 3 October 2022
(This article belongs to the Special Issue Flowering and Flower Development in Plants)

Abstract

:
To explore the mechanism underlying the leaf color variation of Populus × euramericana ‘Zhonghuahongye’ (‘Zhonghong’ poplar) leaves at different maturation stages, we used ‘Zhonghong’ poplar leaves and analyzed the L* (lightness), a* (redness), and b* (yellowness) color difference values and the pigment contents in the three maturation stages. The Illumina HiSeqTM 2000 high-throughput sequencing platform was used for transcriptome sequencing analysis, and leaf color changes during stage transitions were preliminarily explored. Overall, with the increase in L* and b* during leaf development, the a*, C* (colour saturation), and chromatic values decreased, the total anthocyanin content decreased, and the chlorophyll and carotenoid content increased. A total of 11,868 differentially expressed genes were identified by transcriptome sequencing. Comparing the expression differences of structural genes involved in anthocyanin synthesis in the leaves at different stages, we identified 5612 genes in the R1 vs. R2 comparison, 10,083 in the R1 vs. R3 comparison, and 6068 in the R2 vs. R3 comparison (R1, R2, R3 refer to samples obtained on 1 April, 6 April, and 11 April, respectively). Key genes such as DFR●(Dihydroflavanol 4-reductase), ANS (anthocyanidin synthase), FLS (flavonol synthase), CHS (chalcone synthase), BZ1 (Bronze 1), bHLH35, and bHLH63 were identified. These structural genes and those that encode transcription factors may be related to the regulation of anthocyanin synthesis. Here, the key genes related to leaf color change in ‘Zhonghong’ poplar were discovered, providing an important genetic basis for the subsequent genetic improvement of ‘Zhonghong’ poplar.

1. Introduction

‘Zhonghong’ poplar, full name Populus × euramericana ‘Zhonghuahongye’, a deciduous tree species with brightly colored leaves, is an attractive tree species used both as an ornamental and for independent breeding in China [1,2]. ‘Zhonghong’ poplar, which was officially released by the Chinese Academy of Forestry (Beijing, China), is a bud mutation variety of L2025 poplar (variety right number: 20,060,007). New leaves of ‘Zhonghong’ poplar trees are an attractive rose, then they gradually change from bright purplish red to brownish green as the seasons change, and they do not produce feathery seeds that are spread in the air, making this species very suitable for urban, garden, and road beautification [3].
Leaf color is the result of a combination of genetic and environmental factors and is related to the type, mass fraction, and distribution of pigments in leaf cells [4]. At present, research on the color of plant leaves has mainly focused on the mechanism underlying leaf color and the regulation of chemicals that drive plant leaf color; moreover, research on the physiological and morphological characteristics of leaves, their functional natural products, and leaf pigment composition has greatly advanced [5]. Many studies on the mechanism of leaf color variation have explored the relationship between leaf color changes and pigment content in leaves, and candidate genes related to anthocyanin synthesis have been identified [5]. Poplar, as a woody model plant, has been the focus of many studies on the mechanism of phloem regulation. MYB6, which is mainly expressed in young leaves, was isolated from Populus tremula, and overexpression of MYB6 promoted the expression of flavonoid synthesis genes [6]. Among the reported MYB transcription factors in poplar, not only positive regulatory factors but also a class of transcriptional repressive effect factors were found. For example, the activation of the MYB182 transcription factor suppresses the expression of structural and regulatory genes, thus reducing the accumulation of poplar anthocyanins [7].
The amount of anthocyanin accumulated is the end result of biosynthesis and degradation processes. The degradation of anthocyanins occurs in different plant organs due to various environmental and developmental conditions. For example, anthocyanins usually accumulate in young/juvenile leaves and are degraded as the leaves mature [8]. In cases where there is no apparent benefit to the plant, anthocyanin degradation may occur due to changes in the vesicles that contain this pigment. Also the vesicle pH can have an effect on the pigment stability, and an increase in pH in the vesicles of senescent tissues may reduce the stability of anthocyanins and cause their chemical degradation [9]. The degradation of anthocyanins in Cabernet Sauvignon grape skins at high temperatures may be the result of chemical degradation but may also be due to heat stress-induced activity of degradative enzymes (β-glucosidase, peroxidase) in the vesicles [10]. In other cases, such as in flowers or photosynthetic tissues of mandarin jasmine, the drastic color changes caused by phloem degradation are likely to be a signal for pollinators with a clear cause, and this process may be regulated by specific genes and proteins [11].
In order to investigate the causes of leaves color change, this study was conducted to identify genes related to anthocyanin synthesis by RNA sequencing (RNA-seq) of three different developmental stages of ‘Zhonghong’ poplar. The results provided basic data for elucidating the molecular mechanism of leaf color development at the color-changing stage of the leaves of ‘Zhonghong’ poplar.

2. Materials and Methods

2.1. Plant Materials and Sampling

In the state-owned Mengzhou forest farm on the south side of Xiguo town, Mengzhou city, Henan Province, three healthy, growing ‘Zhonghong’ poplar trees were selected as test material, and their leaves were collected on April 1 (R1), April 6 (R2), and April 11 (R3). Each leaf was divided into 2 parts along the main leaf vein (excluding the leaf secondary veins). Half of the fresh samples were used for pigment content and color difference determinations, and half was immediately flash frozen in liquid nitrogen and stored at −80 °C for subsequent transcriptome-related tests. Each sample was biologically replicated 3 times.

2.2. Leaf Colour Analysis

A CR2500 color difference meter (Minolta, Japan) was used to measure the L* value (representing lightness; positive means white, and negative means black), a* value (representing the red/green phase; positive means red, and negative means green), and b* value (representing the yellow/blue phase; positive mean yellows, and negative means blue) of fresh leaves. For each leaf, 10 randomly selected opaque points (avoiding the leaf veins) were measured, and the average of these 10 values was taken as the final value of the indicators [12]. Through the measured redness (hue a*), yellowness (hue b*), and lightness (L*) values, the chroma (C*) value and colored light value were calculated. C* is used to describe the vividness of a color. The higher the chroma is, the purer the color, and the brighter the leaf color; the lower the chroma is, the more astringent the color, and the more turbid the leaf color [13].
C = ( a 2 + b 2 ) 1 2
coloured   light   value = 2000 · a L · ( a 2 + b 2 ) 1 2

2.3. Determination of Leaf Pigment Contents

The contents of photosynthetic pigments in the leaves were determined by the direct extraction method [14,15]. The leaves were washed, ground (after removing the veins) and weighed to 0.1 g (to a precision of 0.01 g). Ten milliliters of 80% acetone was added to the samples, after which the samples were incubated in the dark for 72 h. Afterwards, the supernatant was removed, and chlorophyll was extracted. For this, the samples were ground in 10 mL of a 10% HCl methanol solution, incubated at room temperature for 4 h, and then centrifuged at 3500× g for 15 min. The absorbance values of the chlorophyll extracts at 445 nm, 644 nm, and 662 nm and the absorbance values of anthocyanin extracts at 530 nm and 657 nm were measured by UV spectrophotometry (Jinghua Instruments 752, Shanghai, China); each measurement involved 3 biological replicates and 3 technical replicates. The anthocyanin content (CA), chlorophyll a content (Ca), chlorophyll b content (Cb), total chlorophyll content (CT), and carotenoid content (Ccar) were calculated according to Formulas (3)–(7):
Chlorophyll   a   content   ( mg · g 1 ) :   C a = ( 9 . 78 × A 662 0 . 99 × A 644 ) V ( W × 1000 )
Chlorophyll   b   content   ( mg · g 1 ) :   C b = ( 21 . 40 × A 644 4 . 65 × A 662 ) V ( W × 1000 )
Total   chlorophyll   content   ( mg · g 1 ) :   C T = C a + C b
Carotenoid   content   ( mg · g 1 ) :   C car = ( 4 . 69 × A 445 ) V ( W × 1000 ) 0 . 27 × ( C a + C b )
Anthocyanin   content   ( mg · g 1 ) :   C A = ( A 530 0 . 25 × A 657 ) V ( W × 1000 )
Notes: A, absorbance value; V, extract volume; W, sample mass.

2.4. Total RNA Extraction and Detection

Extraction and transcriptome sequencing of the RNA samples were performed by staff of Wuhan Metware Biotechnology Co., Ltd. (Wuhan, China). The RNA integrity and DNA contamination were analyzed by agarose gel electrophoresis. A NanoPhotometer spectrophotometer and Qubit 2.0 fluorometer (Thermo Fisher Scientific, Waltham, MA, USA) were used to determine the concentration and purity of the RNA samples, and an Agilent 2100 Bioanalyzer (Agilent, Santa Clara, CA, USA) was used to accurately determine the RNA integrity and total RNA amount.

2.5. Library Construction and Sequencing

After verifying the quality of the RNA samples, mRNA was enriched using Oligo (dT) magnetic beads. A sequencing library was subsequently constructed, and an Illumina HiSeqTM 2000 sequencer (San Diego, CA, USA) was used for high-throughput sequencing. The off-machine data were filtered to obtain clean data, and sequence alignments with the specified reference genome were performed using Hisat2 software (version 2.1.0, The Kim Lab, Dallas, TX, USA) to obtain mapped data [16]. Differential expression analysis, functional annotation, and functional enrichment analysis of differentially expressed genes (DEGs) were performed according to the expression levels of the genes in different samples or different sample groups.

2.6. Screening and Functional Annotation of DEGs

DESeq2 (Bioconductor, Coronado, CA, USA) [17,18] was used to analyze the differential expression between sample groups, and the DEG set between groups was obtained according to the conditions of |log2(fold-change)| ≥ 1 and a false discovery rate (FDR) < 0.05. Functional annotation and enrichment analysis of the DEGs were performed through the Kyoto Encyclopedia of Genes and Genomes (KEGG) [19], Gene Ontology (GO) and EuKaryotic Orthologous Groups (KOG) [20,21] databases. The number of DEGs and significant enrichment results for each KEGG pathway, GO term, and KOG functional classification were determined.

2.7. Construction of a Coexpression Network

The DEGs were then used to perform a weighted gene coexpression network analysis using WGCNA v1.69. The resulting coexpression network was visualized using the free software Cytoscape 3.9.1.

2.8. Transcription Factor Analysis

Plant transcription factor prediction was performed using the iTAK [22] software (Shanghai, China); iTAK integrates two databases, PlnTFDB [23] and PlantTFDB [24].

2.9. Quantitative Real-Time PCR (RT-qPCR)

The synthesized cDNA was used as a template for amplification in a real-time fluorescence quantitative PCR machine (Bio-Rad CFX96, Hercules, CA, USA) according to the instructions of the Taq Pro Universal SYBR qPCR Master Mix kit (Q712 of Vazyme, Nanjing Vazyme Biotech Co., Nanjing, China), and each sample was analyzed three times. Gene-specific primers for RT-qPCR were designed by Oligo 7 software and synthesized by Henan Shangya Biological Co., Ltd. (Zhengzhou, China) Using β-actin as the internal reference gene, we tested the amplification reaction background of the target gene, and the relative expression of the genes in the list was calculated by the 2−ΔΔCt method [25]. The RT-qPCR specific primers and internal reference primers used are listed in Table S4.

3. Results

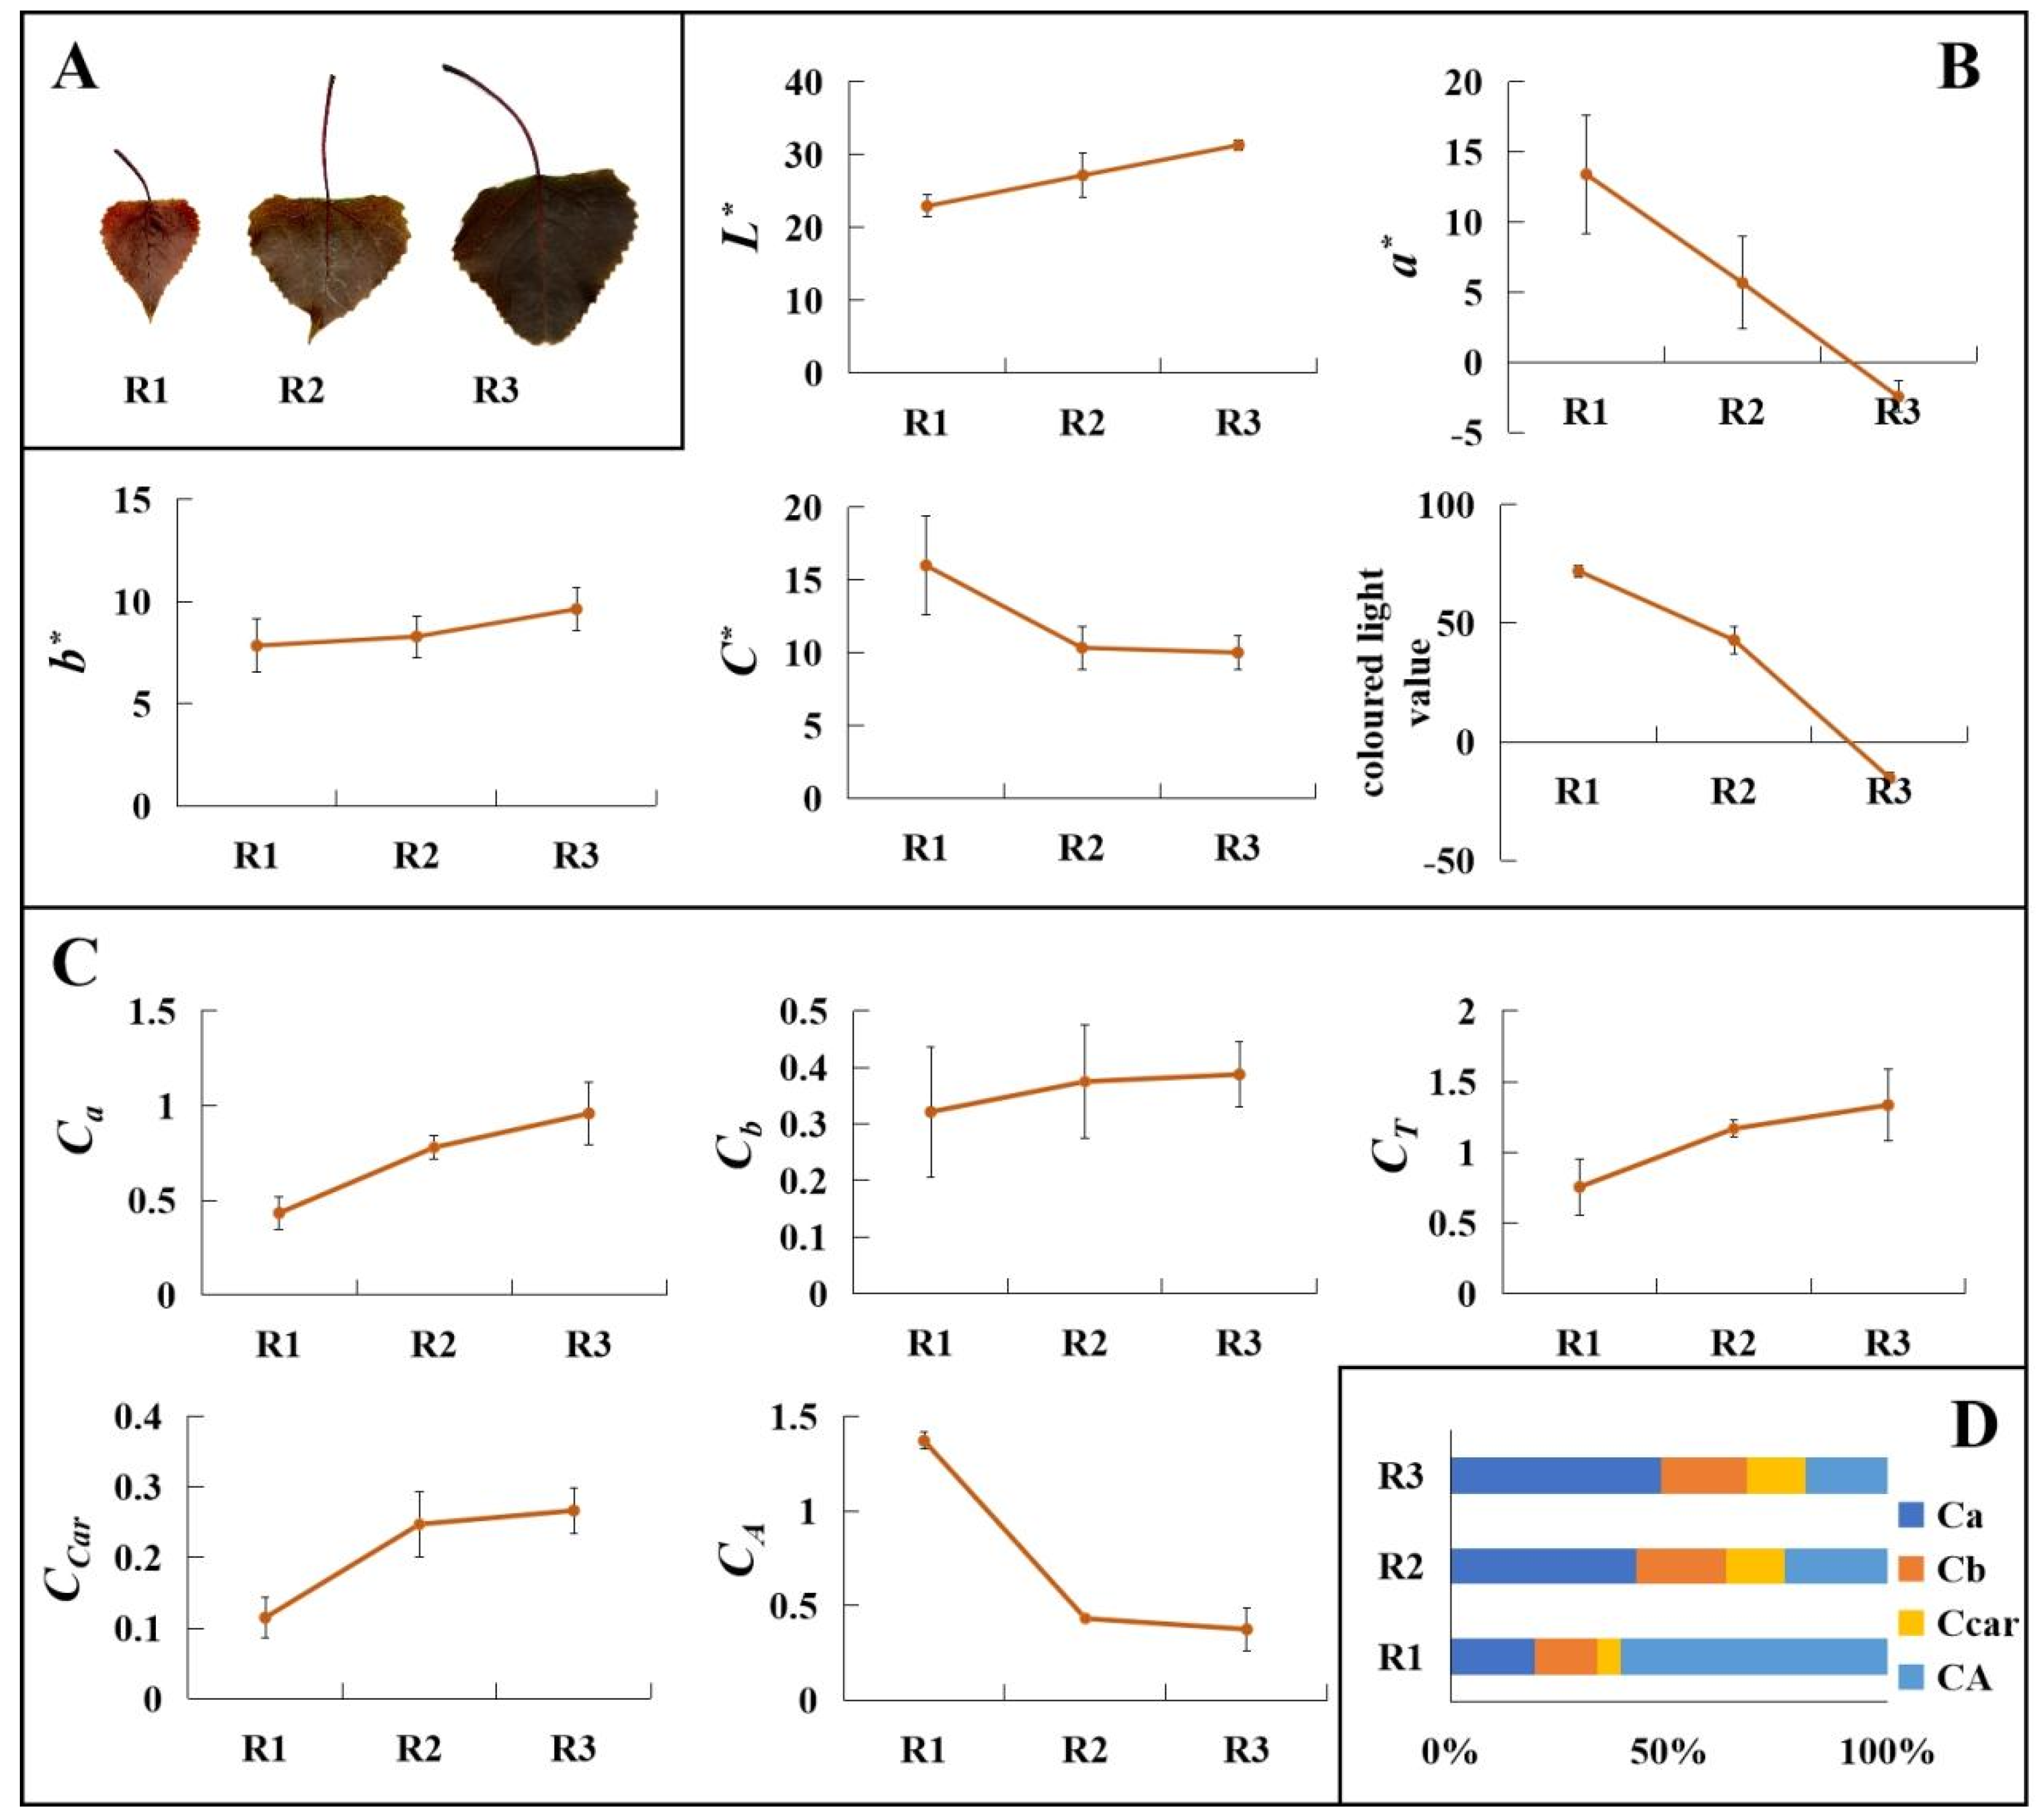
3.1. Analysis of Leaf Colour Phenotypes at Different Stages of Leaf Maturation

As the leaves matured, they gradually changed from a bright purplish red to a purplish green (Figure 1A), and the changes in the leaf color parameters at different stages of leaf maturation were analyzed (Figure 1B). We found that the lightness (L*) increased, and the hue (b*) value was positive, which means that the yellow/blue color was yellowish, and the yellowing degree increased. The hue (a*) of the R3 leaves was negative, indicating that the red/green color was greenish, and the hue (a*) and saturation (C*) tended to decrease gradually. The saturation value comprehensively reflects the color and lightness of a leaf surface. The saturation value gradually decreased, indicating that the comprehensive characteristics of leaf color and lightness showed a decreasing trend with increasing leaf development (the red color became lighter, and the lightness intensified). The greater the colored light value is, the darker the leaf redness, and the less intense the lightness; these parameters can be used as representative features to reflect the changes in the color and lightness of ‘Zhonghong’ poplar leaves.
The main leaf pigments of ‘Zhonghong’ poplar are anthocyanins, chlorophyll, and carotenoids; chlorophyll includes both chlorophyll a and chlorophyll b. The change trend of leaf pigment contents at different maturation stages is shown in Figure 1C: the content of chlorophyll a was much higher than those of carotenoids and anthocyanins. Since both chlorophyll and carotenoids are photosynthetic pigments, the change in carotenoid content in the leaves was essentially the same as that of total chlorophyll. Although the content of total anthocyanins decreased gradually, the contents of the other pigments showed a tendency to increase. Through the results of the above comparative analysis, it could be preliminarily inferred that with the decrease in anthocyanin content in the leaves of ‘Zhonghong’ poplar, the content of chlorophyll increased, and the shift from a predominance of anthocyanins (61.2%) to that of chlorophyll (67.7%) was the main factor driving the gradual transformation of the leaves from bright purplish-red to purplish-green (Figure 1D).

3.2. Sequencing Data Quality Assessment
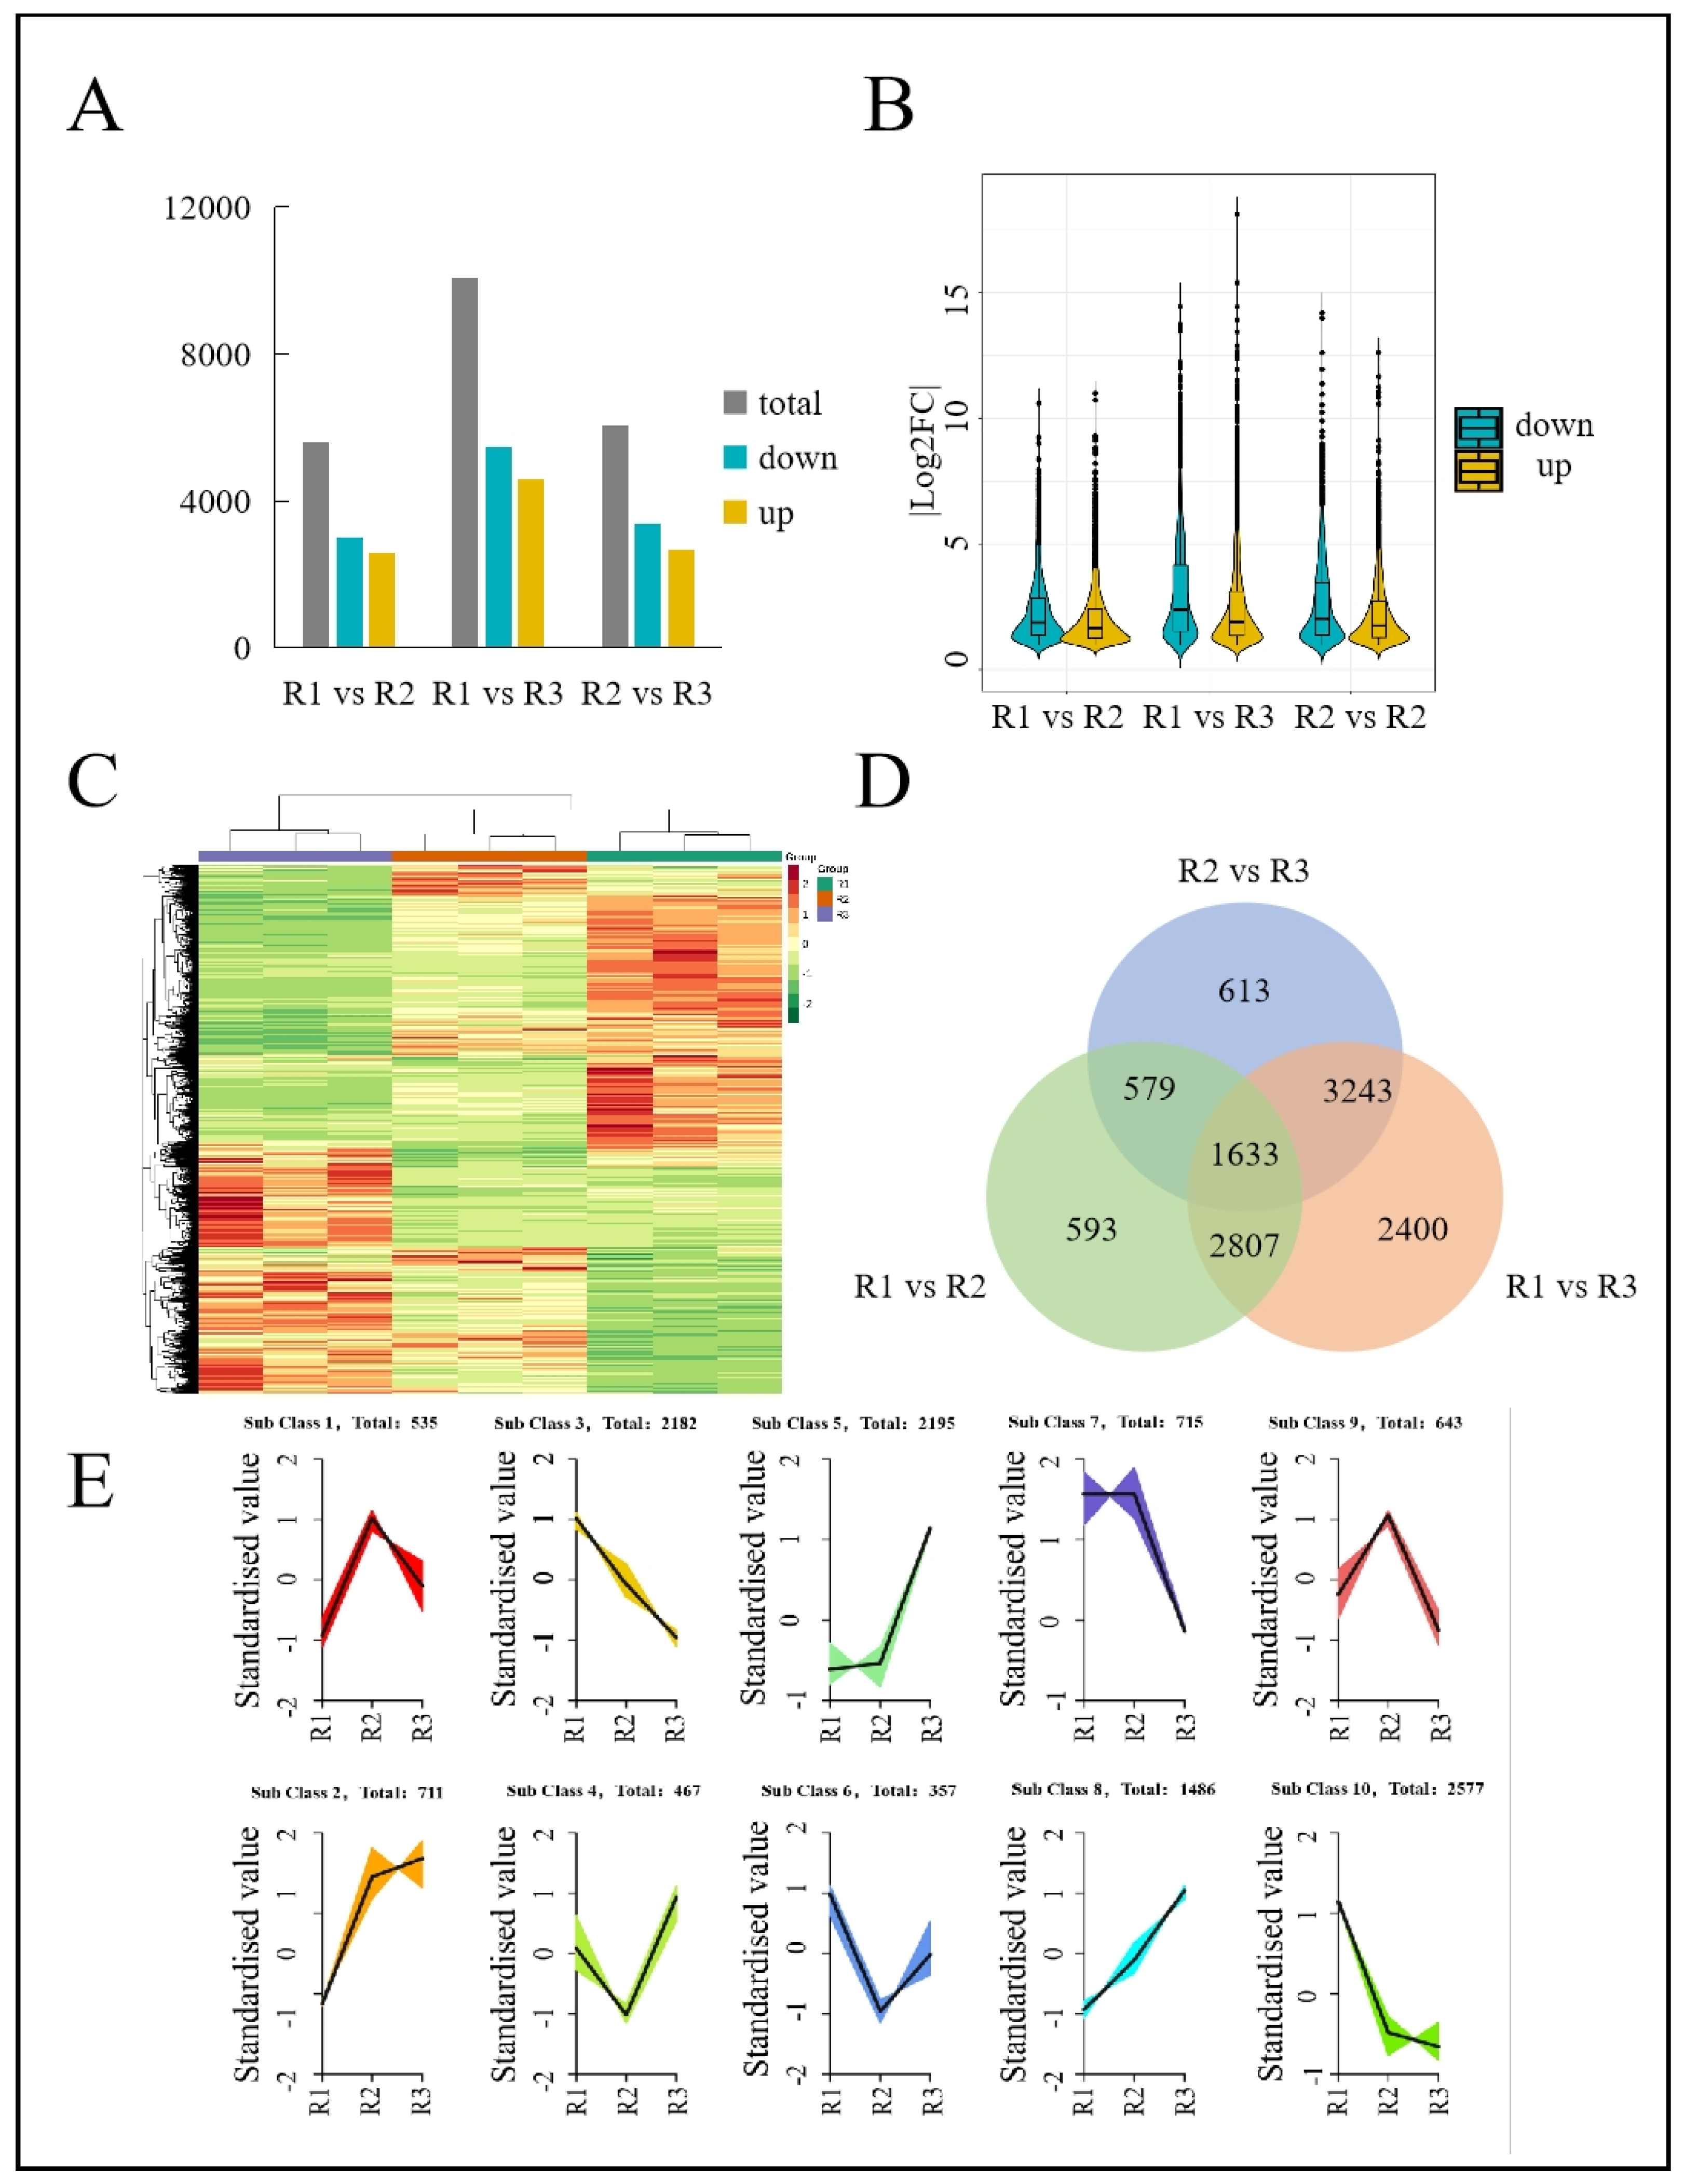
To further explore the molecular mechanisms of anthocyanin biosynthesis during leaf color change, we constructed nine cDNA libraries to analyze the transcriptome at three stages of leaf development (three biological replicates at each stage). A total of 65.86 Gb of clean data was obtained by sequencing the cDNA libraries. There were 6 Gb of clean data per sample, and the Q30 base percentage was 93.97% or more (Table S1). HISAT2 was used to compare the clean read sequences with the sequence information in the Mullein reference genome database. Most of the gene sequences matched the reference genome sequence, and the comparison percentage of each sample ranged from 82.98 to 85.53% (Table S2). Based on the location information of the reads in the genome, a total of 1273 new genes were identified (Table S3).
The expression level of the genes was measured according to the fragments per kilobase of transcript per million mapped reads (FPKM), and the gene expression of all samples was restricted to the range 2 ≥ log10(FPKM) ≥ −2. (Figure S1). The samples were subsequently subjected to principal component analysis (Figure S2) and correlation analysis (Figure S3). The Pearson correlation coefficient (R2) between samples was higher than 0.8, and the clustering was obvious, indicating that the transcriptome data were reliable for subsequent analysis. The clean data are available in the NCBI database.

3.3. DEG Analysis

DeSeq2 was used to analyze the genes differentially expressed in the leaves of ‘Zhonghong’ poplar at different times; a total of 11,868 DEGs were identified. The statistics and distribution of the DEGs in each group are shown in Figure 2A,B. With respect to the three periods of leaf color change, we identified fewer DEGs in the R1 vs. R2 comparison group (5612) than in the R2 vs. R3 comparison group (6068), indicating that with the development of the leaves, the number of DEGs involved in color regulation increased, and the related process of gene regulation became more complex. The expression level of most DEGs gradually decreased, which suggests that the biological response involved in the leaf color transformation process was mainly driven by the downregulation of genes. In addition, a heatmap was constructed to visualize the overall picture of all DEG expression patterns, to better understand the overall variation in DEG expression (Figure 2C). The expression patterns of some DEGs were consistent with the transition period, and most DEGs showed great differences in terms of their expression profiles between R1 and R3. Further analysis showed that 1633 DEGs were commonly identified in all three sets of comparative analyses (Figure 2D). To study the expression patterns of genes differentially expressed in different periods, the FPKM of the genes was centralized and standardized, and a total of 10 expression patterns were obtained by k-means cluster analysis. The results suggested that a group of genes with similar changes in their expression could have similar functions (Figure 2E).

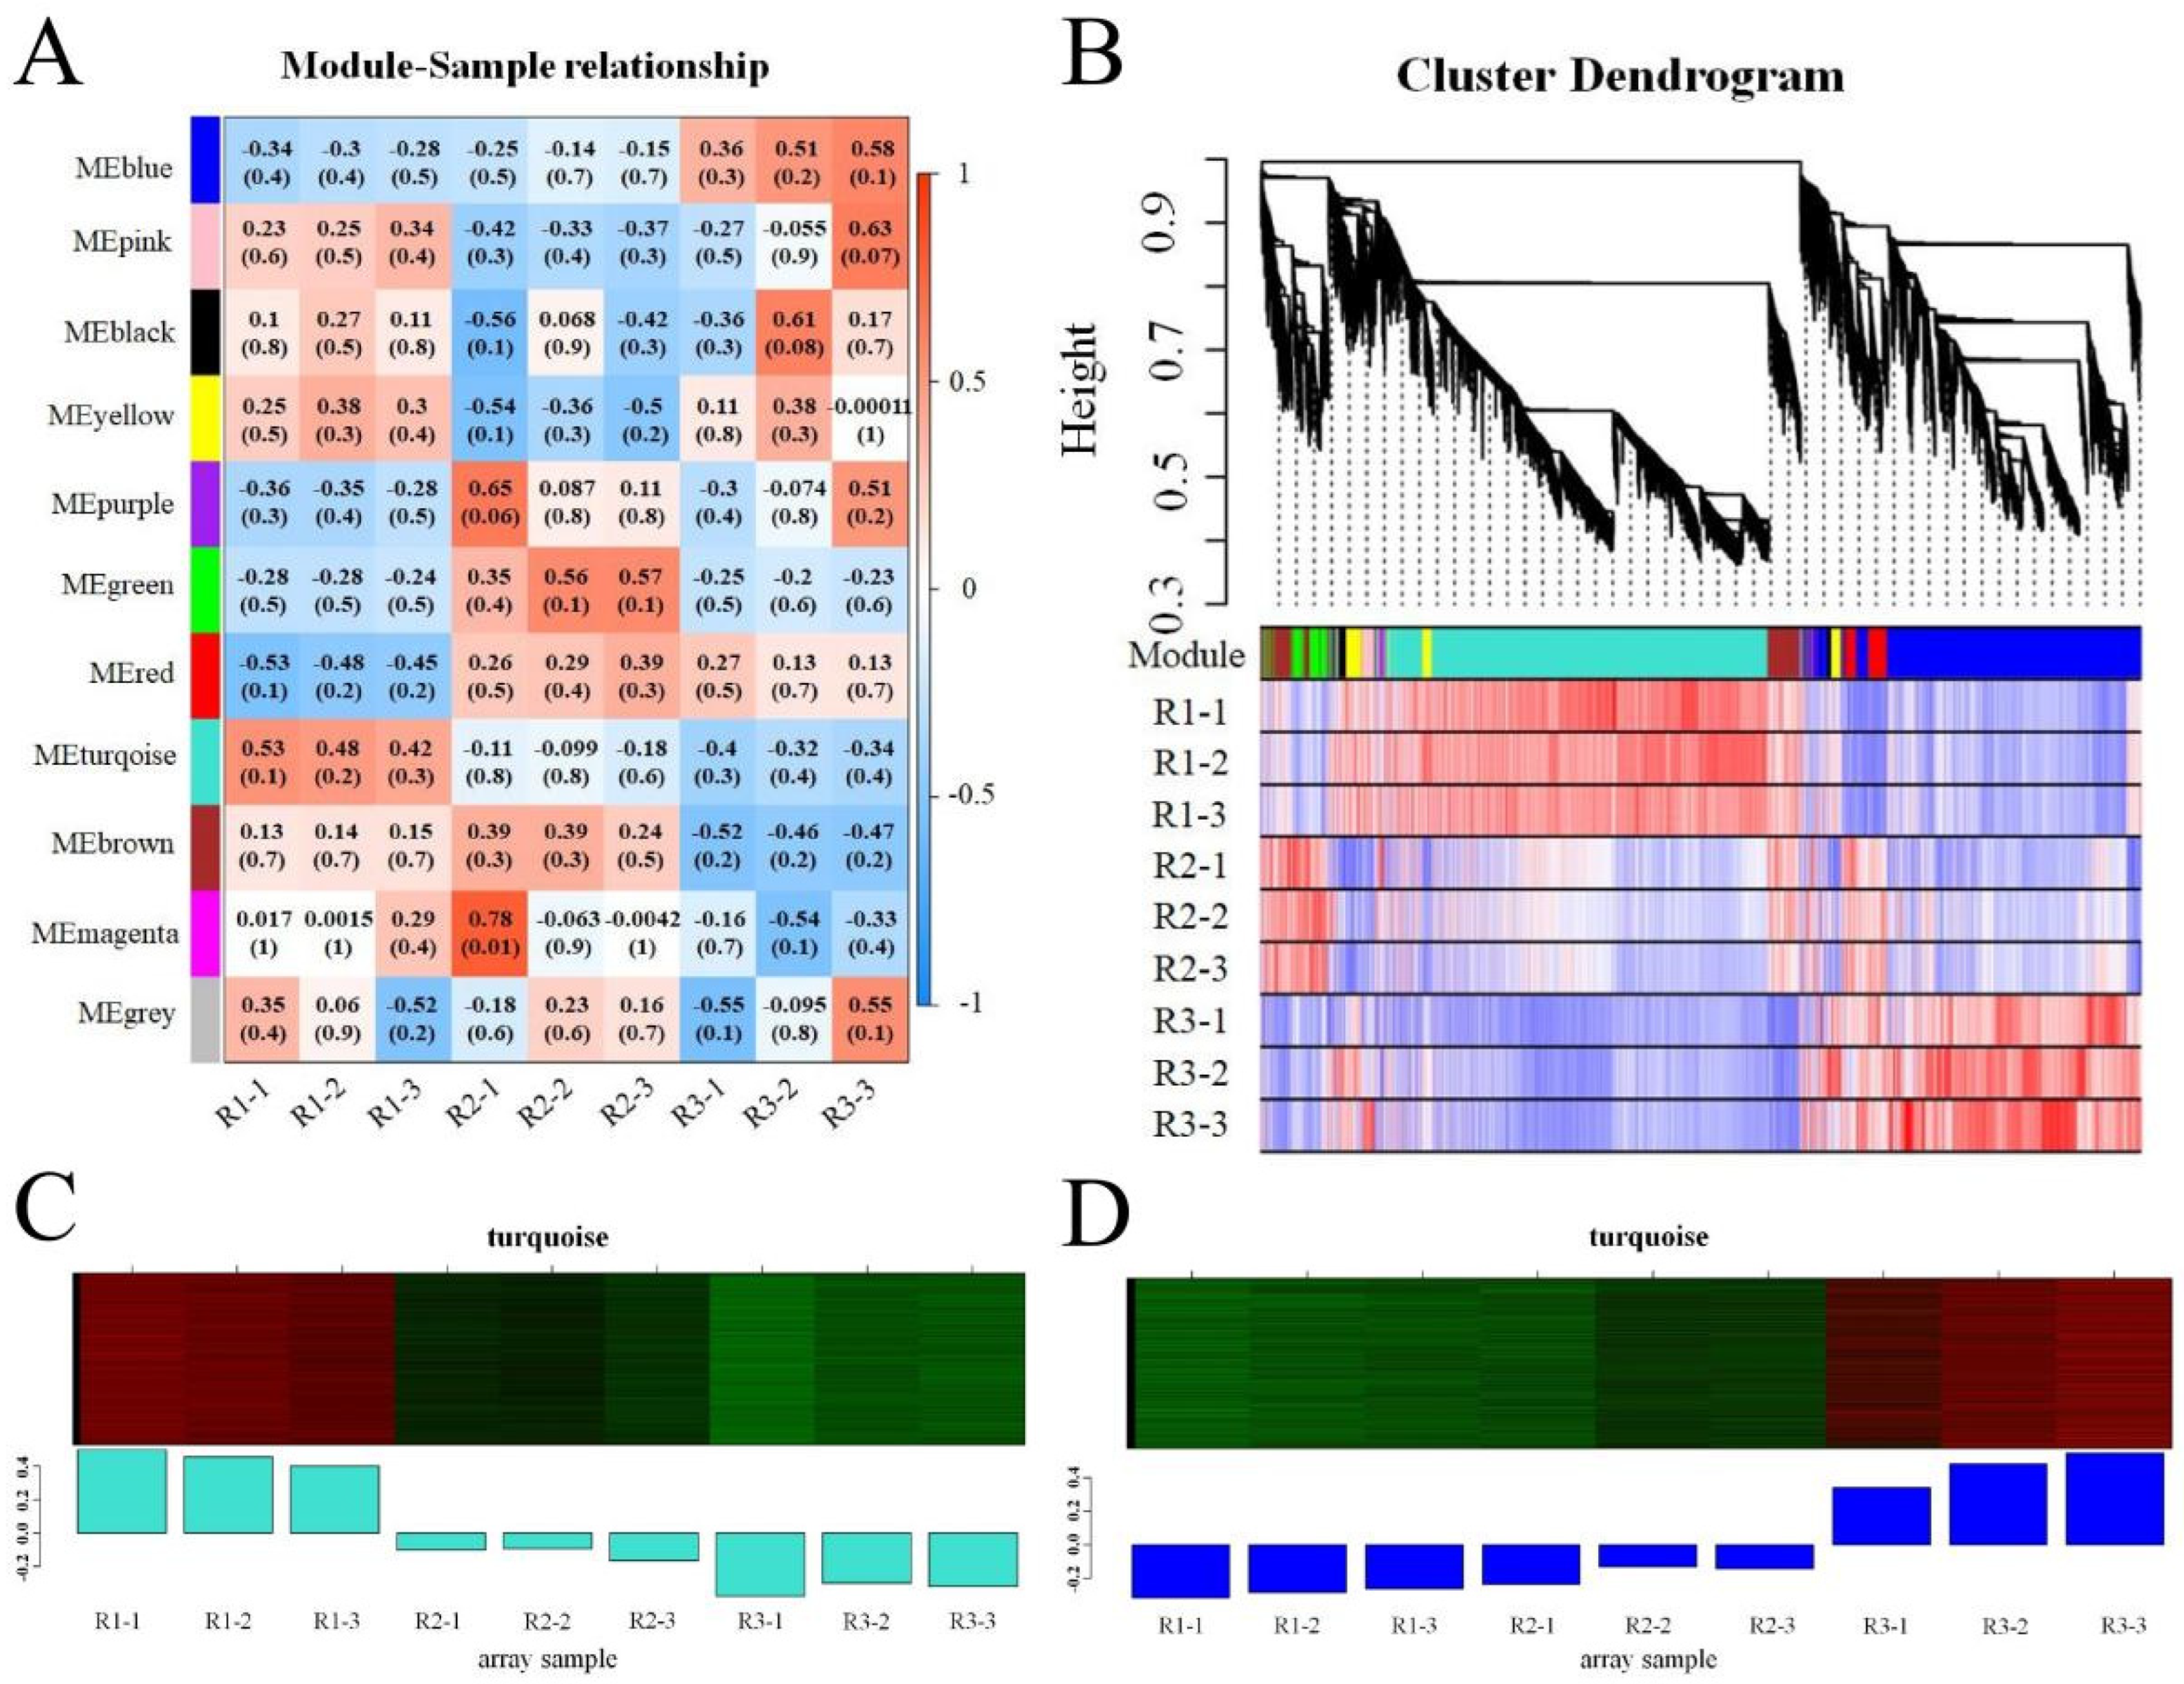
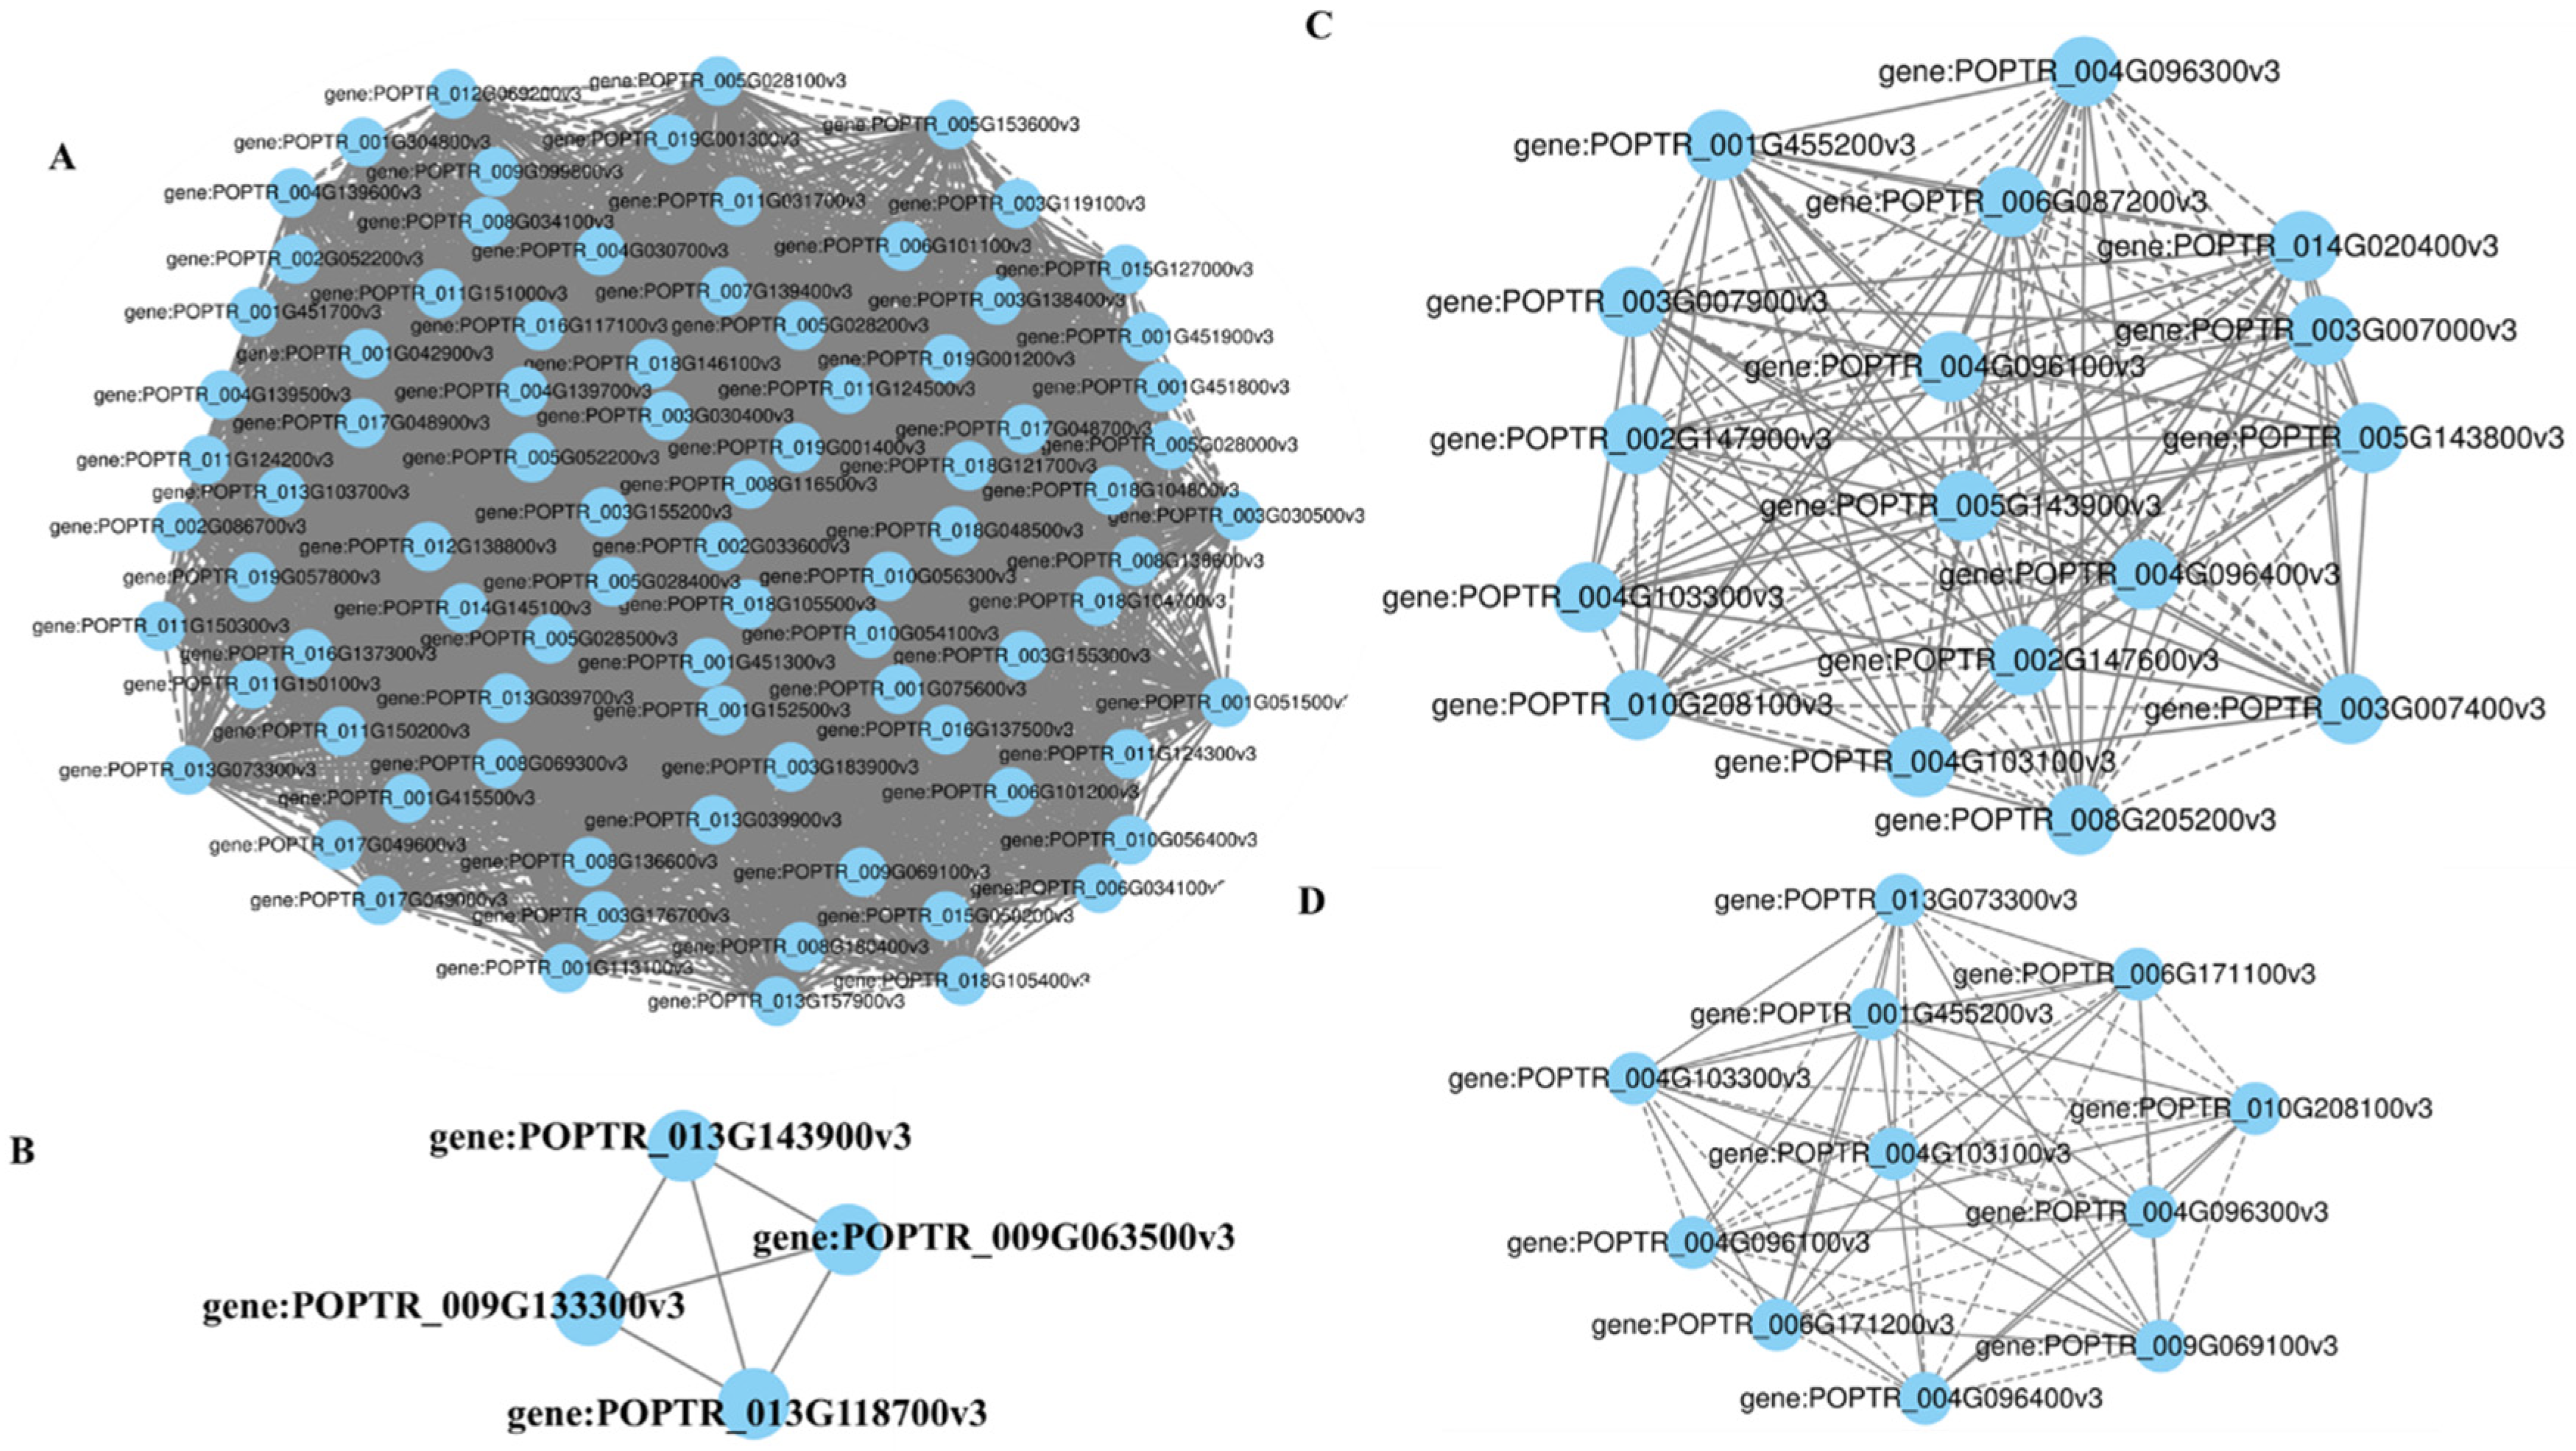
3.4. Coexpression Network Analysis

We performed a weighted gene coexpression network analysis (WGCNA) to search for genes related to anthocyanin synthesis in ‘Zhonghong’ poplar from an integrated network perspective and constructed a coexpression network involving all DEGs in the three different developmental stages. Genes with similar expression patterns were clustered into the same modules, and different modules were distinguished by color. Finally, 11 different merged modules were identified, and the subsequent analysis was performed according to the merged modules (Figure 3A). The results of a correlation analysis revealed that these modules corresponded to specific distribution patterns in different periods. The characteristic gene expression profiles of the 11 modules were analyzed, the results of which are shown in Figure 3B. The genes of the blue-green module had higher expression levels in stage 1 and lower expression levels in stage 3, consistent with the change in anthocyanin production (Figure 3C). The genes of the blue module had higher expression levels in stage 3 and lower expression levels in stage 1, indicating an opposite trend with respect to the change in anthocyanin production (Figure 3D).
To understand the biological processes associated with the genes of the different modules and identify the categories of enriched pathways linked to the genes in each module, the genes in the blue-green and blue modules were further annotated by GO, KEGG, and KOG enrichment analysis (Figure S4). The DEGs of the blue and blue-green modules were extensively annotated in pathways such as RNA degradation, RNA transport, biosynthesis of secondary metabolites, carotenoid biosynthesis, glutathione metabolism, metabolic pathways, phenylpropanoid biosynthesis, and porphyrin and chlorophyll metabolism; these DEGs were also significantly enriched in the biosynthesis of various secondary in metabolites, terpenoid backbone biosynthesis, metabolic pathways, carotenoid biosynthesis, and porphyrin and chlorophyll metabolism. According to the results of the KOG analysis of the DEGs, the blue modules were mainly enriched in pathways related to posttranslational modification, protein turnover, chaperones, and signal transduction mechanisms. Similarly, the blue-green modules were mainly enriched in posttranslational modification, protein turnover, chaperones, translation, ribosomal structure and biogenesis, and protein function.

3.5. Functional Annotation and Enrichment Analysis of DEGs

The DEGs were classified into three categories of GO functional annotations, namely, biological processes, cellular components, and molecular functions, and the types and quantities of annotations for each category were different. The numbers of DEGs in the three developmental stage comparison groups were different, but the main enriched entries were very similar. In the biological process category, the DEGs were mainly associated with subcategories including metabolic processes, cellular processes, stress responses, biological regulation, and biological process regulation. In the category of cellular components, the DEGs were mainly associated with subcategories such as cells, cell parts, organelles, membranes, and membrane parts. In the molecular function category, the DEGs were mainly associated with subcategories such as catalytic activity, linkage, transcriptional regulator activity, transport activity, and molecular function regulation.
The DEGs associated with the accumulation of flavonoids and anthocyanins were subjected to KEGG functional enrichment analysis, and the metabolic pathways of the DEGs were determined. In the R1 vs. R2 comparison, metabolic pathways were enriched in the most DEGs, photosynthesis-antenna proteins were highly enriched in DEGs, and monoterpene biosynthesis was the pathway most significantly enriched in DEGs. In the R1 vs. R3 comparison, biosynthesis of secondary metabolites was enriched in most DEGs, the enrichment of caffeine metabolism was the greatest, and the biosynthesis of secondary metabolites was the most significantly enriched in DEGs. In the R2 vs. R3 comparison, ribosomes were enriched in most DEGs, and ABC transport was the pathway most significantly enriched in DEGs. Taken together, these findings indicated that some DEGs in leaves at different stages were related to the synthesis pathways of monoterpenes and secondary metabolites. Based on the results of the functional annotation and enrichment analysis, the following metabolic pathways related to anthocyanin synthesis were identified: the phenylpropane biosynthesis pathway (ko00940), the flavonoid biosynthesis pathway (ko00941), the anthocyanin biosynthesis pathway (ko00942), the flavonoid biosynthesis pathway (map00943), and the flavonoid and flavonol biosynthesis pathway (map00944).

3.6. Analysis of DEGs Related to Anthocyanin Synthesis

Factors that affect leaf color formation mainly include structural genes and regulatory genes. Based on the functional classification and enrichment analysis results of the DEGs via the GO, KEGG, and KOG databases, 24 differentially expressed structural genes associated with flavonoid metabolic pathways, anthocyanin biosynthesis, and phenylpropane biosynthesis were identified. Each gene had multiple transcripts, and those that were differentially expressed in the R1 vs. R2, R1 vs. R3, R2 vs. R3 comparisons as well as those that were downregulated included dihydroflavonol 4-reductase (DFR), BZ1, HCT, and FLS. In addition, the gene POPTR_008G138600v3 (DFR) was upregulated in all three comparisons, and the expression of multiple transcripts of the POPTR_009G133300v3 (BZ1) and ANS, CHS, and 3AT genes decreased during the three periods, which is consistent with the leaf color changes (Figure 4).
The correlation network of DEGs involved in flavonoid biosynthesis (ko00941), anthocyanin biosynthesis (ko00942), isoflavone biosynthesis (ko00943), and biosynthesis of flavonoids and flavonols (ko00944) is shown in Figure 5. There was a positive correlation between anthocyanin 3-O-glycoside 6′′-O-POPTR_009G063500v3 and three anthocyanin 3-O-glucosyltransferases (BZ1:POPTR_009G133300v3, POPTR_013G118700v3, POPTR_013G143900v3) in the anthocyanin biosynthesis regulatory network. In the flavonoid biosynthesis pathway, a complex regulatory relationship involving CYP73A, caffeoyl-coenzyme A O-methyltransferase, CHS, CHI, ANS, FLS, CYP75B1, ANR, HCT, LAR, DFR, CYP75A, codeine 3-O-demethylase, and salicylic acid 3-hydroxylase appeared.

3.7. Transcription Factor (TF) Analysis

TFs are the main proteins that control biological metabolic processes. During the leaf color change period in ‘Zhonghong’ poplar, we identified a total of 149 DEGs encoding TFs in the three R1 vs. R2, R1 vs. R3, and R2 vs. R3 comparisons. Of the 121 DEGs encoding TFs, 90 were consistently downregulated in terms of their expression in all three periods, and 31 were upregulated: 13 AP2, 7 B3, 6 basic helix–loop–helix (bHLH), 3 bZIP, 6 C2C2, 5 C2H2, 4 GRF, 9 HB, 2 HSF, 2 HMG, 11 MYB and MYB-related, 8 NAC, 4 WRKY, and 6 zf-HD genes encoding TFs, as well as others. These 121 TFs are thought to be important factors regulating differences in anthocyanin synthesis at different developmental stages of ‘Zhonghong’ poplar leaves (Figure 6).

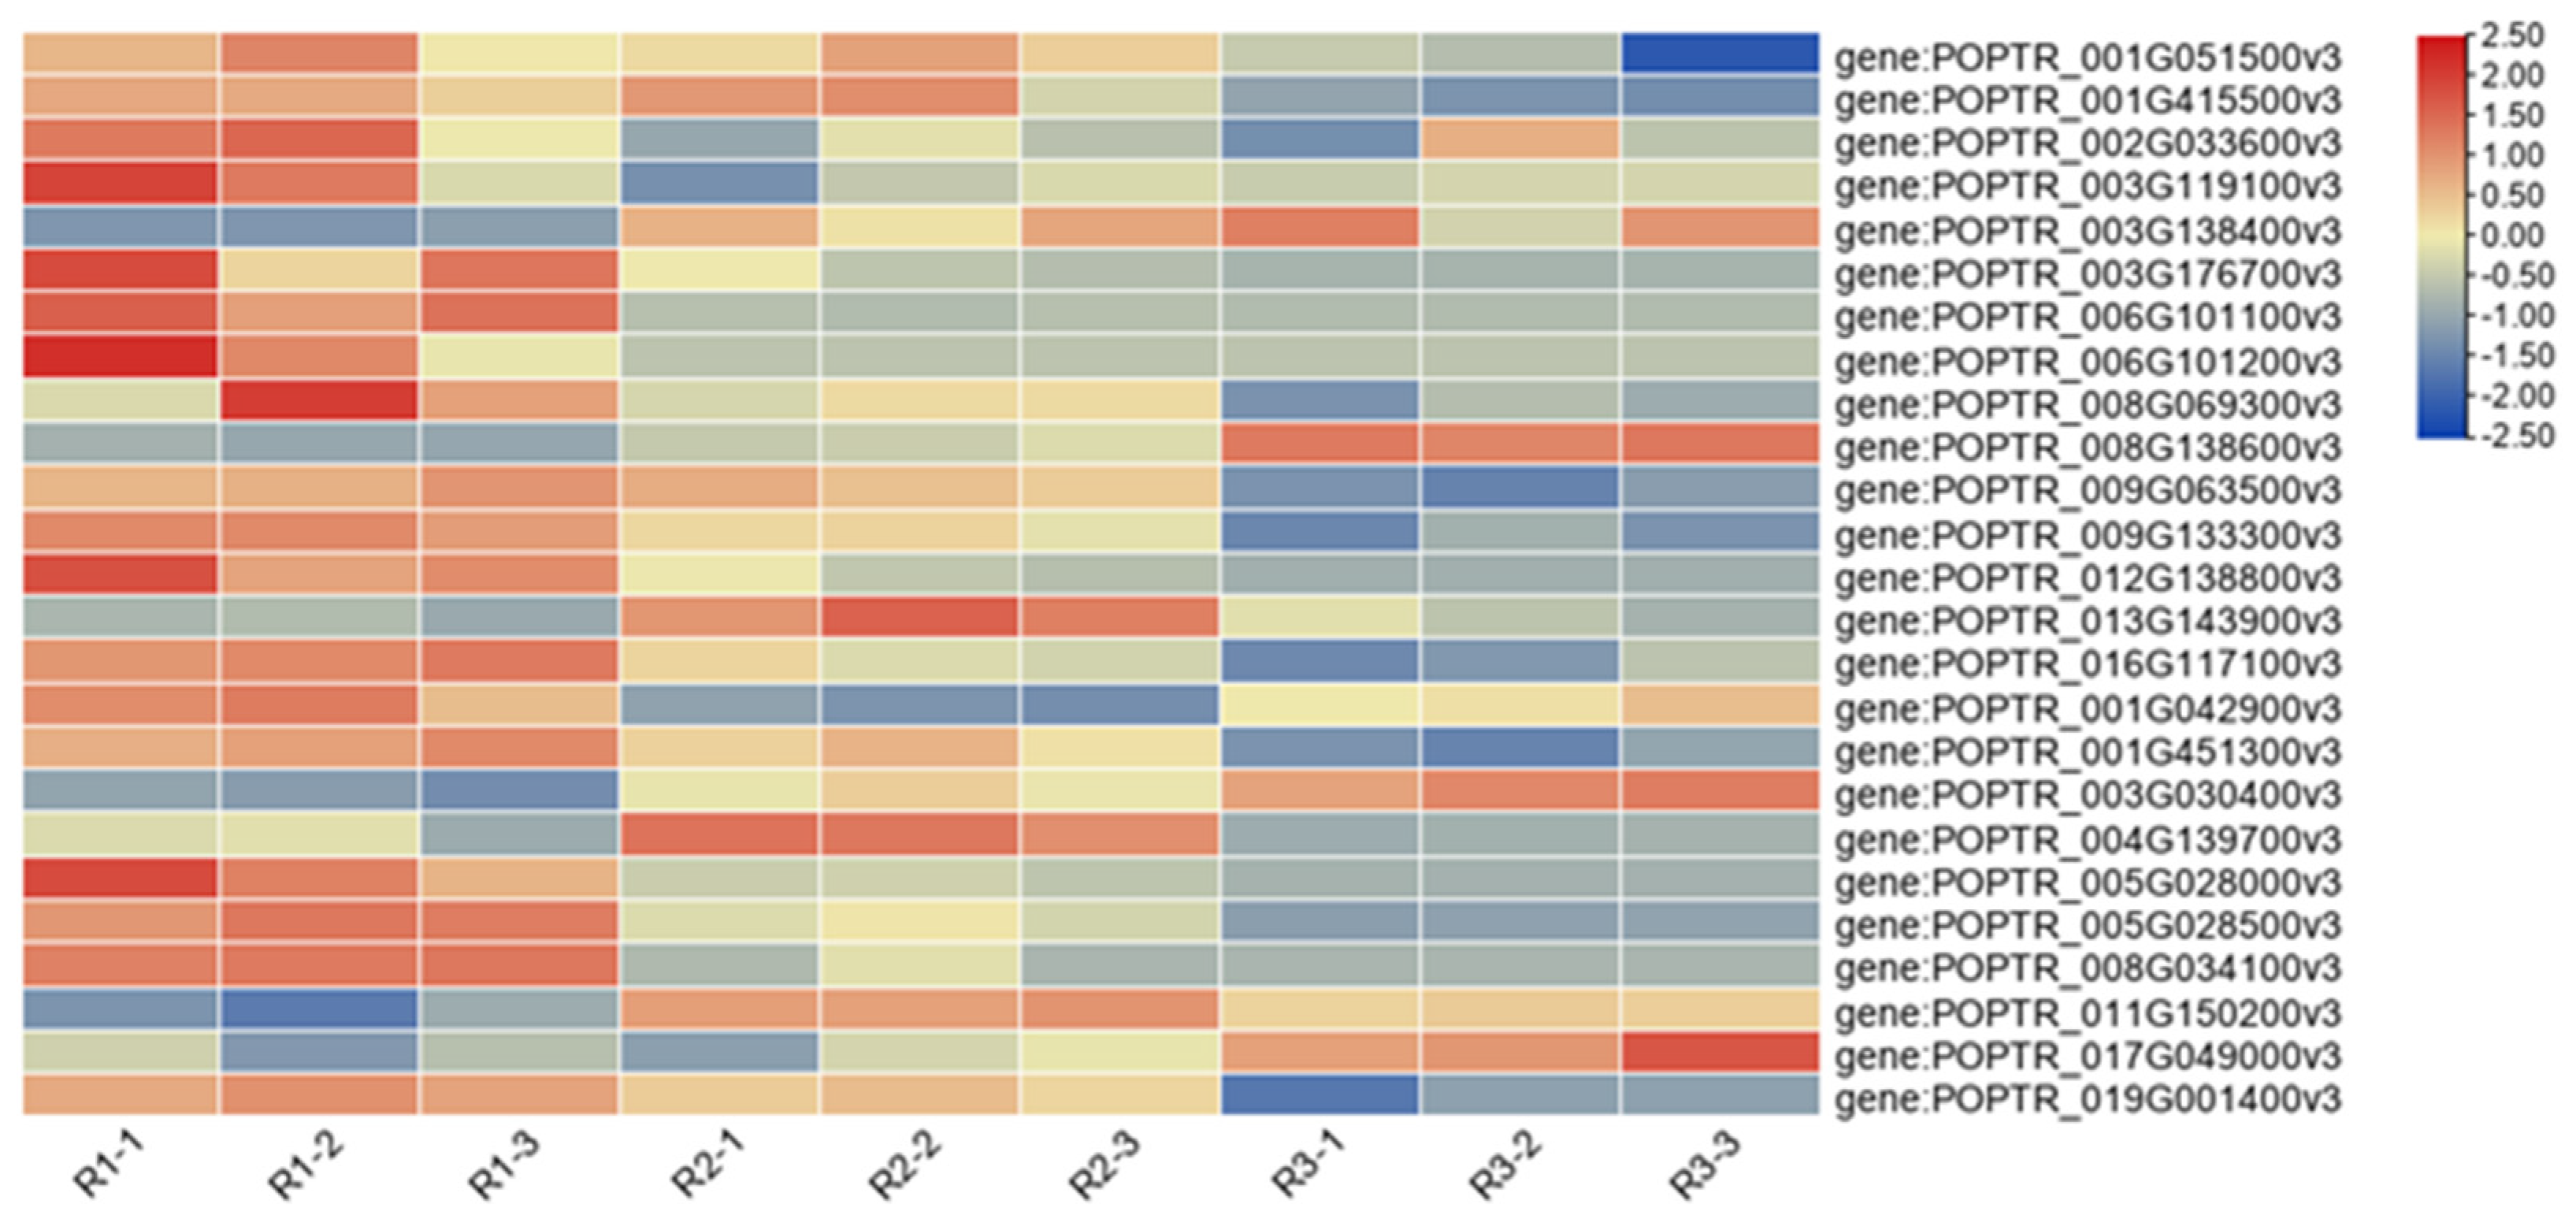
3.8. qRT-PCR-Based Verification of DEGs

To confirm the expression patterns of candidate genes identified in the transcriptome data, 10 key DEGs (Table S4, Figure S5) involved in the main pathways of anthocyanin accumulation were successfully validated via qRT-PCR analysis. Although the level of expression was not exactly the same, the expression trends were consistent with the RNA-seq expression data, confirming the reliability of the current RNA-seq data and the computational analysis results, enabling subsequent DEG analysis.

4. Discussion

As ‘Zhonghong’ poplar leaves mature, their brightness (L*) and yellowing (b*) increase, while their redness (a*), saturation (C*), and chromatic value decrease; the color of new leaves is red and bright, and the chromaticity varies in a wide range. The values of these parameters are significantly different and can be used as representative to describe the color change of ‘Zhonghong’ poplar leaves. As the leaves matured, the content of total anthocyanin in the leaves of ‘Zhonghong’ poplar decreased sharply, while the content of chlorophyll and carotenoids first increased and then decreased. A high content and a high proportion of anthocyanins play important roles in the appearance of leaf traits [26]. The different colors of plant tissues are determined by the ratio and distribution of three pigments (chlorophyll, carotenoids, flavonoids/anthocyanins) [27]. In green-leaf plants, the proportion of chlorophyll is high; in yellow-leaf plants, the proportion of carotenoids is high; in purple- and blue-leaf plants, anthocyanins account for more than the other two pigments [28]. The flavonoids involved in color formation are mainly anthocyanins, which give flowers, fruits, and other plant tissues their characteristic red, purple, and blue colors. Many transgenic experiments have shown that the red color of plant leaves is related to the overexpression of genes promoting anthocyanin synthesis [29,30,31]. However, in this study, it was found that the leaves of ‘Zhonghong’ poplar also had a high chlorophyll content, and the final leaf color was determined by the ratio of the leaf chlorophyll content to the anthocyanin content. Therefore, the high ratio of total anthocyanin content to chlorophyll content in the leaves of ‘Zhonghong’ poplar may be the physiological mechanism underlying the bright red color of the leaves of ‘Zhonghong’ poplar.
The leaves of many plants in nature gradually become less red as they develop. Hughes found that the anthocyanin content of newborn young leaves was high, and as the fenestra tissue differentiated significantly, the accumulation of anthocyanin decreased, but the chlorophyll content tended to increase at the same time, resulting in the phenomenon of reddening [32]. Since anthocyanins absorb light in both the visible and the UV regions, their accumulation in developing young leaves can act as a kind of “sunscreen”, protecting the leaves, especially their photosynthetic machinery, from the damaging UV rays as well as the high-intensity photoinhibition caused by visible light. As the leaves mature and form protective waxes that reflect the sunlight, providing photoprotection, they typically change from red to green. This loss of red pigmentation may be due to the increased chlorophyll accumulation during leaf expansion and growth, the termination of anthocyanin biosynthesis, and the slowing of growth, or anthocyanin degradation that is actively induced when it is no longer needed as a photoprotectant. In heathy plants, anthocyanin concentration is directly related to the age of the leaf; anthocyanin concentration is higher in young leaves, and as the leaf develops, it gradually decreases due to dilution and degradation, resulting in green leaf traits. The decrease in anthocyanin concentration as the leaves matured in this study was due partly to the dilution of the pigment in the growing tissue and partly to the degradation process that actually occurred. In some plants, the change from red young leaves to mature green leaves is not due to the degradation of anthocyanins but simply to increased chlorophyll synthesis, termination of anthocyanin synthesis, and accumulation of anthocyanins caused by the dilution effect in the leaves.
The transcriptome revealed a large-scale upregulation of genes involved in the flavonoid and anthocyanin biosynthetic pathways. Our study found that some structural genes, i.e., DFR, BZ1, ANS, CHS, 3AT, HCT, and FLS, were differentially expressed. Among these DEGs, some were involved in flavonoid biosynthesis and anthocyanin biosynthesis pathways. According to some studies, HCT genes are mainly involved in chlorogenic acid biosynthesis and lignin biosynthesis pathways [33]. ANR catalyzes the reduction of anthocyanins to synthesize epicatechin and epigallocatechin. UFGT glycosylation makes anthocyanins more stable [34,35]. Studies have revealed that there is a competitive relationship between ANR and UFGT. The upregulation of ANR expression increases the procyanidin catechin content and decreases the anthocyanin content [36,37]. Genes related to the flavonoid pathway can be divided into structural genes directly involved in flavonoid production and regulatory genes that control the expression of structural genes. In a study of blue grape hyacinth, it was found that substrate competition among metabolites may occur. Flavonol synthase (FLS) competes with flavonoid substrates for DFR, resulting in the elimination of blue pigments and a lower cyanidin content in white flower mutants than in blue flowers [38]. Through the analysis of flavonoid pathway gene expression, studies have shown that the red or purple leaf color traits of many transgenic plants are related to the overexpression of genes related to anthocyanin synthesis [29,30,31]. Compared with wild-type plants, transgenic tomato plants overexpressing AtPAP2 accumulated more anthocyanins [39], and poplar plants overexpressing PtrMYB119 accumulated more anthocyanins [31]. We found that the expression of BZ1, DFR, ANS, CHS, HCT, FLS, and 3AT biosynthetic genes decreased with increasing leaf growth and development. Their downregulated expression with increasing leaf growth and development is consistent with a role in anthocyanin and flavonoid biosynthesis.
In addition to substrate competition, plant leaf color differences may also be due to TFs. Flavonoid biosynthesis is driven by three types of TFs, namely, R2R3-MYBs, bHLH proteins, and WD40 repeat proteins, which form a MYB–bHLH–WD40 TF complex [38,40]. Among the components of this complex, MYBs are the main factors determining anthocyanin production [6]. Our results identified transcription factors that may be associated with leaf aging and anthocyanin changes during aging, such as MYB102, MYB73, MYB8, MYB306, MYB108, MYB90, and MYB113. Previous studies in rice showed a signaling response of MYB102 through the downregulation of ABA accumulation during leaf senescence [41]. In apple, MYB306 was shown to regulate anthocyanin synthesis by suppressing DFR gene expression [42] Our study also found that MYB102 and MYB306 expression was upregulated as the leaves matured, which was consistent with the leaf phenotype. However, at the same time, we found that MYB108 was highly expressed in senescing petals by ethylene signaling in moonflower petals, while in our results, MYB108 expression gradually decreased with leaf senescence, which may be due to the difference between flowering plants and trees [43]. Some transcription factors that promote anthocyanin synthesis, i.e., MYB8, MYB90, and MYB113, showed a tendency to be downregulated as the leaves matured, but MYB113 still retained a high expression, probably because MYB113 is mainly expressed in mature leaves [44,45]. Jiao’ results suggested that MYB73 is involved in SA and JA signaling pathways [46], and a study showed that ethylene and jasmonic acid affect anthocyanin synthesis [47]. A previous study showed that, when the JMJ25 gene is overexpressed, its product can bind to the TF MYB182 locus and demethylate its chromatin, thereby inhibiting the expression of structural genes involved in the anthocyanin biosynthesis pathway in poplar, resulting in a decrease in anthocyanin content; gene expression levels negatively regulate the synthesis and accumulation of anthocyanins [48]. By analyzing our transcriptomic data, we identified several key genes encoding TFs of these three families that may regulate poplar flavonoid and anthocyanin production. Among them, the transcript abundance of three R2R3-MYB TFs was altered in all the leaves, suggesting that these TFs may play a key role in leaf color determination. These results suggest that these MYBs have important roles, but their functions in flavonoid or anthocyanin biosynthesis need to be further investigated via functional analysis.

5. Conclusions

In this study, the transcriptomes of ‘Zhonghong’ poplar red leaves in three developmental periods were sequenced and analyzed. A total of 11,868 DEGs were identified by pairwise comparison. GO and KEGG annotations and enrichment analysis found that the differentially expressed genes primarily regulate biological processes such as metabolic processes, cellular processes, stress responses, bioregulation, and bioprocess regulation. During the leaf color transchromation period, a total of 24 genes related to anthocyanins were screened, and by comparing gene expression in leaves at different developmental stages, structural genes such as DFR, BZ1, ANS, CHS, 3AT, HCT, and FLS appeared to be expressed differently in different samples; we speculate that these genes mediate the regulation of leaf color in ‘Zhonghong’ poplar during the transient phase through mechanisms such as flavonoid biosynthesis, anthocyanin biosynthesis, isoflavone biosynthesis, and flavonoid and flavonol biology. Transcriptome data provide valuable information and gene sequences for future studies on the variation of related genes during the transcolorization of ‘Zhonghong’ poplar leaves and lay a foundation for further research to confirm the precise mechanisms by which transcription factors regulate anthocyanin biosynthesis and degradation.

Supplementary Materials

The following are available online at https://www.mdpi.com/article/10.3390/agronomy12102396/s1, Figure S1: The expression violin plot shows the distribution status and probability density of the sample data, Figure S2: Pearson correlation between samples, Figure S3: 2D PCA Plot, Figure S4: Enrichment maps of genes in the turquoise and blue modules for GO, KEGG, and KOG, Figure S5: Consistency of genes in the qRT-PCR and transcriptome results. Table S1: Sequencing output statistics table, Table S2: Comparison statistics table, Table S3: Novel genes annotation table, Table S4: Primer sequences used for qRT-PCR.

Author Contributions

J.Z., L.H. and M.C. were the executors of the experimental design and experimental research of this study; M.C. completed the data analysis and wrote the first draft of the paper; H.L. and W.Z. participated in the experimental design and the analysis of the experimental results; J.Z. and L.H. were the creators and leaders of the project, directing experimental design, data analysis, and thesis writing and revision. All authors have read and agreed to the published version of the manuscript.

Funding

This research was funded by the Opening Project of State Key Laboratory of Tree Genetics and Breeding (K2022201); Key R & D and Promotion Project of Henan Province (Science and Technology Research) (202102110229).

Data Availability Statement

Transcriptome datasets are available in the National Center for Biotechnology Information under BioProject PRJNA881405 (https://dataview.ncbi.nlm.nih.gov/?search=SUB12061013&archive=bioprojet (accessed on 31 October 2021)).

Conflicts of Interest

The authors declare no conflict of interest.

References

  1. Yang, S.; Zhu, Y. Selection and Breeding of Populus Hongye; Northwestern Polytechnical University Press: Xian, China, 2018. [Google Scholar]
  2. Zhu, Y.; Cheng, X. A new poplar variety ‘Zhonghongyang’. For. Sci. 2008, 10, 173–174. [Google Scholar]
  3. Chen, X. Research on the Attrition Phenomenon of Red Leaf Poplar; Henan Agricultural University: Zhengzhou, China, 2012. [Google Scholar]
  4. Yang, S.; Zhu, Y.; Ma, Y.; Yan, Z.; Ding, X. Correlation between leaf color and pigment composition of Poplar in the growing season. J. Northeast For. Univ. 2013, 41, 63–68. [Google Scholar]
  5. Gentile, D.; Patamia, V.; Fuochi, V.; Furneri, P.M.; Rescifina, A. Analysis of differences in anthocyanin metabolism by transcriptome sequencing of two species of Toona sinensis at different stages. Mol. Plant Breed. 2022, 20, 422–434. [Google Scholar]
  6. Wang, L.; Lu, W.; Ran, L.; Dou, L.; Yao, S.; Hu, J.; Fan, D.; Li, C.; Luo, K. R2R3-MYB transcription factor MYB6 promotes anthocyanin and proanthocyanidin biosynthesis but inhibits secondary cell wall formation in Populus tomentosa. Plant J. 2019, 99, 733–751. [Google Scholar] [CrossRef] [PubMed]
  7. Yoshida, K.; Ma, D.; Constabel, C.P. The MYB182 Protein Down-Regulates Proanthocyanidin and Anthocyanin Biosynthesis in Poplar by Repressing Both Structural and Regulatory Flavonoid Genes. Plant Physiol. 2015, 167, 693–710. [Google Scholar] [CrossRef] [Green Version]
  8. Kiferle, C.; Fantini, E.; Bassolino, L.; Povero, G.; Spelt, C.; Buti, S.; Giuliano, G.; Quattrocchio, F.M.; Koes, R.; Perata, P.; et al. Tomato R2R3-MYB Proteins SlANT1 and SlAN2: Same Protein Activity, Different Roles. PLoS ONE 2015, 10, e0136365. [Google Scholar] [CrossRef] [Green Version]
  9. Mazza, G.; Miniati, E. Anthocyanins in Fruits, Vegetables, and Grains, 1st ed.; CRC Press: Boca Raton, FL, USA, 1993; p. 384. [Google Scholar]
  10. Mori, K.; Goto-Yamamoto, N.; Kitayama, M.; Hashizume, K. Loss of anthocyanins in red-wine grape under high temperature. J. Exp. Bot. 2007, 58, 1935–1945. [Google Scholar] [CrossRef]
  11. Vaknin, H.; Bar-Akiva, A.; Ovadia, R.; Nissim-Levi, A.; Forer, I.; Weiss, D.; Oren-Shamir, M. Active anthocyanin degradation in Brunfelsia calycina (yesterday–today–tomorrow) flowers. Planta 2005, 222, 19–26. [Google Scholar] [CrossRef] [PubMed]
  12. Gonnet, J.F. Colour effects of co-pigmentation of anthocyanins revisited-1. A colorimetric definition using the CIELAB scale. Food Chem 1998, 63, 409–415. [Google Scholar] [CrossRef]
  13. Zhao, D.Q.; Tao, J. Recent advances on the development and regulation of flower color in ornamental plants. Front. Plant Sci. 2015, 6, 261. [Google Scholar] [CrossRef] [Green Version]
  14. Zhu, Z.; Lu, Y. Plant color mutants and the anthocyanin pathway. Chin. Bull. Bot. 2016, 51, 107–119. [Google Scholar]
  15. Liu, X.Y.; Han, H.Q.; Ge, H.Y.; Jiang, M.M.; Chen, H.Y. Cloning, expression and interaction of anthocyaninrelated transcription factors SmTTG1, SmGL3 and SmTT8 in eggplant. Acta Hortic. Sin. 2014, 41, 2241–2249. [Google Scholar]
  16. Daehwan, K.; Ben, L.; Salzberg, S.L. HISAT: A fast spliced aligner with low memory requirements. Nat. Methods 2015, 12, 357–360. [Google Scholar]
  17. Love, M.I.; Huber, W.; Anders, S. Moderated estimation of fold change and dispersion for RNA-seq data with DESeq2. Genome Biol. 2014, 15, 550. [Google Scholar] [CrossRef] [Green Version]
  18. Varet, H.; Brillet-Guéguen, L.; Coppée, J.Y.; Dillies, M.A. SARTools: A DESeq2- and edgeR-based R pipeline for comprehensive differential analysis of RNA-seq data. PLoS ONE 2016, 11, e157022. [Google Scholar] [CrossRef] [Green Version]
  19. Kanehisa, M.; Araki, M.; Goto, S.; Hattori, M.; Hirakawa, M.; Itoh, M.; Katayama, T.; Kawashima, S.; Okuda, S.; Tokimatsu, T.; et al. KEGG for linking genomes to life and the environment. Nucleic Acids Res. 2008, 36, 480–484. [Google Scholar] [CrossRef] [PubMed]
  20. Tatusov, R.L.; Koonin, E.V.; Lipman, D.J. A genomic perspective on protein families. Science 1997, 278, 631–637. [Google Scholar] [CrossRef] [PubMed] [Green Version]
  21. Tatusov, R.L.; Galperin, M.Y.; Natale, D.A.; Koonin, E.V. The COG database: A tool for genome-scale analysis of protein functions and evolution. Nucleic Acids Res. 2000, 28, 33–36. [Google Scholar] [CrossRef] [Green Version]
  22. Zheng, Y.; Jiao, C.; Sun, H.; Rosli, H.G.; Pombo, M.A.; Zhang, P.; Banf, M.; Dai, X.; Martin, G.B.; Giovannoni, J.J.; et al. iTAK: A program for genome-wide prediction and classification of plant transcription factors, transcriptional regulators, and protein kinases. Mol. Plant 2016, 9, 1667–1670. [Google Scholar] [CrossRef] [PubMed] [Green Version]
  23. Pérez-Rodríguez, P.; Riaño-Pachón, D.M.; Corrêa, L.G.G.; Rensing, S.A.; Kersten, B.; Mueller-Roeber, B. PlnTFDB: Updated content and new features of the plant transcription factor database. Nucleic Acids Res. 2010, 38, D822–D827. [Google Scholar] [CrossRef] [PubMed] [Green Version]
  24. Jin, J.; Zhang, H.; Kong, L.; Gao, G.; Luo, J. PlantTFDB 3.0: A portal for the functional and evolutionary study of plant transcription factors. Nucleic Acids Res. 2014, 42, D1182–D1187. [Google Scholar] [CrossRef] [PubMed] [Green Version]
  25. Livak, K.J.; Schmittgen, T.D. Analysis of relative gene expression data using real-time quantitative PCR and the 2(-Delta Delta C(T)) Method. Methods 2001, 25, 402–408. [Google Scholar] [CrossRef] [PubMed]
  26. Zhang, F.; Zhao, J.; Wan, X.; Luo, X.; Li, W.; Sun, L.; Chen, Q. From green to red: Large-scale transcriptome comparison of a bud sport in poplar (Populus deltoides). Acta Physiol. Plant. 2016, 38, 244. [Google Scholar] [CrossRef]
  27. Yang, S.; Liang, K.; Wang, A.; Zhang, M.; Zhang, L. Physiological Characterization and Transcriptome Analysis of Camellia oleifera Abel. During Leaf Senescence. Forests 2020, 11, 812. [Google Scholar] [CrossRef]
  28. Wang, Z.X.; Yu, Y.F.; Chen, L.; Qin, H.Y.; Liu, Y.X.; Ai, J.; Fan, S.T. Advances in leaf pigment composition, structure and photosynthetic characteristics of colored-leaf plants. Plant Physiol. J. 2016, 52, 1–7. [Google Scholar]
  29. He, X.; Zhao, X.; Gao, L.; Shi, X.; Dai, X.; Liu, Y.; Xia, T.; Wang, Y. Isolation and characterization of key genes that promote favonoid accumulation in purple-leaf tea (Camellia sinensis L.). Sci. Rep. 2018, 8, 130. [Google Scholar] [CrossRef] [Green Version]
  30. An, C.H.; Lee, K.W.; Lee, S.H.; Jeong, Y.J.; Woo, S.G.; Chun, H.; Park, Y.I.; Kwak, S.S.; Kim, C.Y. Heterologous expression of IbMYB1a by diferent promoters exhibits diferent patterns of anthocyanin accumulation in tobacco. Plant Physiol. Bioch. 2015, 89, 1–10. [Google Scholar] [CrossRef]
  31. Cho, J.S.; Nguyen, V.P.; Jeon, H.W.; Kim, M.H.; Eom, S.H.; Lim, Y.J.; Kim, W.C.; Park, E.J.; Choi, Y.I.; Ko, J.H. Overexpression of PtrMYB119, a R2R3-MYB transcription factor from Populus trichocarpa, promotes anthocyanin production in hybrid poplar. Tree Physiol. 2016, 36, 1162–1176. [Google Scholar] [CrossRef] [Green Version]
  32. Hughes, N.M.; Morley, C.B.; Smith, W.K. Coordination of anthocyanin decline and photosynthetic maturation in juvenile leaves of three deciduous tree species. New Phytologist. 2007, 175, 675–685. [Google Scholar] [CrossRef]
  33. Wei, L. Cloning and functional study of quinic acid/shikimate-hydroxycinnamoyl transferase gene in tea plants. Henan Agric. Sci. 2016, 45, 35–39. [Google Scholar]
  34. Huang, X.; Hu, L.; Kong, W.; Yang, C.; Xi, W. Red light-transmittance bagging promotes carotenoid accumulation of grapefruit during ripening. Commun. Biol. 2022, 5, 303. [Google Scholar] [CrossRef] [PubMed]
  35. Castellarin, S.D.; Di Gaspero, G.; Marconi, R.; Nonis, A.; Peterlunger, E.; Paillard, S.; Adam-Blondon, A.F.; Testolin, R. Colour variation in red grapevines (Vitis vinifera L.): Genomic organisation, expression of flavonoid 3′-hydroxylase, flavonoid 3′,5′-hydroxylase genes and related metabolite profiling of red cyanidin-/blue delphinidin-based anthocyanins in berry skin. BMC Genom. 2006, 7, 12. [Google Scholar] [CrossRef] [PubMed]
  36. Liu, Y.; Shi, Z.; Maximova, S.; Payne, M.J.; Guiltinan, M.J. Proanthocyanidin synthesis in Theobroma cacao: Genes encoding anthocyanidin synthase, anthocyanidin reductase, and leucoanthocyanidin reductase. BMC Plant Biol. 2013, 13, 202. [Google Scholar] [CrossRef] [PubMed] [Green Version]
  37. Quattrocchio, F.R.; Baudry, A.N.; Lepiniec, L.O.; Grotewold, E.R. The Regulation of Flavonoid Biosynthesis. In The Science of Flavonoids; Springer: New York, NY, USA, 2006; pp. 97–122. [Google Scholar]
  38. Lou, Q.; Liu, Y.; Qi, Y.; Jiao, S.; Tian, F.; Jiang, L.; Wang, Y. Transcriptome sequencing and metabolite analysis reveals the role of delphinidin metabolism in flower colour in grape hyacinth. J. Exp. Bot. 2014, 65, 3157–3164. [Google Scholar] [CrossRef] [PubMed] [Green Version]
  39. Li, N.; Wu, H.; Ding, Q.; Li, H.; Li, Z.; Ding, J.; Li, Y. The heterologous expression of Arabidopsis PAP2 induces anthocyanin accumulation and inhibits plant growth in tomato. Funct. Integr. Genom. 2018, 18, 341–353. [Google Scholar] [CrossRef] [PubMed]
  40. Wang, H.; Wang, X.; Song, W.; Bao, Y.; Jin, Y.; Jiang, C.; Wang, C.; Li, B.; Zhang, H. PdMYB118, isolated from a red leaf mutant of Populus deltoids, is a new transcription factor regulating anthocyanin biosynthesis in poplar. Plant Cell Rep. 2019, 38, 927–936. [Google Scholar] [CrossRef]
  41. Piao, W.L.; Kim, S.H.; Lee, B.D.; An, G.; Sakuraba, Y.; Paek, N.C. Rice transcription factor OsMYB102 delays leaf senescence by down-regulating abscisic acid accumulation and signaling. J. Exp. Bot. 2019, 70, 2699–2715. [Google Scholar] [CrossRef]
  42. Wang, S.; Zhang, Z.; Li, L.X.; Wang, H.B.; Zhou, H.; Chen, X.S.; Feng, S.Q. Apple MdMYB306-like inhibits anthocyanin synthesis by directly interacting with MdMYB17 and MdbHLH33. Plant J. 2022, 110, 1021–1034. [Google Scholar] [CrossRef]
  43. Zhang, S.; Zhao, Q.; Zeng, D.; Xu, J.; Zhou, H.; Wang, F.; Ma, N.; Li, Y. RhMYB108, an R2R3-MYB transcription factor, is involved in ethylene- and JA-induced petal senescence in rose plants. Hortic Res. 2019, 1, 131. [Google Scholar] [CrossRef] [Green Version]
  44. Sun, C.; Wang, C.; Zhang, W.; Liu, S.; Wang, W.; Yu, X.; Song, T.; Yu, M.; Yu, W.; Qu, S. The R2R3-type MYB transcription factor MdMYB90-like is responsible for the enhanced skin color of an apple bud sport mutant. Hortic Res. 2021, 8, 156. [Google Scholar] [CrossRef]
  45. Koo, Y.; Poethig, R.S. Expression pattern analysis of three R2R3-MYB transcription factors for the production of anthocyanin in different vegetative stages of Arabidopsis leaves. Appl. Biol. Chem. 2021, 64, 5. [Google Scholar] [CrossRef]
  46. Jia, J.; Xing, J.H.; Dong, J.G.; Han, J.M.; Liu, J.S. Functional Analysis of MYB73 of Arabidopsis thaliana Against Bipolaris oryzae. Agric. Sci. China 2011, 10, 721–727. [Google Scholar] [CrossRef]
  47. Ni, J.; Zhao, Y.; Tao, R.; Yin, L.; Gao, L.; Strid, A.; Qian, M.; Li, J.; Li, Y.; Shen, J.; et al. Ethylene mediates the branching of the jasmonate-induced flavonoid biosynthesis pathway by suppressing anthocyanin biosynthesis in red Chinese pear fruits. Plant Biotechnol. J. 2020, 18, 1223–1240. [Google Scholar] [CrossRef] [Green Version]
  48. Fan, D.; Wang, X.; Tang, X.; Ye, X.; Ren, S.; Wang, D.; Luo, K. Histone H3K9 demethylase JMJ25 epigenetically modulates anthocyanin biosynthesis in poplar. Plant J. 2018, 96, 1121–1136. [Google Scholar] [CrossRef]
Figure 1. Leaves’ physiological characteristics. (A) ‘Zhonghong’ poplar leaves; (B) Leaf color difference values of ‘Zhonghong’ poplar leaves; (C) content of photosynthetic pigments in ‘Zhonghong’ poplar leaves; (D) percentage content of each pigment in the leaves.
Agronomy 12 02396 g001
Figure 2. Differential gene expression. (A) Comparison of the genes differentially expressed in leaf maturation stages; (B) number and distribution of the differentially expressed genes; (C) cluster heat map of all differentially expressed genes; (D) Venn diagram of annotated transcripts in multiple samples; (E) K-means cluster plot of all differentially expressed genes.
Agronomy 12 02396 g002
Figure 3. Weighted gene co-expression network analysis (WGCNA) of DEGs identified in ‘Zhonghong’ poplar leaves. (A) Relationships between modules and different samples, including petals. Each row in the table corresponds to a module, and each column corresponds to a sample; (B) gene dendrogram obtained by hierarchical clustering with the module color indicated by the color of the row underneath. A total of 11 distinct modules were identified; (C) Eigengene expression profile for the turquoise module in different tissues. The Y-axis indicates the module eigengene value; the X-axis indicates the samples; (D) Eigengene expression profile for the blue module in different tissues.
Agronomy 12 02396 g003
Figure 4. Heat map of gene expression of anthocyanin synthesis-related enzymes.
Agronomy 12 02396 g004
Figure 5. Correlation network diagram. (A) Flavonoid biosynthesis (ko00941); (B) anthocyanin biosynthesis (ko00942); (C) isoflavone biosynthesis (ko00943); (D) biosynthesis of flavonoids and flavonols (ko00944).
Agronomy 12 02396 g005
Figure 6. Frequency distribution of transcription factors in the transcriptome data.
Agronomy 12 02396 g006
Publisher’s Note: MDPI stays neutral with regard to jurisdictional claims in published maps and institutional affiliations.

