Article

Effect of Short-Term Phosphorus Supply on Rhizosphere Microbial Community of Tea Plants

1
Jiangsu Provincial Key Lab of Solid Organic Waste Utilization, Jiangsu Collaborative Innovation Center of Solid Organic Wastes, Educational Ministry Engineering Center of Resource-saving fertilizers, Nanjing Agricultural University, Nanjing 210095, China
2
Tea Research Institute, Key Laboratory of Tea Biology and Resource Utilization of Tea, the Ministry of Agriculture, Chinese Academy of Agriculture Sciences, Hangzhou 310008, China
*
Authors to whom correspondence should be addressed.
These authors contributed equally to this work.
Agronomy 2022, 12(10), 2405; https://doi.org/10.3390/agronomy12102405
Submission received: 31 August 2022 / Revised: 25 September 2022 / Accepted: 29 September 2022 / Published: 5 October 2022
(This article belongs to the Special Issue Advances in Tea Agronomy: From Yield to Quality)

Abstract

:
Microbes play an important role in rhizosphere phosphorus (P) activation and root P absorption in low P-available soils. However, the responses of the rhizosphere microbial community to P input and its effects on P uptake by tea plants have not been widely reported. In this study, the high-throughput sequencing of the 16S rRNA gene and the ITS2 region was employed to examine the responses of tea rhizosphere microbiomes to different P input rates (low-P, P0: 0 mg·kg−1 P; moderate-P, P1: 87.3 mg·kg−1 P; high-P, P2: 436.5 mg·kg−1 P). The results showed that the P input treatments significantly reduced the soil C: N ratio and C: P ratio compared to the P0 treatment (p < 0.05). Moreover, the P2 treatment significantly increased the soil available P, plant biomass and P content of the tea plant compared to the P0 and P1 treatments (p < 0.05). Both bacterial and fungal communities revealed the highest values of alpha diversity indices in the P1 treatment and the lowest in the P2 treatment. The dominant phyla of the bacterial community were Proteobacteria, Actinobacteria and Acidobacteria, while in the fungal community they were Ascomycota and Mortierellomycota. In addition, P input enriched the relative abundance of Actinobacteria and Proteobacteria but decreased the relative abundance of Acidobacteria. The Mantel correlation analysis showed that the fungal community was influenced by P input, whereas bacterial community was affected by the soil TC and C: N ratio. Furthermore, the P input treatments enhanced the TCA cycle, amino and nucleotide glucose metabolism, starch and sucrose metabolism, and phosphotransferase system expression, which could promote C and N cycling. On the contrary, the P input treatments negatively affected the growth of arbuscular mycorrhizal fungi. The PLS-PM model revealed that the rhizosphere bacterial and fungal communities, respectively, negatively and positively affected the P content by affecting the biomass. Meanwhile, rhizosphere microbial function profiles affected the P content of tea plants directly and positively. In summary, moderate P input favors the rhizosphere microbial diversity and functions in the short-term pot experiment. Therefore, we suggest that moderate P input should be recommended in practical tea production, and a further field test is required.

1. Introduction

Phosphorus (P) has become one of the most restrictive nutrients in terrestrial ecosystems and it involves many physiological and biochemical processes [1] such as cell division, photosynthesis, glycolysis, energy transfer, nutrient transport, expression of genetic material and regulation of metabolic pathways [2]. Thus, sufficient P supply is pivotal for plants to maintain high yields and excellent characteristics of varieties [3]. In addition, microbes also play a vital role in soil P cycling, affecting the soil available P (AP) content and influencing plant growth [4]. Meanwhile, the soil P content, including labile and recalcitrant P, has been reported which can significantly impact soil microbial communities [5,6,7]. Therefore, understanding the effect of P supply on plant growth and microbial communities can provide essential guidance in proper P fertilization in practical agricultural production.
Tea (Camellia sinensis) is an important cash crop harvested for leaves. It prefers growing in acidic soil with an optimal pH range of 4.5–5.5. P has been reported as the critical element that contributes to the tea quality, especially in making Oolong tea [8,9]. During the last decades, about 30% of tea plantations in China had a problem with abusing chemical fertilizer or excessive fertilization [10,11], especially in P fertilization. Previous investigations revealed that over half of tea plantations in Hunan, Fujian and Jiangxi provinces applied excessive P input, and the P input excess reached 50.4% in Zhejiang province [11]. However, many high altitude areas were shown to be significantly P insufficient. In addition, acidic soil is usually characterized by high clay content, Fe-Al oxides and organic matter content. These characteristics will ensure that P is easily deposited into insoluble P by Fe-Al oxides [12,13], resulting in the lack of available P for plants. Although most previous studies have proved that increasing P input could remarkably improve the soil AP pool [14], a recent review has reported that less P was beneficial for optimizing plant growth for specific plant species [15,16]. Therefore, we hypothesize that a higher P input may not result in the highest tea plant P content because of the characteristics of tea plantation soils and the physiological requirements of the tea plant.
Recently, an increasing number of studies have realized that the microbiome, especially the rhizosphere microbiome, plays a pivotal role in nutrient cycling. For example, plant growth promoting rhizobacteria (PGPR) has been broadly reported to be beneficial for plant growth [17]. Mycorrhizal fungi or mycorrhizal symbionts can enhance drought resistance and improve the nutrition absorption of plants [18,19]. Nevertheless, P input has been reported that can significantly alter the soil microbial community by mediating the soil P availability [20]. Several studies have proved that long-term high P input can decrease the total bacterial and fungal diversities [14,21]. Moreover, P input will change the soil stoichiometric ratios (e.g., C:P ratio and N:P ratio), which has been proved to remarkably impact soil microbial communities [22,23]. Thus, we suggest that high P input will change the rhizosphere bacterial and fungal community composition and decrease the total bacterial and fungal diversities, whereas moderate P input could increase the rhizosphere microbial diversity.
Generally, plant biomass and P content may increase after P fertilization due to the increase in soil P availability. However, many studies have proved that microbes play an essential role in soil P cycling and the regulation of P availability in agroecosystems [3,24]. Thus, the contribution of rhizosphere microbiome to plant biomass and P content is still under debate. Given that high P input may adversely impact soil microbial alpha diversity, we hypothesize that moderate P input might maximize the contribution of the tea plant rhizosphere microbiome to biomass and P uptake of the tea plant.
Herein, a short-term pot experiment with three P input levels was set up to test the following hypothesizes: H1, in acidic tea plantation soils, a high P input may not result in the high P concentration of the tea plant; H2, high P input alters the rhizosphere microbiome and decreases the total bacterial and fungal diversities; H3, moderate P input is beneficial to the rhizosphere microbial diversity, and may maximize the contribution of the tea plant rhizosphere microbiome to the tea biomass and tea P content.

2. Material and Methods

2.1. Field Site and Experiment Design

The pot experiment was carried out from March to July 2021 at the Shengzhou Experimental Station of Tea Research Institute (29.74° N, 120.82° E), which is affiliated with the Tea Research Institute, Chinese Academy of Agricultural Sciences. The experimental site was located in a subtropical region with an annual rainfall of 1200 mm and an average annual temperature of 12.6 °C. The soil used in this experiment was developed from parent material of a Quaternary eolian red deposit with the textural classes of 1.49-30.00-68.51% (sand-silt-clay). The pots with plants were placed in a net house equipped with automatic sprinklers and a sun-shading net to maintain soil moisture from 25 to 30 (W%). The three-year-old tea plants C.sinensis cv. Tie-guanyin (TGY) with the same growing status were selected. Before the experiment, the basic soil physicochemical properties were measured and displayed as follows: pH 5.00, available P (AP) 1.57 mg kg−1, available potassium (AK) 103.85 mg kg−1, soil organic matter (SOM) 11.91 g kg−1, and total nitrogen (TN) 0.94 g kg−1.
Three treatments with six replicates were set up in this study, including P0 (without P addition, low-P), P1 (87.3 mg kg−1 P, moderate-P) and P2 (436.5 mg kg−1 P, high-P). The amount of moderate-P corresponded to the recommended amount of P fertilizer application in Zhejiang Province, and the amount for high-P was close to the highest amount of P fertilizer applied by a local farm household. Each pot had 10 kg of dry soils, and all of the treatments received the same amount of N (800 mg kg−1) and K (400 mg kg−1) fertilizer. Urea, calcium superphosphate, and potassium sulfate were applied as synthetic N, P, and K fertilizers. Urea and potassium sulfate were dissolved in water. Calcium superphosphate was fully applied in late March 2021 by mixing with the soils.

2.2. Tea tree and Soil Sampling and Preparation

In July 2021, artificial pruning was carried out. The standard of the cutting part was 2 cm higher than the last pruning layer. The pruning tissues were sampled as the biomass of summer tea, and were taken back to the laboratory for artificial separation of the branches and leaves. Thereafter, the stems and leaves were dried and ground for elemental analysis.
At the same time, soil samples were collected by an auger from four sites in each pot. A total of 20 cm of soil was drilled and mixed as one sample and placed in an ice box until root picking. After root picking the soils were removed with stones, sifted by 2 mm, and dried at room temperature for soil physicochemical analyses. The rhizosphere soil was separated according to the definition of ‘rhizosphere compartment’, which is composed of about 1 mm of soil, tightly attached to the root surface and not easily shaken from the root [25,26]. The roots with the rhizosphere soil were placed in a centrifugal tube. Thereafter, 10 mL of pH7.4 PBS buffer was added in the tube for vortex and the root was separated. The retained rhizosphere suspension was centrifuged at 12,000 r/min for 3 min, and the supernatant was discarded. The precipitate soil was collected as rhizosphere soil and stored in a refrigerator at −80° C for use [25].

2.3. Soil Chemical Properties and Plant Elemental Analyses

Plant samples were ground using a Grinding machine (MM400, Retsch, Duesseldorf, Germany). The P concentration in the stem and leaf was determined by inductively coupled plasma atomic emission spectroscopy (ICP-AES, iCAP 6000 SERIES) after digestion. The total phosphorus (TP) content was the sum of stem and leaves, which was divided by the dry weight of the stem and leaf to obtain the shoot phosphorus concentration [27,28]. The physical and chemical properties of the soil include: soil pH, soil phosphatase (ACP), TN, total carbon (TC), soil AP, TP. Soil AP was extracted by hydrochloric acid-ammonium fluoride and determined by the Mo-Sb colorimetric method [29]. The soil pH was extracted in 1 M KCl, 1:2.5 (w/v) soil solution and measured using a pH meter (Orion 3 Star, Thermo, MA, USA). SOC and TN were measured using a CN elemental analyzer (Vario Max, Elementar, Frankfurt, Germany). TP was determined by ICP-AES (Thermo Jarrell Ash Ltd., Waltham, MA, USA) after microwave digestion. The p-nitrophenyl phosphate disodium method was used for measuring the ACP [27].

2.4. Soil DNA Extraction, Amplification, High Throughput Sequencing and Bioinformatics

Soil DNA was extracted from 0.25 g fresh soil by the DNA Isolation Kit (PowerSoil, MOBIO, Carlsbad, CA, USA) according to the protocol. The quality of extraction was tested by the DNA concentration measurement using a nano spectrophotometer (ND2000, Thermo Scientific, Waltham, MA, USA).
The bacterial 16s rRNA (V4-V5 region) and fungal internal transcribed spacer (ITS2 region) were amplified using the primers 515F/907R [30] and ITS3F/ITS4R [31], respectively. The PCR reaction mixture (25 μL) contained 1 μL of the purified template DNA, 2.5 μL of 10 × PCR Mg2+ free buffer, 2.0 μL of 25 mM dNTPs, 2.5 μL of 2.5 mM Mg2+, 0.5 μL (10 μM) of each primer, and 0.5 μL (1.25 U) of Taq polymerase, and sterilized ultrapure water up to 25 μL. The bacterial V4-V5 region amplification started with an initial denaturation at 94 °C for 5 min, 15 cycles of 94 °C for 60 s, 54 °C for 30 s, 72 °C for 90 s, and a final extension step at 72 °C for 10 min. The fungal ITS2 region amplification started with an initial denaturation at 94 °C for 3 min, 30 cycles at 94°C for 40 s, 50 °C for 60 s, 72 °C for 60 s, and a final extension at 72 °C for 10 min. The PCR was performed by a Thermal Cycler (ABI 2720, Thermo Fisher Scientific, CA, USA). The PCR products were then purified with a Gel Extraction Kit (QIAquick, Qiagen, CA, USA).
The purified PCR products were sequenced using the high throughput sequencing platform (MiSeq PE250, Illumina, CA, USA). Raw sequence data were deposited in the National Center for Biotechnology Information (NCBI) database with the accession number (PRJNA863119).

2.5. Bioinformatics and Statistical Analysis

Bacterial and fungal raw sequences were processed using USEARCH (v 11.0.667). Briefly, paired raw sequences were merged and re-oriented by comparing them to the RDP and UNITE database [32,33], respectively. Then sequences with an expected error > 1 and lengths < 250 bp were discarded. Next, fastx_uniques and Unosie3 commands were implemented to remove redundant sequences and chimeras; representative sequences were obtained in this step. The otutab command was employed to generate the bacterial and fungal ZOTU table. The bacterial and fungal representative sequences were aligned against the RDP and UNITE database, with a cutoff value of 0.97 and 0.80, respectively, by using the sintax command. The bacterial KEGG pathways and fungal functional taxonomy were obtained from the Picrust2 [34] function prediction and the FUNGuild database [35] annotation, respectively.
In order to compare the relative difference between samples, a randomly selected subset of 70,000 sequences and 30,000 sequences per sample were performed for downstream analyses for bacterial and fungal communities. Bacterial and fungal Chao1 and Shannon indices were calculated by using the alpha_div command in USEARCH. The principal coordinates analysis (PCoA) was performed using the Bray–Curtis distance measure to evaluate the overall differences in the microbial community structure under different treatments. The correlations among soil microbial communities, soil microbial function profiles, P application rates and soil physicochemical properties were detected by using the R package “linkET” [36]. The partial least squares path model (PLS-PM) analysis was applied by using the R package “plspm” to investigate the possible causal relationships between P application rates, soil properties, soil stoichiometric ratios, microbial communities, microbial function profiles, tea biomass and tea P content. In the pathway model, the latent variable “SoilPrope” was indirectly responded by measured parameters including TC, TN, TP and AP. The latent variable “SoilStoRa” was indirectly responded by the C:N ratio, C:P ratio and N:P ratio. The latent variables bacterial community and fungal community were indirectly responded by the Chao1 index, Shannon index and data of PCoA axis 1. The latent “Function” was indirectly responded by the data of KEGG pathways PCoA axis 1 and the number of Arbuscular mycorrhizas. The variance in each variable explained by the indicators or predictors is indicated by R values. The path coefficients indicate the direction and strength of the relationships between variables.
The relative abundance of the microbial communities was displayed at the phylum level. The differences in relative abundance at the phylum level were detected by the LSD t-test with a significance of p < 0.05.
The effects of P application rates on the tea biomass, tea P content, soil enzyme activity, and soil chemical properties were tested by the one-way variance analysis (ANOVA). The differences between treatments were compared by the Turkey test at the significance of p < 0.05. The differences in microbial Chao1 and Shannon indices among the treatments were detected by the Kruskal–Wallis rank-sum test at p < 0.05. The permutational multivariate analysis of variance (function “adonis”) was used to test the significance of the P input effect on the bacterial and fungal community composition.
All the analyses in this study were conducted by R software (version 4.1.1).

3. Results

3.1. Soil Properties and ACP Activity Change under Different Rates of P Input

Soil properties and ACP activity were displayed in Table 1. In the present study, soil pH remarkably decreased after the experiment. The P2 (pH 3.23) treatment revealed the lowest soil pH when compared to the P0 (pH 3.31) and P1 treatments (pH 3.32). With the increasing rates of P input, the soil AP content increased significantly with the increase of the P input rate (i.e., P0 < P1 < P2, p < 0.05), whereas the soil TP content displayed a different trend (i.e., P1 < P0 < P2, p < 0.05). However, the soil ACP activity revealed no obvious differences among the treatments. In addition, the soil TC and TN content were relatively stable under different P input rates, while the soil stoichiometric ratio changed under different P input rates. The soil C: N ratio and C:P ratio showed the highest values in the P1 treatment (C: N ratio, 7.21; C:P ratio, 5.04) and was significantly higher than in the P2 treatment (C: N ratio, 6.90; C:P ratio, 4.48) (p < 0.05), but the soil N:P ratio did not reveal significant change under different P input rates.

3.2. Rhizosphere Microbial Community Diversity and Composition under Different Rates of P Input

The rhizosphere bacterial and fungal community diversities displayed a similar response with the increase of P input rates. For both bacterial and fungal diversity indices, the P1 treatment showed the highest Chao1 (bacteria: 3773.3, fungi: 244.8) and Shannon (bacteria: 5.9, fungi: 2.85) indices, whereas P2 revealed the lowest Chao1 (bacteria: 2920, fungi: 167.5) and Shannon indices (bacteria: 3.62, fungi: 1.93) (Figure 1). However, no significant difference was found among the different P input rates. In addition, the PCoA analysis showed that the rhizosphere bacterial community structure was significantly altered by the different P input rates (PERMANOVA test: R2 = 0.16, p < 0.01), and the first two axes explained 30.28% of the bacterial community change (Figure 2a). On the other hand, although the PCoA analysis revealed that the first two axes explained 31.93% of the fungal community change, the rhizosphere fungal communities under different P input rates did not show a significant difference (PERMANOVA test: R2 = 0.13, p > 0.05) (Figure 2c).
The rhizosphere bacterial community composition revealed that Proteobacteria (mean relative abundance, MRA: 46.21%), Actinobacteria (MRA: 23.45%) and Acidobacteria (MRA: 9.03%) were the dominant phyla, and their relative abundance accounted for 78.69% of the whole bacterial community (Figure 2b). Moreover, we found that the relative abundance of Acidobacteria significantly decreased under the P2 (7.32%) treatment compared to the P0 (9.63%) and P1 (10.13%) treatments (p < 0.05) (Figure S1). Whereas, the relative abundance of Actinobacteria increased with the P input rate, i.e., P0 (18.32%) < P1 (22.46%) < P2 (29.57%) (p < 0.05) (Figure S1). The relative abundance of Armatimonadetes and Planctomycetes showed the same change, i.e., the P1 treatment showed the highest values (Figure S1). For the fungal community composition, Ascomycota and Mortierellomycota were the dominant phyla and their MRA accounted for 47.01% and 27.47% of the whole community, respectively (Figure 2d). Additionally, only Mortierellomycota and Glomeromycota showed a significant change under different P input rates (p < 0.05) (Figure S2). The relative abundance of Glomeromycota decreased significantly after the P input, while the relative abundance of Mortierellomycota showed the highest value in the P2 treatment (Figure S2).
In addition, the Mantel correlation test showed that the P input rate significantly affected the rhizosphere fungal community, but soil properties did not reveal any notable correlations with the fungal community (Figure 3). Whereas, the rhizosphere bacterial community was significantly correlated with the soil TC and soil C: N ratio (Figure 3).

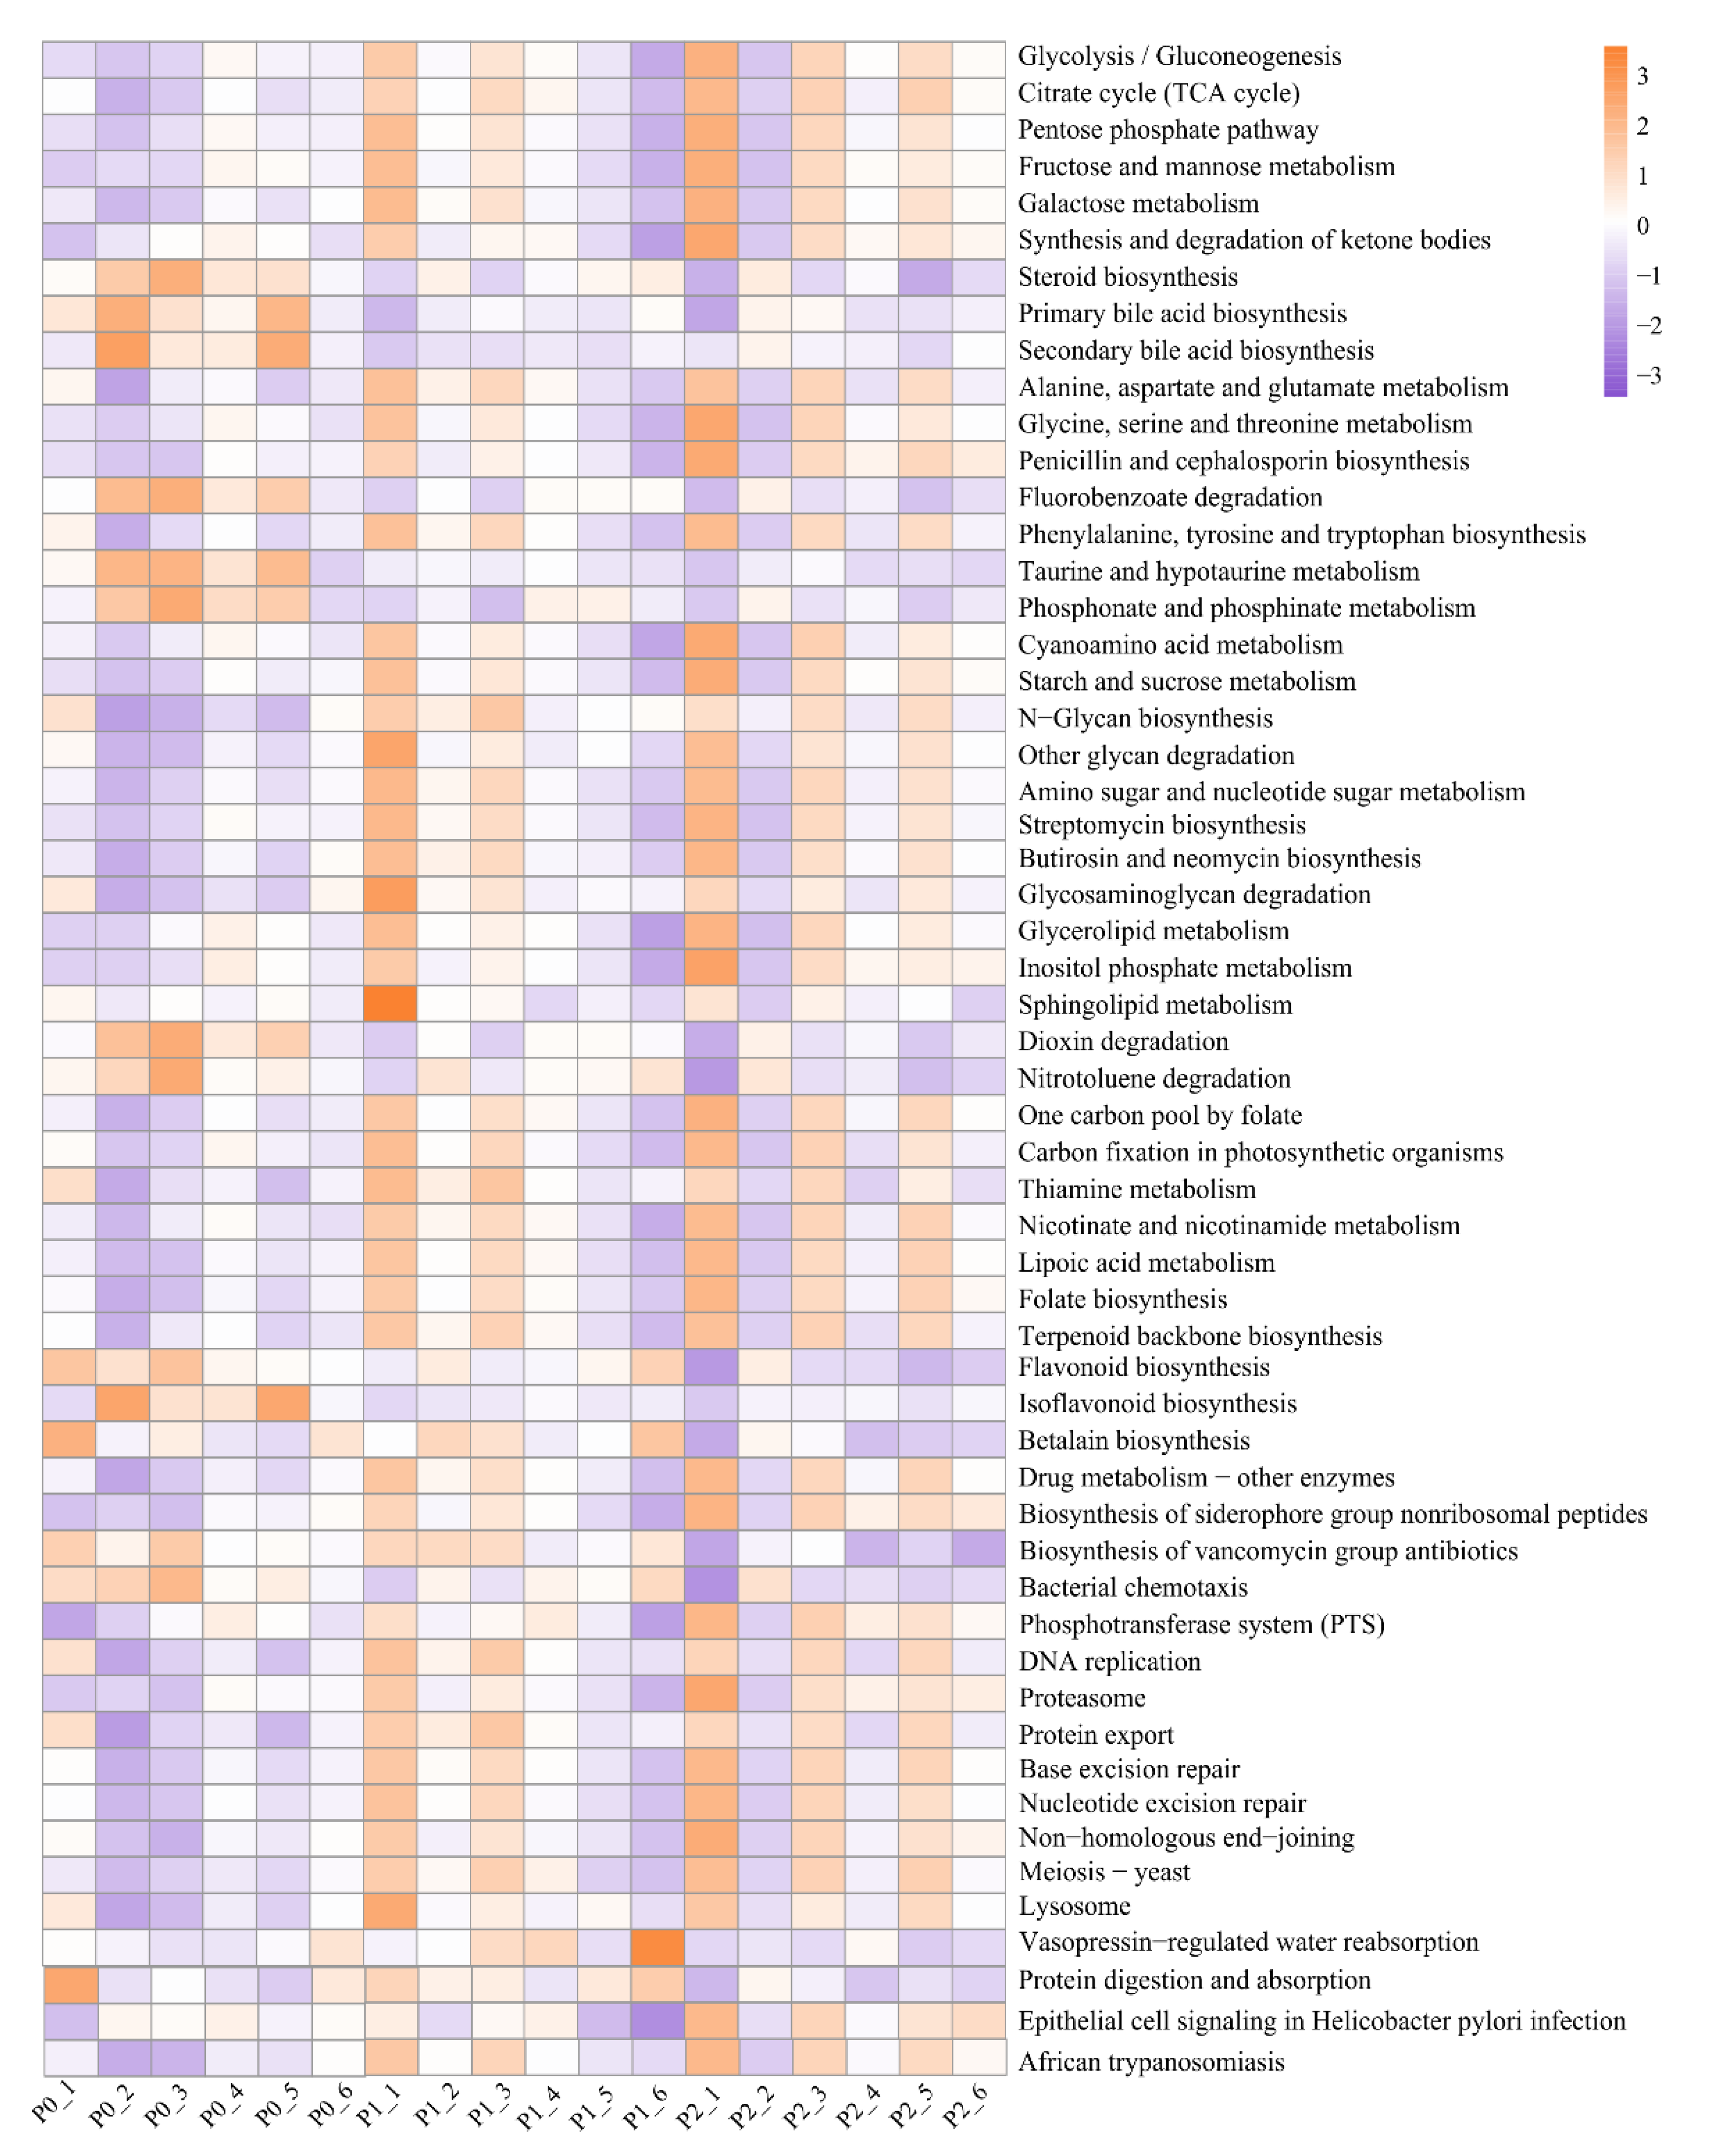
3.3. Rhizosphere Microbial Function Profiles under Different Rates of P Input

In the present study, Picrust2 was used to predict the KEGG pathway of the rhizosphere bacterial community. In total, 180 KEGG pathways were identified and 56 KEGG pathways showed significant differences under different P input rates (Figure 4 and Table S1). After P input, 39 KEGG pathways were significantly enhanced compared to the P0 treatment. The P related pathways, such as the pentose phosphate pathway, inositol phosphate metabolism and phosphotransferase system, were significantly enhanced after P input. In addition, 11 KEGG pathways distinctly diminished after P input, including one P-related pathway, i.e., phosphonate and phosphinate metabolism (Figure 4 and Table S1). The Mantel correlation analysis showed that the TC was significantly correlated with the KEGG pathways (Figure 3).
For the fungal community, FUNGuild showed 18 of 323 ZOTUs were identified as highly probable, including the arbuscular mycorrhizal (AM) species (16 ZOTUs), saprotroph species (1 ZOTU) and plant pathogen/wood saprotroph species (1 ZOTU) (Table S2). Moreover, we found that the number of identified AM species decreased with P input (Figure S3). However, the Mantel correlation test did not find significant correlations between soil properties and FUNGuild results (Figure 3).

3.4. The Response of Tea Plant Biomass and P Content to Different Rates of P Input

The tea plant biomass increased significantly under the P2 treatment compared to P0 and P1 treatments (p < 0.05), while there was no significant difference between P0 and P1 treatments (p > 0.05) (Table 1). Similarly, the P content of the tea plant in the P2 treatment increased by 173.6% and 150.6% when compared to the P0 and P1 treatments, respectively (p < 0.05). However, the P concentration of tea plants in the P1 and P2 treatments increased by 48.4% and 51.6%, respectively (p < 0.05) compared with the P0 treatment (Table 1).
PLS-PM analysis was employed to explore the complex relationships among P input rate, soil properties, soil pH, soil stoichiometric ratios, rhizosphere microbial communities, microbial function profiles, tea biomass and P content (Figure 5a). The path model explained 95% and 74% of the variance in P content and tea biomass (goodness of fit: 0.61), respectively. The model showed that the P input rate can directly influence the tea biomass (path coefficient, pc = 0.53) and P content (pc = 0.17). Moreover, the result also revealed the indirect effect of the P input rate on tea biomass (pc = 0.27) and P content (pc = 0.79) (Figure 5). Fungal community (pc = 0.32) had a direct and positive effect on tea biomass, whereas soil pH (pc = −0.21) and bacterial community (pc = −0.24) exhibited direct negative effects on tea biomass. In addition, soil properties (pc = 0.26), rhizosphere function profiles (pc = 0.29) and tea biomass (pc = 0.65) had a direct and positive effect on P content, while soil pH (pc = −0.13) and soil stoichiometric ratios (pc = −0.16) exhibited direct negative effects (Figure 5).

4. Discussion

4.1. Effects of P Input Rate on Soil Physicochemical Properties, Tea Plant Biomass and P Content

Fertilizer applications have been considered important factors that affect soil physicochemical properties in agroecosystems [37]. P input has been proved to significantly influence soil pH, AP, TP, carbon and nitrogen [38]. A long-term P input field trail revealed that soil pH did not vary intensely in alkaline soils [14]. Inversely, soil pH slightly decreased after P input in acidic soils [39,40]. This result was inconsistent with ours, where high P input (P2 treatment) significantly reduced the soil pH compared to the P0 and P1 treatments (Table 1). It might be explained that high-P input could facilitate tea plant growth and therefore more root exudates were released to soils [41], which could decrease soil pH under the P2 treatment. Meanwhile, soil ACP activity also decreased with the P input rate here, as P input negatively impacted soil ACP activity, and the reduced P fertilization scheme might promote the secretion of ACP by bacteria [42].
Interestingly, although soil AP increased with the P input rate, soil TP did not show a relatively higher value in the P1 treatment (Table 1). This may be attributed to the fact that low P fertilizer cannot supply enough P to maintain tea growth. The decrease of soil AP in the P1 and P2 treatments after the pot experiment verified this, as well. In addition, it is noteworthy that the P2 treatment significantly increased soil C: N ratio and decreased the C: P ratio (Table 1). A former study has found that low C: N ratios could enhance the potential of available N release [43]. Whereas, the lower soil C: P ratio results in a faster turnover of the microbial biomass P, and finally improve the P release capacity [23,44]. Therefore, our study suggested that higher P input may be beneficial for releasing soil available nutrients, such as N and P. However, the P2 treatment showed no difference compared to P1 treatments, which indicated that a higher P input cannot improve the P absorption of the tea plant. This may be attributed to that the relatively higher content of clay, Fe-Al oxides and organic matter in acidic soils, which can decrease the P availability in soils [12,45]. This result also verified our first hypothesis that a higher P input may not result in a higher P concentration of tea plants.

4.2. Effects of P Input Rate on Rhizosphere Microbiome of Tea Plant

Several long-term field trials have proved that soil microbial community diversity responded differently to P input rates [14,46]. Moderate or relatively low P input can significantly increase microbial community diversity [47], while high P input displays reverse the results [48,49]. Our results also revealed similar variation trends, i.e., bacterial and fungal communities showed the highest alpha diversity indices in the P1 treatment, and the lowest alpha diversity indices in the P2 treatment (Figure 2).
In addition, soil bacterial community composition and structure have been verified that they are significantly influenced by soil environmental factors changes (e.g., soil pH, AP, C: N ratio and C: P ratio) caused by long-term fertilization [50,51,52,53]. The soil bacterial community structure also showed significant changes under short-term different P input rates (Figure 2a). The Mantel correlation test showed that the soil TC and C: N ratio were significantly related to the bacterial community structure (Figure 3), which was in line with the previous studies [23,43,44]. Meanwhile, the long-term P input can enrich the relative abundance of Actinobacteria and Proteobacteria, and decrease the relative abundance of Acidobacteria [14,46,52]. This is because the abundance of Acidobacteria is positively correlated with low soil pH, while eutrophic bacteria such as Proteobacteria are associated with soil nutrient status [46]. Similar results were also found in our study, indicating the quick response of the bacterial community composition to soil nutrients change. For the fungal community composition, the relative abundance of Chytridiomycota in particular increased under the P1 treatment. A recent study has proved that Chytridiomycota display variable responses because of diverse metabolic regimes, enabling Chytridiomycota to survive in different environments [54]. The particular increase in Mortierellomycota under the P2 treatment could be attributed to the fact that high P input results in higher plant and root biomass, which maintains nutrition and energy supply through parasitic or symbiotic ways [55,56]. Additionally, rare studies report the rhizosphere fungal community change, while most studies focus on the effect of fertilization on AM fungal communities [57,58,59]. In the present study, we found that the number of identified AM fungal species and the relative abundance of Glomeromycota decreased with the P input rate, indicating that AM fungal diversity was negatively correlated with the P input rate [58].
Nevertheless, the pentose phosphate pathway, inositol phosphate metabolism and phosphotransferase system significantly enhanced after P input, but high P input showed no difference compared to moderate P input (Figure 4 and Table S1). This implies that moderated nutrient input could increase the bacterial community functions. Previous studies have also proved that long-term moderate nutrient inputs can enhance autotrophy [60], and lower P inputs in agricultural systems can achieve higher productivity [61]. The diminishment of phosphonate and phosphinate metabolism after P input in our study also verified this (Figure 4 and Table S1). Furthermore, the decrease of AM fungal species after P input in our study indicated that P fertilizer further decreased the fungal functions in nutrition absorption (Figure S3). The availability of P in soils is the most crucial edaphic factor affecting mycorrhizal symbiosis [62,63]. High P levels could inhibit spore development and AM fungus colonization, i.e., more AM fungi will colonize in low P soil and less in high P soil [58]. However, the increased relative abundance of Mortierellomycota indicated that high P input could enhance plant stress resistance. This is because previous studies have proved that Mortierellomycota can form a parasitic or symbiotic relationship with the host plant, and help the host to overcome environmental stresses caused by high salt concentration [64,65].
In summary, these results verified our hypothesis that higher P input alters the rhizosphere microbiome, especially for the rhizosphere bacterial community, and decreases the rhizosphere microbial diversity indices. Moderate P input favors the rhizosphere microbial diversity and functions.

4.3. Effects of Rhizosphere Microbiome on Tea Biomass and Phosphorus Content

The rhizosphere microbiome has been considered as the second genome of plants, which contributes a lot to plant productivity and quality [66]. For instance, rhizosphere soil microorganisms have positive effects on increasing nutrient availability, secreting plant hormones, and inhibiting pathogenic bacteria and plant metabolism, potentially improving crop yield [67,68]. Our results found that the rhizosphere fungal community had a direct positive effect on tea biomass, while the rhizosphere bacterial community had a direct negative impact (Figure 5). This result is in line with the field trial in bulk soil microbiome [69].
In addition, our results showed that P input rates had a direct positive effect on the rhizosphere microbial function profiles, and the function profiles had a direct positive effect on the P content of the tea plants. A recent study has reported that P input can significantly enhance arginine and proline metabolism and biosynthesis of plant hormones, amino acids, plant secondary metabolites and urea derivative alkaloids [49]. The promoted TCA cycle, amino and nucleotide glucose metabolism, starch and sucrose metabolism, and phosphotransferase system expression in our study also indicated an intense communication between the root and rhizosphere bacteria. This could accelerate the transport of N, lipids, secondary metabolites, exogenous substances and carbohydrates, thus finally contributing to the increase of biomass and P content of the tea plant.

5. Conclusions

The present study demonstrated that high P input increased the tea biomass, but P concentration of the tea plant did not elevate compared to none/moderate P input. In soils, P input resulted in the variation of soil acidification and soil stochiometric ratios, which altered the rhizosphere microbiome and decreased microbial alpha diversity indices. Moreover, the rhizosphere fungal community showed a direct positive effect on the tea biomass, while the rhizosphere bacterial community displayed a converse result. Although P input significantly improved the majority of P-related metabolism pathways, no difference was observed between high P input and moderate P input. Overall, our study proved the hypotheses H1 and H2, and found that moderate P input favors the rhizosphere microbial diversity and functions though high P input achieved the highest tea biomass. However, the pot experiment at times could not reflect the complicated situation in the field. Therefore, further field experiments should be carried out to verify our result, and we suggest that moderate P input might be recommended in the tea production.

Supplementary Materials

The following supporting information can be downloaded at: https://www.mdpi.com/article/10.3390/agronomy12102405/s1, Figure S1: The relative abundance of the first ten rhizosphere bacteria; Figure S2: The relative abundance of the first ten rhizosphere fungi; Figure S3: Effect of phosphorus fertilizer addition rate on AMF. Table S1: Functional gene pathway differences (mean ± standard error); Table S2: Highly probable ZOTUs identified by FUNGuild.

Author Contributions

Conceptualization, J.R. and L.L.; methodology, L.J.; software, L.J. and K.N.; validation, S.G., X.Y. and L.M.; formal analysis, L.J., H.Y. and L.L.; investigation, H.Y. and L.L.; data curation, L.J. and H.Y.; writing—original draft preparation, H.Y. and L.J.; writing—review and editing, S.G., L.L. and L.J.; visualization, L.J.; supervision, S.G. and J.R.; funding acquisition, L.L. All authors have read and agreed to the published version of the manuscript.

Funding

This research was funded by the Science and Technology Talents and Platform Program of Yunnan Province (grant no. 202102AE090038) and Central Public-interest Scientific Institution Basal Research Fund (grant no. Y2022GH09 and 1610212021001).

Institutional Review Board Statement

Not applicable.

Informed Consent Statement

Not applicable.

Data Availability Statement

Raw sequence data of soil microbe is available in the National Center for Biotechnology Information (NCBI) database with the accession number PRJNA863119.

Acknowledgments

We thank Li Fang, Liping Xia and Wenwen Yang for their experimental assistance.

Conflicts of Interest

The authors declare no conflict of interest.

References

  1. Bünemann, E.K.; Oberson, A.; Frossard, E. Phosphorus in Action: Biological Processes in Soil Phosphorus Cycling; Springer: Berlin/Heidelberg, Germany, 2011; p. 483. [Google Scholar]
  2. Malhotra, H.; Vandana; Sharma, S.; Pandey, R. Phosphorus Nutrition: Plant Growth in Response to Deficiency and Excess. In Plant Nutrients and Abiotic Stress Tolerance; Hasanuzzaman, M., Fujita, M., Oku, H., Nahar, K., Hawrylak-Nowak, B., Eds.; Springer: Singapore, 2018; pp. 171–190. [Google Scholar]
  3. Sindhu, S.S.; Phour, M.; Choudhary, S.R.; Chaudhary, D. Phosphorus Cycling: Prospects of Using Rhizosphere Microorganisms for Improving Phosphorus Nutrition of Plants. Geomicrobiol. Biogeochem. 2014, 39, 199–237. [Google Scholar]
  4. Bergkemper, F.; Schöler, A.; Engel, M.; Lang, F.; Krüger, J.; Schloter, M.; Schulz, S. Phosphorus depletion in forest soils shapes bacterial communities towards phosphorus recycling systems. Environ. Microbiol. 2016, 18, 1988–2000. [Google Scholar] [CrossRef] [Green Version]
  5. Beauregard, M.S.; Hamel, C.; Atul, N.; St-Arnaud, M. Long-term phosphorus fertilization impacts soil fungal and bacterial diversity but not AM fungal community in alfalfa. Microb. Ecol. 2010, 59, 379–389. [Google Scholar] [CrossRef] [PubMed]
  6. Gumiere, T.; Rousseau, A.N.; da Costa, D.P.; Cassetari, A.; Cotta, S.R.; Andreote, F.D.; Gumiere, S.J.; Pavinato, P.S. Phosphorus source driving the soil microbial interactions and improving sugarcane development. Sci. Rep. 2019, 9, 4400. [Google Scholar] [CrossRef] [PubMed] [Green Version]
  7. Ran, J.; Liu, X.; Hui, X.; Ma, Q.; Liu, J. Differentiating bacterial community responses to long-term phosphorus fertilization in wheat bulk and rhizosphere soils on the Loess Plateau. Appl. Soil Ecol. 2021, 166, 104090. [Google Scholar] [CrossRef]
  8. Ding, Z.; Jia, S.; Wang, Y.; Xiao, J.; Zhang, Y. Phosphate stresses affect ionome and metabolome in tea plants. Plant Physiol. Biochem. 2017, 120, 30–39. [Google Scholar] [CrossRef]
  9. Lin, Z.-H.; Qi, Y.-P.; Chen, R.-B.; Zhang, F.-Z.; Chen, L.-S. Effects of phosphorus supply on the quality of green tea. Food Chem. 2012, 130, 908–914. [Google Scholar] [CrossRef]
  10. Ni, K.; Liao, W.; Yi, X.; Niu, S.; Ma, L.; Shi, Y.; Zhang, Q.; Liu, M.; Ruan, J. Analysis on current situation and potential of fertilization reduction in Tea garden in China. J. Plant Nutr. Fertil. 2019, 25, 421–432. [Google Scholar]
  11. Ma, L.; Chen, H.; Shan, Y.; Jiang, M.; Zhang, G. Status and suggestion of tea garden fertilization on main green tea producing counties in Zhejiang Province. J. Tea Sci. 2013, 33, 74–84. [Google Scholar]
  12. Wen, Q.; Guo, Q.; Zhu, Y.; Dong, C. Phosphorus adsorption and desorption characteristics and pH value of agglomerates in acidic soils in southern China J. Nat. Sci. Heilongjiang Univ. 2014, 31, 800–805. [Google Scholar]
  13. Prescott, C.E.; Katzensteiner, K.; Weston, C. Soils and restoration of forested landscapes. In Soils and Landscape Restoration; Stanturf, J.A., Callaham, M.A., Eds.; Academic Press: Cambridge, MA, USA, 2021; pp. 299–331. [Google Scholar]
  14. Liu, J.; Ma, Q.; Hui, X.; Ran, J.; Ma, Q.; Wang, X.; Wang, Z. Long-term high-P fertilizer input decreased the total bacterial diversity but not phoD-harboring bacteria in wheat rhizosphere soil with available-P deficiency. Soil Biol. Biochem. 2020, 149, 107918. [Google Scholar] [CrossRef]
  15. Bindraban, P.S.; Dimkpa, C.O.; Pandey, R. Exploring phosphorus fertilizers and fertilization strategies for improved human and environmental health. Biol. Fertil. Soils 2020, 56, 299–317. [Google Scholar] [CrossRef] [Green Version]
  16. D’Haene, K.; Hofman, G. Phosphorus offtake and optimal phosphorus fertilisation rate of some fodder crops and potatoes in temperate regions. Agrokémia Talajt. 2015, 64, 403–420. [Google Scholar] [CrossRef] [Green Version]
  17. Patel, J.S.; Kumar, G.; Bajpai, R.; Teli, B.; Rashid, M.; Sarma, B.K. PGPR formulations and application in the management of pulse crop health. In Biofertilizers; Rakshit, A., Meena, V.S., Parihar, M., Singh, H.B., Singh, A.K., Eds.; Woodhead Publishing: Cambridge, UK, 2021; pp. 239–251. [Google Scholar]
  18. Huang, D.; Ma, M.; Wang, Q.; Zhang, M.; Jing, G.; Li, C.; Ma, F. Arbuscular mycorrhizal fungi enhanced drought resistance in apple by regulating genes in the MAPK pathway. Plant Physiol. Biochem. 2020, 149, 245–255. [Google Scholar] [CrossRef] [PubMed]
  19. Bucking, H.; Liepold, E.; Ambilwade, P. The Role of the Mycorrhizal Symbiosis in Nutrient Uptake of Plants and the Regulatory Mechanisms Underlying These Transport Processes. In Plant Science; Dhal, N.K., Sahu, S.C., Eds.; IntechOpen: London, UK, 2012; Chanpter 4. [Google Scholar]
  20. Ling, N.; Chen, D.; Guo, H.; Wei, J.; Bai, Y.; Shen, Q.; Hu, S. Differential responses of soil bacterial communities to long-term N and P inputs in a semi-arid steppe. Geoderma 2017, 292, 25–33. [Google Scholar] [CrossRef]
  21. Zhou, J.; Jiang, X.; Zhou, B.; Zhao, B.; Ma, M.; Guan, D.; Li, J.; Chen, S.; Cao, F.; Shen, D.; et al. Thirty four years of nitrogen fertilization decreases fungal diversity and alters fungal community composition in black soil in northeast China. Soil Biol. Biochem. 2016, 95, 135–143. [Google Scholar] [CrossRef]
  22. Luo, G.; Xue, C.; Jiang, Q.; Xiao, Y.; Zhang, F.; Guo, S.; Shen, Q.; Ling, N. Soil Carbon, Nitrogen, and Phosphorus Cycling Microbial Populations and Their Resistance to Global Change Depend on Soil C:N:P Stoichiometry. mSystems 2020, 5, e00162-20. [Google Scholar] [CrossRef]
  23. Peng, Y.; Duan, Y.; Huo, W.; Zhang, Z.; Huang, D.; Xu, M.; Wang, X.; Yang, X.; Wang, B.; Kuzyakov, Y.; et al. C:P stoichiometric imbalance between soil and microorganisms drives microbial phosphorus turnover in the rhizosphere. Biol. Fertil. Soils 2022, 58, 421–433. [Google Scholar] [CrossRef]
  24. Dai, Z.; Liu, G.; Chen, H.; Chen, C.; Wang, J.; Ai, S.; Wei, D.; Li, D.; Ma, B.; Tang, C.; et al. Long-term nutrient inputs shift soil microbial functional profiles of phosphorus cycling in diverse agroecosystems. ISME J. 2020, 14, 757–770. [Google Scholar] [CrossRef] [Green Version]
  25. Lakshmanan, V.; Ray, P.; Craven, K.D. Rhizosphere Sampling Protocols for Microbiome (16S/18S/ITS rRNA) Library Preparation and Enrichment for the Isolation of Drought Tolerance-Promoting Microbes. In Plant Stress Tolerance: Methods and Protocols; Sunkar, R., Ed.; Springer: New York, NY, USA, 2017; pp. 349–362. [Google Scholar]
  26. Edwards, J.; Johnson, C.; Santos-Medellín, C.; Lurie, E.; Podishetty, N.K.; Bhatnagar, S.; Eisen, J.A.; Sundaresan, V. Structure, variation, and assembly of the root-associated microbiomes of rice. Proc. Natl. Acad. Sci. USA 2015, 112, E911–E920. [Google Scholar] [CrossRef] [Green Version]
  27. Li, Y.; Geng, Y.; Zhou, H.; Yang, Y. Comparison of soil acid phosphatase activity determined by different methods. Chin. J. Eco-Agric. 2016, 24, 98–104. [Google Scholar]
  28. Hamalovâ, M.; Hodslavská, J.; Janos, P.; Kanický, V. Determination of Phosphorus, Potassium, and Magnesium in Fertilizers by Inductively Coupled Plasma–Atomic Emission Spectroscopy and Comparison with Other Techniques. J. AOAC Int. 2020, 80, 1151–1155. [Google Scholar] [CrossRef] [Green Version]
  29. Lu, R. Methods for Soil Agrochemical Analysis; China Agricultural Science and Technology Press: Beijing, China, 2000. [Google Scholar]
  30. Ji, L.; Wu, Z.; You, Z.; Yi, X.; Ni, K.; Guo, S.; Ruan, J. Effects of organic substitution for synthetic N fertilizer on soil bacterial diversity and community composition: A 10-year field trial in a tea plantation. Agric. Ecosyst. Environ. 2018, 268, 124–132. [Google Scholar] [CrossRef]
  31. Ji, L.; Ni, K.; Wu, Z.; Zhang, J.; Yi, X.; Yang, X.; Ling, N.; You, Z.; Guo, S.; Ruan, J. Effect of organic substitution rates on soil quality and fungal community composition in a tea plantation with long-term fertilization. Biol. Fertil. Soils 2020, 56, 633–646. [Google Scholar] [CrossRef]
  32. Cole, J.R.; Wang, Q.; Fish, J.A.; Chai, B.; McGarrell, D.M.; Sun, Y.; Brown, C.T.; Porras-Alfaro, A.; Kuske, C.R.; Tiedje, J.M. Ribosomal Database Project: Data and tools for high throughput rRNA analysis. Nucleic Acids Res. 2014, 42, D633–D642. [Google Scholar] [CrossRef] [PubMed]
  33. Nilsson, R.H.; Larsson, K.H.; Taylor, A.F.S.; Bengtsson-Palme, J.; Jeppesen, T.S.; Schigel, D.; Kennedy, P.; Picard, K.; Glockner, F.O.; Tedersoo, L.; et al. The UNITE database for molecular identification of fungi: Handling dark taxa and parallel taxonomic classifications. Nucleic Acids Res. 2019, 47, D259–D264. [Google Scholar] [CrossRef]
  34. Caicedo, H.H.; Hashimoto, D.A.; Caicedo, J.C.; Pentland, A.; Pisano, G.P. Overcoming barriers to early disease intervention. Nat. Biotechnol. 2020, 38, 669–673. [Google Scholar] [CrossRef] [PubMed]
  35. Nguyen, N.H.; Song, Z.; Bates, S.T.; Branco, S.; Tedersoo, L.; Menke, J.; Schilling, J.S.; Kennedy, P.G. FUNGuild: An open annotation tool for parsing fungal community datasets by ecological guild. Fungal Ecol. 2016, 20, 241–248. [Google Scholar] [CrossRef]
  36. Huang, H. linkET: Everything is Linkable, R Package Version 0.0.3. Available online: http://github.com/Hy4m/linkET (accessed on 28 September 2022).
  37. Zhang, W.; Tang, X.; Feng, X.; Wang, E.; Li, H.; Shen, J.; Zhang, F. Management Strategies to Optimize Soil Phosphorus Utilization and Alleviate Environmental Risk in China. J. Environ. Qual. 2019, 48, 1167–1175. [Google Scholar] [CrossRef]
  38. Hui-min, G.; Bo-lang, C.; Qing-hui, W. Effects of phosphorus application on soil phosphorus availability and phosphorus fertilizer utilization rate in different cotton fields. Soil Fertil. China 2019, 3, 100–108. [Google Scholar]
  39. Ge, S.; Zhu, Z.; Jiang, Y. Long-term impact of fertilization on soil pH and fertility in an apple production system. J. Soil Sci. Plant Nutr. 2018, 18, 282–293. [Google Scholar] [CrossRef] [Green Version]
  40. Wang, Y.; Zhao, X.; Guo, Z.; Jia, Z.; Wang, S.; Ding, K. Response of soil microbes to a reduction in phosphorus fertilizer in rice-wheat rotation paddy soils with varying soil P levels. Soil Tillage Res. 2018, 181, 127–135. [Google Scholar] [CrossRef]
  41. Zhao, M.; Zhao, J.; Yuan, J.; Hale, L.; Wen, T.; Huang, Q.; Vivanco, J.M.; Zhou, J.; Kowalchuk, G.A.; Shen, Q. Root exudates drive soil-microbe-nutrient feedbacks in response to plant growth. Plant Cell Environ. 2021, 44, 613–628. [Google Scholar] [CrossRef] [PubMed]
  42. Yu, X.-J.; Chen, Q.; Shi, W.-C.; Gao, Z.; Sun, X.; Dong, J.-J.; Li, J.; Wang, H.-T.; Gao, J.-G.; Liu, Z.-G.; et al. Interactions between phosphorus availability and microbes in a wheat–maize double cropping system: A reduced fertilization scheme. J. Integr. Agric. 2022, 21, 840–854. [Google Scholar] [CrossRef]
  43. Bui, E.N.; Henderson, B.L. C:N:P stoichiometry in Australian soils with respect to vegetation and environmental factors. Plant Soil 2013, 373, 553–568. [Google Scholar] [CrossRef]
  44. Song, Y.; Ai, Z.; Qiao, L.; Zhai, J.; Li, Y.; Li, Y. Effects of Fertilization on Ecological Stoichiometric Ratio Soil Carbon, Nitrogen and Nitrogen in Farmland of the Loess Plateau. Res. Soil Water Conserv. 2019, 26, 38–45, 52. [Google Scholar]
  45. Yang, F.; He, Y.; Li, C.; Wang, Y.; Lin, T. Effect fertilization on phosphorus fixation in upland red soil and its affecting factors. Acta Pedol. Sin. 2006, 43, 793–799. [Google Scholar]
  46. Tan, H.; Barret, M.; Mooij, M.J.; Rice, O.; Morrissey, J.P.; Dobson, A.; Griffiths, B.; O’Gara, F. Long-term phosphorus fertilisation increased the diversity of the total bacterial community and the phoD phosphorus mineraliser group in pasture soils. Biol. Fertil. Soils 2012, 49, 661–672. [Google Scholar] [CrossRef]
  47. Wakelin, S.A.; Condron, L.M.; Gerard, E.; Dignam, B.E.A.; Black, A.; O’Callaghan, M. Long-term P fertilisation of pasture soil did not increase soil organic matter stocks but increased microbial biomass and activity. Biol. Fertil. Soils 2017, 53, 511–521. [Google Scholar] [CrossRef]
  48. Kaminsky, L.M.; Thompson, G.L.; Trexler, R.V.; Bell, T.H.; Kao-Kniffin, J. Medicago sativa has Reduced Biomass and Nodulation When Grown with Soil Microbiomes Conditioned to High Phosphorus Inputs. Phytobiomes J. 2018, 2, 237–248. [Google Scholar] [CrossRef] [Green Version]
  49. Cheng, H.; Yuan, M.; Tang, L.; Shen, Y.; Yu, Q.; Li, S. Integrated microbiology and metabolomics analysis reveal responses of soil microorganisms and metabolic functions to phosphorus fertilizer on semiarid farm. Sci. Total Environ. 2022, 817, 152878. [Google Scholar] [CrossRef] [PubMed]
  50. Siciliano, S.D.; Palmer, A.S.; Winsley, T.; Lamb, E.; Bissett, A.; Brown, M.V.; van Dorst, J.; Ji, M.; Ferrari, B.C.; Grogan, P.; et al. Soil fertility is associated with fungal and bacterial richness, whereas pH is associated with community composition in polar soil microbial communities. Soil Biol. Biochem. 2014, 78, 10–20. [Google Scholar] [CrossRef]
  51. Zhang, X.; Xu, S.; Li, C.; Zhao, L.; Feng, H.; Yue, G.; Ren, Z.; Cheng, G. The soil carbon/nitrogen ratio and moisture affect microbial community structures in alkaline permafrost-affected soils with different vegetation types on the Tibetan plateau. Res. Microbiol. 2014, 165, 128–139. [Google Scholar] [CrossRef] [PubMed]
  52. Samaddar, S.; Chatterjee, P.; Truu, J.; Anandham, R.; Kim, S.; Sa, T. Long-term phosphorus limitation changes the bacterial community structure and functioning in paddy soils. Appl. Soil Ecol. 2019, 134, 111–115. [Google Scholar] [CrossRef]
  53. Li, P.; Shen, C.; Jiang, L.; Feng, Z.; Fang, J. Difference in soil bacterial community composition depends on forest type rather than nitrogen and phosphorus additions in tropical montane rainforests. Biol. Fertil. Soils 2019, 55, 313–323. [Google Scholar] [CrossRef]
  54. Hanrahan-Tan, D.G.; Henderson, L.; Kertesz, M.A.; Lilje, O. The Effects of Nitrogen and Phosphorus on Colony Growth and Zoospore Characteristics of Soil Chytridiomycota. J. Fungi 2022, 8, 341. [Google Scholar] [CrossRef]
  55. Bonfante, P.; Venice, F. Mucoromycota: Going to the roots of plant-interacting fungi. Fungal Biol. Rev. 2020, 34, 100–113. [Google Scholar] [CrossRef]
  56. Li, F.; Chen, L.; Redmile-Gordon, M.; Zhang, J.; Zhang, C.; Ning, Q.; Li, W. Mortierella elongata’s roles in organic agriculture and crop growth promotion in a mineral soil. Land Degrad. Dev. 2018, 29, 1642–1651. [Google Scholar] [CrossRef]
  57. Qin, H.; Lu, K.; Strong, P.J.; Xu, Q.; Wu, Q.; Xu, Z.; Xu, J.; Wang, H. Long-term fertilizer application effects on the soil, root arbuscular mycorrhizal fungi and community composition in rotation agriculture. Appl. Soil Ecol. 2015, 89, 35–43. [Google Scholar] [CrossRef]
  58. Urcoviche, R.C.; Gazim, Z.C.; Dragunski, D.C.; Barcellos, F.G.; Alberton, O. Plant growth and essential oil content of Mentha crispa inoculated with arbuscular mycorrhizal fungi under different levels of phosphorus. Ind. Crops Prod. 2015, 67, 103–107. [Google Scholar] [CrossRef]
  59. Wang, F.Y.; Hu, J.L.; Lin, X.G.; Qin, S.W.; Wang, J.H. Arbuscular mycorrhizal fungal community structure and diversity in response to long-term fertilization: A field case from China. World J. Microbiol. Biotechnol. 2011, 27, 67–74. [Google Scholar] [CrossRef]
  60. Sabater, S.; Artigas, J.; Gaudes, A.; MuÑOz, I.; Urrea, G.; RomanÍ, A.M. Long-term moderate nutrient inputs enhance autotrophy in a forested Mediterranean stream. Freshw. Biol. 2011, 56, 1266–1280. [Google Scholar] [CrossRef]
  61. Richardson, A.; Lynch, J.; Ryan, P.; Delhaize, E.; Smith, F.; Smith, S.; Harvey, P.; Ryan, M.; Veneklaas, E.; Lambers, H.; et al. Plant and microbial strategies to improve phosphorus efficiency of agriculture. Plant Soil 2011, 349, 121–156. [Google Scholar] [CrossRef]
  62. Jin, X.; Zeng, X.-Y.; Qi, C.-G.; Yin, L.-Y.; Deng, Y. Influences of phosphorus application level on maize arbuscular mycorrhizal colonization and hyphal acquisition to heterogeneous phosphorus supply. J. Plant Nutr. Fertil. 2018, 24, 163–169. [Google Scholar]
  63. Smith, S.E.; Read, D.J. Mycorrhizal Symbiosis, 3rd ed.; Academic Press: New York, NY, USA, 2008. [Google Scholar]
  64. Zhang, H.; Wu, X.; Li, G.; Qin, P. Interactions between arbuscular mycorrhizal fungi and phosphate-solubilizing fungus (Mortierella sp.) and their effects on Kostelelzkya virginica growth and enzyme activities of rhizosphere and bulk soils at different salinities. Biol. Fertil. Soils 2011, 47, 543–554. [Google Scholar] [CrossRef] [Green Version]
  65. Ozimek, E.; Hanaka, A. Mortierella Species as the Plant Growth-Promoting Fungi Present in the Agricultural Soils. Agriculture 2020, 11, 7. [Google Scholar] [CrossRef]
  66. Berendsen, R.L.; Pieterse, C.M.J.; Bakker, P.A.H.M. The rhizosphere microbiome and plant health. Trends Plant Sci. 2012, 17, 478–486. [Google Scholar] [CrossRef] [PubMed]
  67. Turner, T.R.; James, E.K.; Poole, P.S. The plant microbiome. Genome Biol. 2013, 14, 209. [Google Scholar] [CrossRef] [Green Version]
  68. Zhou, D.; Huang, X.-F.; Chaparro, J.M.; Badri, D.V.; Manter, D.K.; Vivanco, J.M.; Guo, J. Root and bacterial secretions regulate the interaction between plants and PGPR leading to distinct plant growth promotion effects. Plant Soil 2015, 401, 259–272. [Google Scholar] [CrossRef]
  69. Yi, X.; Ji, L.; Hu, Z.; Yang, X.; Li, H.; Jiang, Y.; He, T.; Yang, Y.; Ni, K.; Ruan, J. Organic amendments improved soil quality and reduced ecological risks of heavy metals in a long-term tea plantation field trial on an Alfisol. Sci Total Environ. 2022, 838, 156017. [Google Scholar] [CrossRef]
Figure 1. Rhizosphere microbial alpha diversity changes under different treatments. (a) bacterial Chao1 index, (b) bacterial Shannon index, (c) fungal Chao1 index, and (d) fungal Shannon index. Significant differences of soil microbial alpha diversity were tested by the Kruskal–Wallis test at p < 0.05.
Agronomy 12 02405 g001
Figure 2. Rhizosphere microbial community structure changes under different treatments: (a) bacterial PCoA plot, (b) the relative abundance of bacteria at the level of top ten phyla, (c) fungal PCoA plot, and (d) the relative abundance of fungi at the level of top eight phyla. Replicates in each treatment were six.
Agronomy 12 02405 g002
Figure 3. Correlation analysis of various environmental factors with soil microbial structure and function. Prates indicates the Rate of Phosphate fertilizer application and Acid.Pase indicates Soil Acid Phosphatase (ACP). Bacterial Community and Fungal Community were calculated by the data of PCoA axis1. In the Mantel test, red represents p < 0.01, green means 0.01 < p < 0.05, and coarseness represents the size of correlation coefficient. Pearson correlation coefficients were shown in different colors.
Agronomy 12 02405 g003
Figure 4. Heat map of bacteria KEGG pathways with significant differences under P input rates (p < 0.05).
Agronomy 12 02405 g004
Figure 5. The relationships between rate of P fertilizer application (Prate), soil properties (SoilPrope), soil pH, soil stoichiometric ratio (SoilStora), soil bacterial and fungal community (data of PCoA axis1), function (PCoA axis 1 of KEGG pathways and number of arbuscular mycorrhizas), plant biomass and P content (a). Path model outputs: the numbers on arrows represented standardized path coefficients. The arrow width indicated the value of each path coefficient; the red and blue lines indicated positive and negative effects, respectively. Standardized path coefficients on biomass and P concent (b). * represents p < 0.05, ** represents p < 0.01 and *** represents p < 0.001.
Agronomy 12 02405 g005
Table 1. Soil environmental factors and plant traits among different treatments (mean ± standard error).
FactorsP0P1P2
ACP (mg g−1 h−1 dry soil)0.94 ± 0.06 a0.76 ± 0.04 a0.84 ± 0.07 a
AP (mg kg−1)0.77 ± 0.08 b0.94 ± 0.1 ab1.57 ± 0.36 a
C:N Ratio7.20 ± 0.13 a7.21 ± 0.05 a6.90 ± 0.07 b
C:P Ratio4.68 ± 0.13 ab5.04 ± 0.14 a4.48 ± 0.25 b
N:P Ratio0.65 ± 0.01 a0.70 ± 0.02 a0.65 ± 0.03 a
pH3.31 ± 0.02 a3.32 ± 0.02 a3.23 ± 0.01 b
TC (g kg−1)6.82 ± 0.27 a6.92 ± 0.16 a6.79 ± 0.18 a
TN (g kg−1)0.95 ± 0.02 a0.96 ± 0.02 a0.98 ± 0.02 a
TP (g kg−1)1.46 ± 0.02 ab1.38 ± 0.01 b1.53 ± 0.06 a
Biomass (g pot−1)20.64 ± 3.54 b15.58 ± 0.66 b38.52 ± 2.26 a
P concentration (mg g−1 DW)1.26 ± 0.17 b1.87 ± 0.11 a1.91 ± 0.15 a
P content (mg pot−1)26.56 ± 6.84 b29.00 ± 2.02 b72.66 ± 5.35 a
Different lowercase letters in rows indicated significant differences at p < 0.05.
Publisher’s Note: MDPI stays neutral with regard to jurisdictional claims in published maps and institutional affiliations.

